Mount Oliver borough, PA Map & Demographics
Mount Oliver borough Overview
$21,794
PER CAPITA INCOME
$52,125
AVG FAMILY INCOME
$35,640
AVG HOUSEHOLD INCOME
37.4%
WAGE / INCOME GAP [ % ]
62.6¢/ $1
WAGE / INCOME GAP [ $ ]
0.45
INEQUALITY / GINI INDEX
3,357
TOTAL POPULATION
1,671
MALE POPULATION
1,686
FEMALE POPULATION
99.11
MALES / 100 FEMALES
100.90
FEMALES / 100 MALES
36.5
MEDIAN AGE
3.6
AVG FAMILY SIZE
2.3
AVG HOUSEHOLD SIZE
1,560
LABOR FORCE [ PEOPLE ]
59.4%
PERCENT IN LABOR FORCE
10.1%
UNEMPLOYMENT RATE
Income in Mount Oliver borough
Income Overview in Mount Oliver borough
Per Capita Income in Mount Oliver borough is $21,794, while median incomes of families and households are $52,125 and $35,640 respectively.
| Characteristic | Number | Measure |
| Per Capita Income | 3,357 | $21,794 |
| Median Family Income | 619 | $52,125 |
| Mean Family Income | 619 | $58,381 |
| Median Household Income | 1,459 | $35,640 |
| Mean Household Income | 1,459 | $48,208 |
| Income Deficit | 619 | $0 |
| Wage / Income Gap (%) | 3,357 | 37.40% |
| Wage / Income Gap ($) | 3,357 | 62.60¢ per $1 |
| Gini / Inequality Index | 3,357 | 0.45 |
Earnings by Sex in Mount Oliver borough
Average Earnings in Mount Oliver borough are $25,250, $37,456 for men and $23,447 for women, a difference of 37.4%.
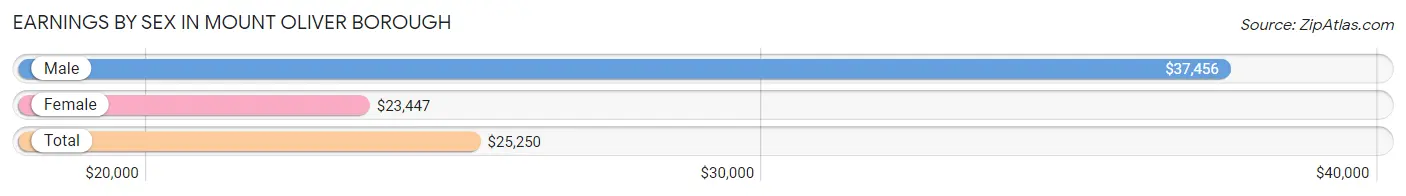
| Sex | Number | Average Earnings |
| Male | 678 (46.3%) | $37,456 |
| Female | 787 (53.7%) | $23,447 |
| Total | 1,465 (100.0%) | $25,250 |
Earnings by Sex by Income Bracket in Mount Oliver borough
The most common earnings brackets in Mount Oliver borough are $55,000 to $64,999 for men (102 | 15.0%) and $22,500 to $24,999 for women (305 | 38.8%).
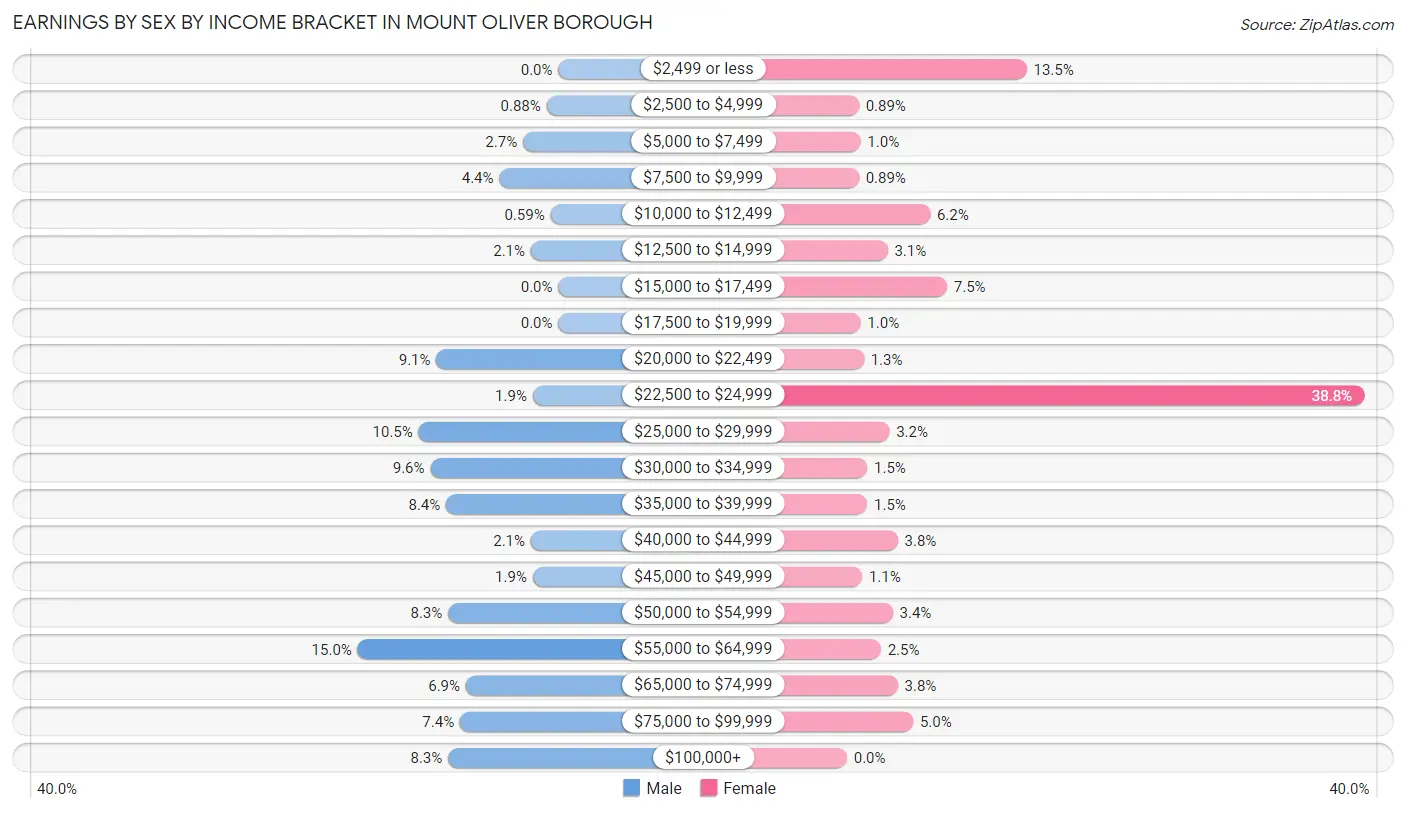
| Income | Male | Female |
| $2,499 or less | 0 (0.0%) | 106 (13.5%) |
| $2,500 to $4,999 | 6 (0.9%) | 7 (0.9%) |
| $5,000 to $7,499 | 18 (2.6%) | 8 (1.0%) |
| $7,500 to $9,999 | 30 (4.4%) | 7 (0.9%) |
| $10,000 to $12,499 | 4 (0.6%) | 49 (6.2%) |
| $12,500 to $14,999 | 14 (2.1%) | 24 (3.0%) |
| $15,000 to $17,499 | 0 (0.0%) | 59 (7.5%) |
| $17,500 to $19,999 | 0 (0.0%) | 8 (1.0%) |
| $20,000 to $22,499 | 62 (9.1%) | 10 (1.3%) |
| $22,500 to $24,999 | 13 (1.9%) | 305 (38.8%) |
| $25,000 to $29,999 | 71 (10.5%) | 25 (3.2%) |
| $30,000 to $34,999 | 65 (9.6%) | 12 (1.5%) |
| $35,000 to $39,999 | 57 (8.4%) | 12 (1.5%) |
| $40,000 to $44,999 | 14 (2.1%) | 30 (3.8%) |
| $45,000 to $49,999 | 13 (1.9%) | 9 (1.1%) |
| $50,000 to $54,999 | 56 (8.3%) | 27 (3.4%) |
| $55,000 to $64,999 | 102 (15.0%) | 20 (2.5%) |
| $65,000 to $74,999 | 47 (6.9%) | 30 (3.8%) |
| $75,000 to $99,999 | 50 (7.4%) | 39 (5.0%) |
| $100,000+ | 56 (8.3%) | 0 (0.0%) |
| Total | 678 (100.0%) | 787 (100.0%) |
Earnings by Sex by Educational Attainment in Mount Oliver borough
Average earnings in Mount Oliver borough are $48,846 for men and $23,586 for women, a difference of 51.7%. Men with an educational attainment of graduate degree enjoy the highest average annual earnings of $67,955, while those with high school diploma education earn the least with $27,100. Women with an educational attainment of bachelor's degree earn the most with the average annual earnings of $82,984, while those with college or associate's degree education have the smallest earnings of $23,068.
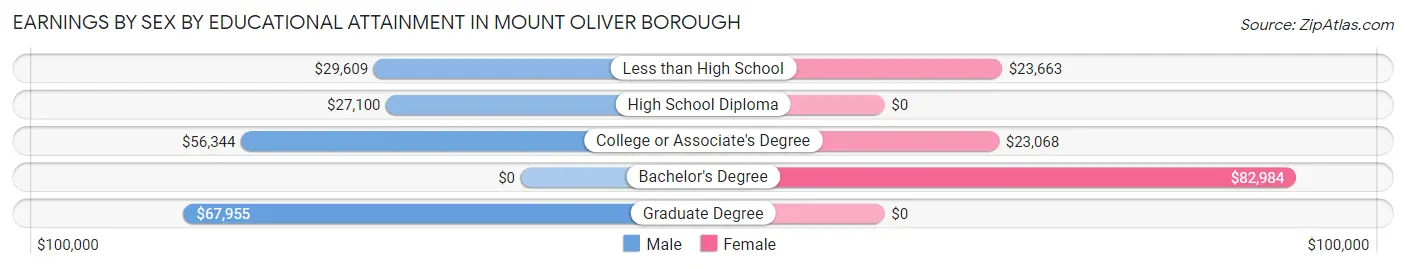
| Educational Attainment | Male Income | Female Income |
| Less than High School | $29,609 | $23,663 |
| High School Diploma | $27,100 | $0 |
| College or Associate's Degree | $56,344 | $23,068 |
| Bachelor's Degree | - | - |
| Graduate Degree | $67,955 | $0 |
| Total | $48,846 | $23,586 |
Family Income in Mount Oliver borough
Family Income Brackets in Mount Oliver borough
According to the Mount Oliver borough family income data, there are 165 families falling into the $50,000 to $74,999 income range, which is the most common income bracket and makes up 26.7% of all families.
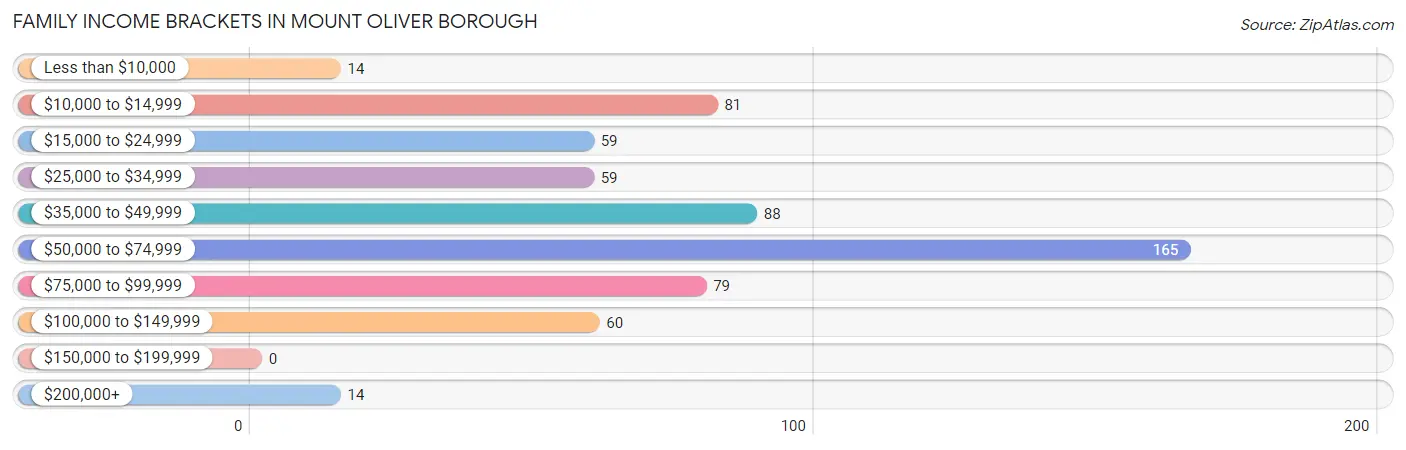
| Income Bracket | # Families | % Families |
| Less than $10,000 | 14 | 2.3% |
| $10,000 to $14,999 | 81 | 13.1% |
| $15,000 to $24,999 | 59 | 9.5% |
| $25,000 to $34,999 | 59 | 9.5% |
| $35,000 to $49,999 | 88 | 14.2% |
| $50,000 to $74,999 | 165 | 26.7% |
| $75,000 to $99,999 | 79 | 12.8% |
| $100,000 to $149,999 | 60 | 9.7% |
| $150,000 to $199,999 | 0 | 0.0% |
| $200,000+ | 14 | 2.3% |
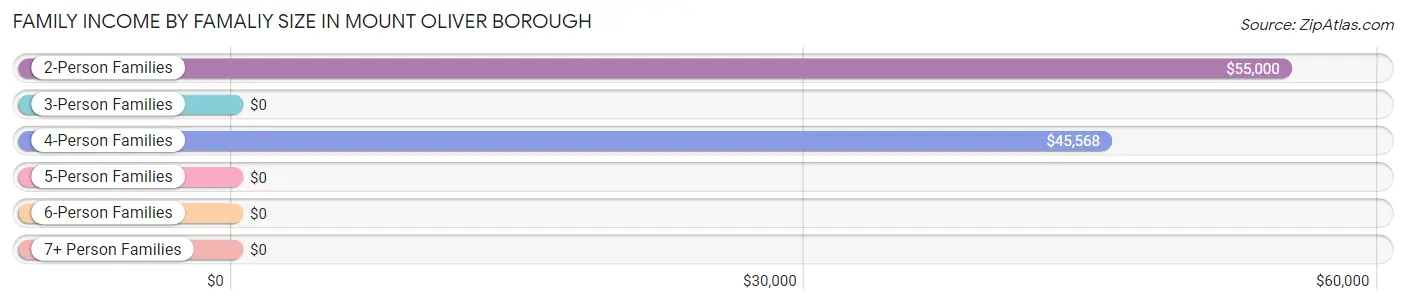
Family Income by Famaliy Size in Mount Oliver borough
2-person families (292 | 47.2%) account for the highest median family income in Mount Oliver borough with $55,000 per family, while 2-person families (292 | 47.2%) have the highest median income of $27,500 per family member.
| Income Bracket | # Families | Median Income |
| 2-Person Families | 292 (47.2%) | $55,000 |
| 3-Person Families | 98 (15.8%) | $0 |
| 4-Person Families | 101 (16.3%) | $45,568 |
| 5-Person Families | 63 (10.2%) | $0 |
| 6-Person Families | 65 (10.5%) | $0 |
| 7+ Person Families | 0 (0.0%) | $0 |
| Total | 619 (100.0%) | $52,125 |
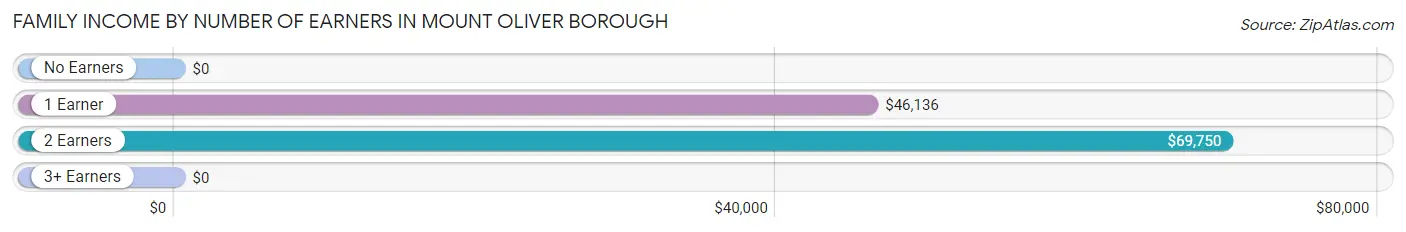
Family Income by Number of Earners in Mount Oliver borough
| Number of Earners | # Families | Median Income |
| No Earners | 143 (23.1%) | $0 |
| 1 Earner | 148 (23.9%) | $46,136 |
| 2 Earners | 318 (51.4%) | $69,750 |
| 3+ Earners | 10 (1.6%) | $0 |
| Total | 619 (100.0%) | $52,125 |
Household Income in Mount Oliver borough
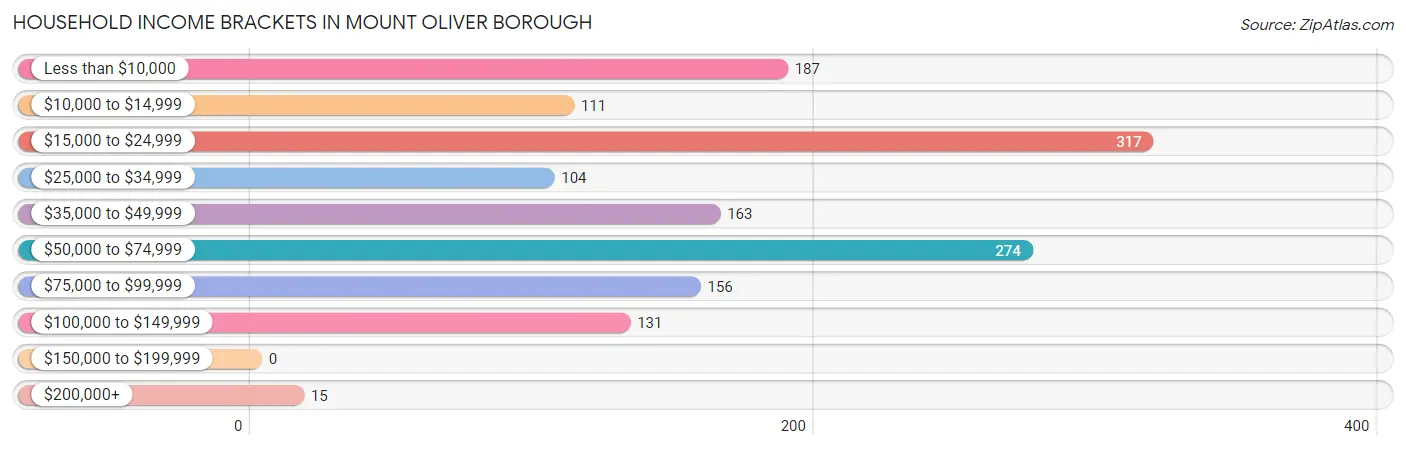
Household Income Brackets in Mount Oliver borough
With 317 households falling in the category, the $15,000 to $24,999 income range is the most frequent in Mount Oliver borough, accounting for 21.7% of all households.
| Income Bracket | # Households | % Households |
| Less than $10,000 | 187 | 12.8% |
| $10,000 to $14,999 | 111 | 7.6% |
| $15,000 to $24,999 | 317 | 21.7% |
| $25,000 to $34,999 | 104 | 7.1% |
| $35,000 to $49,999 | 163 | 11.2% |
| $50,000 to $74,999 | 274 | 18.8% |
| $75,000 to $99,999 | 156 | 10.7% |
| $100,000 to $149,999 | 131 | 9.0% |
| $150,000 to $199,999 | 0 | 0.0% |
| $200,000+ | 15 | 1.0% |
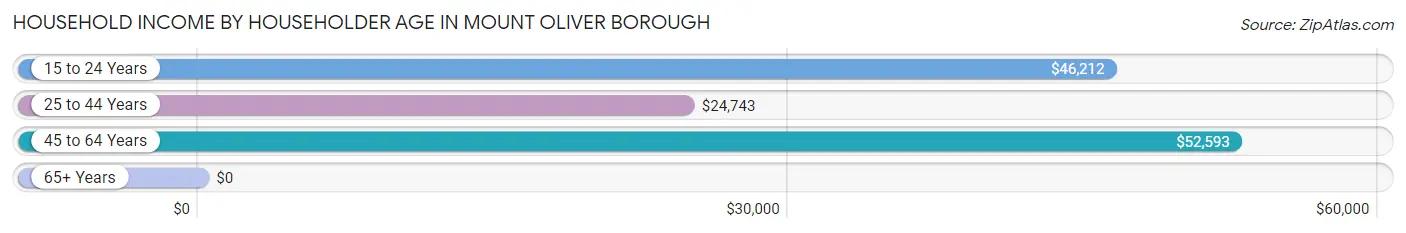
Household Income by Householder Age in Mount Oliver borough
The median household income in Mount Oliver borough is $35,640, with the highest median household income of $52,593 found in the 45 to 64 years age bracket for the primary householder. A total of 502 households (34.4%) fall into this category. Meanwhile, the 65+ years age bracket for the primary householder has the lowest median household income of $0, with 365 households (25.0%) in this group.
| Income Bracket | # Households | Median Income |
| 15 to 24 Years | 62 (4.3%) | $46,212 |
| 25 to 44 Years | 530 (36.3%) | $24,743 |
| 45 to 64 Years | 502 (34.4%) | $52,593 |
| 65+ Years | 365 (25.0%) | $0 |
| Total | 1,459 (100.0%) | $35,640 |
Poverty in Mount Oliver borough
Income Below Poverty by Sex and Age in Mount Oliver borough
With 23.6% poverty level for males and 26.8% for females among the residents of Mount Oliver borough, 6 to 11 year old males and 35 to 44 year old females are the most vulnerable to poverty, with 70 males (100.0%) and 76 females (58.0%) in their respective age groups living below the poverty level.
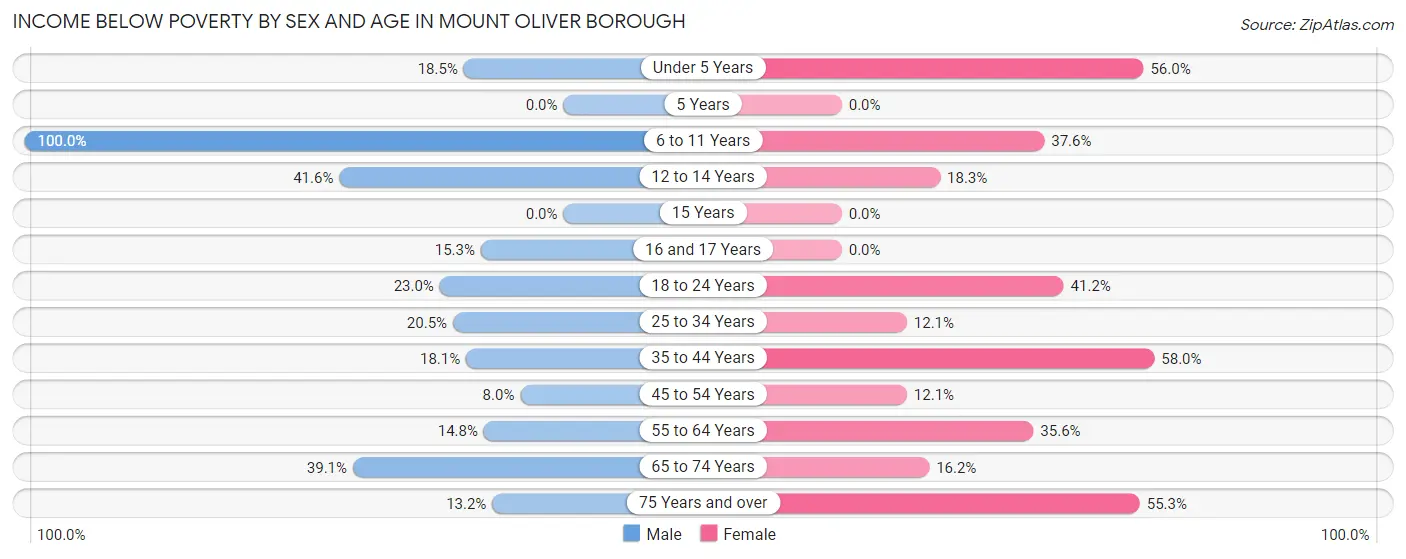
| Age Bracket | Male | Female |
| Under 5 Years | 22 (18.5%) | 14 (56.0%) |
| 5 Years | 0 (0.0%) | 0 (0.0%) |
| 6 to 11 Years | 70 (100.0%) | 56 (37.6%) |
| 12 to 14 Years | 52 (41.6%) | 23 (18.2%) |
| 15 Years | 0 (0.0%) | 0 (0.0%) |
| 16 and 17 Years | 21 (15.3%) | 0 (0.0%) |
| 18 to 24 Years | 14 (23.0%) | 49 (41.2%) |
| 25 to 34 Years | 41 (20.5%) | 43 (12.1%) |
| 35 to 44 Years | 39 (18.1%) | 76 (58.0%) |
| 45 to 54 Years | 18 (8.0%) | 22 (12.1%) |
| 55 to 64 Years | 39 (14.8%) | 90 (35.6%) |
| 65 to 74 Years | 59 (39.1%) | 24 (16.2%) |
| 75 Years and over | 7 (13.2%) | 52 (55.3%) |
| Total | 382 (23.6%) | 449 (26.8%) |
Income Above Poverty by Sex and Age in Mount Oliver borough
According to the poverty statistics in Mount Oliver borough, males aged 45 to 54 years and females aged 15 years are the age groups that are most secure financially, with 92.0% of males and 100.0% of females in these age groups living above the poverty line.
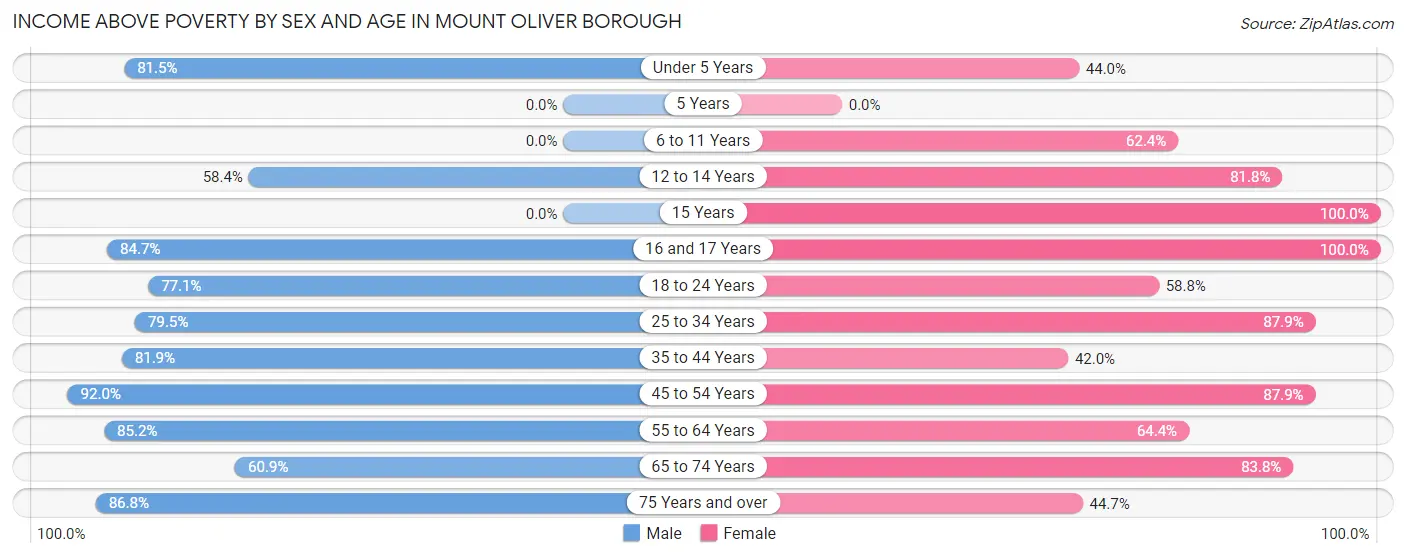
| Age Bracket | Male | Female |
| Under 5 Years | 97 (81.5%) | 11 (44.0%) |
| 5 Years | 0 (0.0%) | 0 (0.0%) |
| 6 to 11 Years | 0 (0.0%) | 93 (62.4%) |
| 12 to 14 Years | 73 (58.4%) | 103 (81.8%) |
| 15 Years | 0 (0.0%) | 55 (100.0%) |
| 16 and 17 Years | 116 (84.7%) | 37 (100.0%) |
| 18 to 24 Years | 47 (77.0%) | 70 (58.8%) |
| 25 to 34 Years | 159 (79.5%) | 313 (87.9%) |
| 35 to 44 Years | 177 (81.9%) | 55 (42.0%) |
| 45 to 54 Years | 207 (92.0%) | 160 (87.9%) |
| 55 to 64 Years | 225 (85.2%) | 163 (64.4%) |
| 65 to 74 Years | 92 (60.9%) | 124 (83.8%) |
| 75 Years and over | 46 (86.8%) | 42 (44.7%) |
| Total | 1,239 (76.4%) | 1,226 (73.2%) |
Income Below Poverty Among Married-Couple Families in Mount Oliver borough
The poverty statistics for married-couple families in Mount Oliver borough show that 2.3% or 7 of the total 310 families live below the poverty line. Families with no children have the highest poverty rate of 3.5%, comprising of 7 families. On the other hand, families with 1 or 2 children have the lowest poverty rate of 0.0%, which includes 0 families.
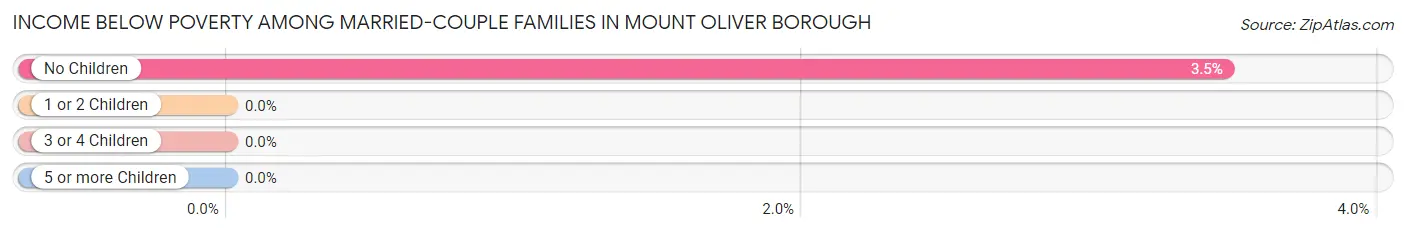
| Children | Above Poverty | Below Poverty |
| No Children | 195 (96.5%) | 7 (3.5%) |
| 1 or 2 Children | 43 (100.0%) | 0 (0.0%) |
| 3 or 4 Children | 65 (100.0%) | 0 (0.0%) |
| 5 or more Children | 0 (0.0%) | 0 (0.0%) |
| Total | 303 (97.7%) | 7 (2.3%) |
Income Below Poverty Among Single-Parent Households in Mount Oliver borough
According to the poverty data in Mount Oliver borough, 14.7% or 15 single-father households and 53.6% or 111 single-mother households are living below the poverty line. Among single-father households, those with no children have the highest poverty rate, with 15 households (100.0%) experiencing poverty. Likewise, among single-mother households, those with 1 or 2 children have the highest poverty rate, with 111 households (100.0%) falling below the poverty line.
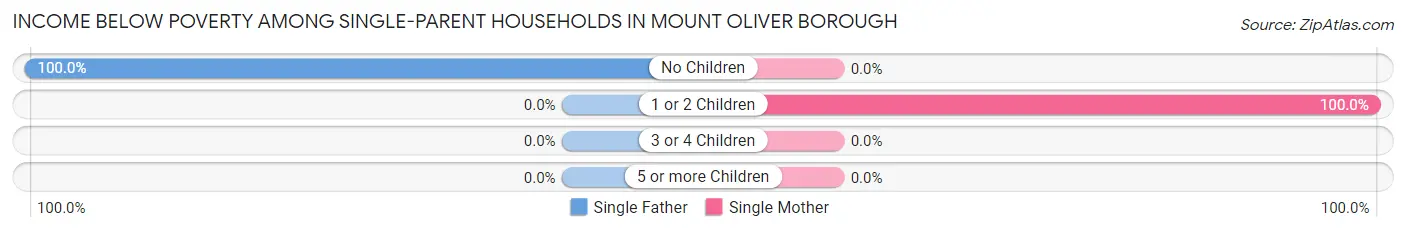
| Children | Single Father | Single Mother |
| No Children | 15 (100.0%) | 0 (0.0%) |
| 1 or 2 Children | 0 (0.0%) | 111 (100.0%) |
| 3 or 4 Children | 0 (0.0%) | 0 (0.0%) |
| 5 or more Children | 0 (0.0%) | 0 (0.0%) |
| Total | 15 (14.7%) | 111 (53.6%) |
Income Below Poverty Among Married-Couple vs Single-Parent Households in Mount Oliver borough
The poverty data for Mount Oliver borough shows that 7 of the married-couple family households (2.3%) and 126 of the single-parent households (40.8%) are living below the poverty level. Within the married-couple family households, those with no children have the highest poverty rate, with 7 households (3.5%) falling below the poverty line. Among the single-parent households, those with 1 or 2 children have the highest poverty rate, with 111 household (70.3%) living below poverty.
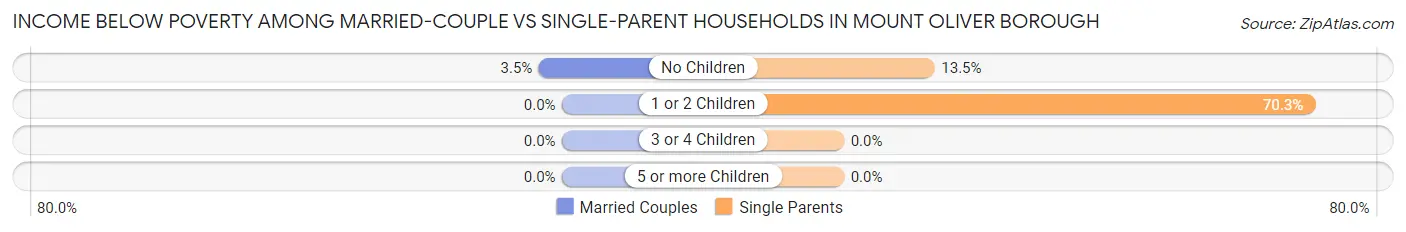
| Children | Married-Couple Families | Single-Parent Households |
| No Children | 7 (3.5%) | 15 (13.5%) |
| 1 or 2 Children | 0 (0.0%) | 111 (70.3%) |
| 3 or 4 Children | 0 (0.0%) | 0 (0.0%) |
| 5 or more Children | 0 (0.0%) | 0 (0.0%) |
| Total | 7 (2.3%) | 126 (40.8%) |
Race in Mount Oliver borough
The most populous races in Mount Oliver borough are White / Caucasian (1,780 | 53.0%), Black / African American (1,243 | 37.0%), and Hispanic or Latino (236 | 7.0%).
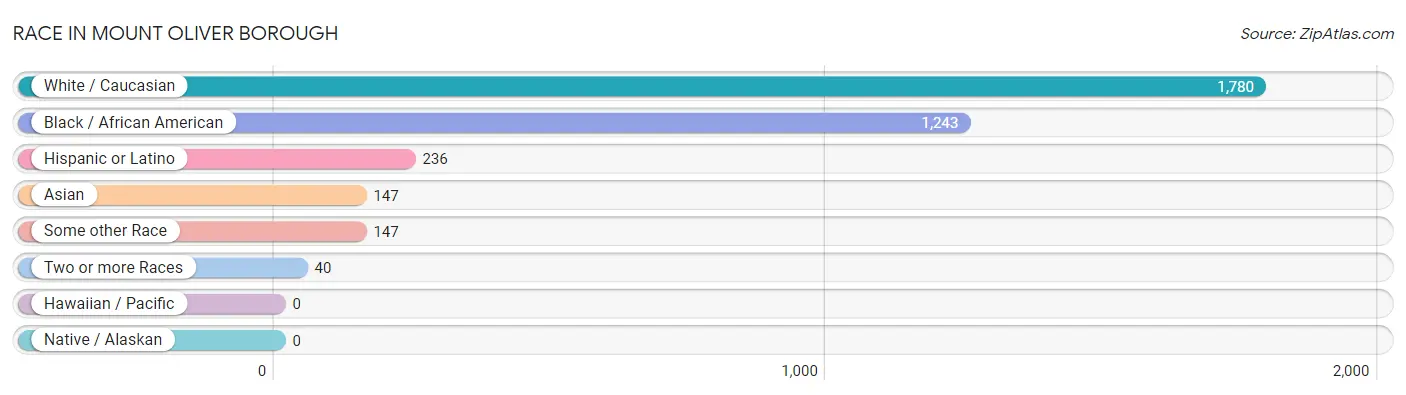
| Race | # Population | % Population |
| Asian | 147 | 4.4% |
| Black / African American | 1,243 | 37.0% |
| Hawaiian / Pacific | 0 | 0.0% |
| Hispanic or Latino | 236 | 7.0% |
| Native / Alaskan | 0 | 0.0% |
| White / Caucasian | 1,780 | 53.0% |
| Two or more Races | 40 | 1.2% |
| Some other Race | 147 | 4.4% |
| Total | 3,357 | 100.0% |
Ancestry in Mount Oliver borough
The most populous ancestries reported in Mount Oliver borough are German (634 | 18.9%), Italian (361 | 10.7%), Polish (328 | 9.8%), Irish (274 | 8.2%), and Puerto Rican (151 | 4.5%), together accounting for 52.1% of all Mount Oliver borough residents.
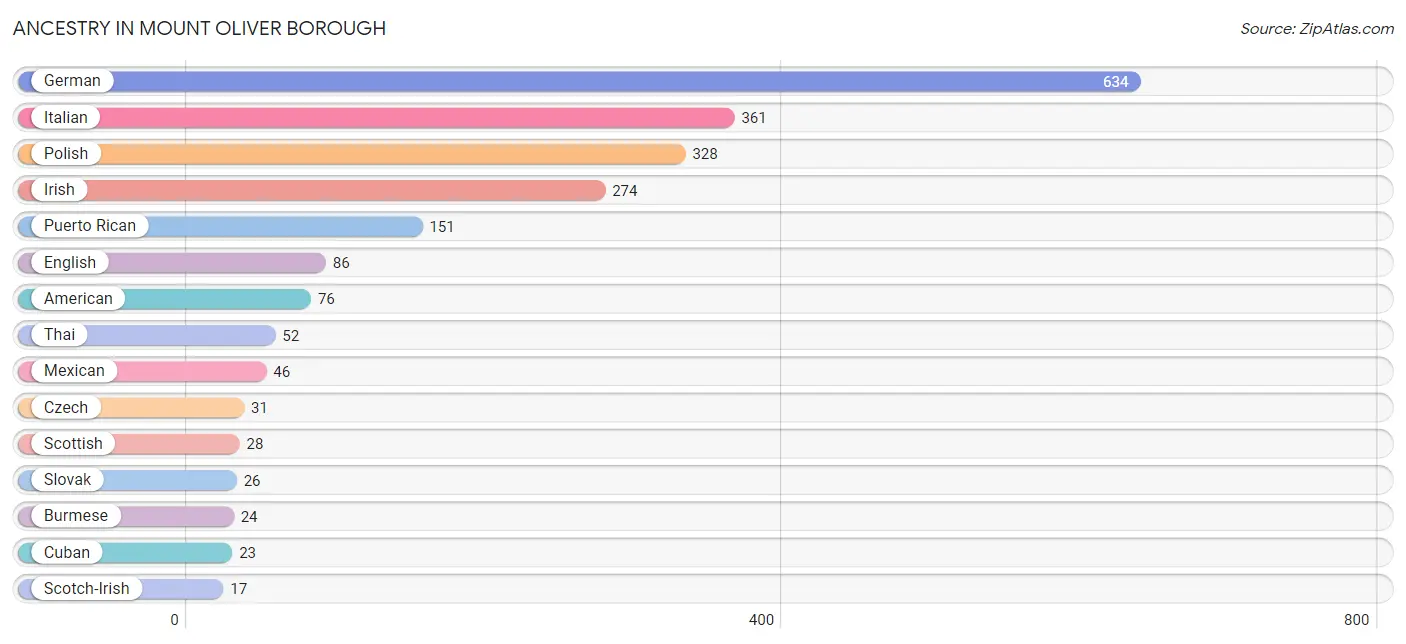
| Ancestry | # Population | % Population |
| American | 76 | 2.3% |
| Australian | 14 | 0.4% |
| Bhutanese | 7 | 0.2% |
| Burmese | 24 | 0.7% |
| Cuban | 23 | 0.7% |
| Czech | 31 | 0.9% |
| English | 86 | 2.6% |
| European | 13 | 0.4% |
| French Canadian | 5 | 0.2% |
| German | 634 | 18.9% |
| Irish | 274 | 8.2% |
| Italian | 361 | 10.7% |
| Korean | 9 | 0.3% |
| Mexican | 46 | 1.4% |
| Polish | 328 | 9.8% |
| Puerto Rican | 151 | 4.5% |
| Russian | 15 | 0.4% |
| Scotch-Irish | 17 | 0.5% |
| Scottish | 28 | 0.8% |
| Slovak | 26 | 0.8% |
| South American | 16 | 0.5% |
| Thai | 52 | 1.5% |
| Ukrainian | 16 | 0.5% |
| Venezuelan | 16 | 0.5% |
| Welsh | 9 | 0.3% | View All 25 Rows |
Immigrants in Mount Oliver borough
The most numerous immigrant groups reported in Mount Oliver borough came from Asia (76 | 2.3%), South Central Asia (52 | 1.5%), Eastern Asia (24 | 0.7%), Korea (24 | 0.7%), and Nepal (20 | 0.6%), together accounting for 5.8% of all Mount Oliver borough residents.
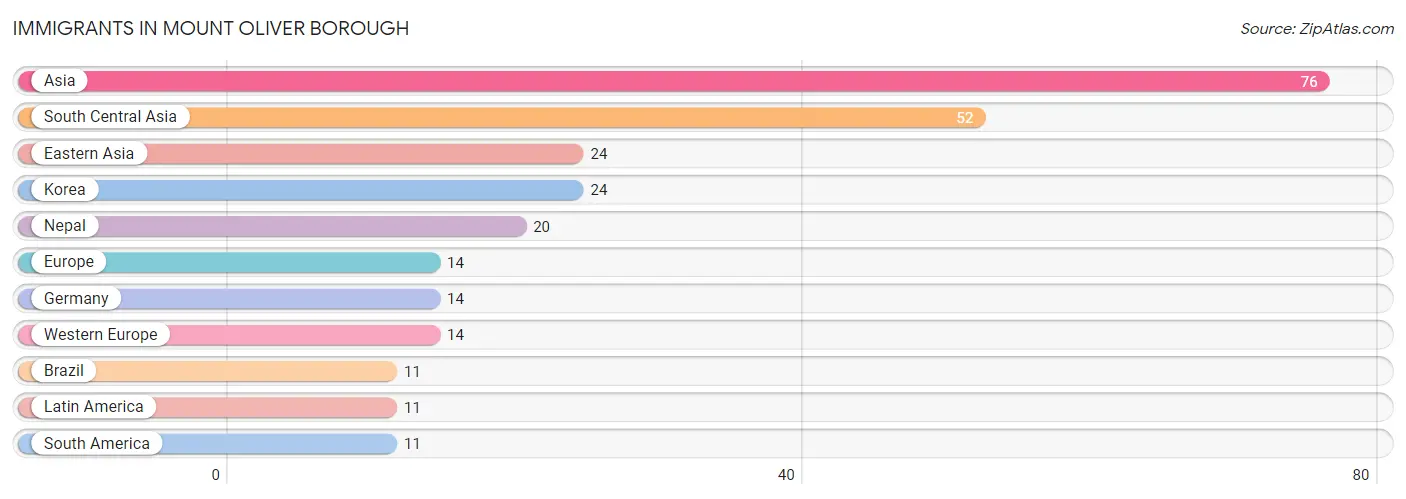
| Immigration Origin | # Population | % Population |
| Asia | 76 | 2.3% |
| Brazil | 11 | 0.3% |
| Eastern Asia | 24 | 0.7% |
| Europe | 14 | 0.4% |
| Germany | 14 | 0.4% |
| Korea | 24 | 0.7% |
| Latin America | 11 | 0.3% |
| Nepal | 20 | 0.6% |
| South America | 11 | 0.3% |
| South Central Asia | 52 | 1.5% |
| Western Europe | 14 | 0.4% | View All 11 Rows |
Sex and Age in Mount Oliver borough
Sex and Age in Mount Oliver borough
The most populous age groups in Mount Oliver borough are 10 to 14 Years (195 | 11.7%) for men and 25 to 29 Years (249 | 14.8%) for women.
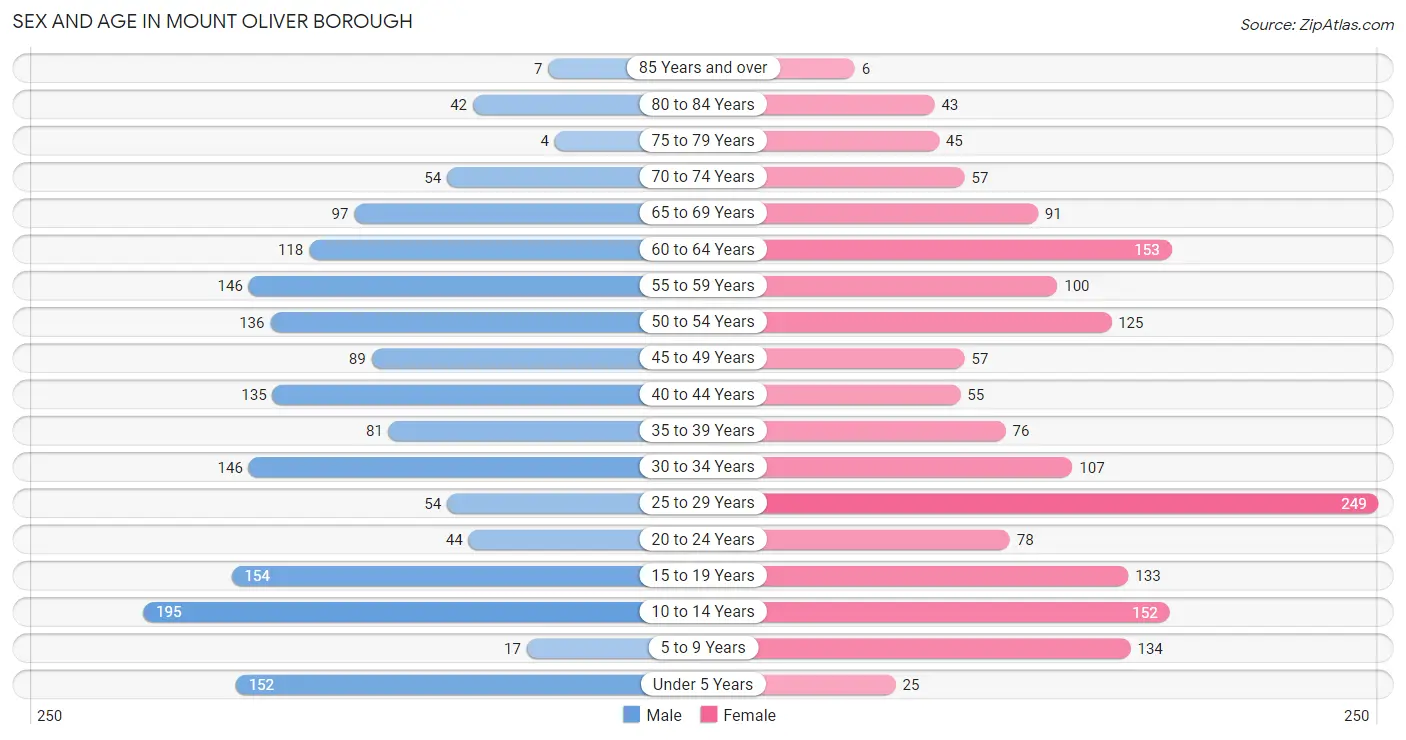
| Age Bracket | Male | Female |
| Under 5 Years | 152 (9.1%) | 25 (1.5%) |
| 5 to 9 Years | 17 (1.0%) | 134 (8.0%) |
| 10 to 14 Years | 195 (11.7%) | 152 (9.0%) |
| 15 to 19 Years | 154 (9.2%) | 133 (7.9%) |
| 20 to 24 Years | 44 (2.6%) | 78 (4.6%) |
| 25 to 29 Years | 54 (3.2%) | 249 (14.8%) |
| 30 to 34 Years | 146 (8.7%) | 107 (6.4%) |
| 35 to 39 Years | 81 (4.9%) | 76 (4.5%) |
| 40 to 44 Years | 135 (8.1%) | 55 (3.3%) |
| 45 to 49 Years | 89 (5.3%) | 57 (3.4%) |
| 50 to 54 Years | 136 (8.1%) | 125 (7.4%) |
| 55 to 59 Years | 146 (8.7%) | 100 (5.9%) |
| 60 to 64 Years | 118 (7.1%) | 153 (9.1%) |
| 65 to 69 Years | 97 (5.8%) | 91 (5.4%) |
| 70 to 74 Years | 54 (3.2%) | 57 (3.4%) |
| 75 to 79 Years | 4 (0.2%) | 45 (2.7%) |
| 80 to 84 Years | 42 (2.5%) | 43 (2.5%) |
| 85 Years and over | 7 (0.4%) | 6 (0.4%) |
| Total | 1,671 (100.0%) | 1,686 (100.0%) |
Families and Households in Mount Oliver borough
Median Family Size in Mount Oliver borough
The median family size in Mount Oliver borough is 3.64 persons per family, with single male/father families (102 | 16.5%) accounting for the largest median family size of 5.44 persons per family. On the other hand, married-couple families (310 | 50.1%) represent the smallest median family size with 3.27 persons per family.
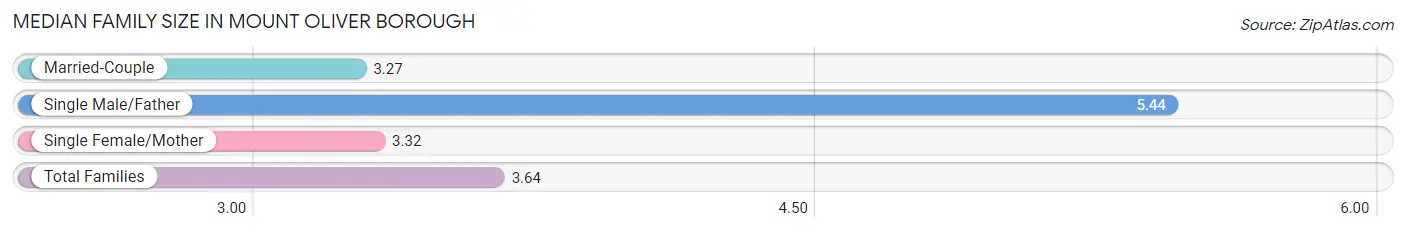
| Family Type | # Families | Family Size |
| Married-Couple | 310 (50.1%) | 3.27 |
| Single Male/Father | 102 (16.5%) | 5.44 |
| Single Female/Mother | 207 (33.4%) | 3.32 |
| Total Families | 619 (100.0%) | 3.64 |
Median Household Size in Mount Oliver borough
The median household size in Mount Oliver borough is 2.30 persons per household, with single male/father households (102 | 7.0%) accounting for the largest median household size of 6.69 persons per household. non-family households (840 | 57.6%) represent the smallest median household size with 1.09 persons per household.
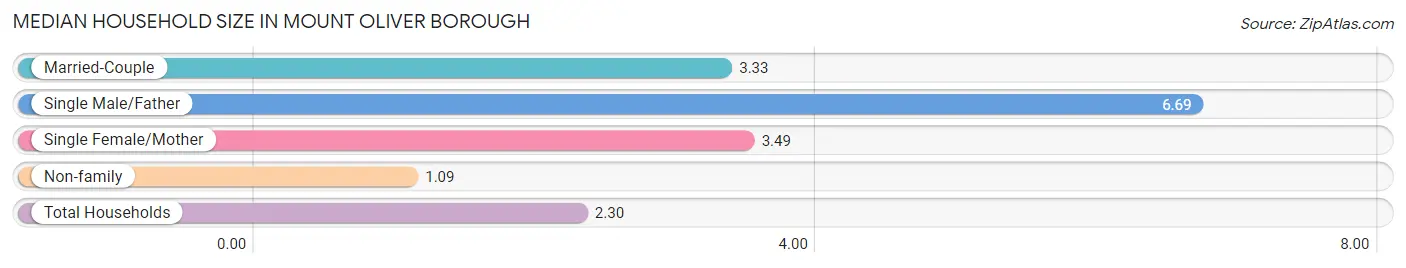
| Household Type | # Households | Household Size |
| Married-Couple | 310 (21.2%) | 3.33 |
| Single Male/Father | 102 (7.0%) | 6.69 |
| Single Female/Mother | 207 (14.2%) | 3.49 |
| Non-family | 840 (57.6%) | 1.09 |
| Total Households | 1,459 (100.0%) | 2.30 |
Household Size by Marriage Status in Mount Oliver borough
Out of a total of 1,459 households in Mount Oliver borough, 619 (42.4%) are family households, while 840 (57.6%) are nonfamily households. The most numerous type of family households are 2-person households, comprising 248, and the most common type of nonfamily households are 1-person households, comprising 793.
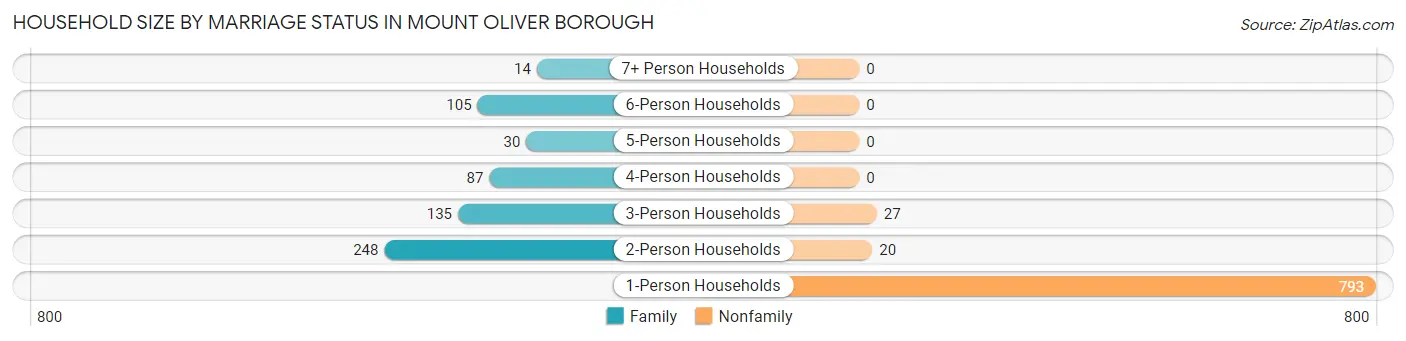
| Household Size | Family Households | Nonfamily Households |
| 1-Person Households | - | 793 (54.3%) |
| 2-Person Households | 248 (17.0%) | 20 (1.4%) |
| 3-Person Households | 135 (9.2%) | 27 (1.8%) |
| 4-Person Households | 87 (6.0%) | 0 (0.0%) |
| 5-Person Households | 30 (2.1%) | 0 (0.0%) |
| 6-Person Households | 105 (7.2%) | 0 (0.0%) |
| 7+ Person Households | 14 (1.0%) | 0 (0.0%) |
| Total | 619 (42.4%) | 840 (57.6%) |
Female Fertility in Mount Oliver borough
Fertility by Age in Mount Oliver borough
Average fertility rate in Mount Oliver borough is 15.0 births per 1,000 women. Women in the age bracket of 20 to 34 years have the highest fertility rate with 25.0 births per 1,000 women. Women in the age bracket of 20 to 34 years acount for 100.0% of all women with births.
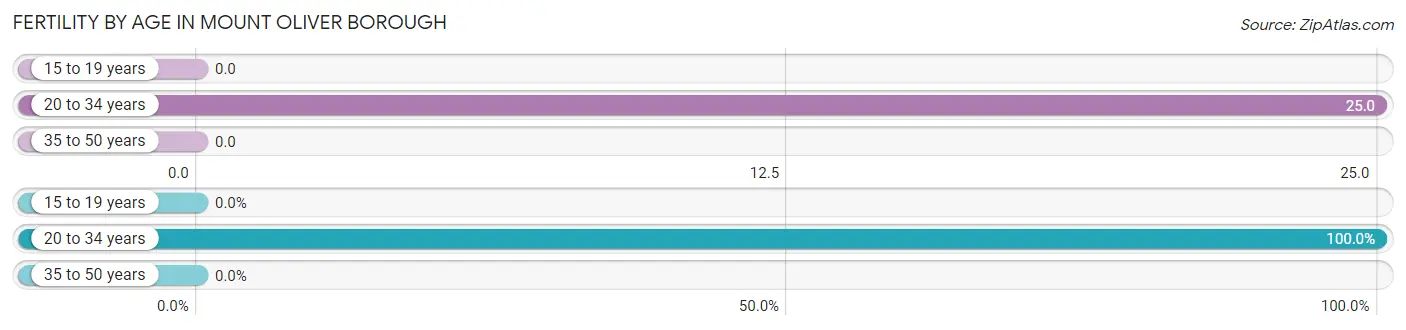
| Age Bracket | Women with Births | Births / 1,000 Women |
| 15 to 19 years | 0 (0.0%) | 0.0 |
| 20 to 34 years | 11 (100.0%) | 25.0 |
| 35 to 50 years | 0 (0.0%) | 0.0 |
| Total | 11 (100.0%) | 15.0 |
Fertility by Age by Marriage Status in Mount Oliver borough
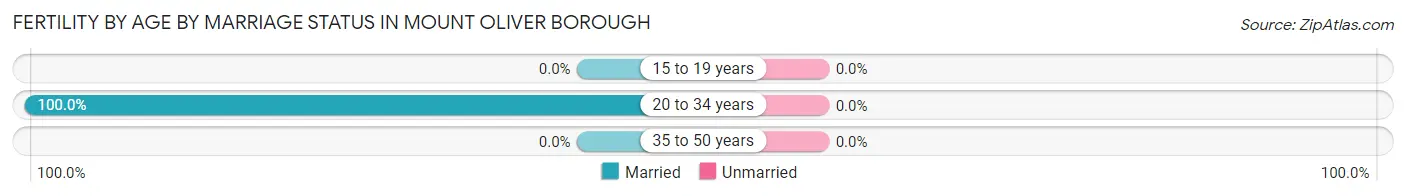
| Age Bracket | Married | Unmarried |
| 15 to 19 years | 0 (0.0%) | 0 (0.0%) |
| 20 to 34 years | 11 (100.0%) | 0 (0.0%) |
| 35 to 50 years | 0 (0.0%) | 0 (0.0%) |
| Total | 11 (100.0%) | 0 (0.0%) |
Fertility by Education in Mount Oliver borough
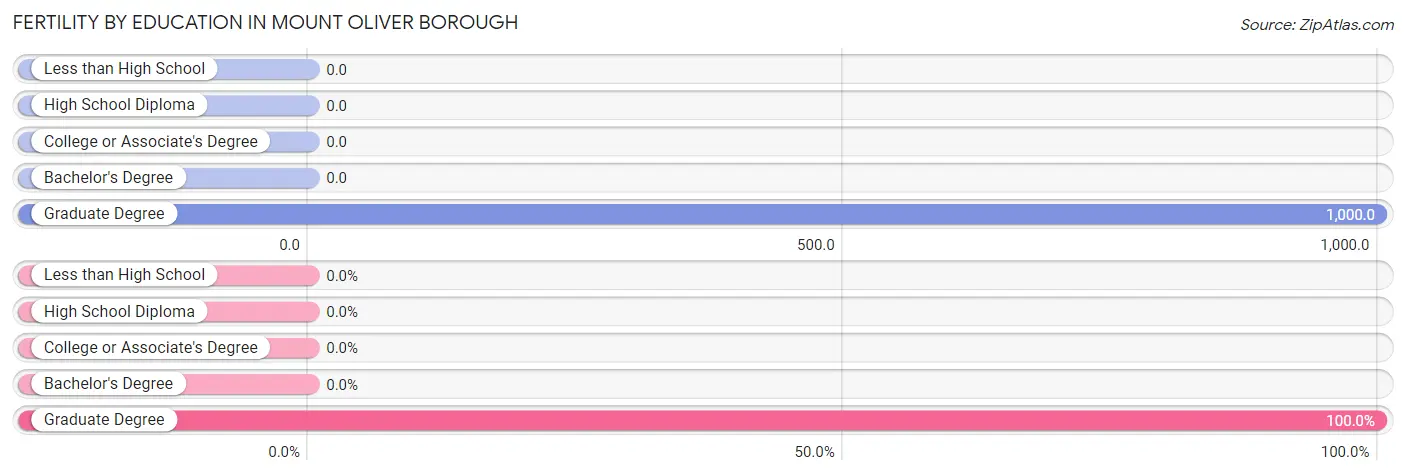
| Educational Attainment | Women with Births | Births / 1,000 Women |
| Less than High School | 0 (0.0%) | 0.0 |
| High School Diploma | 0 (0.0%) | 0.0 |
| College or Associate's Degree | 0 (0.0%) | 0.0 |
| Bachelor's Degree | 0 (0.0%) | 0.0 |
| Graduate Degree | 11 (100.0%) | 1,000.0 |
| Total | 11 (100.0%) | 15.0 |
Fertility by Education by Marriage Status in Mount Oliver borough
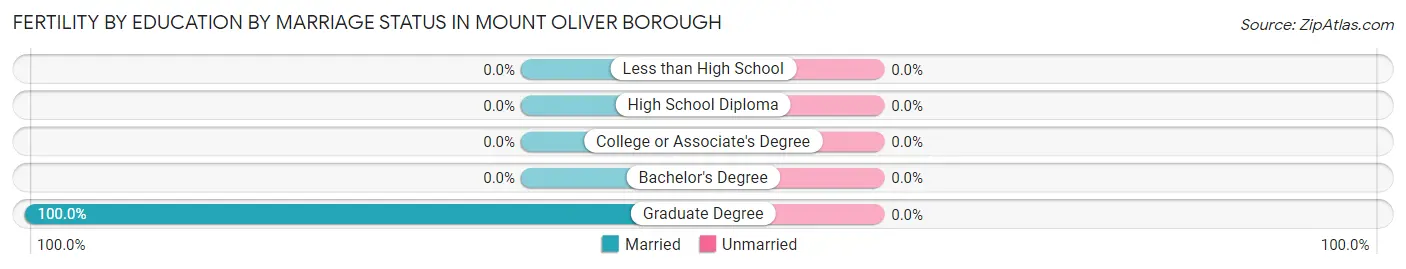
| Educational Attainment | Married | Unmarried |
| Less than High School | 0 (0.0%) | 0 (0.0%) |
| High School Diploma | 0 (0.0%) | 0 (0.0%) |
| College or Associate's Degree | 0 (0.0%) | 0 (0.0%) |
| Bachelor's Degree | 0 (0.0%) | 0 (0.0%) |
| Graduate Degree | 11 (100.0%) | 0 (0.0%) |
| Total | 11 (100.0%) | 0 (0.0%) |
Employment Characteristics in Mount Oliver borough
Employment by Class of Employer in Mount Oliver borough
Among the 1,389 employed individuals in Mount Oliver borough, private company employees (1,032 | 74.3%), local government employees (110 | 7.9%), and not-for-profit organizations (104 | 7.5%) make up the most common classes of employment.
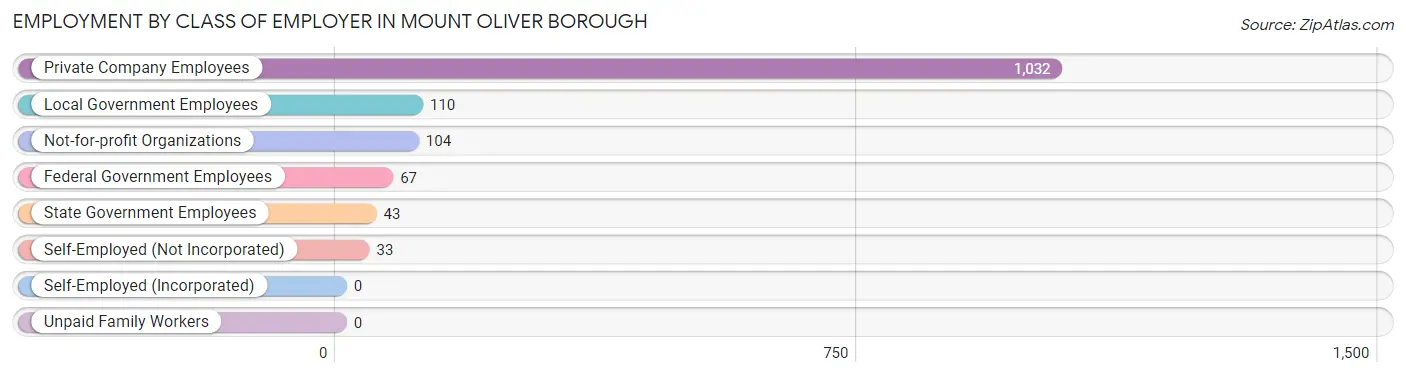
| Employer Class | # Employees | % Employees |
| Private Company Employees | 1,032 | 74.3% |
| Self-Employed (Incorporated) | 0 | 0.0% |
| Self-Employed (Not Incorporated) | 33 | 2.4% |
| Not-for-profit Organizations | 104 | 7.5% |
| Local Government Employees | 110 | 7.9% |
| State Government Employees | 43 | 3.1% |
| Federal Government Employees | 67 | 4.8% |
| Unpaid Family Workers | 0 | 0.0% |
| Total | 1,389 | 100.0% |
Employment Status by Age in Mount Oliver borough
According to the labor force statistics for Mount Oliver borough, out of the total population over 16 years of age (2,627), 59.4% or 1,560 individuals are in the labor force, with 10.1% or 158 of them unemployed. The age group with the highest labor force participation rate is 20 to 24 years, with 100.0% or 122 individuals in the labor force. Within the labor force, the 65 to 74 years age range has the highest percentage of unemployed individuals, with 45.2% or 38 of them being unemployed.
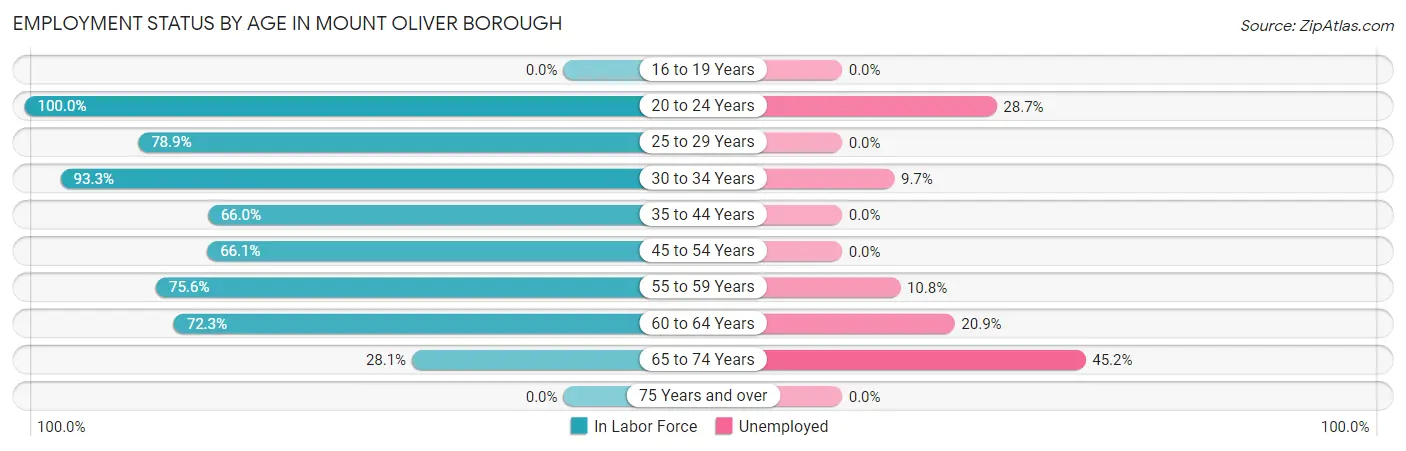
| Age Bracket | In Labor Force | Unemployed |
| 16 to 19 Years | 0 (0.0%) | 0 (0.0%) |
| 20 to 24 Years | 122 (100.0%) | 35 (28.7%) |
| 25 to 29 Years | 239 (78.9%) | 0 (0.0%) |
| 30 to 34 Years | 236 (93.3%) | 23 (9.7%) |
| 35 to 44 Years | 229 (66.0%) | 0 (0.0%) |
| 45 to 54 Years | 269 (66.1%) | 0 (0.0%) |
| 55 to 59 Years | 186 (75.6%) | 20 (10.8%) |
| 60 to 64 Years | 196 (72.3%) | 41 (20.9%) |
| 65 to 74 Years | 84 (28.1%) | 38 (45.2%) |
| 75 Years and over | 0 (0.0%) | 0 (0.0%) |
| Total | 1,560 (59.4%) | 158 (10.1%) |
Employment Status by Educational Attainment in Mount Oliver borough
According to labor force statistics for Mount Oliver borough, 74.2% of individuals (1,356) out of the total population between 25 and 64 years of age (1,827) are in the labor force, with 6.2% or 84 of them being unemployed. The group with the highest labor force participation rate are those with the educational attainment of bachelor's degree or higher, with 97.7% or 347 individuals in the labor force. Within the labor force, individuals with less than high school education have the highest percentage of unemployment, with 13.1% or 41 of them being unemployed.
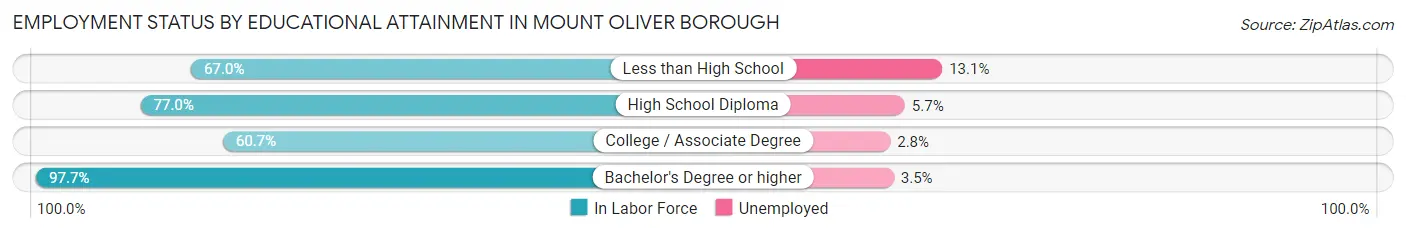
| Educational Attainment | In Labor Force | Unemployed |
| Less than High School | 314 (67.0%) | 61 (13.1%) |
| High School Diploma | 404 (77.0%) | 30 (5.7%) |
| College / Associate Degree | 290 (60.7%) | 13 (2.8%) |
| Bachelor's Degree or higher | 347 (97.7%) | 12 (3.5%) |
| Total | 1,356 (74.2%) | 113 (6.2%) |
Employment Occupations by Sex in Mount Oliver borough
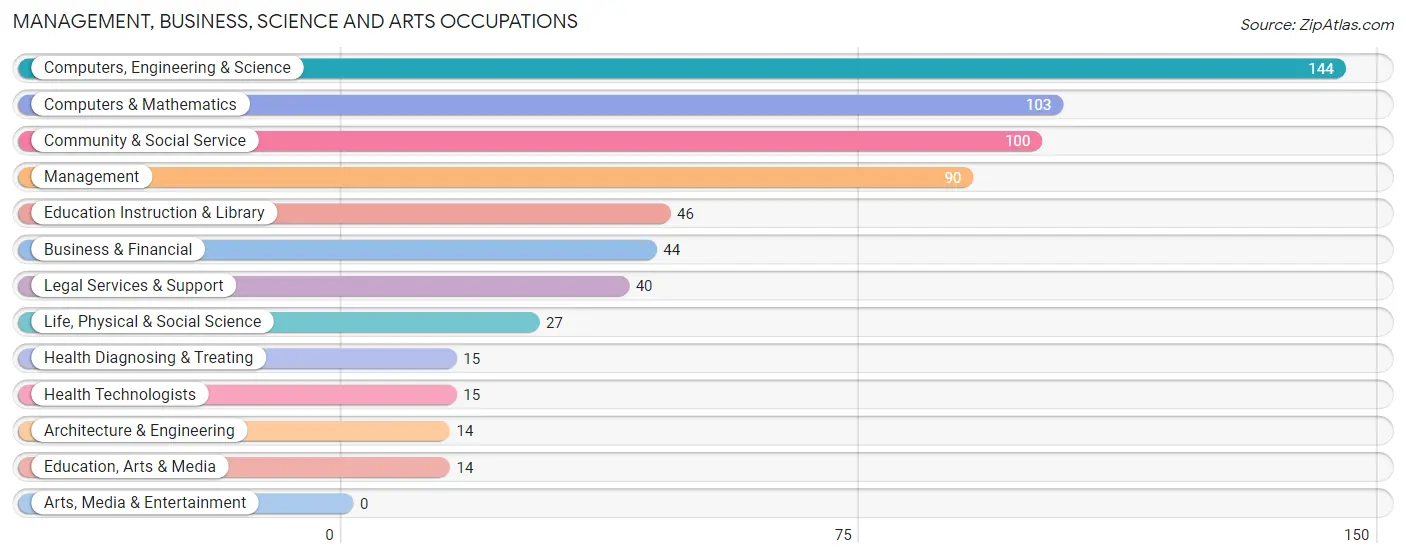
Management, Business, Science and Arts Occupations
The most common Management, Business, Science and Arts occupations in Mount Oliver borough are Computers, Engineering & Science (144 | 10.3%), Computers & Mathematics (103 | 7.3%), Community & Social Service (100 | 7.1%), Management (90 | 6.4%), and Education Instruction & Library (46 | 3.3%).
Management, Business, Science and Arts Occupations by Sex
Within the Management, Business, Science and Arts occupations in Mount Oliver borough, the most male-oriented occupations are Management (100.0%), Architecture & Engineering (100.0%), and Education, Arts & Media (100.0%), while the most female-oriented occupations are Life, Physical & Social Science (100.0%), Legal Services & Support (100.0%), and Health Diagnosing & Treating (100.0%).
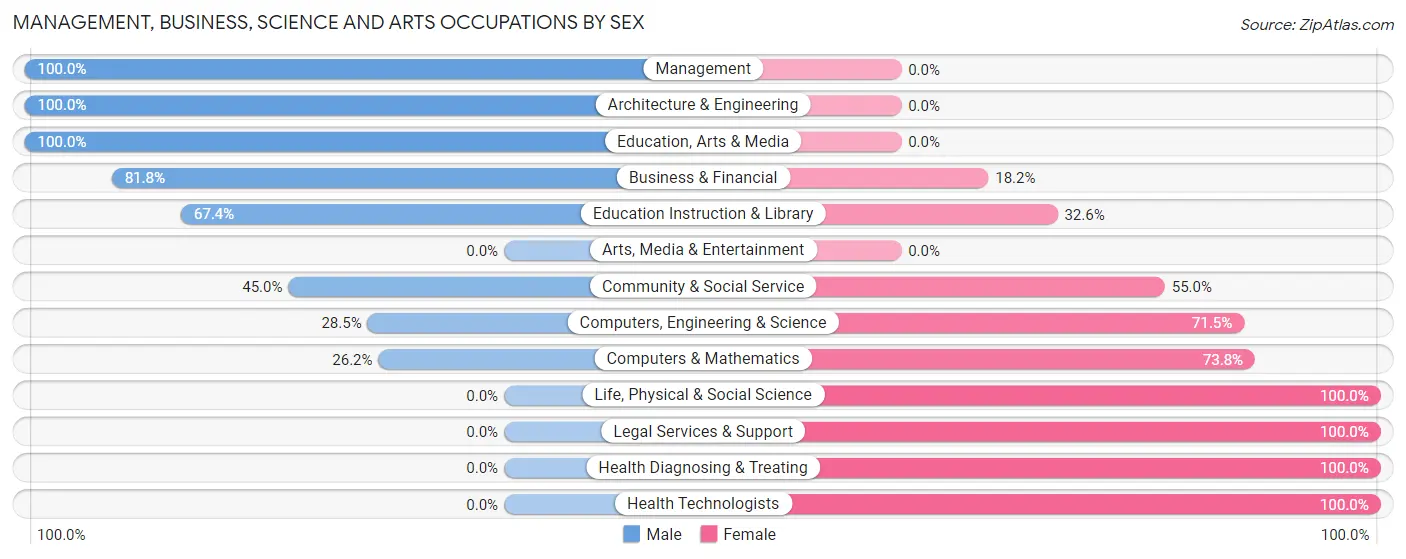
| Occupation | Male | Female |
| Management | 90 (100.0%) | 0 (0.0%) |
| Business & Financial | 36 (81.8%) | 8 (18.2%) |
| Computers, Engineering & Science | 41 (28.5%) | 103 (71.5%) |
| Computers & Mathematics | 27 (26.2%) | 76 (73.8%) |
| Architecture & Engineering | 14 (100.0%) | 0 (0.0%) |
| Life, Physical & Social Science | 0 (0.0%) | 27 (100.0%) |
| Community & Social Service | 45 (45.0%) | 55 (55.0%) |
| Education, Arts & Media | 14 (100.0%) | 0 (0.0%) |
| Legal Services & Support | 0 (0.0%) | 40 (100.0%) |
| Education Instruction & Library | 31 (67.4%) | 15 (32.6%) |
| Arts, Media & Entertainment | 0 (0.0%) | 0 (0.0%) |
| Health Diagnosing & Treating | 0 (0.0%) | 15 (100.0%) |
| Health Technologists | 0 (0.0%) | 15 (100.0%) |
| Total (Category) | 212 (53.9%) | 181 (46.1%) |
| Total (Overall) | 639 (45.5%) | 765 (54.5%) |
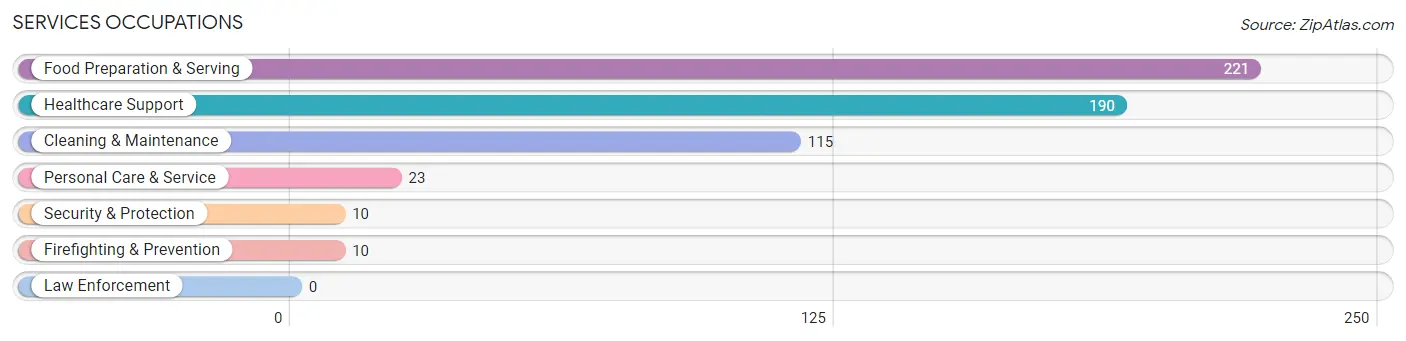
Services Occupations
The most common Services occupations in Mount Oliver borough are Food Preparation & Serving (221 | 15.7%), Healthcare Support (190 | 13.5%), Cleaning & Maintenance (115 | 8.2%), Personal Care & Service (23 | 1.6%), and Security & Protection (10 | 0.7%).
Services Occupations by Sex
Within the Services occupations in Mount Oliver borough, the most male-oriented occupations are Cleaning & Maintenance (65.2%), Personal Care & Service (65.2%), and Food Preparation & Serving (48.0%), while the most female-oriented occupations are Healthcare Support (100.0%), Security & Protection (100.0%), and Firefighting & Prevention (100.0%).
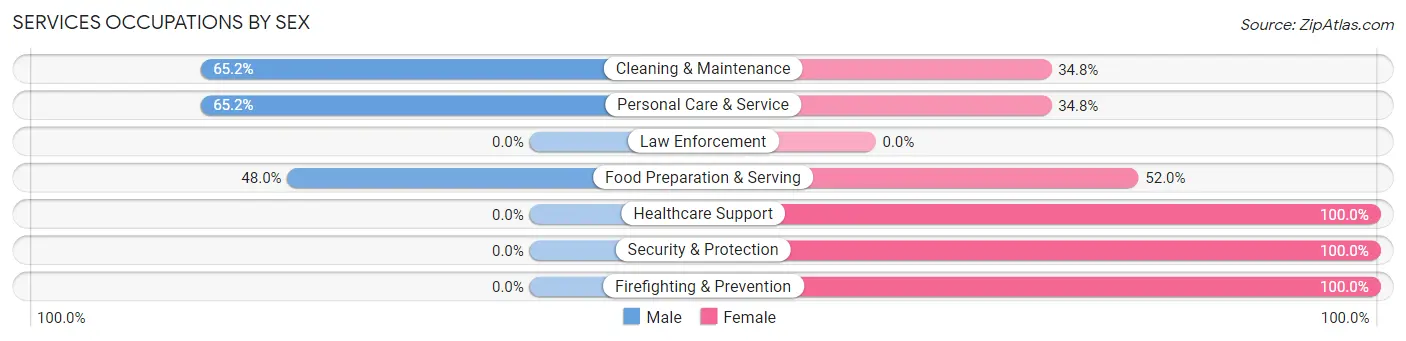
| Occupation | Male | Female |
| Healthcare Support | 0 (0.0%) | 190 (100.0%) |
| Security & Protection | 0 (0.0%) | 10 (100.0%) |
| Firefighting & Prevention | 0 (0.0%) | 10 (100.0%) |
| Law Enforcement | 0 (0.0%) | 0 (0.0%) |
| Food Preparation & Serving | 106 (48.0%) | 115 (52.0%) |
| Cleaning & Maintenance | 75 (65.2%) | 40 (34.8%) |
| Personal Care & Service | 15 (65.2%) | 8 (34.8%) |
| Total (Category) | 196 (35.1%) | 363 (64.9%) |
| Total (Overall) | 639 (45.5%) | 765 (54.5%) |
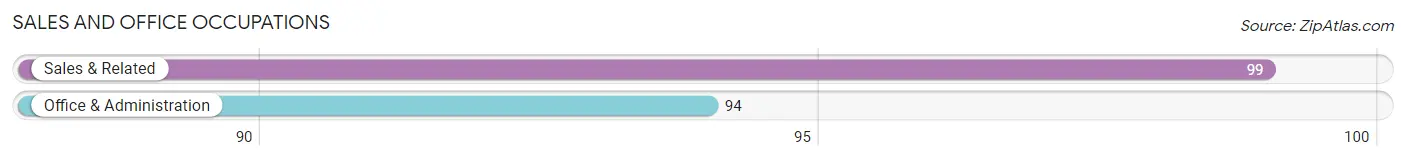
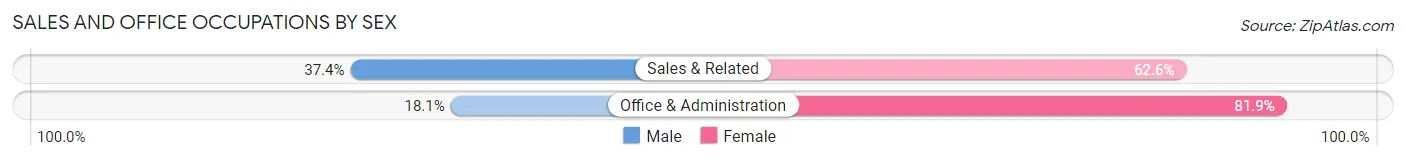
Sales and Office Occupations
The most common Sales and Office occupations in Mount Oliver borough are Sales & Related (99 | 7.0%), and Office & Administration (94 | 6.7%).
Sales and Office Occupations by Sex
| Occupation | Male | Female |
| Sales & Related | 37 (37.4%) | 62 (62.6%) |
| Office & Administration | 17 (18.1%) | 77 (81.9%) |
| Total (Category) | 54 (28.0%) | 139 (72.0%) |
| Total (Overall) | 639 (45.5%) | 765 (54.5%) |
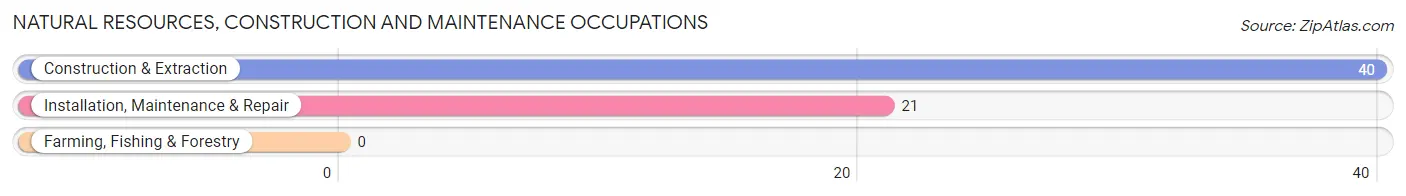
Natural Resources, Construction and Maintenance Occupations
The most common Natural Resources, Construction and Maintenance occupations in Mount Oliver borough are Construction & Extraction (40 | 2.9%), and Installation, Maintenance & Repair (21 | 1.5%).
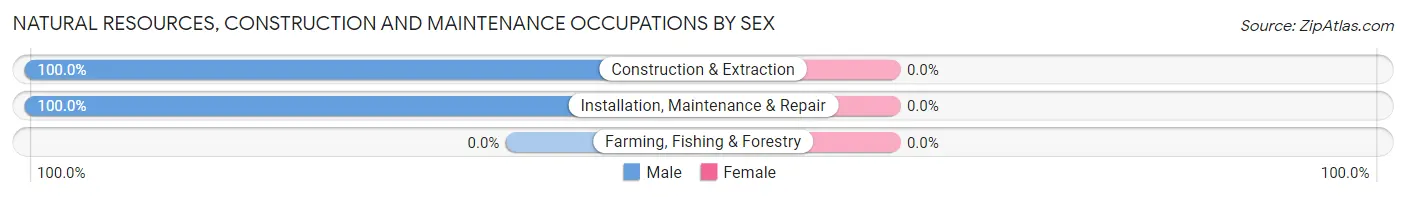
Natural Resources, Construction and Maintenance Occupations by Sex
| Occupation | Male | Female |
| Farming, Fishing & Forestry | 0 (0.0%) | 0 (0.0%) |
| Construction & Extraction | 40 (100.0%) | 0 (0.0%) |
| Installation, Maintenance & Repair | 21 (100.0%) | 0 (0.0%) |
| Total (Category) | 61 (100.0%) | 0 (0.0%) |
| Total (Overall) | 639 (45.5%) | 765 (54.5%) |
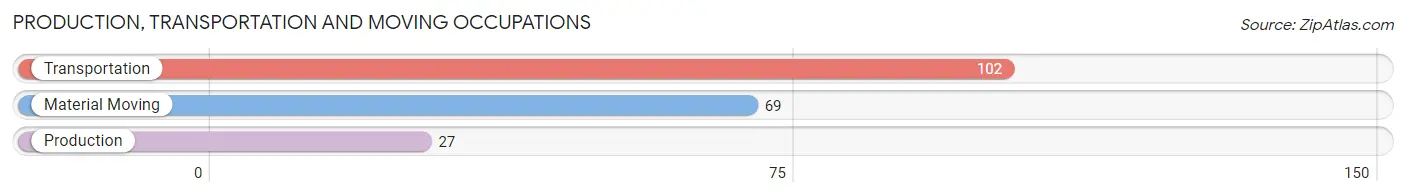
Production, Transportation and Moving Occupations
The most common Production, Transportation and Moving occupations in Mount Oliver borough are Transportation (102 | 7.3%), Material Moving (69 | 4.9%), and Production (27 | 1.9%).
Production, Transportation and Moving Occupations by Sex
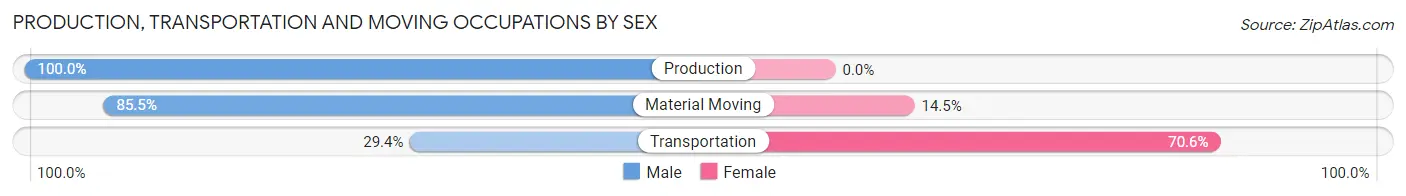
| Occupation | Male | Female |
| Production | 27 (100.0%) | 0 (0.0%) |
| Transportation | 30 (29.4%) | 72 (70.6%) |
| Material Moving | 59 (85.5%) | 10 (14.5%) |
| Total (Category) | 116 (58.6%) | 82 (41.4%) |
| Total (Overall) | 639 (45.5%) | 765 (54.5%) |
Employment Industries by Sex in Mount Oliver borough
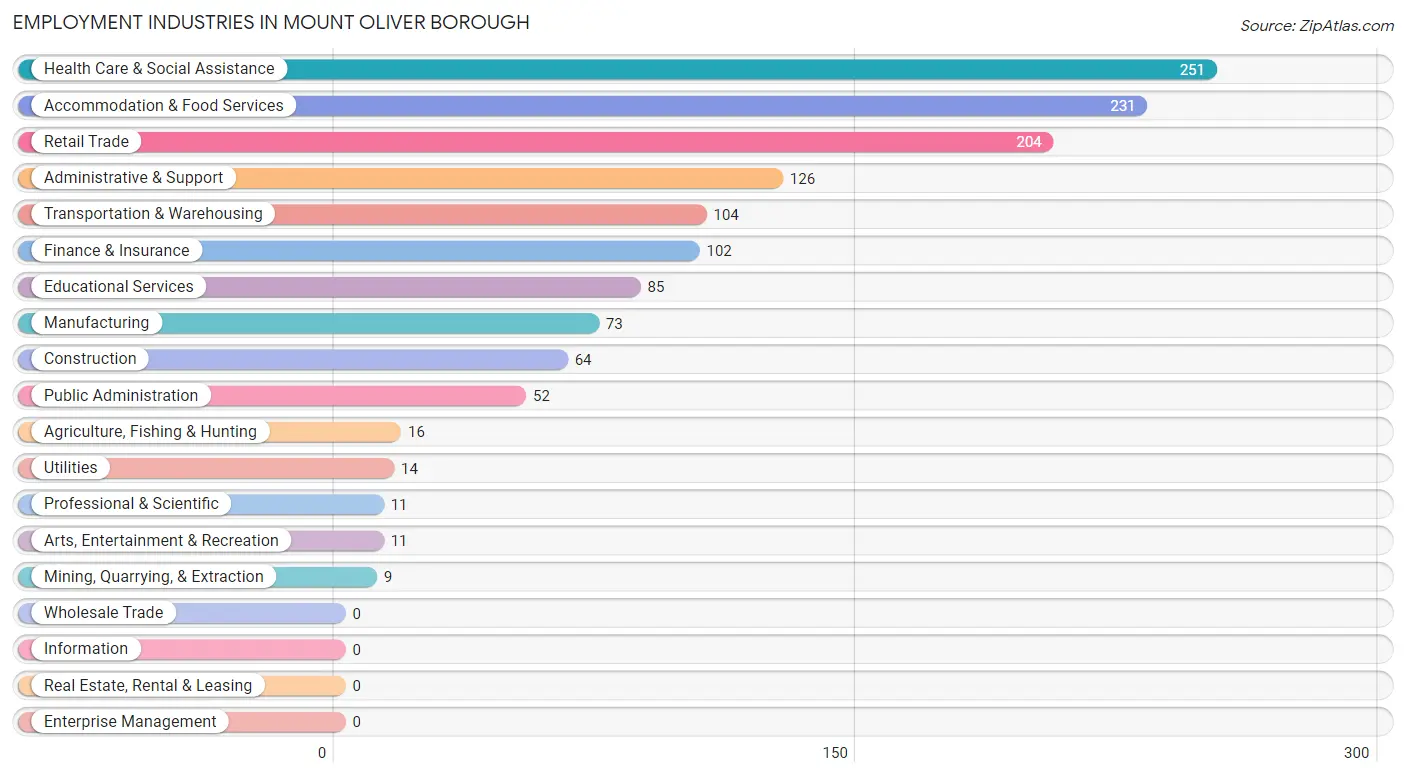
Employment Industries in Mount Oliver borough
The major employment industries in Mount Oliver borough include Health Care & Social Assistance (251 | 17.9%), Accommodation & Food Services (231 | 16.5%), Retail Trade (204 | 14.5%), Administrative & Support (126 | 9.0%), and Transportation & Warehousing (104 | 7.4%).
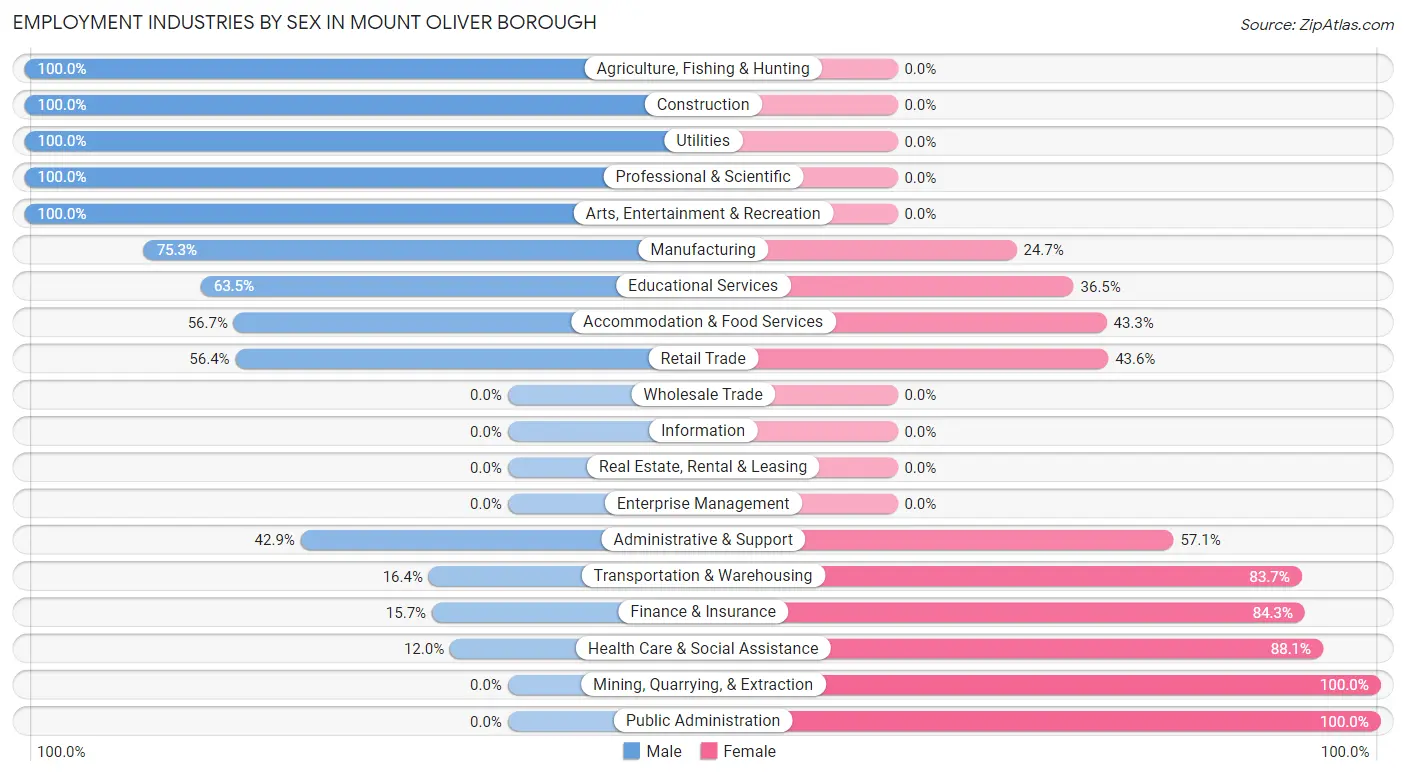
Employment Industries by Sex in Mount Oliver borough
The Mount Oliver borough industries that see more men than women are Agriculture, Fishing & Hunting (100.0%), Construction (100.0%), and Utilities (100.0%), whereas the industries that tend to have a higher number of women are Mining, Quarrying, & Extraction (100.0%), Public Administration (100.0%), and Health Care & Social Assistance (88.0%).
| Industry | Male | Female |
| Agriculture, Fishing & Hunting | 16 (100.0%) | 0 (0.0%) |
| Mining, Quarrying, & Extraction | 0 (0.0%) | 9 (100.0%) |
| Construction | 64 (100.0%) | 0 (0.0%) |
| Manufacturing | 55 (75.3%) | 18 (24.7%) |
| Wholesale Trade | 0 (0.0%) | 0 (0.0%) |
| Retail Trade | 115 (56.4%) | 89 (43.6%) |
| Transportation & Warehousing | 17 (16.4%) | 87 (83.7%) |
| Utilities | 14 (100.0%) | 0 (0.0%) |
| Information | 0 (0.0%) | 0 (0.0%) |
| Finance & Insurance | 16 (15.7%) | 86 (84.3%) |
| Real Estate, Rental & Leasing | 0 (0.0%) | 0 (0.0%) |
| Professional & Scientific | 11 (100.0%) | 0 (0.0%) |
| Enterprise Management | 0 (0.0%) | 0 (0.0%) |
| Administrative & Support | 54 (42.9%) | 72 (57.1%) |
| Educational Services | 54 (63.5%) | 31 (36.5%) |
| Health Care & Social Assistance | 30 (11.9%) | 221 (88.0%) |
| Arts, Entertainment & Recreation | 11 (100.0%) | 0 (0.0%) |
| Accommodation & Food Services | 131 (56.7%) | 100 (43.3%) |
| Public Administration | 0 (0.0%) | 52 (100.0%) |
| Total | 639 (45.5%) | 765 (54.5%) |
Education in Mount Oliver borough
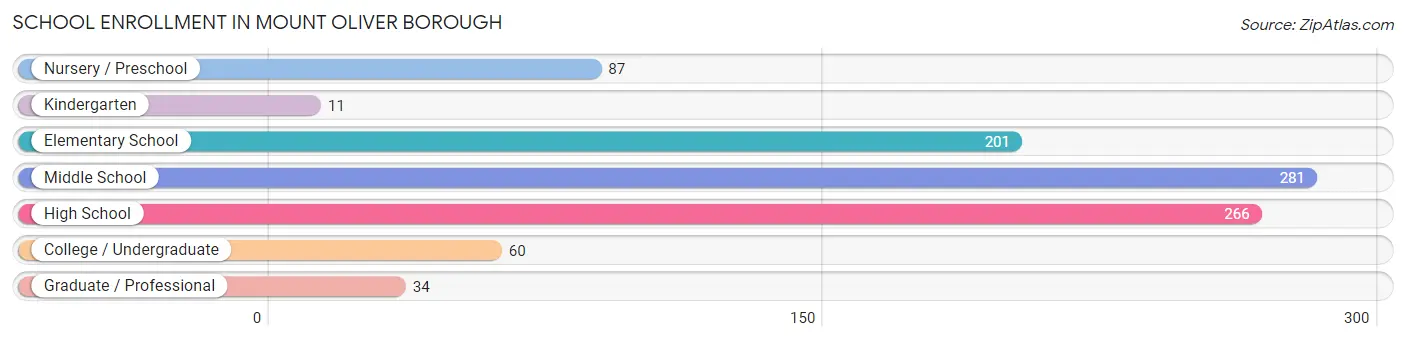
School Enrollment in Mount Oliver borough
The most common levels of schooling among the 940 students in Mount Oliver borough are middle school (281 | 29.9%), high school (266 | 28.3%), and elementary school (201 | 21.4%).
| School Level | # Students | % Students |
| Nursery / Preschool | 87 | 9.3% |
| Kindergarten | 11 | 1.2% |
| Elementary School | 201 | 21.4% |
| Middle School | 281 | 29.9% |
| High School | 266 | 28.3% |
| College / Undergraduate | 60 | 6.4% |
| Graduate / Professional | 34 | 3.6% |
| Total | 940 | 100.0% |
School Enrollment by Age by Funding Source in Mount Oliver borough
Out of a total of 940 students who are enrolled in schools in Mount Oliver borough, 95 (10.1%) attend a private institution, while the remaining 845 (89.9%) are enrolled in public schools. The age group of 35 years and over has the highest likelihood of being enrolled in private schools, with 30 (68.2% in the age bracket) enrolled. Conversely, the age group of 5 to 9 year old has the lowest likelihood of being enrolled in a private school, with 142 (100.0% in the age bracket) attending a public institution.
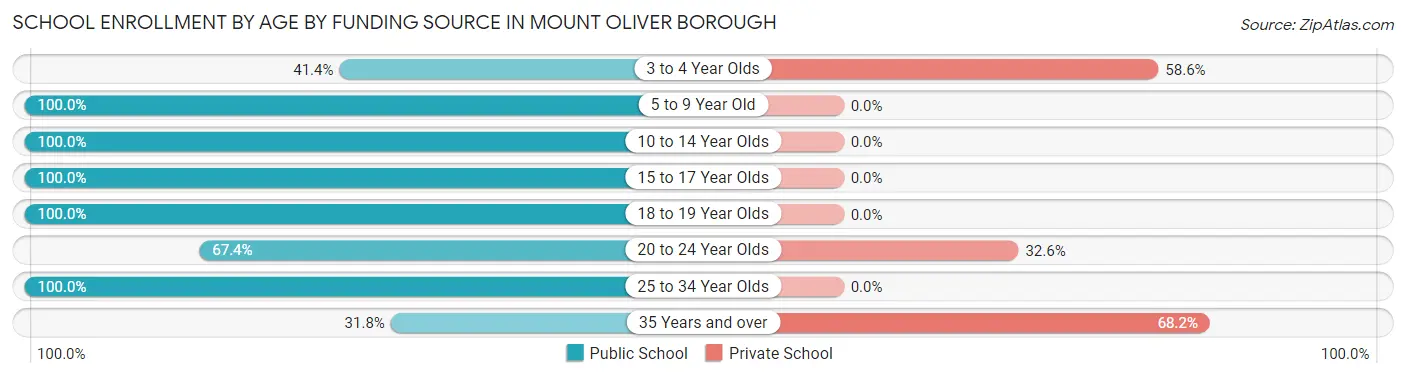
| Age Bracket | Public School | Private School |
| 3 to 4 Year Olds | 36 (41.4%) | 51 (58.6%) |
| 5 to 9 Year Old | 142 (100.0%) | 0 (0.0%) |
| 10 to 14 Year Olds | 347 (100.0%) | 0 (0.0%) |
| 15 to 17 Year Olds | 229 (100.0%) | 0 (0.0%) |
| 18 to 19 Year Olds | 41 (100.0%) | 0 (0.0%) |
| 20 to 24 Year Olds | 29 (67.4%) | 14 (32.6%) |
| 25 to 34 Year Olds | 7 (100.0%) | 0 (0.0%) |
| 35 Years and over | 14 (31.8%) | 30 (68.2%) |
| Total | 845 (89.9%) | 95 (10.1%) |
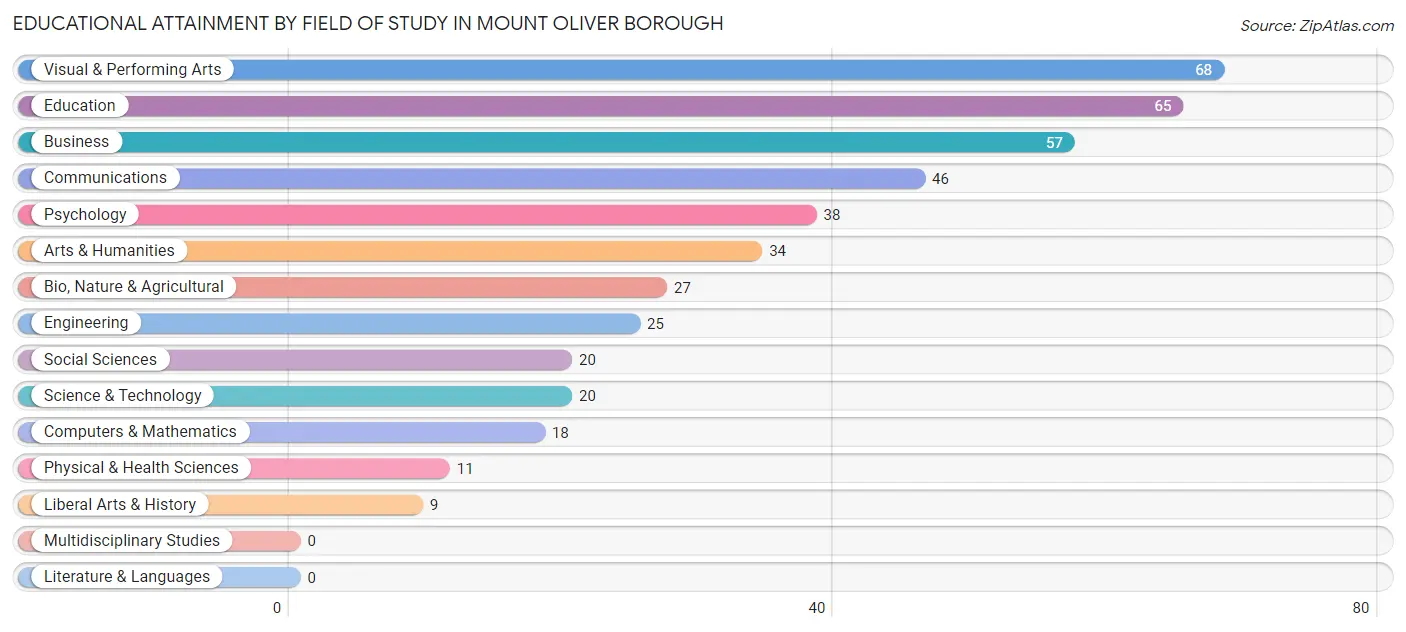
Educational Attainment by Field of Study in Mount Oliver borough
Visual & performing arts (68 | 15.5%), education (65 | 14.8%), business (57 | 13.0%), communications (46 | 10.5%), and psychology (38 | 8.7%) are the most common fields of study among 438 individuals in Mount Oliver borough who have obtained a bachelor's degree or higher.
| Field of Study | # Graduates | % Graduates |
| Computers & Mathematics | 18 | 4.1% |
| Bio, Nature & Agricultural | 27 | 6.2% |
| Physical & Health Sciences | 11 | 2.5% |
| Psychology | 38 | 8.7% |
| Social Sciences | 20 | 4.6% |
| Engineering | 25 | 5.7% |
| Multidisciplinary Studies | 0 | 0.0% |
| Science & Technology | 20 | 4.6% |
| Business | 57 | 13.0% |
| Education | 65 | 14.8% |
| Literature & Languages | 0 | 0.0% |
| Liberal Arts & History | 9 | 2.1% |
| Visual & Performing Arts | 68 | 15.5% |
| Communications | 46 | 10.5% |
| Arts & Humanities | 34 | 7.8% |
| Total | 438 | 100.0% |
Transportation & Commute in Mount Oliver borough
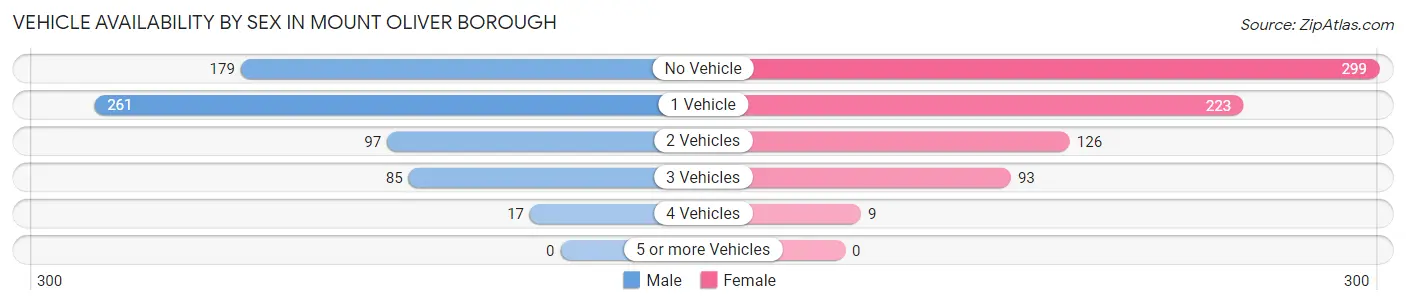
Vehicle Availability by Sex in Mount Oliver borough
The most prevalent vehicle ownership categories in Mount Oliver borough are males with 1 vehicle (261, accounting for 40.8%) and females with 1 vehicle (223, making up 34.8%).
| Vehicles Available | Male | Female |
| No Vehicle | 179 (28.0%) | 299 (39.9%) |
| 1 Vehicle | 261 (40.8%) | 223 (29.7%) |
| 2 Vehicles | 97 (15.2%) | 126 (16.8%) |
| 3 Vehicles | 85 (13.3%) | 93 (12.4%) |
| 4 Vehicles | 17 (2.7%) | 9 (1.2%) |
| 5 or more Vehicles | 0 (0.0%) | 0 (0.0%) |
| Total | 639 (100.0%) | 750 (100.0%) |
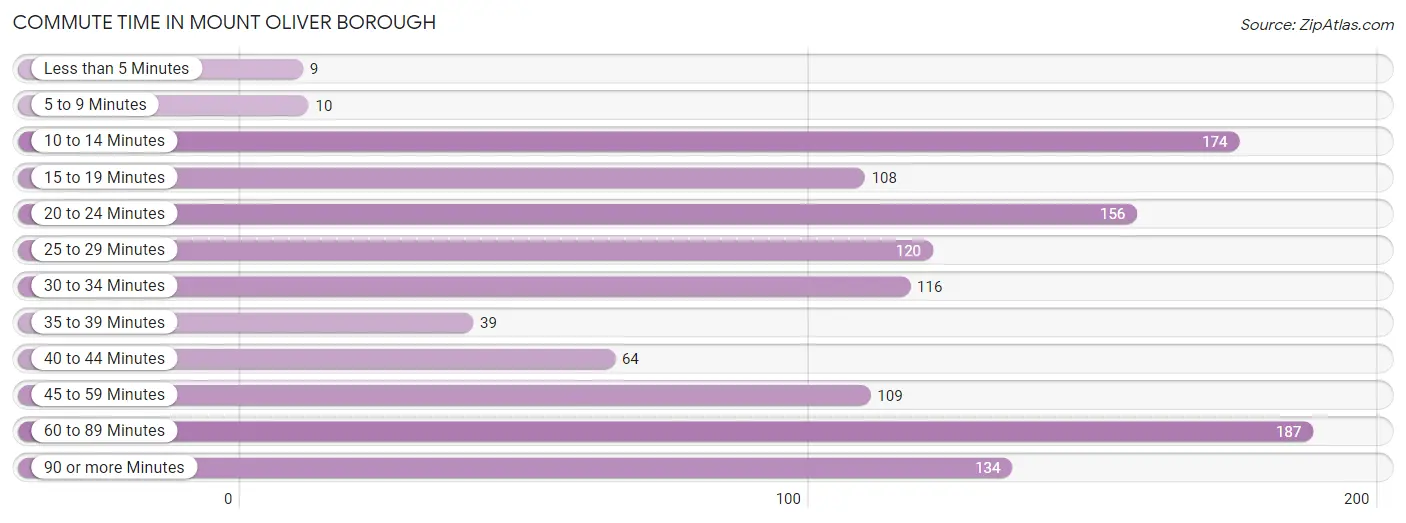
Commute Time in Mount Oliver borough
The most frequently occuring commute durations in Mount Oliver borough are 60 to 89 minutes (187 commuters, 15.2%), 10 to 14 minutes (174 commuters, 14.2%), and 20 to 24 minutes (156 commuters, 12.7%).
| Commute Time | # Commuters | % Commuters |
| Less than 5 Minutes | 9 | 0.7% |
| 5 to 9 Minutes | 10 | 0.8% |
| 10 to 14 Minutes | 174 | 14.2% |
| 15 to 19 Minutes | 108 | 8.8% |
| 20 to 24 Minutes | 156 | 12.7% |
| 25 to 29 Minutes | 120 | 9.8% |
| 30 to 34 Minutes | 116 | 9.5% |
| 35 to 39 Minutes | 39 | 3.2% |
| 40 to 44 Minutes | 64 | 5.2% |
| 45 to 59 Minutes | 109 | 8.9% |
| 60 to 89 Minutes | 187 | 15.2% |
| 90 or more Minutes | 134 | 10.9% |
Commute Time by Sex in Mount Oliver borough
The most common commute times in Mount Oliver borough are 25 to 29 minutes (112 commuters, 20.5%) for males and 60 to 89 minutes (187 commuters, 27.5%) for females.
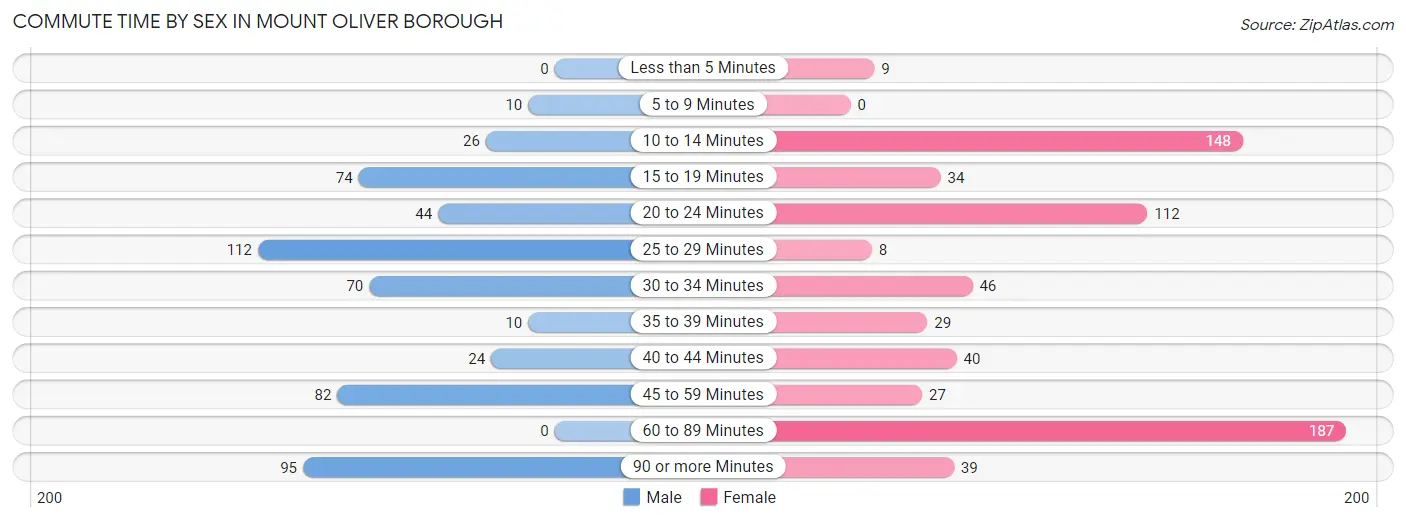
| Commute Time | Male | Female |
| Less than 5 Minutes | 0 (0.0%) | 9 (1.3%) |
| 5 to 9 Minutes | 10 (1.8%) | 0 (0.0%) |
| 10 to 14 Minutes | 26 (4.8%) | 148 (21.8%) |
| 15 to 19 Minutes | 74 (13.5%) | 34 (5.0%) |
| 20 to 24 Minutes | 44 (8.0%) | 112 (16.5%) |
| 25 to 29 Minutes | 112 (20.5%) | 8 (1.2%) |
| 30 to 34 Minutes | 70 (12.8%) | 46 (6.8%) |
| 35 to 39 Minutes | 10 (1.8%) | 29 (4.3%) |
| 40 to 44 Minutes | 24 (4.4%) | 40 (5.9%) |
| 45 to 59 Minutes | 82 (15.0%) | 27 (4.0%) |
| 60 to 89 Minutes | 0 (0.0%) | 187 (27.5%) |
| 90 or more Minutes | 95 (17.4%) | 39 (5.7%) |
Time of Departure to Work by Sex in Mount Oliver borough
The most frequent times of departure to work in Mount Oliver borough are 7:00 AM to 7:29 AM (120, 21.9%) for males and 4:00 PM to 11:59 PM (191, 28.1%) for females.
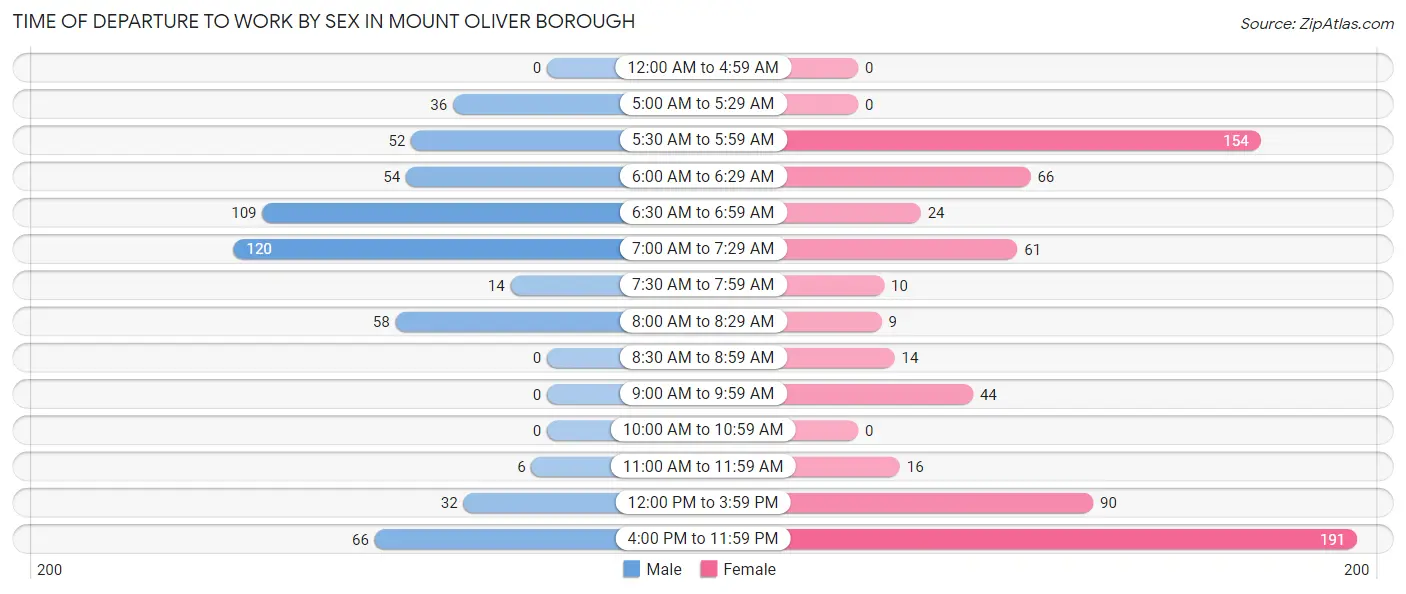
| Time of Departure | Male | Female |
| 12:00 AM to 4:59 AM | 0 (0.0%) | 0 (0.0%) |
| 5:00 AM to 5:29 AM | 36 (6.6%) | 0 (0.0%) |
| 5:30 AM to 5:59 AM | 52 (9.5%) | 154 (22.7%) |
| 6:00 AM to 6:29 AM | 54 (9.9%) | 66 (9.7%) |
| 6:30 AM to 6:59 AM | 109 (19.9%) | 24 (3.5%) |
| 7:00 AM to 7:29 AM | 120 (21.9%) | 61 (9.0%) |
| 7:30 AM to 7:59 AM | 14 (2.6%) | 10 (1.5%) |
| 8:00 AM to 8:29 AM | 58 (10.6%) | 9 (1.3%) |
| 8:30 AM to 8:59 AM | 0 (0.0%) | 14 (2.1%) |
| 9:00 AM to 9:59 AM | 0 (0.0%) | 44 (6.5%) |
| 10:00 AM to 10:59 AM | 0 (0.0%) | 0 (0.0%) |
| 11:00 AM to 11:59 AM | 6 (1.1%) | 16 (2.4%) |
| 12:00 PM to 3:59 PM | 32 (5.9%) | 90 (13.3%) |
| 4:00 PM to 11:59 PM | 66 (12.1%) | 191 (28.1%) |
| Total | 547 (100.0%) | 679 (100.0%) |
Housing Occupancy in Mount Oliver borough
Occupancy by Ownership in Mount Oliver borough
Of the total 1,459 dwellings in Mount Oliver borough, owner-occupied units account for 662 (45.4%), while renter-occupied units make up 797 (54.6%).
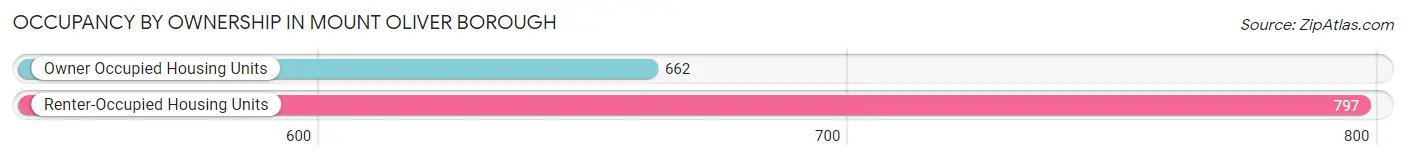
| Occupancy | # Housing Units | % Housing Units |
| Owner Occupied Housing Units | 662 | 45.4% |
| Renter-Occupied Housing Units | 797 | 54.6% |
| Total Occupied Housing Units | 1,459 | 100.0% |
Occupancy by Household Size in Mount Oliver borough
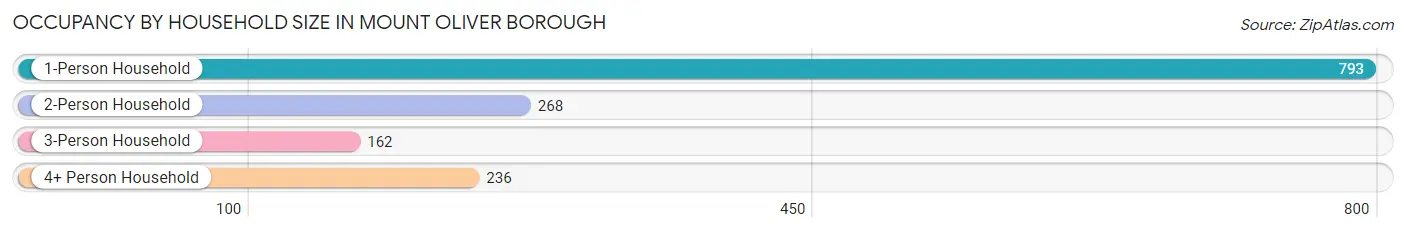
| Household Size | # Housing Units | % Housing Units |
| 1-Person Household | 793 | 54.3% |
| 2-Person Household | 268 | 18.4% |
| 3-Person Household | 162 | 11.1% |
| 4+ Person Household | 236 | 16.2% |
| Total Housing Units | 1,459 | 100.0% |
Occupancy by Ownership by Household Size in Mount Oliver borough
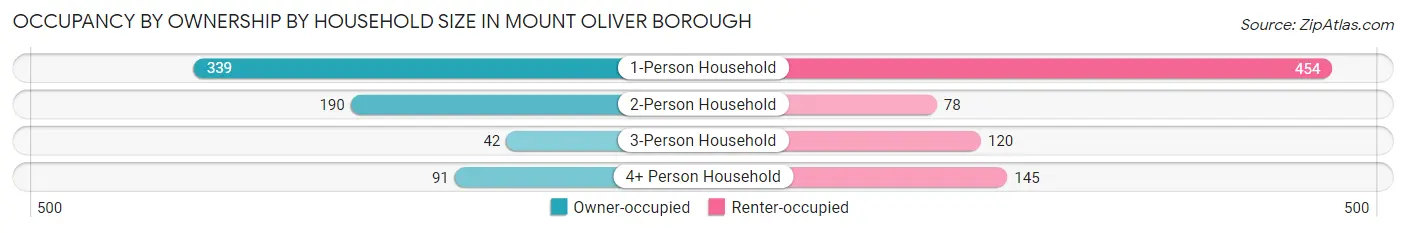
| Household Size | Owner-occupied | Renter-occupied |
| 1-Person Household | 339 (42.7%) | 454 (57.3%) |
| 2-Person Household | 190 (70.9%) | 78 (29.1%) |
| 3-Person Household | 42 (25.9%) | 120 (74.1%) |
| 4+ Person Household | 91 (38.6%) | 145 (61.4%) |
| Total Housing Units | 662 (45.4%) | 797 (54.6%) |
Occupancy by Educational Attainment in Mount Oliver borough
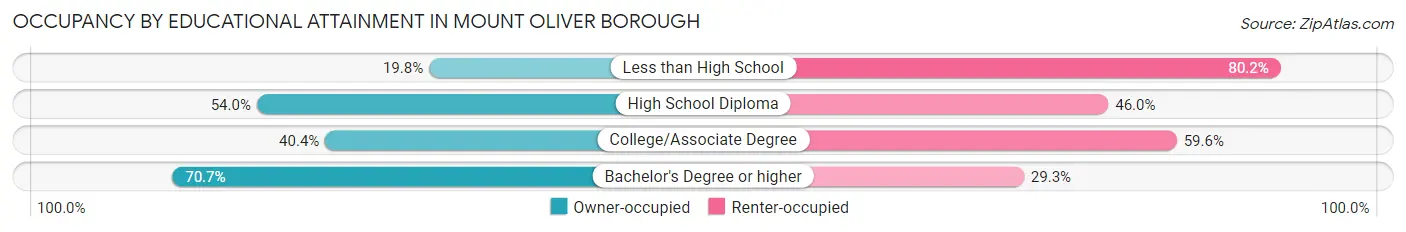
| Household Size | Owner-occupied | Renter-occupied |
| Less than High School | 69 (19.8%) | 279 (80.2%) |
| High School Diploma | 285 (54.0%) | 243 (46.0%) |
| College/Associate Degree | 139 (40.4%) | 205 (59.6%) |
| Bachelor's Degree or higher | 169 (70.7%) | 70 (29.3%) |
Occupancy by Age of Householder in Mount Oliver borough
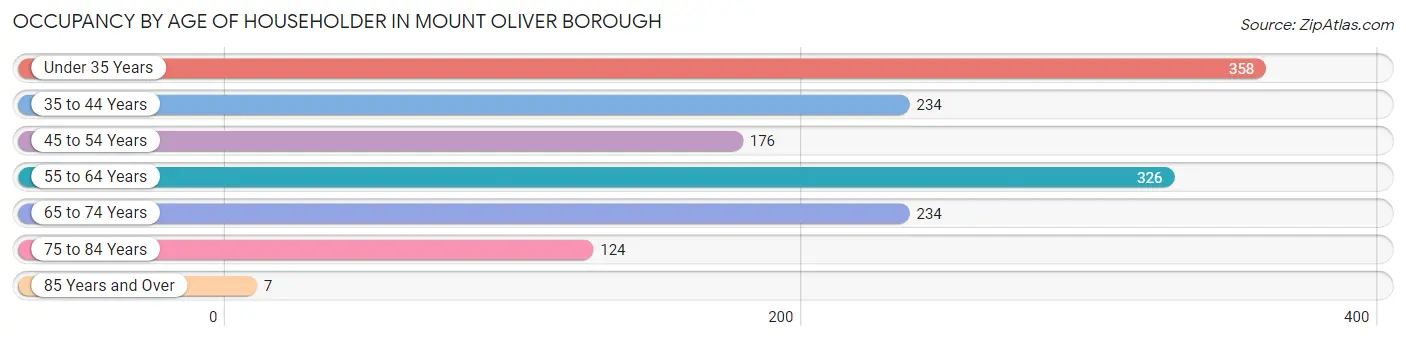
| Age Bracket | # Households | % Households |
| Under 35 Years | 358 | 24.5% |
| 35 to 44 Years | 234 | 16.0% |
| 45 to 54 Years | 176 | 12.1% |
| 55 to 64 Years | 326 | 22.3% |
| 65 to 74 Years | 234 | 16.0% |
| 75 to 84 Years | 124 | 8.5% |
| 85 Years and Over | 7 | 0.5% |
| Total | 1,459 | 100.0% |
Housing Finances in Mount Oliver borough
Median Income by Occupancy in Mount Oliver borough
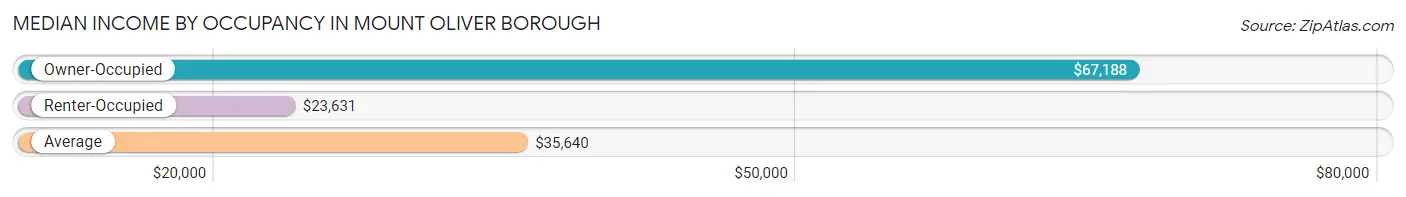
| Occupancy Type | # Households | Median Income |
| Owner-Occupied | 662 (45.4%) | $67,188 |
| Renter-Occupied | 797 (54.6%) | $23,631 |
| Average | 1,459 (100.0%) | $35,640 |
Occupancy by Householder Income Bracket in Mount Oliver borough
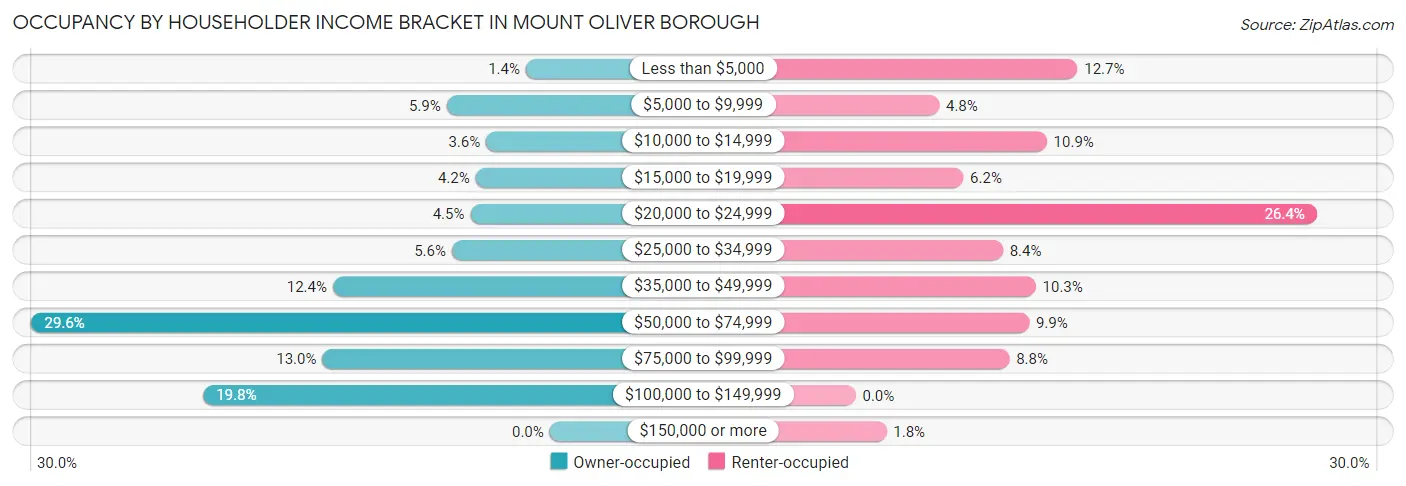
| Income Bracket | Owner-occupied | Renter-occupied |
| Less than $5,000 | 9 (1.4%) | 101 (12.7%) |
| $5,000 to $9,999 | 39 (5.9%) | 38 (4.8%) |
| $10,000 to $14,999 | 24 (3.6%) | 87 (10.9%) |
| $15,000 to $19,999 | 28 (4.2%) | 49 (6.1%) |
| $20,000 to $24,999 | 30 (4.5%) | 210 (26.4%) |
| $25,000 to $34,999 | 37 (5.6%) | 67 (8.4%) |
| $35,000 to $49,999 | 82 (12.4%) | 82 (10.3%) |
| $50,000 to $74,999 | 196 (29.6%) | 79 (9.9%) |
| $75,000 to $99,999 | 86 (13.0%) | 70 (8.8%) |
| $100,000 to $149,999 | 131 (19.8%) | 0 (0.0%) |
| $150,000 or more | 0 (0.0%) | 14 (1.8%) |
| Total | 662 (100.0%) | 797 (100.0%) |
Monthly Housing Cost Tiers in Mount Oliver borough
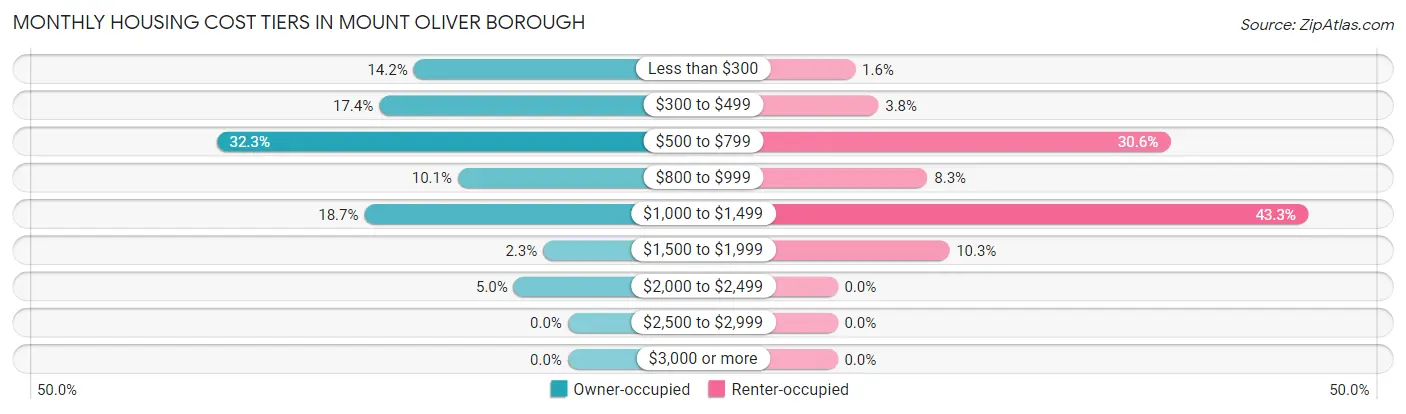
| Monthly Cost | Owner-occupied | Renter-occupied |
| Less than $300 | 94 (14.2%) | 13 (1.6%) |
| $300 to $499 | 115 (17.4%) | 30 (3.8%) |
| $500 to $799 | 214 (32.3%) | 244 (30.6%) |
| $800 to $999 | 67 (10.1%) | 66 (8.3%) |
| $1,000 to $1,499 | 124 (18.7%) | 345 (43.3%) |
| $1,500 to $1,999 | 15 (2.3%) | 82 (10.3%) |
| $2,000 to $2,499 | 33 (5.0%) | 0 (0.0%) |
| $2,500 to $2,999 | 0 (0.0%) | 0 (0.0%) |
| $3,000 or more | 0 (0.0%) | 0 (0.0%) |
| Total | 662 (100.0%) | 797 (100.0%) |
Physical Housing Characteristics in Mount Oliver borough
Housing Structures in Mount Oliver borough
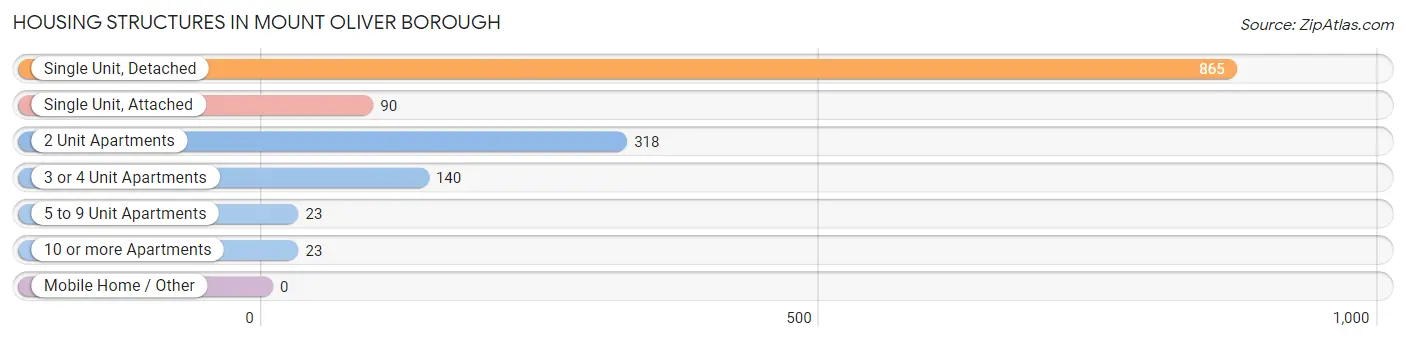
| Structure Type | # Housing Units | % Housing Units |
| Single Unit, Detached | 865 | 59.3% |
| Single Unit, Attached | 90 | 6.2% |
| 2 Unit Apartments | 318 | 21.8% |
| 3 or 4 Unit Apartments | 140 | 9.6% |
| 5 to 9 Unit Apartments | 23 | 1.6% |
| 10 or more Apartments | 23 | 1.6% |
| Mobile Home / Other | 0 | 0.0% |
| Total | 1,459 | 100.0% |
Housing Structures by Occupancy in Mount Oliver borough
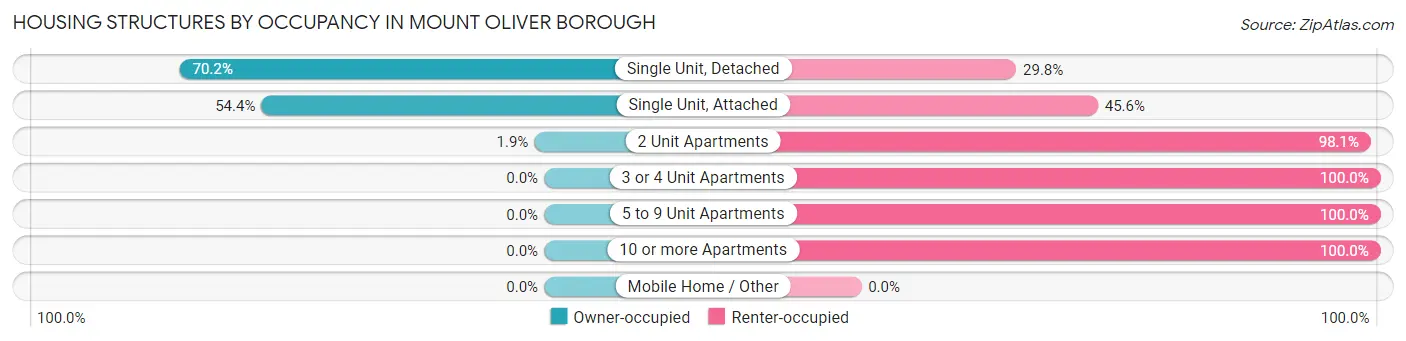
| Structure Type | Owner-occupied | Renter-occupied |
| Single Unit, Detached | 607 (70.2%) | 258 (29.8%) |
| Single Unit, Attached | 49 (54.4%) | 41 (45.6%) |
| 2 Unit Apartments | 6 (1.9%) | 312 (98.1%) |
| 3 or 4 Unit Apartments | 0 (0.0%) | 140 (100.0%) |
| 5 to 9 Unit Apartments | 0 (0.0%) | 23 (100.0%) |
| 10 or more Apartments | 0 (0.0%) | 23 (100.0%) |
| Mobile Home / Other | 0 (0.0%) | 0 (0.0%) |
| Total | 662 (45.4%) | 797 (54.6%) |
Housing Structures by Number of Rooms in Mount Oliver borough
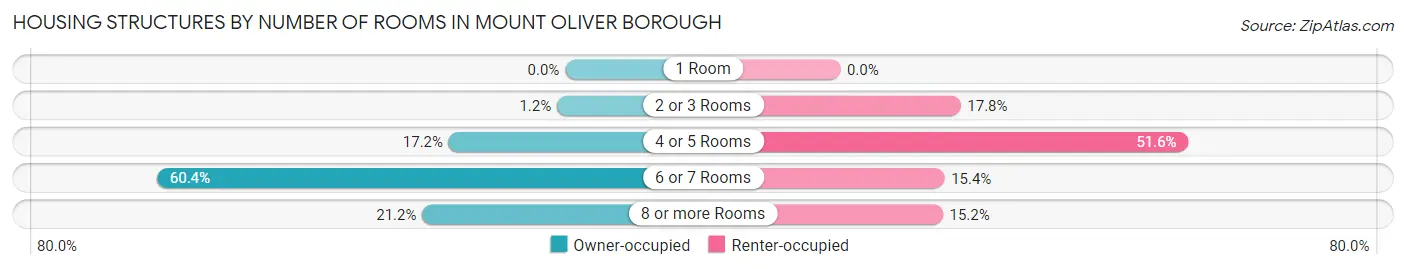
| Number of Rooms | Owner-occupied | Renter-occupied |
| 1 Room | 0 (0.0%) | 0 (0.0%) |
| 2 or 3 Rooms | 8 (1.2%) | 142 (17.8%) |
| 4 or 5 Rooms | 114 (17.2%) | 411 (51.6%) |
| 6 or 7 Rooms | 400 (60.4%) | 123 (15.4%) |
| 8 or more Rooms | 140 (21.1%) | 121 (15.2%) |
| Total | 662 (100.0%) | 797 (100.0%) |
Housing Structure by Heating Type in Mount Oliver borough
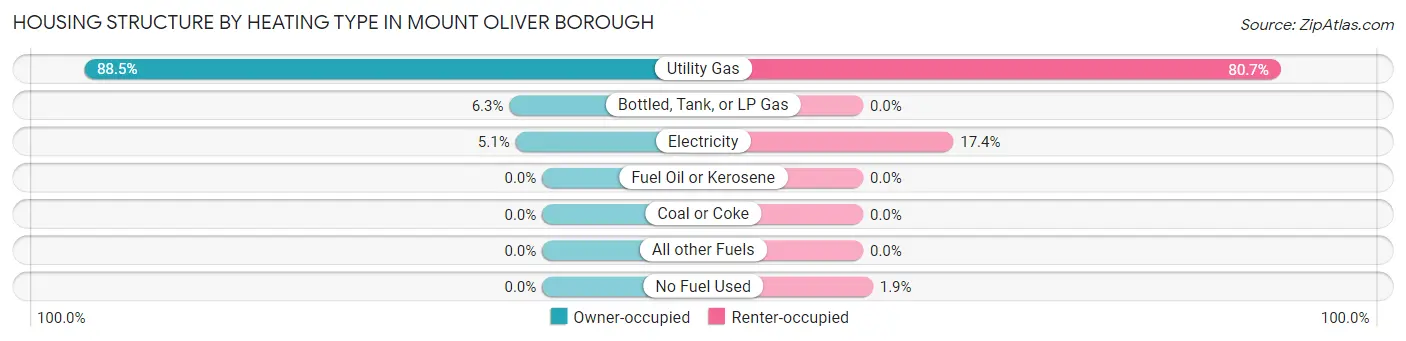
| Heating Type | Owner-occupied | Renter-occupied |
| Utility Gas | 586 (88.5%) | 643 (80.7%) |
| Bottled, Tank, or LP Gas | 42 (6.3%) | 0 (0.0%) |
| Electricity | 34 (5.1%) | 139 (17.4%) |
| Fuel Oil or Kerosene | 0 (0.0%) | 0 (0.0%) |
| Coal or Coke | 0 (0.0%) | 0 (0.0%) |
| All other Fuels | 0 (0.0%) | 0 (0.0%) |
| No Fuel Used | 0 (0.0%) | 15 (1.9%) |
| Total | 662 (100.0%) | 797 (100.0%) |
Household Vehicle Usage in Mount Oliver borough
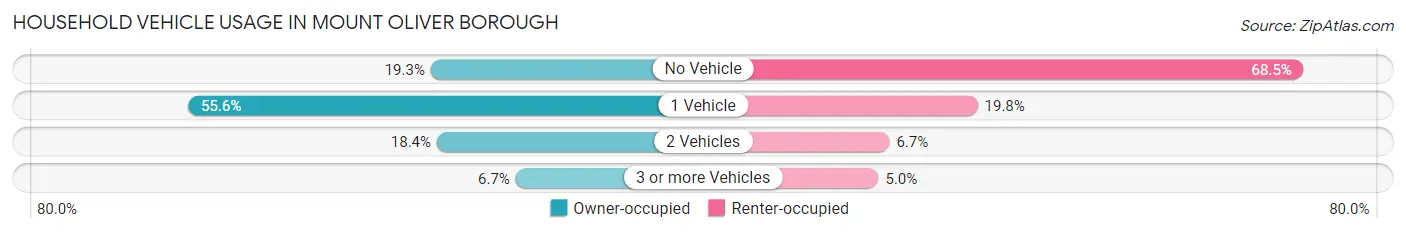
| Vehicles per Household | Owner-occupied | Renter-occupied |
| No Vehicle | 128 (19.3%) | 546 (68.5%) |
| 1 Vehicle | 368 (55.6%) | 158 (19.8%) |
| 2 Vehicles | 122 (18.4%) | 53 (6.7%) |
| 3 or more Vehicles | 44 (6.7%) | 40 (5.0%) |
| Total | 662 (100.0%) | 797 (100.0%) |
Real Estate & Mortgages in Mount Oliver borough
Real Estate and Mortgage Overview in Mount Oliver borough
| Characteristic | Without Mortgage | With Mortgage |
| Housing Units | 355 | 307 |
| Median Property Value | $54,300 | $76,500 |
| Median Household Income | $69,661 | $0 |
| Monthly Housing Costs | $432 | $0 |
| Real Estate Taxes | $884 | $0 |
Property Value by Mortgage Status in Mount Oliver borough
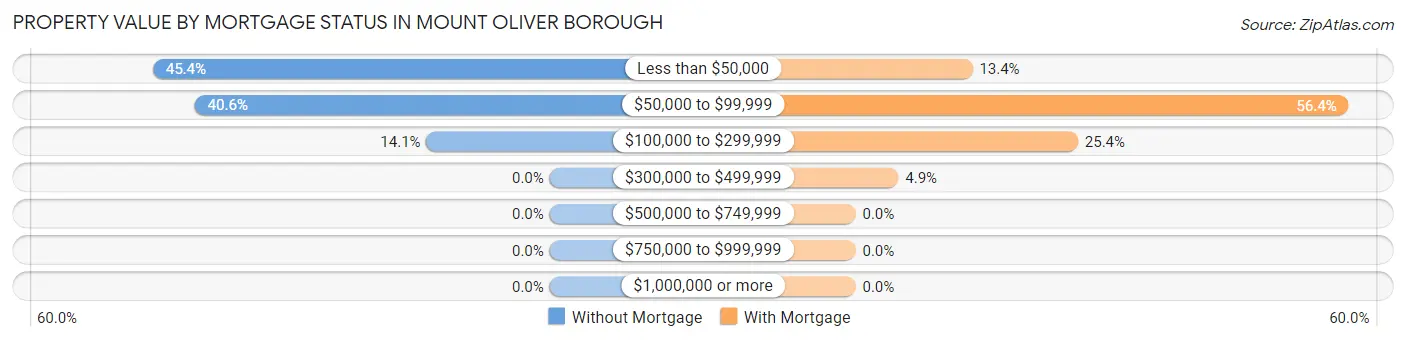
| Property Value | Without Mortgage | With Mortgage |
| Less than $50,000 | 161 (45.4%) | 41 (13.4%) |
| $50,000 to $99,999 | 144 (40.6%) | 173 (56.4%) |
| $100,000 to $299,999 | 50 (14.1%) | 78 (25.4%) |
| $300,000 to $499,999 | 0 (0.0%) | 15 (4.9%) |
| $500,000 to $749,999 | 0 (0.0%) | 0 (0.0%) |
| $750,000 to $999,999 | 0 (0.0%) | 0 (0.0%) |
| $1,000,000 or more | 0 (0.0%) | 0 (0.0%) |
| Total | 355 (100.0%) | 307 (100.0%) |
Household Income by Mortgage Status in Mount Oliver borough
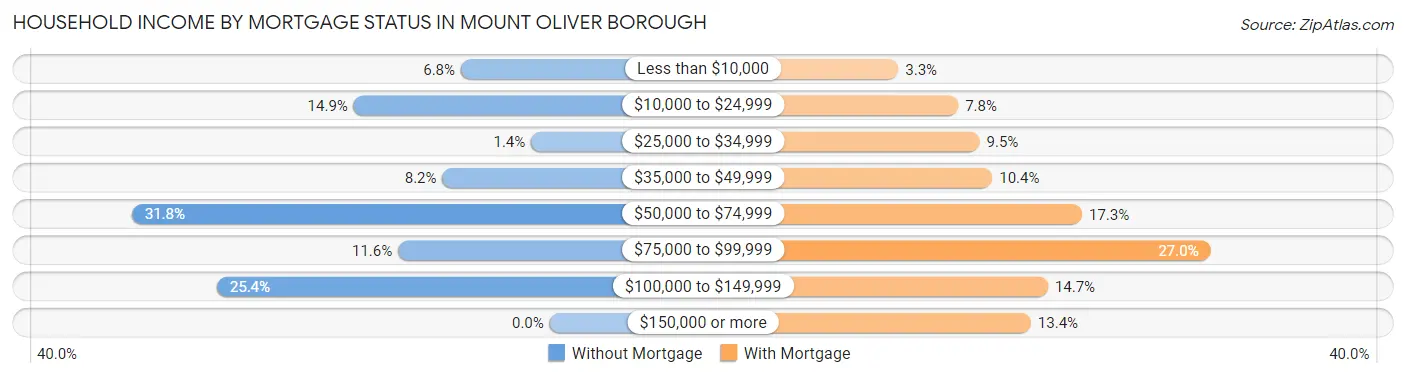
| Household Income | Without Mortgage | With Mortgage |
| Less than $10,000 | 24 (6.8%) | 10 (3.3%) |
| $10,000 to $24,999 | 53 (14.9%) | 24 (7.8%) |
| $25,000 to $34,999 | 5 (1.4%) | 29 (9.5%) |
| $35,000 to $49,999 | 29 (8.2%) | 32 (10.4%) |
| $50,000 to $74,999 | 113 (31.8%) | 53 (17.3%) |
| $75,000 to $99,999 | 41 (11.6%) | 83 (27.0%) |
| $100,000 to $149,999 | 90 (25.4%) | 45 (14.7%) |
| $150,000 or more | 0 (0.0%) | 41 (13.4%) |
| Total | 355 (100.0%) | 307 (100.0%) |
Property Value to Household Income Ratio in Mount Oliver borough
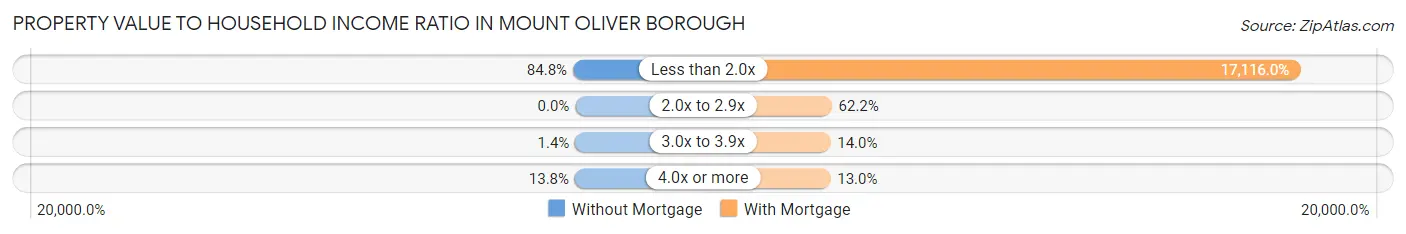
| Value-to-Income Ratio | Without Mortgage | With Mortgage |
| Less than 2.0x | 301 (84.8%) | 52,546 (17,116.0%) |
| 2.0x to 2.9x | 0 (0.0%) | 191 (62.2%) |
| 3.0x to 3.9x | 5 (1.4%) | 43 (14.0%) |
| 4.0x or more | 49 (13.8%) | 40 (13.0%) |
| Total | 355 (100.0%) | 307 (100.0%) |
Real Estate Taxes by Mortgage Status in Mount Oliver borough
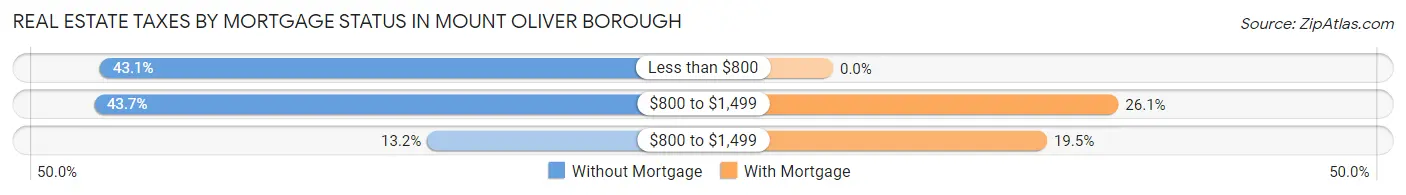
| Property Taxes | Without Mortgage | With Mortgage |
| Less than $800 | 153 (43.1%) | 0 (0.0%) |
| $800 to $1,499 | 155 (43.7%) | 80 (26.1%) |
| $800 to $1,499 | 47 (13.2%) | 60 (19.5%) |
| Total | 355 (100.0%) | 307 (100.0%) |
Health & Disability in Mount Oliver borough
Health Insurance Coverage by Age in Mount Oliver borough
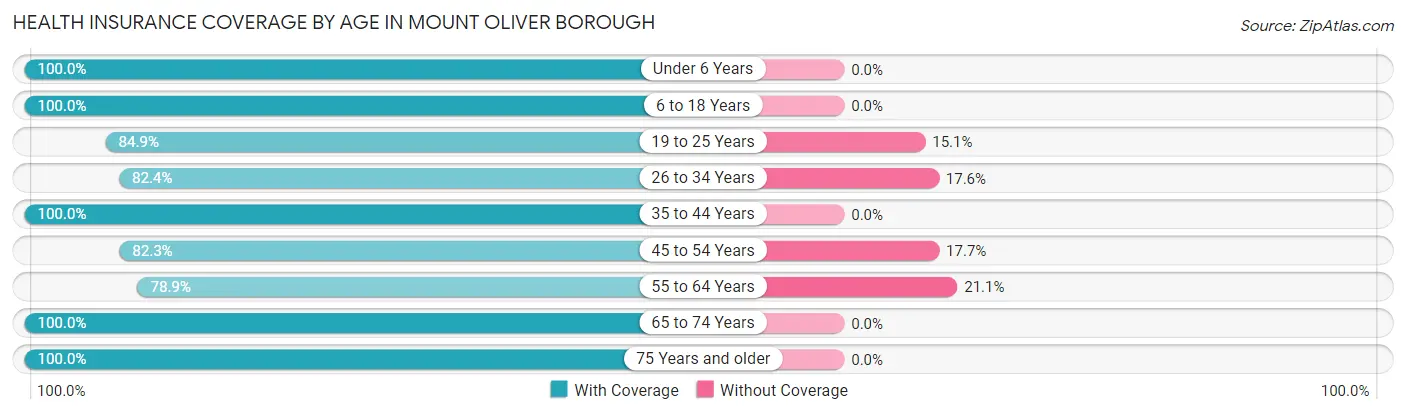
| Age Bracket | With Coverage | Without Coverage |
| Under 6 Years | 177 (100.0%) | 0 (0.0%) |
| 6 to 18 Years | 768 (100.0%) | 0 (0.0%) |
| 19 to 25 Years | 118 (84.9%) | 21 (15.1%) |
| 26 to 34 Years | 458 (82.4%) | 98 (17.6%) |
| 35 to 44 Years | 347 (100.0%) | 0 (0.0%) |
| 45 to 54 Years | 335 (82.3%) | 72 (17.7%) |
| 55 to 64 Years | 408 (78.9%) | 109 (21.1%) |
| 65 to 74 Years | 299 (100.0%) | 0 (0.0%) |
| 75 Years and older | 147 (100.0%) | 0 (0.0%) |
| Total | 3,057 (91.1%) | 300 (8.9%) |
Health Insurance Coverage by Citizenship Status in Mount Oliver borough
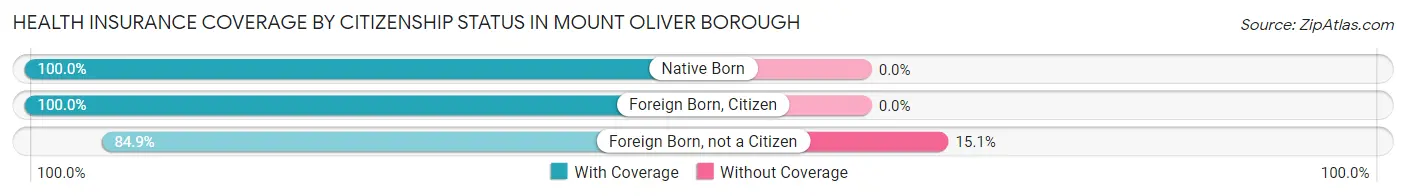
| Citizenship Status | With Coverage | Without Coverage |
| Native Born | 177 (100.0%) | 0 (0.0%) |
| Foreign Born, Citizen | 768 (100.0%) | 0 (0.0%) |
| Foreign Born, not a Citizen | 118 (84.9%) | 21 (15.1%) |
Health Insurance Coverage by Household Income in Mount Oliver borough
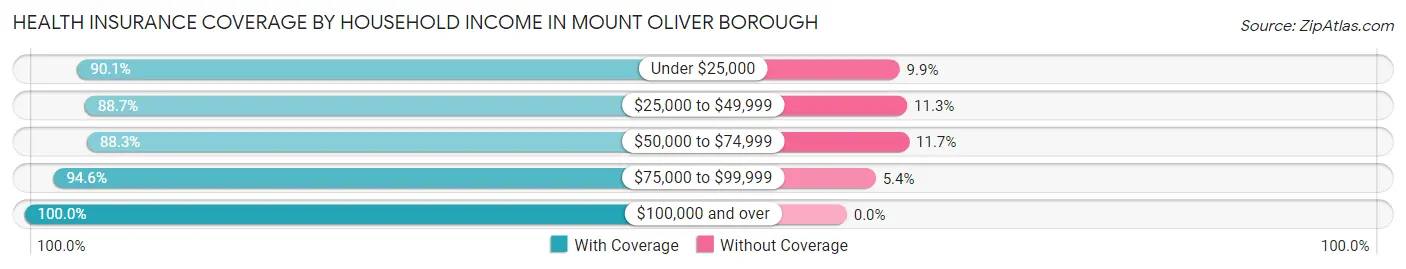
| Household Income | With Coverage | Without Coverage |
| Under $25,000 | 892 (90.1%) | 98 (9.9%) |
| $25,000 to $49,999 | 753 (88.7%) | 96 (11.3%) |
| $50,000 to $74,999 | 620 (88.3%) | 82 (11.7%) |
| $75,000 to $99,999 | 419 (94.6%) | 24 (5.4%) |
| $100,000 and over | 373 (100.0%) | 0 (0.0%) |
Public vs Private Health Insurance Coverage by Age in Mount Oliver borough
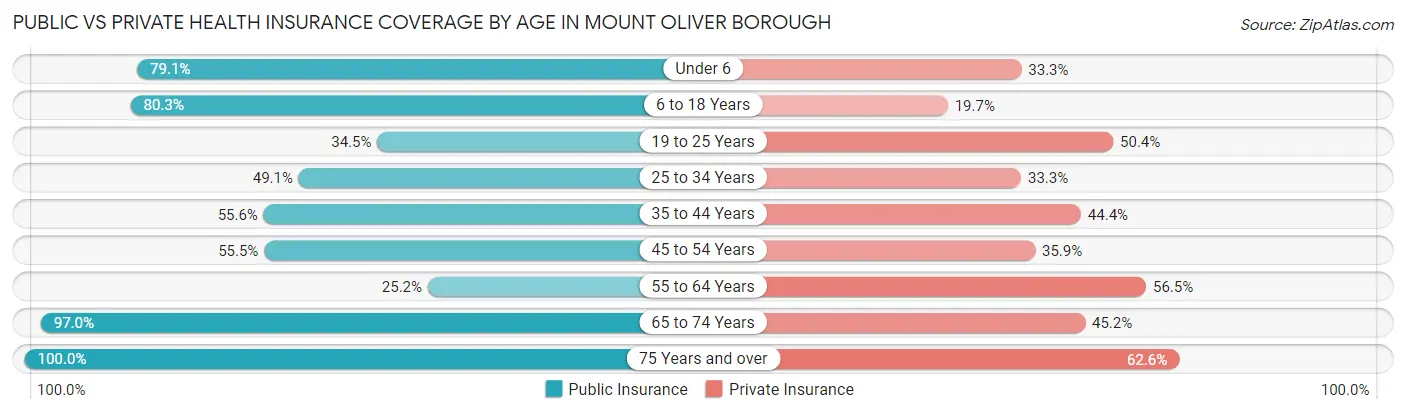
| Age Bracket | Public Insurance | Private Insurance |
| Under 6 | 140 (79.1%) | 59 (33.3%) |
| 6 to 18 Years | 617 (80.3%) | 151 (19.7%) |
| 19 to 25 Years | 48 (34.5%) | 70 (50.4%) |
| 25 to 34 Years | 273 (49.1%) | 185 (33.3%) |
| 35 to 44 Years | 193 (55.6%) | 154 (44.4%) |
| 45 to 54 Years | 226 (55.5%) | 146 (35.9%) |
| 55 to 64 Years | 130 (25.2%) | 292 (56.5%) |
| 65 to 74 Years | 290 (97.0%) | 135 (45.2%) |
| 75 Years and over | 147 (100.0%) | 92 (62.6%) |
| Total | 2,064 (61.5%) | 1,284 (38.3%) |
Disability Status by Sex by Age in Mount Oliver borough
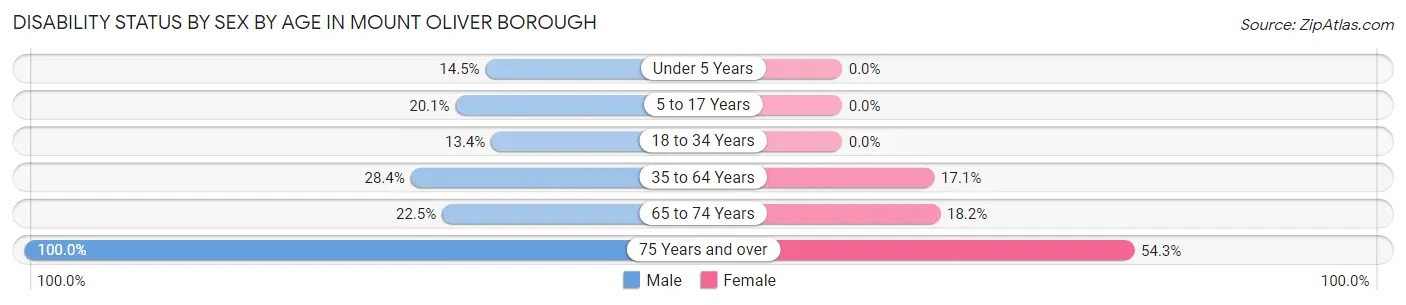
| Age Bracket | Male | Female |
| Under 5 Years | 22 (14.5%) | 0 (0.0%) |
| 5 to 17 Years | 70 (20.1%) | 0 (0.0%) |
| 18 to 34 Years | 35 (13.4%) | 0 (0.0%) |
| 35 to 64 Years | 200 (28.4%) | 97 (17.1%) |
| 65 to 74 Years | 34 (22.5%) | 27 (18.2%) |
| 75 Years and over | 53 (100.0%) | 51 (54.3%) |
Disability Class by Sex by Age in Mount Oliver borough
Disability Class: Hearing Difficulty
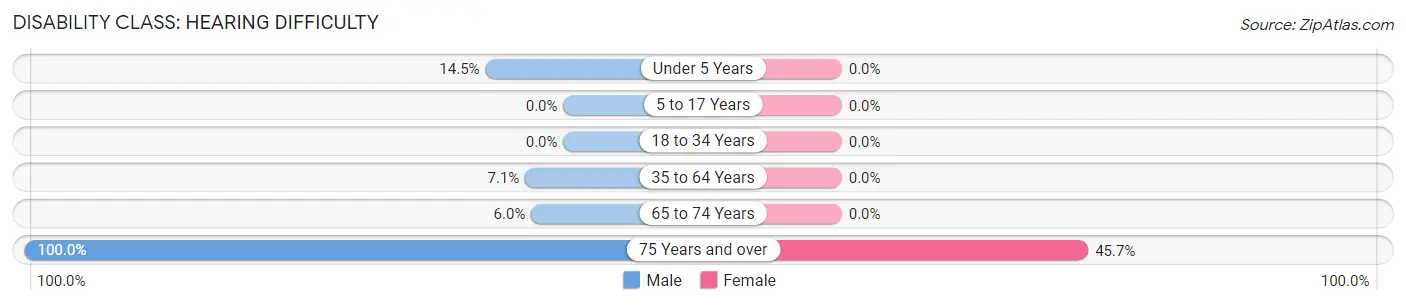
| Age Bracket | Male | Female |
| Under 5 Years | 22 (14.5%) | 0 (0.0%) |
| 5 to 17 Years | 0 (0.0%) | 0 (0.0%) |
| 18 to 34 Years | 0 (0.0%) | 0 (0.0%) |
| 35 to 64 Years | 50 (7.1%) | 0 (0.0%) |
| 65 to 74 Years | 9 (6.0%) | 0 (0.0%) |
| 75 Years and over | 53 (100.0%) | 43 (45.7%) |
Disability Class: Vision Difficulty
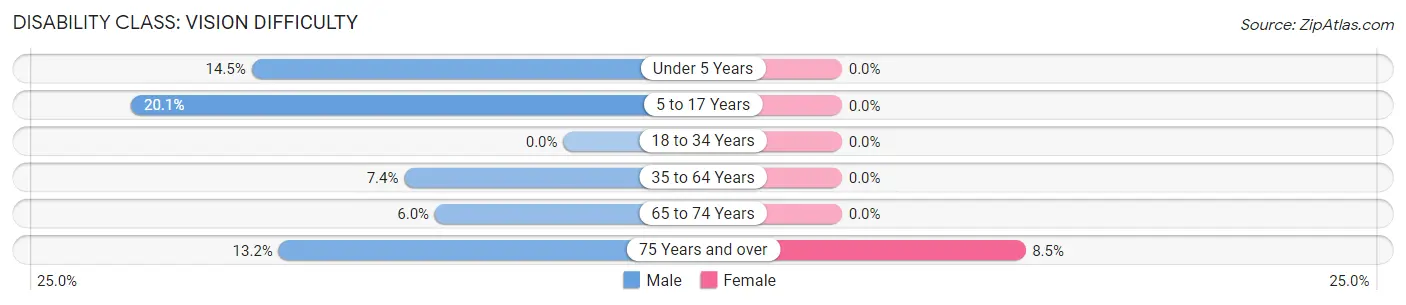
| Age Bracket | Male | Female |
| Under 5 Years | 22 (14.5%) | 0 (0.0%) |
| 5 to 17 Years | 70 (20.1%) | 0 (0.0%) |
| 18 to 34 Years | 0 (0.0%) | 0 (0.0%) |
| 35 to 64 Years | 52 (7.4%) | 0 (0.0%) |
| 65 to 74 Years | 9 (6.0%) | 0 (0.0%) |
| 75 Years and over | 7 (13.2%) | 8 (8.5%) |
Disability Class: Cognitive Difficulty
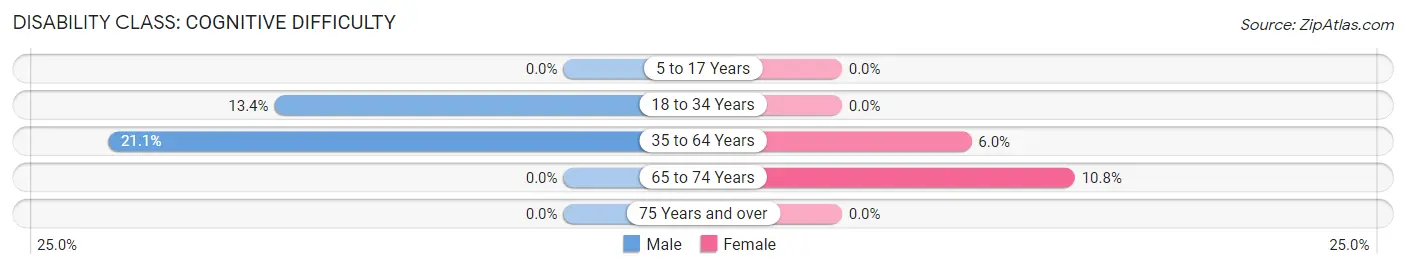
| Age Bracket | Male | Female |
| 5 to 17 Years | 0 (0.0%) | 0 (0.0%) |
| 18 to 34 Years | 35 (13.4%) | 0 (0.0%) |
| 35 to 64 Years | 149 (21.1%) | 34 (6.0%) |
| 65 to 74 Years | 0 (0.0%) | 16 (10.8%) |
| 75 Years and over | 0 (0.0%) | 0 (0.0%) |
Disability Class: Ambulatory Difficulty
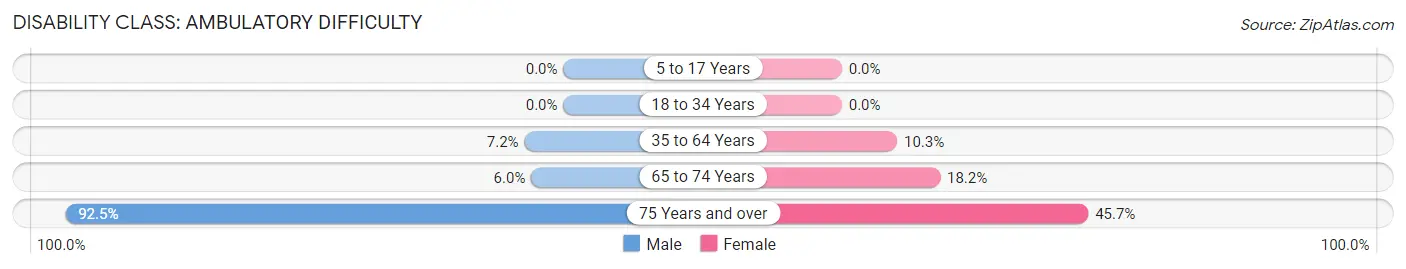
| Age Bracket | Male | Female |
| 5 to 17 Years | 0 (0.0%) | 0 (0.0%) |
| 18 to 34 Years | 0 (0.0%) | 0 (0.0%) |
| 35 to 64 Years | 51 (7.2%) | 58 (10.2%) |
| 65 to 74 Years | 9 (6.0%) | 27 (18.2%) |
| 75 Years and over | 49 (92.4%) | 43 (45.7%) |
Disability Class: Self-Care Difficulty
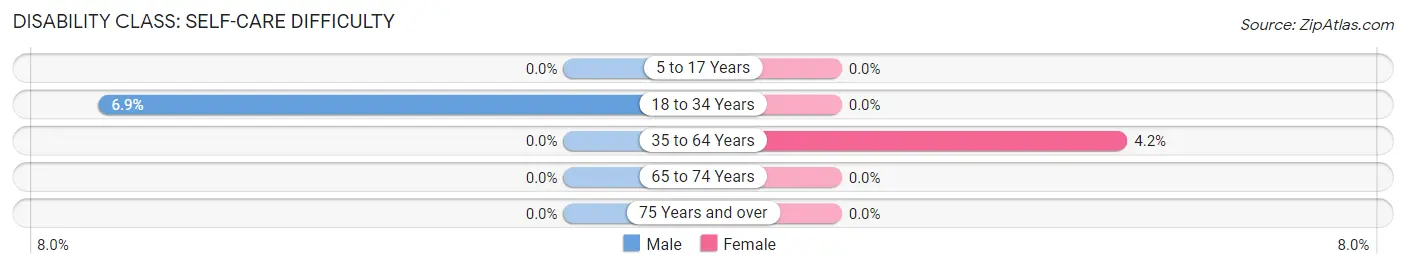
| Age Bracket | Male | Female |
| 5 to 17 Years | 0 (0.0%) | 0 (0.0%) |
| 18 to 34 Years | 18 (6.9%) | 0 (0.0%) |
| 35 to 64 Years | 0 (0.0%) | 24 (4.2%) |
| 65 to 74 Years | 0 (0.0%) | 0 (0.0%) |
| 75 Years and over | 0 (0.0%) | 0 (0.0%) |
Technology Access in Mount Oliver borough
Computing Device Access in Mount Oliver borough
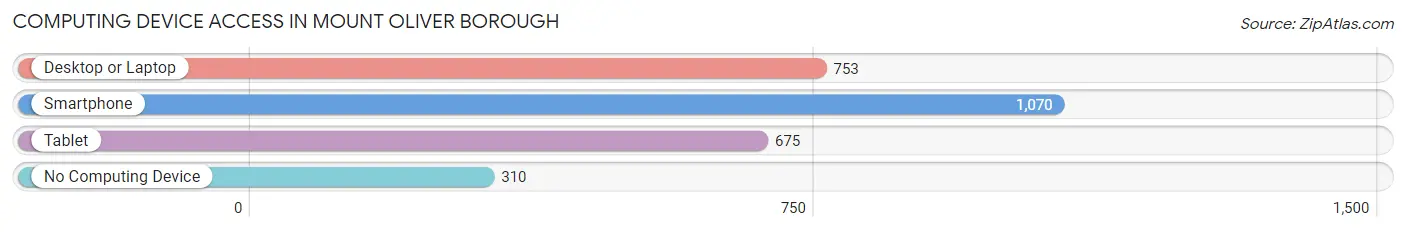
| Device Type | # Households | % Households |
| Desktop or Laptop | 753 | 51.6% |
| Smartphone | 1,070 | 73.3% |
| Tablet | 675 | 46.3% |
| No Computing Device | 310 | 21.2% |
| Total | 1,459 | 100.0% |
Internet Access in Mount Oliver borough
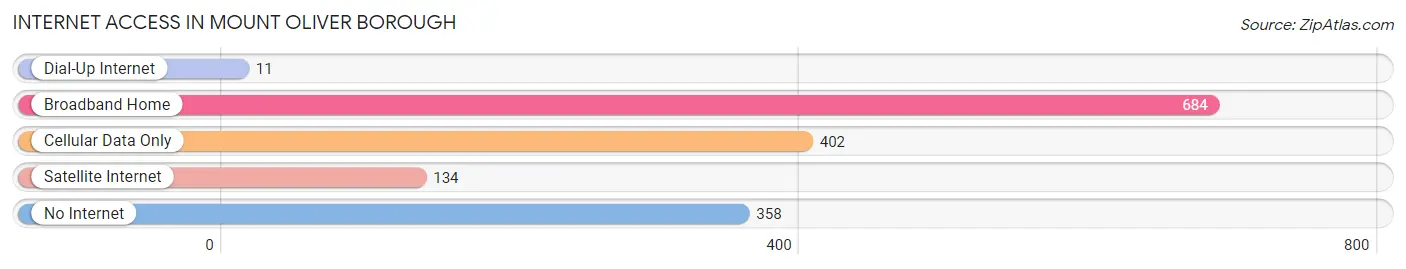
| Internet Type | # Households | % Households |
| Dial-Up Internet | 11 | 0.7% |
| Broadband Home | 684 | 46.9% |
| Cellular Data Only | 402 | 27.6% |
| Satellite Internet | 134 | 9.2% |
| No Internet | 358 | 24.5% |
| Total | 1,459 | 100.0% |
Mount Oliver borough Summary
Oliver Borough is a small borough located in Allegheny County, Pennsylvania. It is situated on the south side of the city of Pittsburgh, and is bordered by the neighborhoods of Mount Washington, Allentown, and Knoxville. The borough was incorporated in 1892 and is home to approximately 1,400 residents.
History
The area that is now Mount Oliver Borough was originally inhabited by the Lenape Native Americans. The first European settlers arrived in the area in the late 1700s, and the area was known as “Mount Oliver” by the early 1800s. The name was derived from the Oliver family, who were among the first settlers in the area.
In 1892, the area was officially incorporated as a borough. The borough was originally a coal mining town, and the coal industry was the primary source of employment for the residents. The coal industry declined in the early 1900s, and the borough began to transition to a more residential area.
Geography
Mount Oliver Borough is located in Allegheny County, Pennsylvania. It is situated on the south side of the city of Pittsburgh, and is bordered by the neighborhoods of Mount Washington, Allentown, and Knoxville. The borough covers an area of 0.6 square miles, and is located at an elevation of 1,000 feet.
The borough is located in the Allegheny Plateau region of Pennsylvania, and is characterized by rolling hills and valleys. The borough is located in the Monongahela River watershed, and is home to several small creeks and streams.
Economy
The economy of Mount Oliver Borough is largely based on the service industry. The borough is home to several small businesses, including restaurants, retail stores, and professional services. The borough is also home to several manufacturing companies, including a steel mill and a paper mill.
The borough is also home to several educational institutions, including a public school district and a community college. The borough is also home to several churches, and is served by several public transportation routes.
Demographics
As of the 2010 census, the population of Mount Oliver Borough was 1,440. The racial makeup of the borough was 94.3% White, 2.7% African American, 0.2% Native American, 0.7% Asian, and 1.9% from other races. Hispanic or Latino of any race were 2.2% of the population.
The median household income in the borough was $30,938, and the median family income was $37,500. The per capita income in the borough was $17,845. About 16.2% of the population was below the poverty line.
Conclusion
Mount Oliver Borough is a small borough located in Allegheny County, Pennsylvania. It is situated on the south side of the city of Pittsburgh, and is bordered by the neighborhoods of Mount Washington, Allentown, and Knoxville. The borough was incorporated in 1892 and is home to approximately 1,400 residents. The economy of the borough is largely based on the service industry, and the borough is home to several small businesses, manufacturing companies, educational institutions, and churches. The population of the borough is largely white, with a small percentage of African American, Native American, Asian, and other races. The median household income in the borough is $30,938, and the per capita income is $17,845.
Common Questions
What is Per Capita Income in Mount Oliver borough?
Per Capita income in Mount Oliver borough is $21,794.
What is the Median Family Income in Mount Oliver borough?
Median Family Income in Mount Oliver borough is $52,125.
What is the Median Household income in Mount Oliver borough?
Median Household Income in Mount Oliver borough is $35,640.
What is Income or Wage Gap in Mount Oliver borough?
Income or Wage Gap in Mount Oliver borough is 37.4%.
Women in Mount Oliver borough earn 62.6 cents for every dollar earned by a man.
What is Inequality or Gini Index in Mount Oliver borough?
Inequality or Gini Index in Mount Oliver borough is 0.45.
What is the Total Population of Mount Oliver borough?
Total Population of Mount Oliver borough is 3,357.
What is the Total Male Population of Mount Oliver borough?
Total Male Population of Mount Oliver borough is 1,671.
What is the Total Female Population of Mount Oliver borough?
Total Female Population of Mount Oliver borough is 1,686.
What is the Ratio of Males per 100 Females in Mount Oliver borough?
There are 99.11 Males per 100 Females in Mount Oliver borough.
What is the Ratio of Females per 100 Males in Mount Oliver borough?
There are 100.90 Females per 100 Males in Mount Oliver borough.
What is the Median Population Age in Mount Oliver borough?
Median Population Age in Mount Oliver borough is 36.5 Years.
What is the Average Family Size in Mount Oliver borough
Average Family Size in Mount Oliver borough is 3.6 People.
What is the Average Household Size in Mount Oliver borough
Average Household Size in Mount Oliver borough is 2.3 People.
How Large is the Labor Force in Mount Oliver borough?
There are 1,560 People in the Labor Forcein in Mount Oliver borough.
What is the Percentage of People in the Labor Force in Mount Oliver borough?
59.4% of People are in the Labor Force in Mount Oliver borough.
What is the Unemployment Rate in Mount Oliver borough?
Unemployment Rate in Mount Oliver borough is 10.1%.