Washingtonville borough, PA Map & Demographics
Washingtonville borough Overview
$23,940
PER CAPITA INCOME
$46,250
AVG HOUSEHOLD INCOME
68.4%
WAGE / INCOME GAP [ % ]
31.6¢/ $1
WAGE / INCOME GAP [ $ ]
0.42
INEQUALITY / GINI INDEX
221
TOTAL POPULATION
112
MALE POPULATION
109
FEMALE POPULATION
102.75
MALES / 100 FEMALES
97.32
FEMALES / 100 MALES
37.3
MEDIAN AGE
2.3
AVG FAMILY SIZE
2.0
AVG HOUSEHOLD SIZE
107
LABOR FORCE [ PEOPLE ]
60.1%
PERCENT IN LABOR FORCE
0.9%
UNEMPLOYMENT RATE
Income in Washingtonville borough
Income Overview in Washingtonville borough
| Characteristic | Number | Measure |
| Per Capita Income | 221 | $23,940 |
| Median Family Income | 69 | $0 |
| Mean Family Income | 69 | $49,626 |
| Median Household Income | 108 | $46,250 |
| Mean Household Income | 108 | $54,344 |
| Income Deficit | 69 | $0 |
| Wage / Income Gap (%) | 221 | 68.35% |
| Wage / Income Gap ($) | 221 | 31.65¢ per $1 |
| Gini / Inequality Index | 221 | 0.42 |
Earnings by Sex in Washingtonville borough
Average Earnings in Washingtonville borough are $32,857, $69,250 for men and $21,917 for women, a difference of 68.3%.
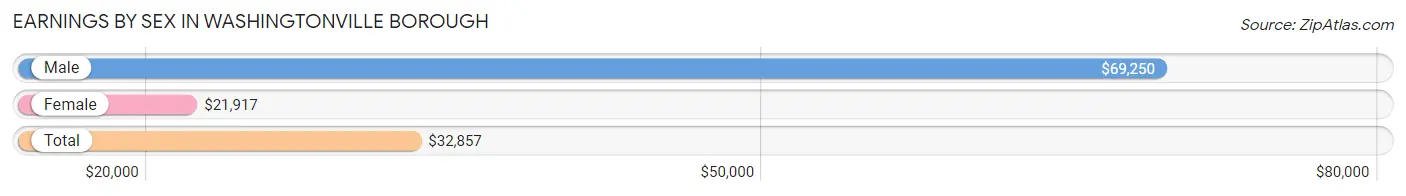
| Sex | Number | Average Earnings |
| Male | 51 (47.2%) | $69,250 |
| Female | 57 (52.8%) | $21,917 |
| Total | 108 (100.0%) | $32,857 |
Earnings by Sex by Income Bracket in Washingtonville borough
The most common earnings brackets in Washingtonville borough are $75,000 to $99,999 for men (17 | 33.3%) and $20,000 to $22,499 for women (15 | 26.3%).
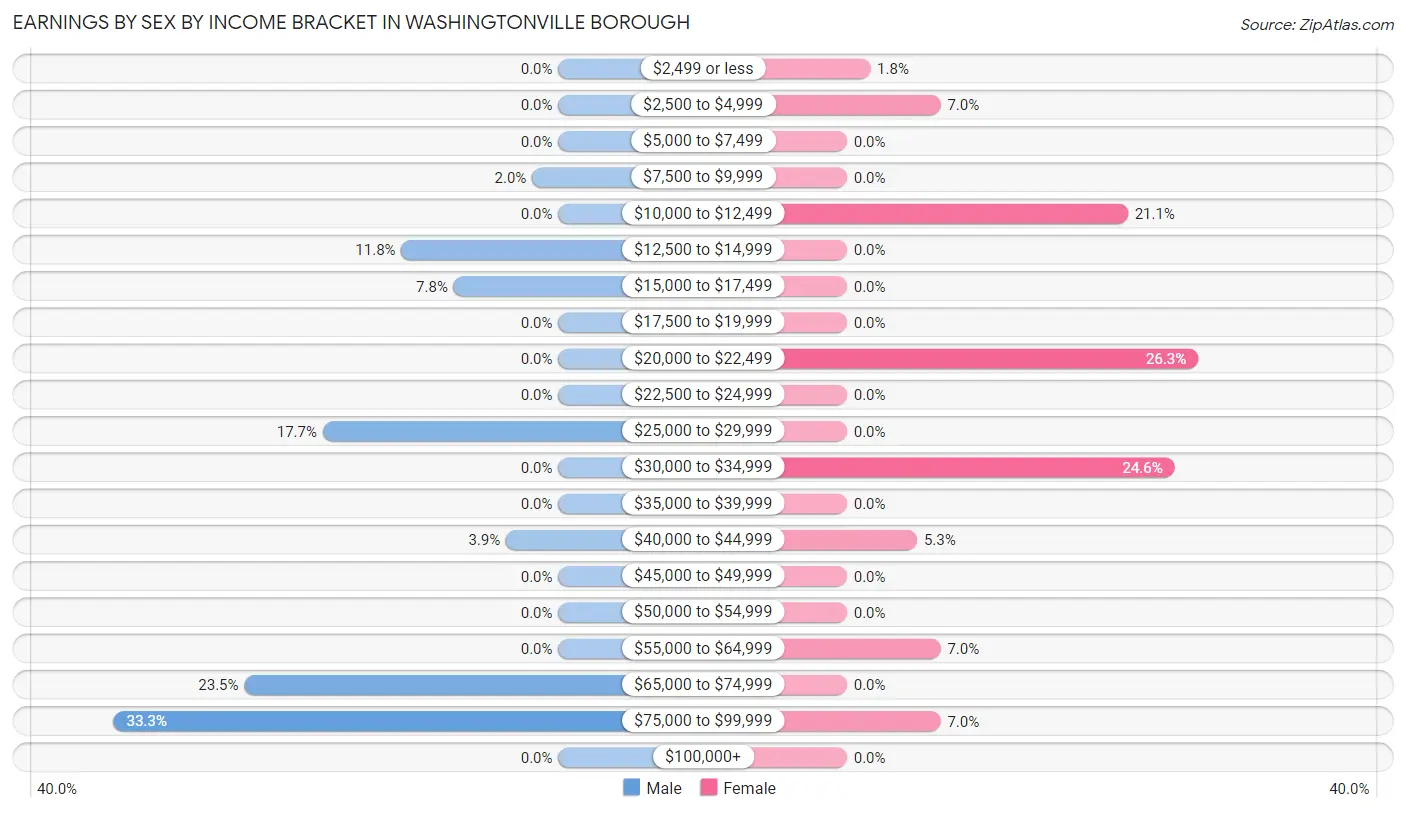
| Income | Male | Female |
| $2,499 or less | 0 (0.0%) | 1 (1.8%) |
| $2,500 to $4,999 | 0 (0.0%) | 4 (7.0%) |
| $5,000 to $7,499 | 0 (0.0%) | 0 (0.0%) |
| $7,500 to $9,999 | 1 (2.0%) | 0 (0.0%) |
| $10,000 to $12,499 | 0 (0.0%) | 12 (21.0%) |
| $12,500 to $14,999 | 6 (11.8%) | 0 (0.0%) |
| $15,000 to $17,499 | 4 (7.8%) | 0 (0.0%) |
| $17,500 to $19,999 | 0 (0.0%) | 0 (0.0%) |
| $20,000 to $22,499 | 0 (0.0%) | 15 (26.3%) |
| $22,500 to $24,999 | 0 (0.0%) | 0 (0.0%) |
| $25,000 to $29,999 | 9 (17.6%) | 0 (0.0%) |
| $30,000 to $34,999 | 0 (0.0%) | 14 (24.6%) |
| $35,000 to $39,999 | 0 (0.0%) | 0 (0.0%) |
| $40,000 to $44,999 | 2 (3.9%) | 3 (5.3%) |
| $45,000 to $49,999 | 0 (0.0%) | 0 (0.0%) |
| $50,000 to $54,999 | 0 (0.0%) | 0 (0.0%) |
| $55,000 to $64,999 | 0 (0.0%) | 4 (7.0%) |
| $65,000 to $74,999 | 12 (23.5%) | 0 (0.0%) |
| $75,000 to $99,999 | 17 (33.3%) | 4 (7.0%) |
| $100,000+ | 0 (0.0%) | 0 (0.0%) |
| Total | 51 (100.0%) | 57 (100.0%) |
Earnings by Sex by Educational Attainment in Washingtonville borough
Average earnings in Washingtonville borough are $73,571 for men and $32,768 for women, a difference of 55.5%. Men with an educational attainment of high school diploma enjoy the highest average annual earnings of $73,929, while those with high school diploma education earn the least with $73,929. Women with an educational attainment of high school diploma earn the most with the average annual earnings of $11,250, while those with high school diploma education have the smallest earnings of $11,250.
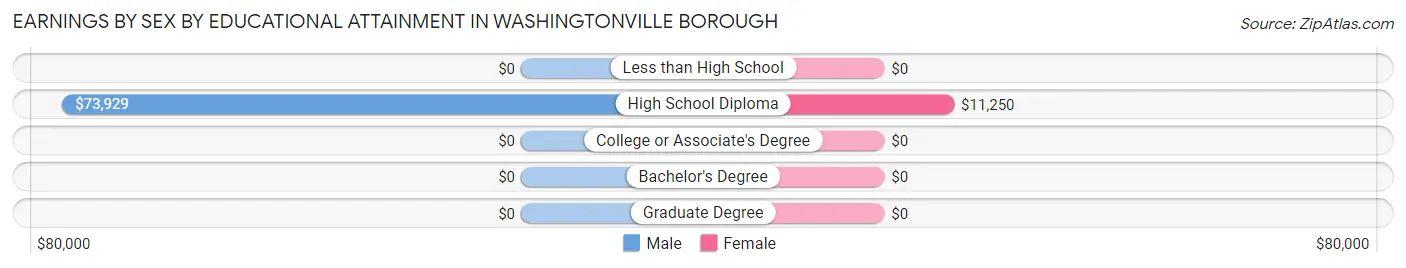
| Educational Attainment | Male Income | Female Income |
| Less than High School | - | - |
| High School Diploma | $73,929 | $11,250 |
| College or Associate's Degree | - | - |
| Bachelor's Degree | - | - |
| Graduate Degree | - | - |
| Total | $73,571 | $32,768 |
Family Income in Washingtonville borough
Family Income Brackets in Washingtonville borough
According to the Washingtonville borough family income data, there are 18 families falling into the $100,000 to $149,999 income range, which is the most common income bracket and makes up 26.1% of all families.
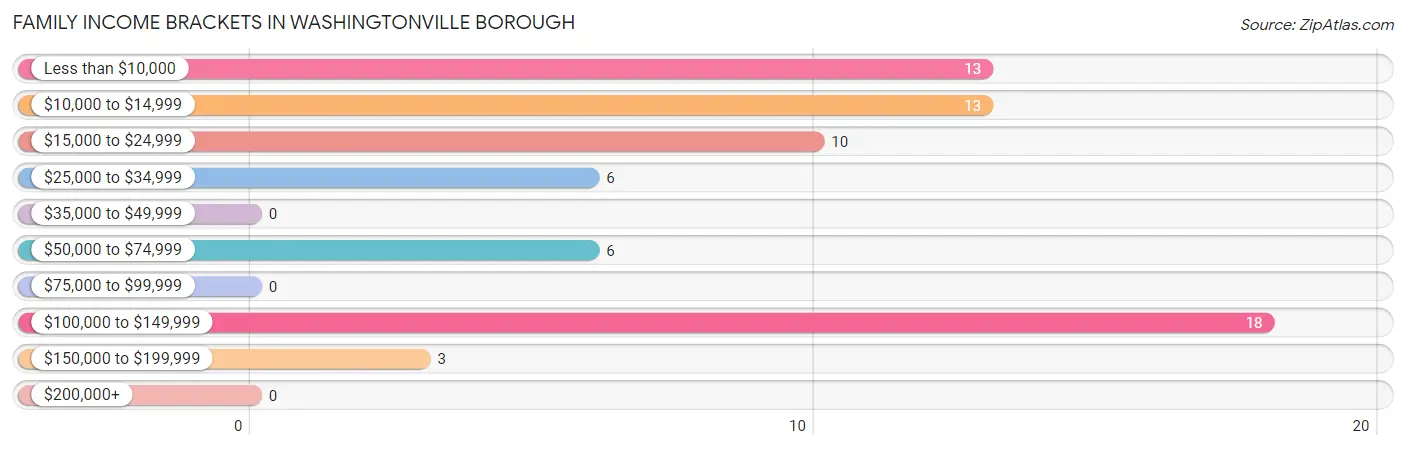
| Income Bracket | # Families | % Families |
| Less than $10,000 | 13 | 18.8% |
| $10,000 to $14,999 | 13 | 18.8% |
| $15,000 to $24,999 | 10 | 14.5% |
| $25,000 to $34,999 | 6 | 8.7% |
| $35,000 to $49,999 | 0 | 0.0% |
| $50,000 to $74,999 | 6 | 8.7% |
| $75,000 to $99,999 | 0 | 0.0% |
| $100,000 to $149,999 | 18 | 26.1% |
| $150,000 to $199,999 | 3 | 4.3% |
| $200,000+ | 0 | 0.0% |
Family Income by Famaliy Size in Washingtonville borough
3-person families (14 | 20.3%) account for the highest median family income in Washingtonville borough with $108,889 per family, while 3-person families (14 | 20.3%) have the highest median income of $36,296 per family member.
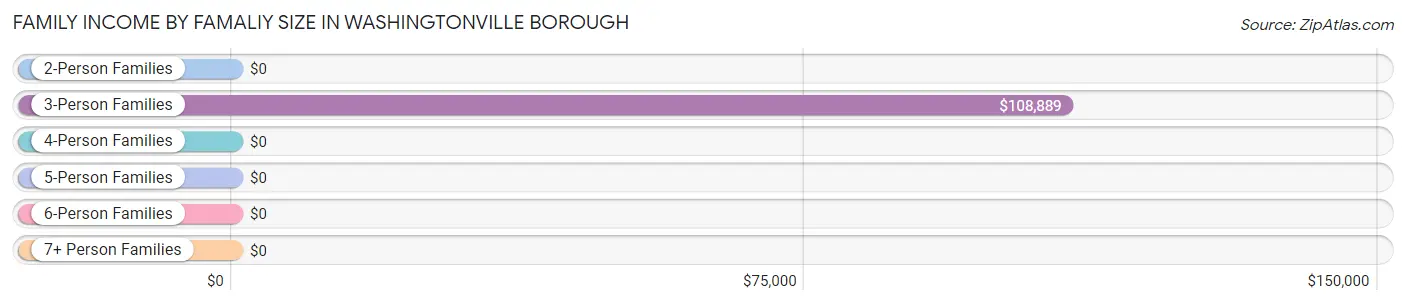
| Income Bracket | # Families | Median Income |
| 2-Person Families | 32 (46.4%) | $0 |
| 3-Person Families | 14 (20.3%) | $108,889 |
| 4-Person Families | 23 (33.3%) | $0 |
| 5-Person Families | 0 (0.0%) | $0 |
| 6-Person Families | 0 (0.0%) | $0 |
| 7+ Person Families | 0 (0.0%) | $0 |
| Total | 69 (100.0%) | $0 |
Family Income by Number of Earners in Washingtonville borough
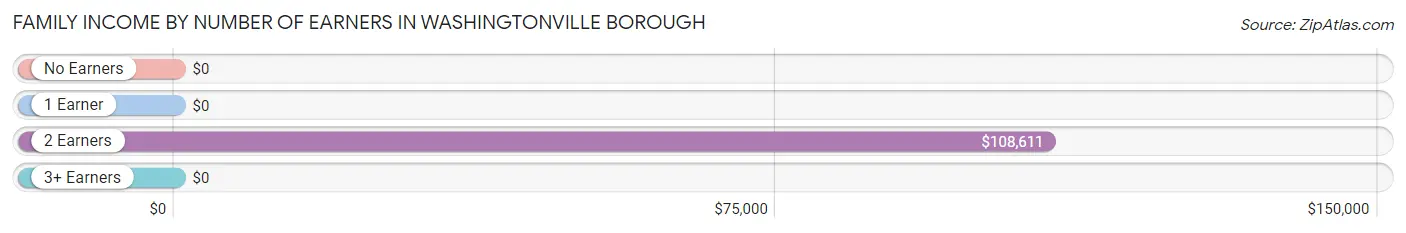
| Number of Earners | # Families | Median Income |
| No Earners | 26 (37.7%) | $0 |
| 1 Earner | 20 (29.0%) | $0 |
| 2 Earners | 20 (29.0%) | $108,611 |
| 3+ Earners | 3 (4.3%) | $0 |
| Total | 69 (100.0%) | $0 |
Household Income in Washingtonville borough
Household Income Brackets in Washingtonville borough
With 28 households falling in the category, the $10,000 to $14,999 income range is the most frequent in Washingtonville borough, accounting for 25.9% of all households.
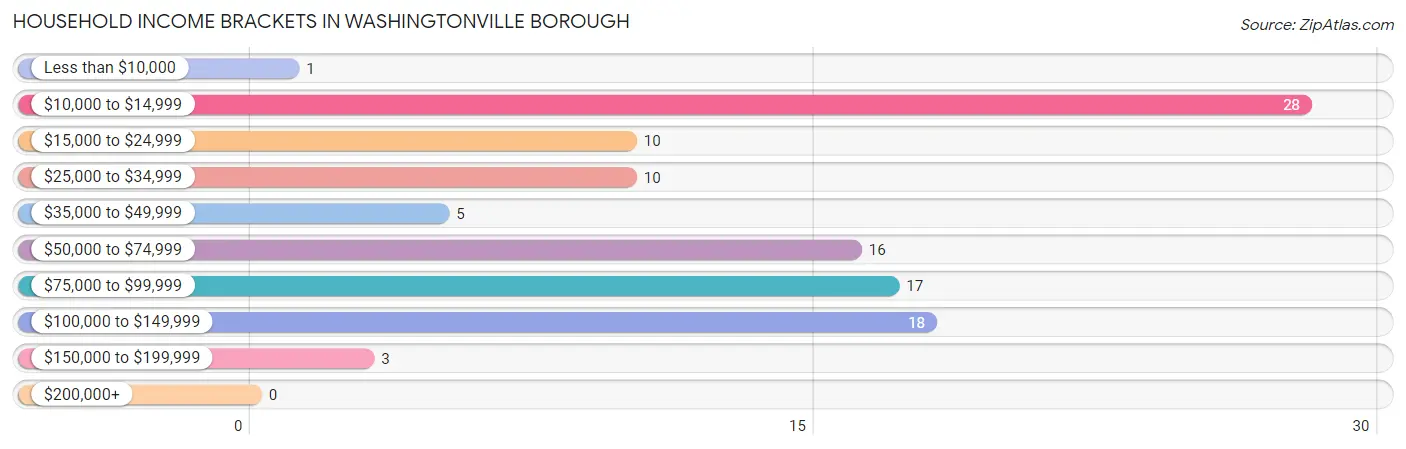
| Income Bracket | # Households | % Households |
| Less than $10,000 | 1 | 0.9% |
| $10,000 to $14,999 | 28 | 25.9% |
| $15,000 to $24,999 | 10 | 9.3% |
| $25,000 to $34,999 | 10 | 9.3% |
| $35,000 to $49,999 | 5 | 4.6% |
| $50,000 to $74,999 | 16 | 14.8% |
| $75,000 to $99,999 | 17 | 15.7% |
| $100,000 to $149,999 | 18 | 16.7% |
| $150,000 to $199,999 | 3 | 2.8% |
| $200,000+ | 0 | 0.0% |
Household Income by Householder Age in Washingtonville borough
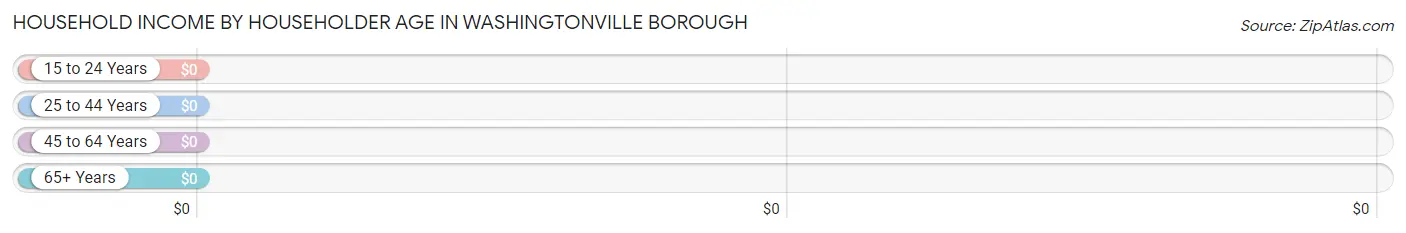
| Income Bracket | # Households | Median Income |
| 15 to 24 Years | 23 (21.3%) | $0 |
| 25 to 44 Years | 45 (41.7%) | $0 |
| 45 to 64 Years | 17 (15.7%) | $0 |
| 65+ Years | 23 (21.3%) | $0 |
| Total | 108 (100.0%) | $46,250 |
Poverty in Washingtonville borough
Income Below Poverty by Sex and Age in Washingtonville borough
With 44.6% poverty level for males and 49.5% for females among the residents of Washingtonville borough, under 5 year old males and 18 to 24 year old females are the most vulnerable to poverty, with 27 males (100.0%) and 23 females (100.0%) in their respective age groups living below the poverty level.
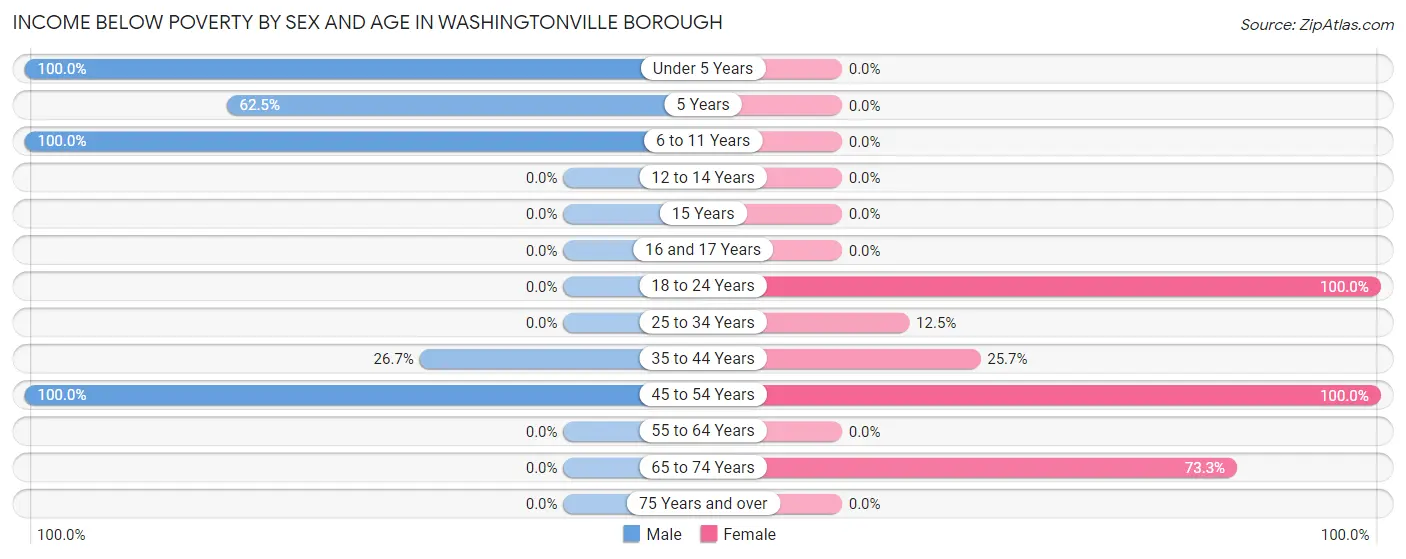
| Age Bracket | Male | Female |
| Under 5 Years | 27 (100.0%) | 0 (0.0%) |
| 5 Years | 5 (62.5%) | 0 (0.0%) |
| 6 to 11 Years | 5 (100.0%) | 0 (0.0%) |
| 12 to 14 Years | 0 (0.0%) | 0 (0.0%) |
| 15 Years | 0 (0.0%) | 0 (0.0%) |
| 16 and 17 Years | 0 (0.0%) | 0 (0.0%) |
| 18 to 24 Years | 0 (0.0%) | 23 (100.0%) |
| 25 to 34 Years | 0 (0.0%) | 1 (12.5%) |
| 35 to 44 Years | 4 (26.7%) | 9 (25.7%) |
| 45 to 54 Years | 8 (100.0%) | 10 (100.0%) |
| 55 to 64 Years | 0 (0.0%) | 0 (0.0%) |
| 65 to 74 Years | 0 (0.0%) | 11 (73.3%) |
| 75 Years and over | 0 (0.0%) | 0 (0.0%) |
| Total | 49 (44.6%) | 54 (49.5%) |
Income Above Poverty by Sex and Age in Washingtonville borough
According to the poverty statistics in Washingtonville borough, males aged 16 and 17 years and females aged 12 to 14 years are the age groups that are most secure financially, with 100.0% of males and 100.0% of females in these age groups living above the poverty line.
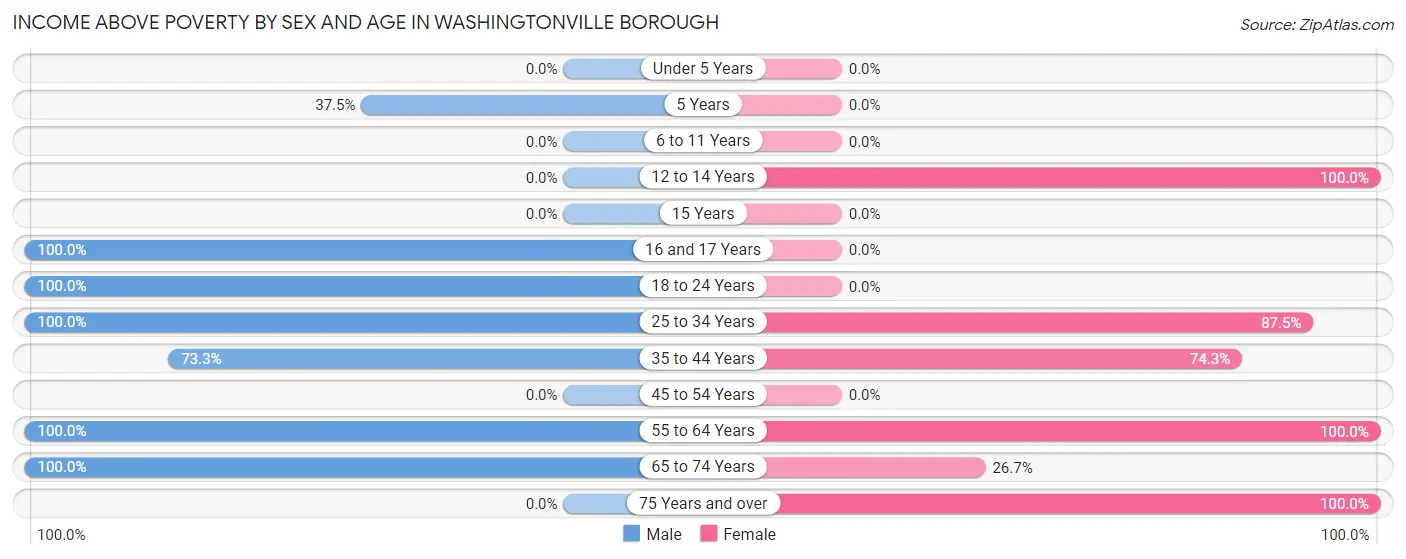
| Age Bracket | Male | Female |
| Under 5 Years | 0 (0.0%) | 0 (0.0%) |
| 5 Years | 3 (37.5%) | 0 (0.0%) |
| 6 to 11 Years | 0 (0.0%) | 0 (0.0%) |
| 12 to 14 Years | 0 (0.0%) | 1 (100.0%) |
| 15 Years | 0 (0.0%) | 0 (0.0%) |
| 16 and 17 Years | 8 (100.0%) | 0 (0.0%) |
| 18 to 24 Years | 9 (100.0%) | 0 (0.0%) |
| 25 to 34 Years | 17 (100.0%) | 7 (87.5%) |
| 35 to 44 Years | 11 (73.3%) | 26 (74.3%) |
| 45 to 54 Years | 0 (0.0%) | 0 (0.0%) |
| 55 to 64 Years | 3 (100.0%) | 9 (100.0%) |
| 65 to 74 Years | 10 (100.0%) | 4 (26.7%) |
| 75 Years and over | 0 (0.0%) | 8 (100.0%) |
| Total | 61 (55.4%) | 55 (50.5%) |
Income Below Poverty Among Married-Couple Families in Washingtonville borough
The poverty statistics for married-couple families in Washingtonville borough show that 22.9% or 8 of the total 35 families live below the poverty line. Families with no children have the highest poverty rate of 30.8%, comprising of 8 families. On the other hand, families with 1 or 2 children have the lowest poverty rate of 0.0%, which includes 0 families.
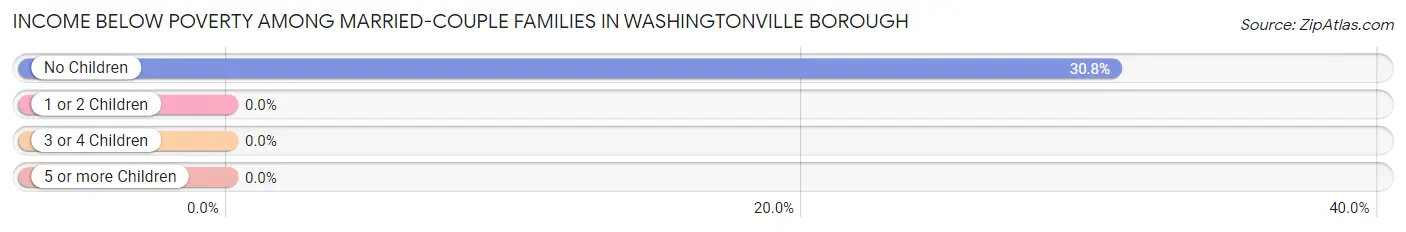
| Children | Above Poverty | Below Poverty |
| No Children | 18 (69.2%) | 8 (30.8%) |
| 1 or 2 Children | 9 (100.0%) | 0 (0.0%) |
| 3 or 4 Children | 0 (0.0%) | 0 (0.0%) |
| 5 or more Children | 0 (0.0%) | 0 (0.0%) |
| Total | 27 (77.1%) | 8 (22.9%) |
Income Below Poverty Among Single-Parent Households in Washingtonville borough
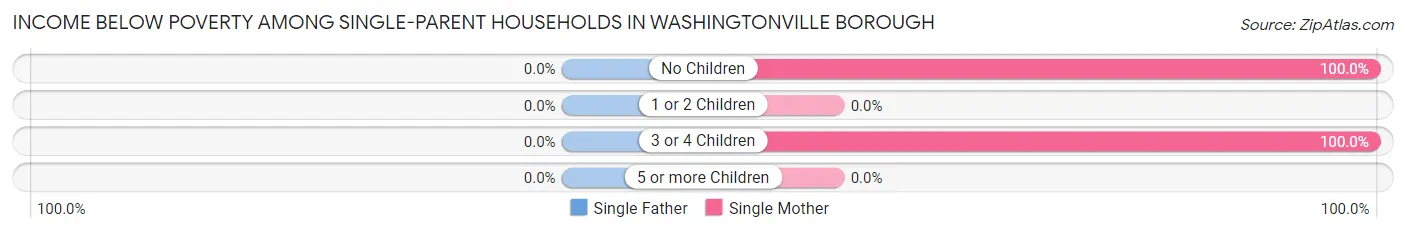
| Children | Single Father | Single Mother |
| No Children | 0 (0.0%) | 5 (100.0%) |
| 1 or 2 Children | 0 (0.0%) | 0 (0.0%) |
| 3 or 4 Children | 0 (0.0%) | 23 (100.0%) |
| 5 or more Children | 0 (0.0%) | 0 (0.0%) |
| Total | 0 (0.0%) | 28 (82.4%) |
Income Below Poverty Among Married-Couple vs Single-Parent Households in Washingtonville borough
The poverty data for Washingtonville borough shows that 8 of the married-couple family households (22.9%) and 28 of the single-parent households (82.4%) are living below the poverty level. Within the married-couple family households, those with no children have the highest poverty rate, with 8 households (30.8%) falling below the poverty line. Among the single-parent households, those with no children have the highest poverty rate, with 5 household (100.0%) living below poverty.
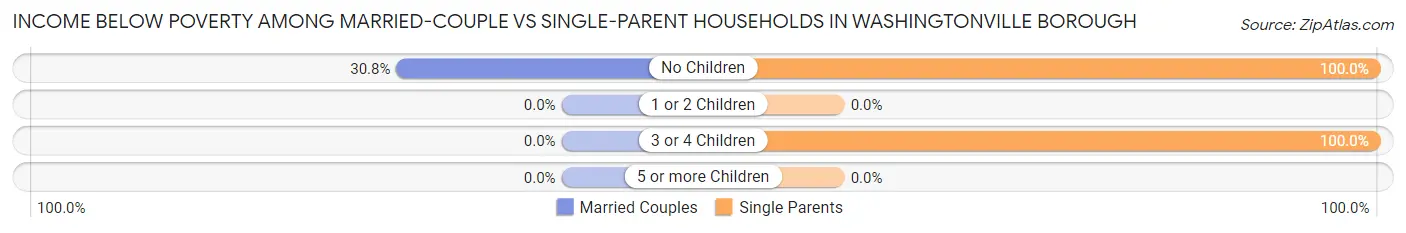
| Children | Married-Couple Families | Single-Parent Households |
| No Children | 8 (30.8%) | 5 (100.0%) |
| 1 or 2 Children | 0 (0.0%) | 0 (0.0%) |
| 3 or 4 Children | 0 (0.0%) | 23 (100.0%) |
| 5 or more Children | 0 (0.0%) | 0 (0.0%) |
| Total | 8 (22.9%) | 28 (82.4%) |
Race in Washingtonville borough
The most populous races in Washingtonville borough are , and White / Caucasian (221 | 100.0%).
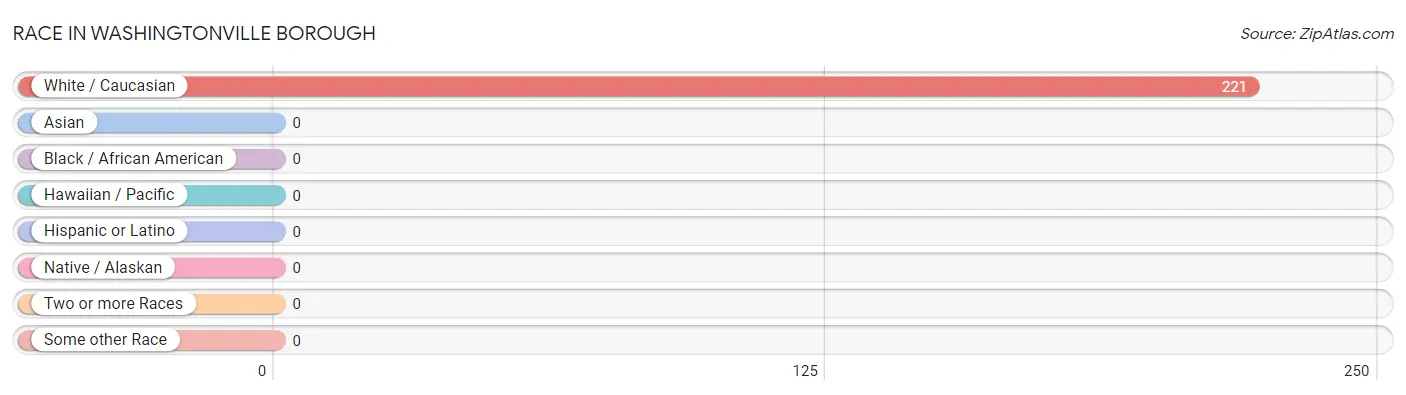
| Race | # Population | % Population |
| Asian | 0 | 0.0% |
| Black / African American | 0 | 0.0% |
| Hawaiian / Pacific | 0 | 0.0% |
| Hispanic or Latino | 0 | 0.0% |
| Native / Alaskan | 0 | 0.0% |
| White / Caucasian | 221 | 100.0% |
| Two or more Races | 0 | 0.0% |
| Some other Race | 0 | 0.0% |
| Total | 221 | 100.0% |
Ancestry in Washingtonville borough
The most populous ancestries reported in Washingtonville borough are German (75 | 33.9%), English (49 | 22.2%), Polish (29 | 13.1%), Irish (27 | 12.2%), and Pennsylvania German (12 | 5.4%), together accounting for 86.9% of all Washingtonville borough residents.
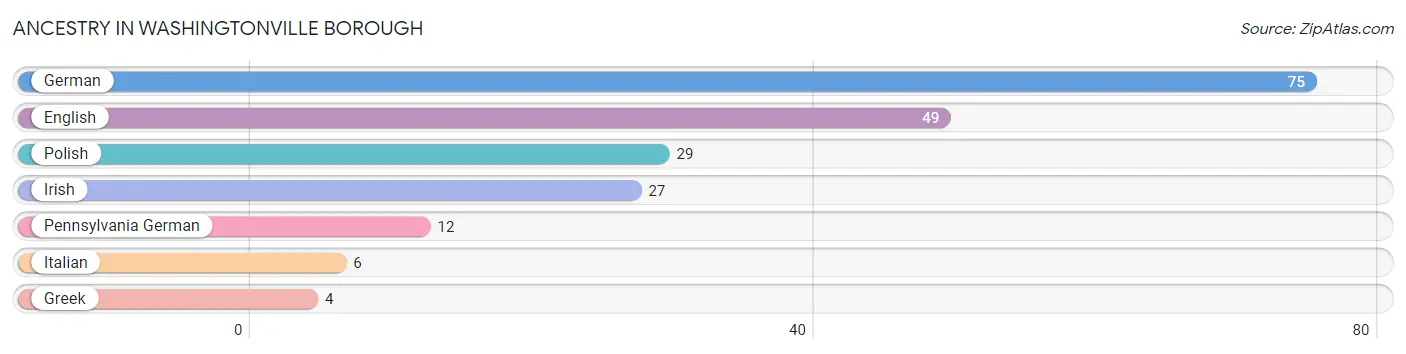
| Ancestry | # Population | % Population |
| English | 49 | 22.2% |
| German | 75 | 33.9% |
| Greek | 4 | 1.8% |
| Irish | 27 | 12.2% |
| Italian | 6 | 2.7% |
| Pennsylvania German | 12 | 5.4% |
| Polish | 29 | 13.1% | View All 7 Rows |
Immigrants in Washingtonville borough

| Immigration Origin | # Population | % Population | View All 0 Rows |
Sex and Age in Washingtonville borough
Sex and Age in Washingtonville borough
The most populous age groups in Washingtonville borough are Under 5 Years (27 | 24.1%) for men and 40 to 44 Years (30 | 27.5%) for women.
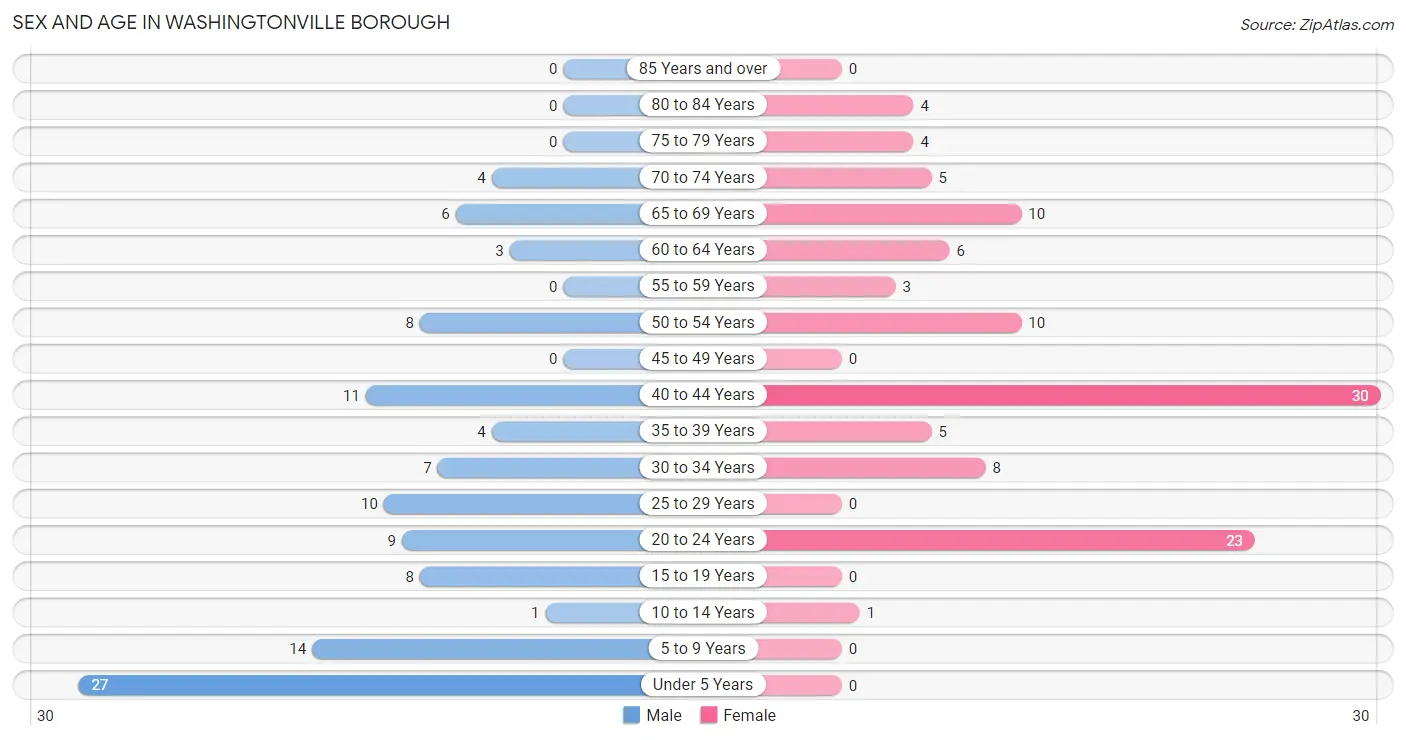
| Age Bracket | Male | Female |
| Under 5 Years | 27 (24.1%) | 0 (0.0%) |
| 5 to 9 Years | 14 (12.5%) | 0 (0.0%) |
| 10 to 14 Years | 1 (0.9%) | 1 (0.9%) |
| 15 to 19 Years | 8 (7.1%) | 0 (0.0%) |
| 20 to 24 Years | 9 (8.0%) | 23 (21.1%) |
| 25 to 29 Years | 10 (8.9%) | 0 (0.0%) |
| 30 to 34 Years | 7 (6.2%) | 8 (7.3%) |
| 35 to 39 Years | 4 (3.6%) | 5 (4.6%) |
| 40 to 44 Years | 11 (9.8%) | 30 (27.5%) |
| 45 to 49 Years | 0 (0.0%) | 0 (0.0%) |
| 50 to 54 Years | 8 (7.1%) | 10 (9.2%) |
| 55 to 59 Years | 0 (0.0%) | 3 (2.8%) |
| 60 to 64 Years | 3 (2.7%) | 6 (5.5%) |
| 65 to 69 Years | 6 (5.4%) | 10 (9.2%) |
| 70 to 74 Years | 4 (3.6%) | 5 (4.6%) |
| 75 to 79 Years | 0 (0.0%) | 4 (3.7%) |
| 80 to 84 Years | 0 (0.0%) | 4 (3.7%) |
| 85 Years and over | 0 (0.0%) | 0 (0.0%) |
| Total | 112 (100.0%) | 109 (100.0%) |
Families and Households in Washingtonville borough
Median Family Size in Washingtonville borough
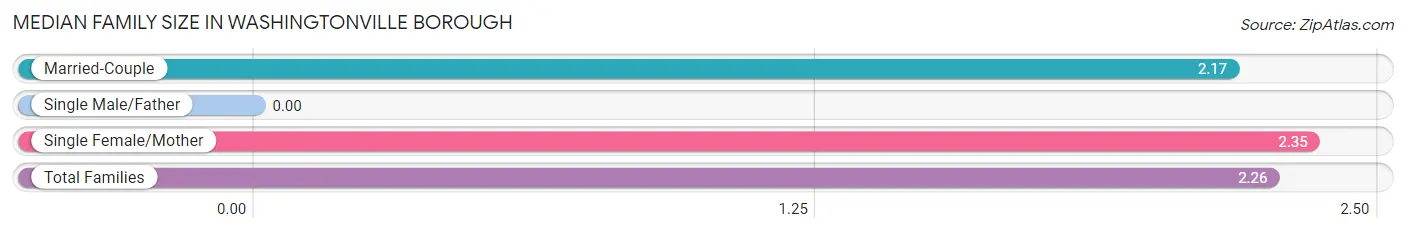
| Family Type | # Families | Family Size |
| Married-Couple | 35 (50.7%) | 2.17 |
| Single Male/Father | 0 (0.0%) | - |
| Single Female/Mother | 34 (49.3%) | 2.35 |
| Total Families | 69 (100.0%) | 2.26 |
Median Household Size in Washingtonville borough
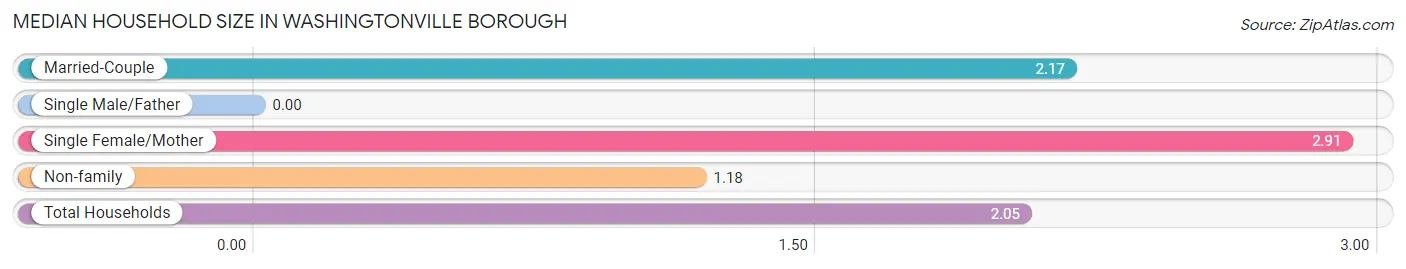
| Household Type | # Households | Household Size |
| Married-Couple | 35 (32.4%) | 2.17 |
| Single Male/Father | 0 (0.0%) | - |
| Single Female/Mother | 34 (31.5%) | 2.91 |
| Non-family | 39 (36.1%) | 1.18 |
| Total Households | 108 (100.0%) | 2.05 |
Household Size by Marriage Status in Washingtonville borough
Out of a total of 108 households in Washingtonville borough, 69 (63.9%) are family households, while 39 (36.1%) are nonfamily households. The most numerous type of family households are 2-person households, comprising 32, and the most common type of nonfamily households are 1-person households, comprising 33.
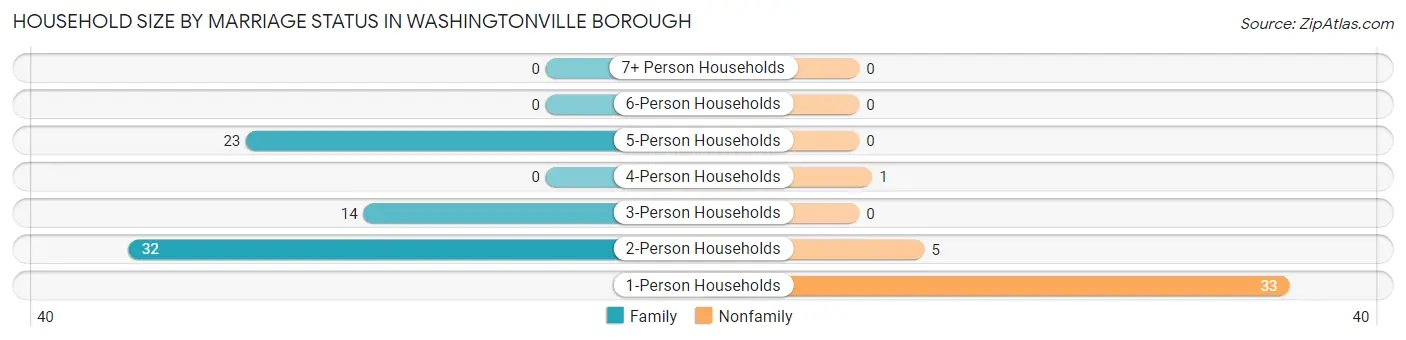
| Household Size | Family Households | Nonfamily Households |
| 1-Person Households | - | 33 (30.6%) |
| 2-Person Households | 32 (29.6%) | 5 (4.6%) |
| 3-Person Households | 14 (13.0%) | 0 (0.0%) |
| 4-Person Households | 0 (0.0%) | 1 (0.9%) |
| 5-Person Households | 23 (21.3%) | 0 (0.0%) |
| 6-Person Households | 0 (0.0%) | 0 (0.0%) |
| 7+ Person Households | 0 (0.0%) | 0 (0.0%) |
| Total | 69 (63.9%) | 39 (36.1%) |
Female Fertility in Washingtonville borough
Fertility by Age in Washingtonville borough
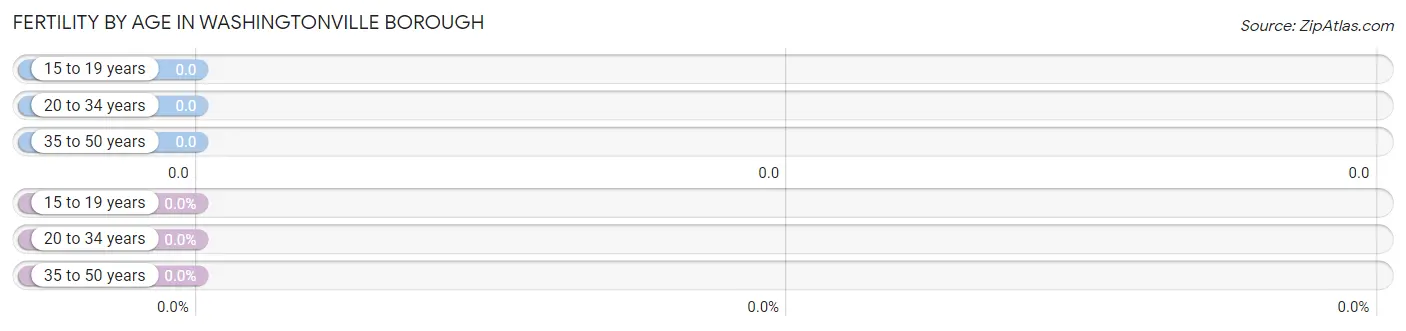
| Age Bracket | Women with Births | Births / 1,000 Women |
| 15 to 19 years | 0 (0.0%) | 0.0 |
| 20 to 34 years | 0 (0.0%) | 0.0 |
| 35 to 50 years | 0 (0.0%) | 0.0 |
| Total | 0 (0.0%) | 0.0 |
Fertility by Age by Marriage Status in Washingtonville borough
| Age Bracket | Married | Unmarried |
| 15 to 19 years | 0 (0.0%) | 0 (0.0%) |
| 20 to 34 years | 0 (0.0%) | 0 (0.0%) |
| 35 to 50 years | 0 (0.0%) | 0 (0.0%) |
| Total | 0 (0.0%) | 0 (0.0%) |
Fertility by Education in Washingtonville borough
| Educational Attainment | Women with Births | Births / 1,000 Women |
| Less than High School | 0 (0.0%) | 0.0 |
| High School Diploma | 0 (0.0%) | 0.0 |
| College or Associate's Degree | 0 (0.0%) | 0.0 |
| Bachelor's Degree | 0 (0.0%) | 0.0 |
| Graduate Degree | 0 (0.0%) | 0.0 |
| Total | 0 (0.0%) | 0.0 |
Fertility by Education by Marriage Status in Washingtonville borough
| Educational Attainment | Married | Unmarried |
| Less than High School | 0 (0.0%) | 0 (0.0%) |
| High School Diploma | 0 (0.0%) | 0 (0.0%) |
| College or Associate's Degree | 0 (0.0%) | 0 (0.0%) |
| Bachelor's Degree | 0 (0.0%) | 0 (0.0%) |
| Graduate Degree | 0 (0.0%) | 0 (0.0%) |
| Total | 0 (0.0%) | 0 (0.0%) |
Employment Characteristics in Washingtonville borough
Employment by Class of Employer in Washingtonville borough
Among the 106 employed individuals in Washingtonville borough, private company employees (82 | 77.4%), not-for-profit organizations (14 | 13.2%), and self-employed (not incorporated) (4 | 3.8%) make up the most common classes of employment.
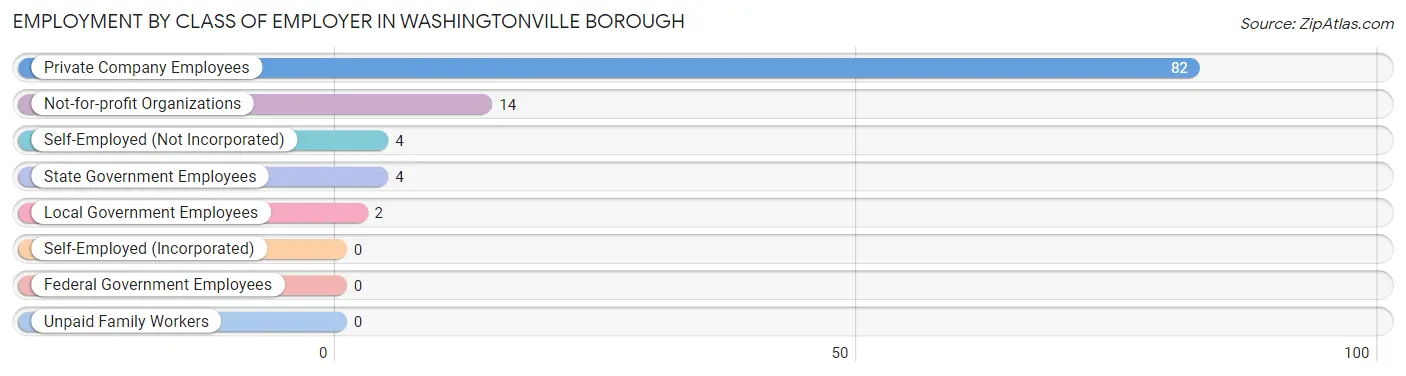
| Employer Class | # Employees | % Employees |
| Private Company Employees | 82 | 77.4% |
| Self-Employed (Incorporated) | 0 | 0.0% |
| Self-Employed (Not Incorporated) | 4 | 3.8% |
| Not-for-profit Organizations | 14 | 13.2% |
| Local Government Employees | 2 | 1.9% |
| State Government Employees | 4 | 3.8% |
| Federal Government Employees | 0 | 0.0% |
| Unpaid Family Workers | 0 | 0.0% |
| Total | 106 | 100.0% |
Employment Status by Age in Washingtonville borough
According to the labor force statistics for Washingtonville borough, out of the total population over 16 years of age (178), 60.1% or 107 individuals are in the labor force, with 0.9% or 1 of them unemployed. The age group with the highest labor force participation rate is 25 to 29 years, with 100.0% or 10 individuals in the labor force. Within the labor force, the 35 to 44 years age range has the highest percentage of unemployed individuals, with 2.6% or 1 of them being unemployed.
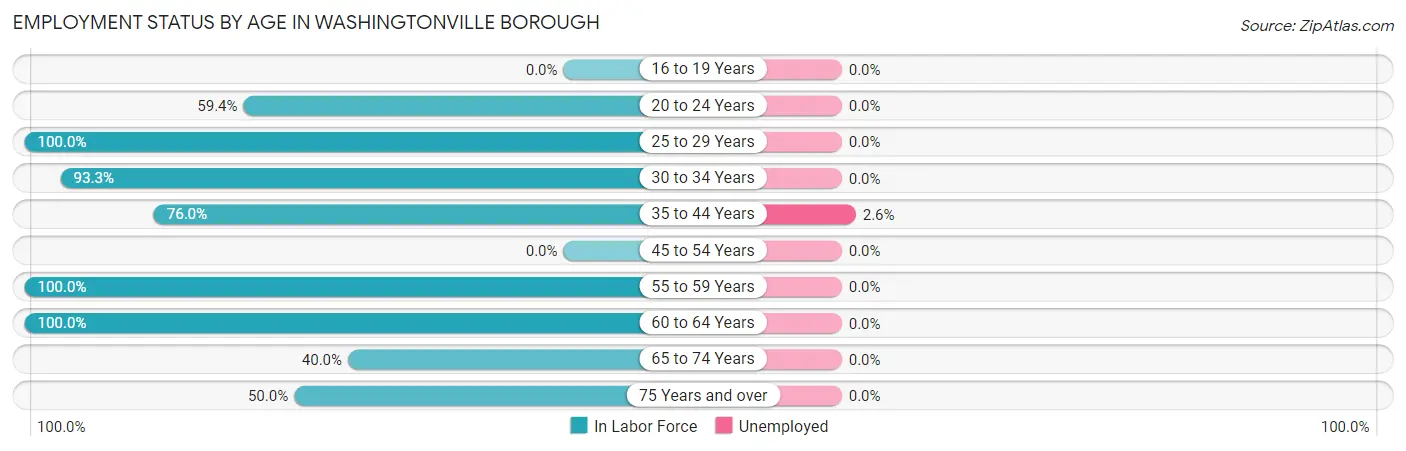
| Age Bracket | In Labor Force | Unemployed |
| 16 to 19 Years | 0 (0.0%) | 0 (0.0%) |
| 20 to 24 Years | 19 (59.4%) | 0 (0.0%) |
| 25 to 29 Years | 10 (100.0%) | 0 (0.0%) |
| 30 to 34 Years | 14 (93.3%) | 0 (0.0%) |
| 35 to 44 Years | 38 (76.0%) | 1 (2.6%) |
| 45 to 54 Years | 0 (0.0%) | 0 (0.0%) |
| 55 to 59 Years | 3 (100.0%) | 0 (0.0%) |
| 60 to 64 Years | 9 (100.0%) | 0 (0.0%) |
| 65 to 74 Years | 10 (40.0%) | 0 (0.0%) |
| 75 Years and over | 4 (50.0%) | 0 (0.0%) |
| Total | 107 (60.1%) | 1 (0.9%) |
Employment Status by Educational Attainment in Washingtonville borough
According to labor force statistics for Washingtonville borough, 70.5% of individuals (74) out of the total population between 25 and 64 years of age (105) are in the labor force, with 1.4% or 1 of them being unemployed. The group with the highest labor force participation rate are those with the educational attainment of college / associate degree, with 100.0% or 15 individuals in the labor force. Within the labor force, individuals with college / associate degree education have the highest percentage of unemployment, with 6.7% or 1 of them being unemployed.
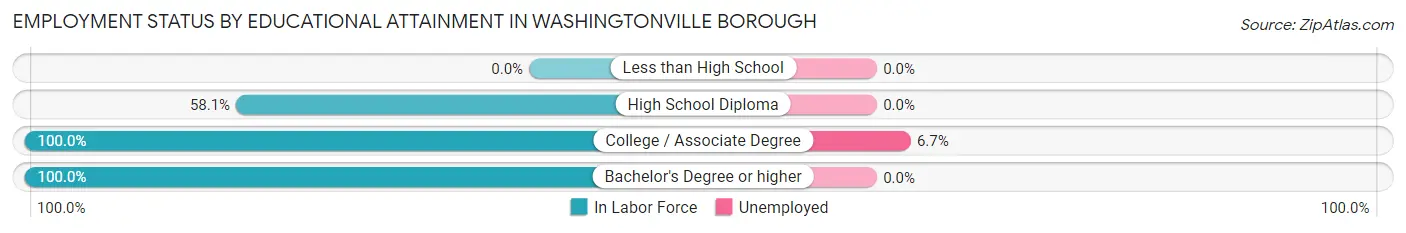
| Educational Attainment | In Labor Force | Unemployed |
| Less than High School | 0 (0.0%) | 0 (0.0%) |
| High School Diploma | 43 (58.1%) | 0 (0.0%) |
| College / Associate Degree | 15 (100.0%) | 1 (6.7%) |
| Bachelor's Degree or higher | 16 (100.0%) | 0 (0.0%) |
| Total | 74 (70.5%) | 1 (1.4%) |
Employment Occupations by Sex in Washingtonville borough
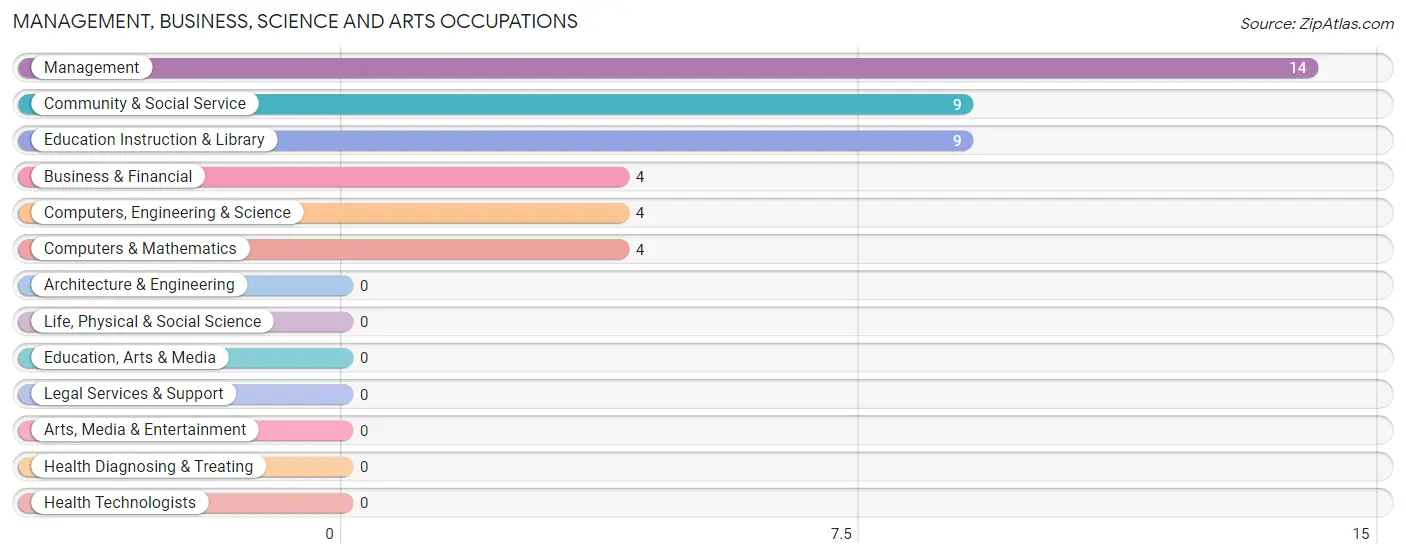
Management, Business, Science and Arts Occupations
The most common Management, Business, Science and Arts occupations in Washingtonville borough are Management (14 | 13.2%), Community & Social Service (9 | 8.5%), Education Instruction & Library (9 | 8.5%), Business & Financial (4 | 3.8%), and Computers, Engineering & Science (4 | 3.8%).
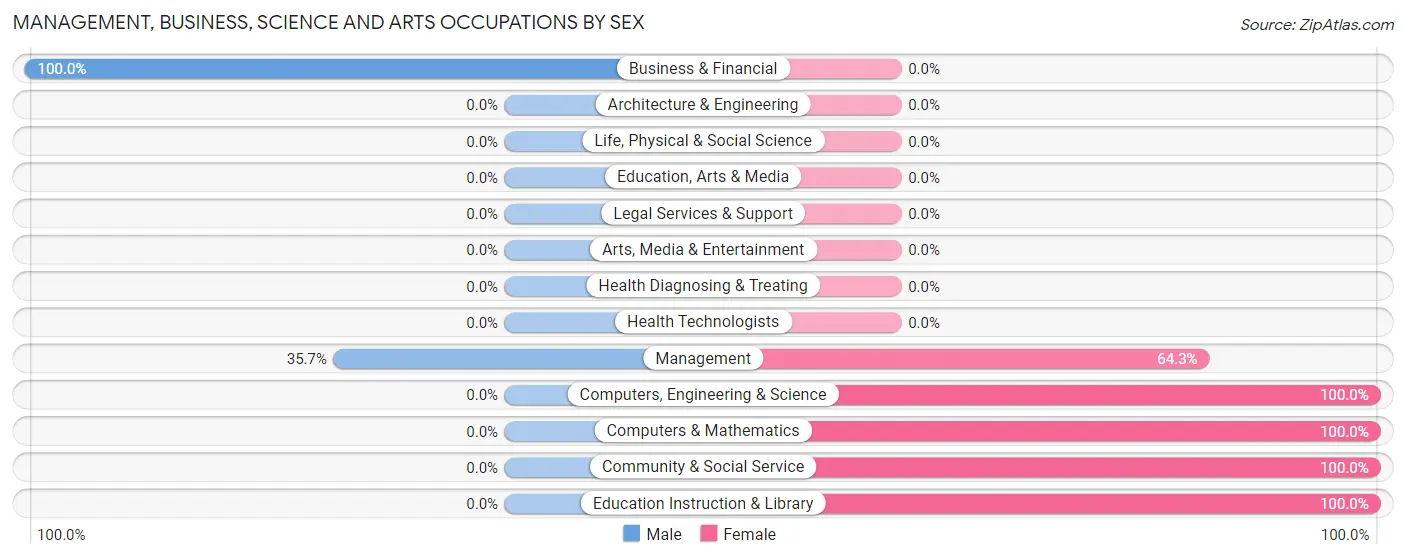
Management, Business, Science and Arts Occupations by Sex
Within the Management, Business, Science and Arts occupations in Washingtonville borough, the most male-oriented occupations are Business & Financial (100.0%), and Management (35.7%), while the most female-oriented occupations are Computers, Engineering & Science (100.0%), Computers & Mathematics (100.0%), and Community & Social Service (100.0%).
| Occupation | Male | Female |
| Management | 5 (35.7%) | 9 (64.3%) |
| Business & Financial | 4 (100.0%) | 0 (0.0%) |
| Computers, Engineering & Science | 0 (0.0%) | 4 (100.0%) |
| Computers & Mathematics | 0 (0.0%) | 4 (100.0%) |
| Architecture & Engineering | 0 (0.0%) | 0 (0.0%) |
| Life, Physical & Social Science | 0 (0.0%) | 0 (0.0%) |
| Community & Social Service | 0 (0.0%) | 9 (100.0%) |
| Education, Arts & Media | 0 (0.0%) | 0 (0.0%) |
| Legal Services & Support | 0 (0.0%) | 0 (0.0%) |
| Education Instruction & Library | 0 (0.0%) | 9 (100.0%) |
| Arts, Media & Entertainment | 0 (0.0%) | 0 (0.0%) |
| Health Diagnosing & Treating | 0 (0.0%) | 0 (0.0%) |
| Health Technologists | 0 (0.0%) | 0 (0.0%) |
| Total (Category) | 9 (29.0%) | 22 (71.0%) |
| Total (Overall) | 50 (47.2%) | 56 (52.8%) |
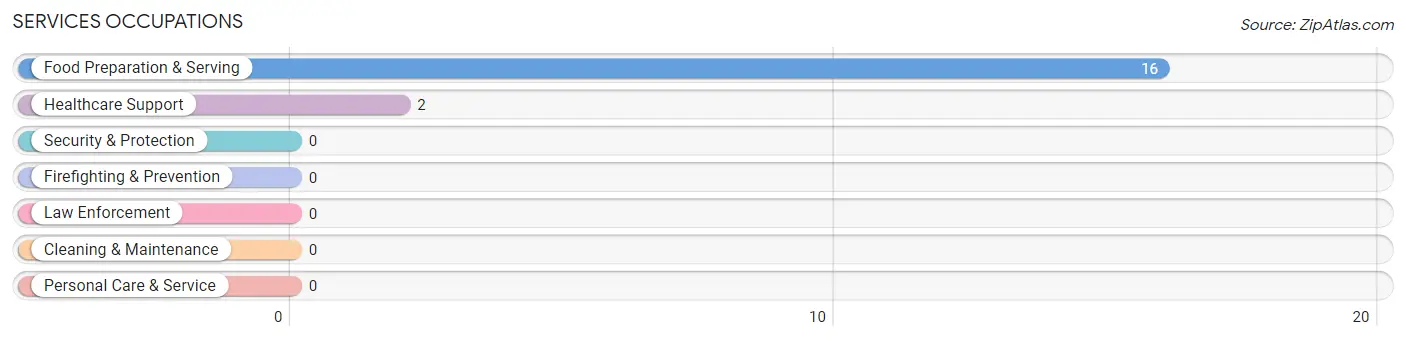
Services Occupations
The most common Services occupations in Washingtonville borough are Food Preparation & Serving (16 | 15.1%), and Healthcare Support (2 | 1.9%).
Services Occupations by Sex
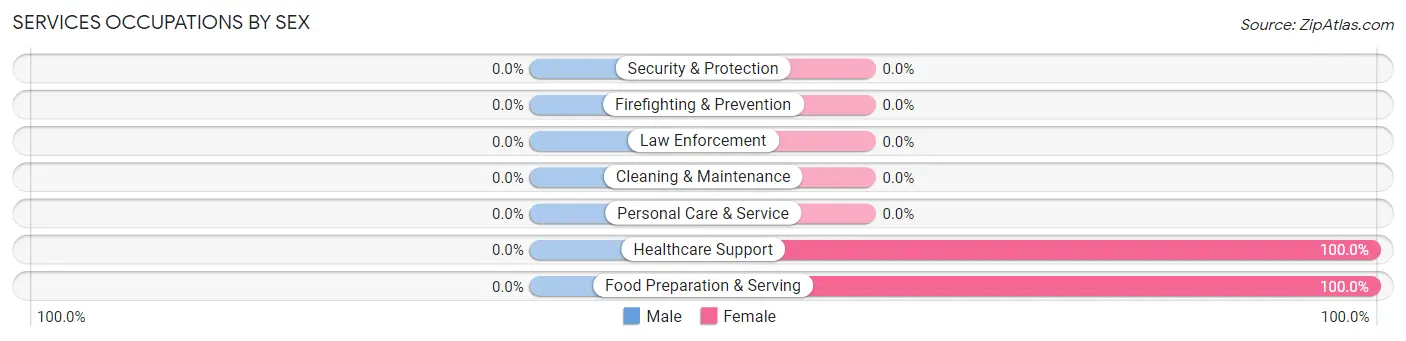
| Occupation | Male | Female |
| Healthcare Support | 0 (0.0%) | 2 (100.0%) |
| Security & Protection | 0 (0.0%) | 0 (0.0%) |
| Firefighting & Prevention | 0 (0.0%) | 0 (0.0%) |
| Law Enforcement | 0 (0.0%) | 0 (0.0%) |
| Food Preparation & Serving | 0 (0.0%) | 16 (100.0%) |
| Cleaning & Maintenance | 0 (0.0%) | 0 (0.0%) |
| Personal Care & Service | 0 (0.0%) | 0 (0.0%) |
| Total (Category) | 0 (0.0%) | 18 (100.0%) |
| Total (Overall) | 50 (47.2%) | 56 (52.8%) |
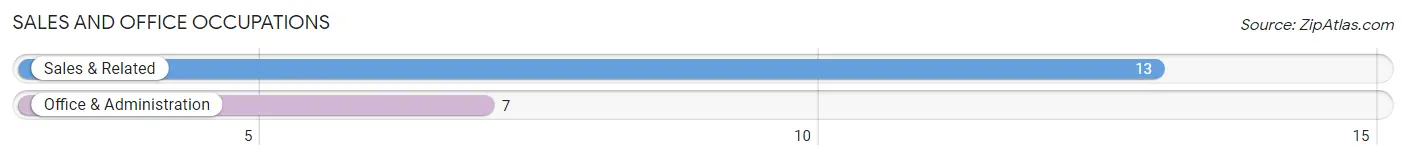
Sales and Office Occupations
The most common Sales and Office occupations in Washingtonville borough are Sales & Related (13 | 12.3%), and Office & Administration (7 | 6.6%).
Sales and Office Occupations by Sex
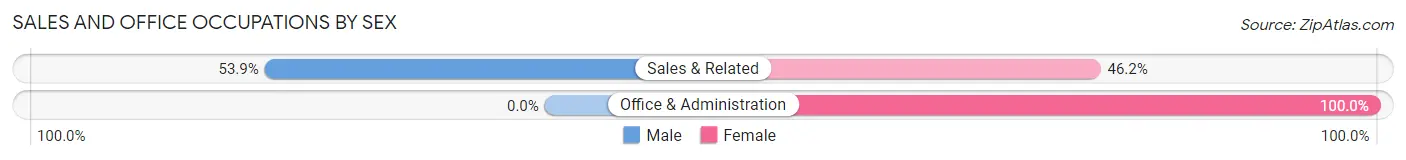
| Occupation | Male | Female |
| Sales & Related | 7 (53.8%) | 6 (46.2%) |
| Office & Administration | 0 (0.0%) | 7 (100.0%) |
| Total (Category) | 7 (35.0%) | 13 (65.0%) |
| Total (Overall) | 50 (47.2%) | 56 (52.8%) |
Natural Resources, Construction and Maintenance Occupations
The most common Natural Resources, Construction and Maintenance occupations in Washingtonville borough are Construction & Extraction (9 | 8.5%), and Installation, Maintenance & Repair (4 | 3.8%).
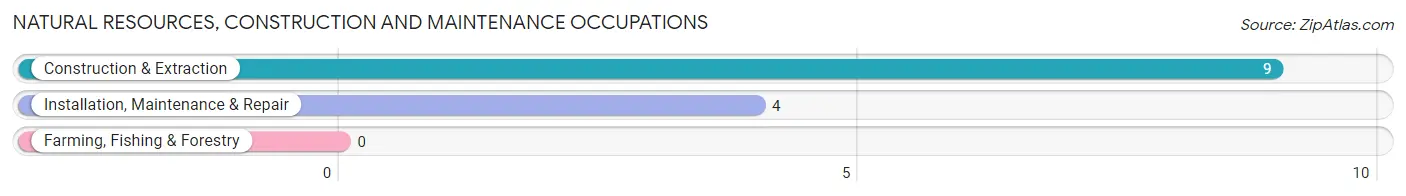
Natural Resources, Construction and Maintenance Occupations by Sex
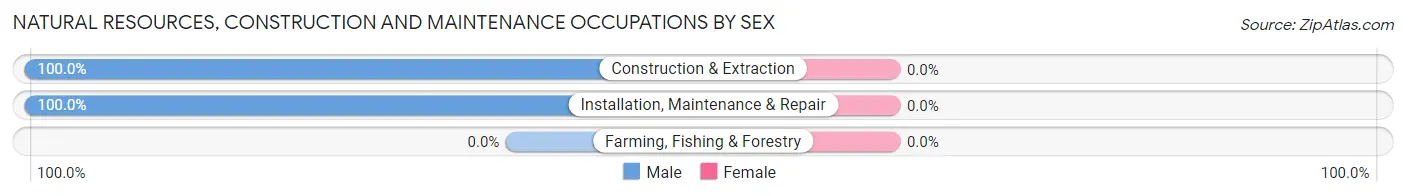
| Occupation | Male | Female |
| Farming, Fishing & Forestry | 0 (0.0%) | 0 (0.0%) |
| Construction & Extraction | 9 (100.0%) | 0 (0.0%) |
| Installation, Maintenance & Repair | 4 (100.0%) | 0 (0.0%) |
| Total (Category) | 13 (100.0%) | 0 (0.0%) |
| Total (Overall) | 50 (47.2%) | 56 (52.8%) |
Production, Transportation and Moving Occupations
The most common Production, Transportation and Moving occupations in Washingtonville borough are Material Moving (15 | 14.1%), Transportation (6 | 5.7%), and Production (3 | 2.8%).
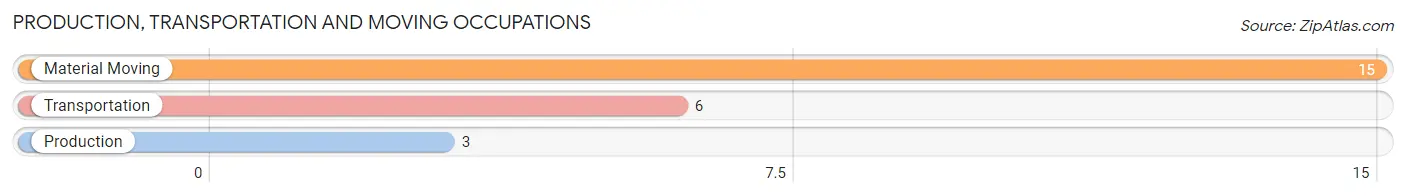
Production, Transportation and Moving Occupations by Sex
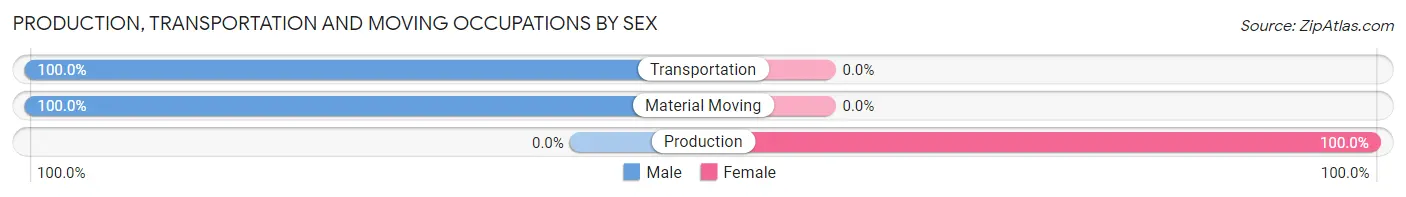
| Occupation | Male | Female |
| Production | 0 (0.0%) | 3 (100.0%) |
| Transportation | 6 (100.0%) | 0 (0.0%) |
| Material Moving | 15 (100.0%) | 0 (0.0%) |
| Total (Category) | 21 (87.5%) | 3 (12.5%) |
| Total (Overall) | 50 (47.2%) | 56 (52.8%) |
Employment Industries by Sex in Washingtonville borough
Employment Industries in Washingtonville borough
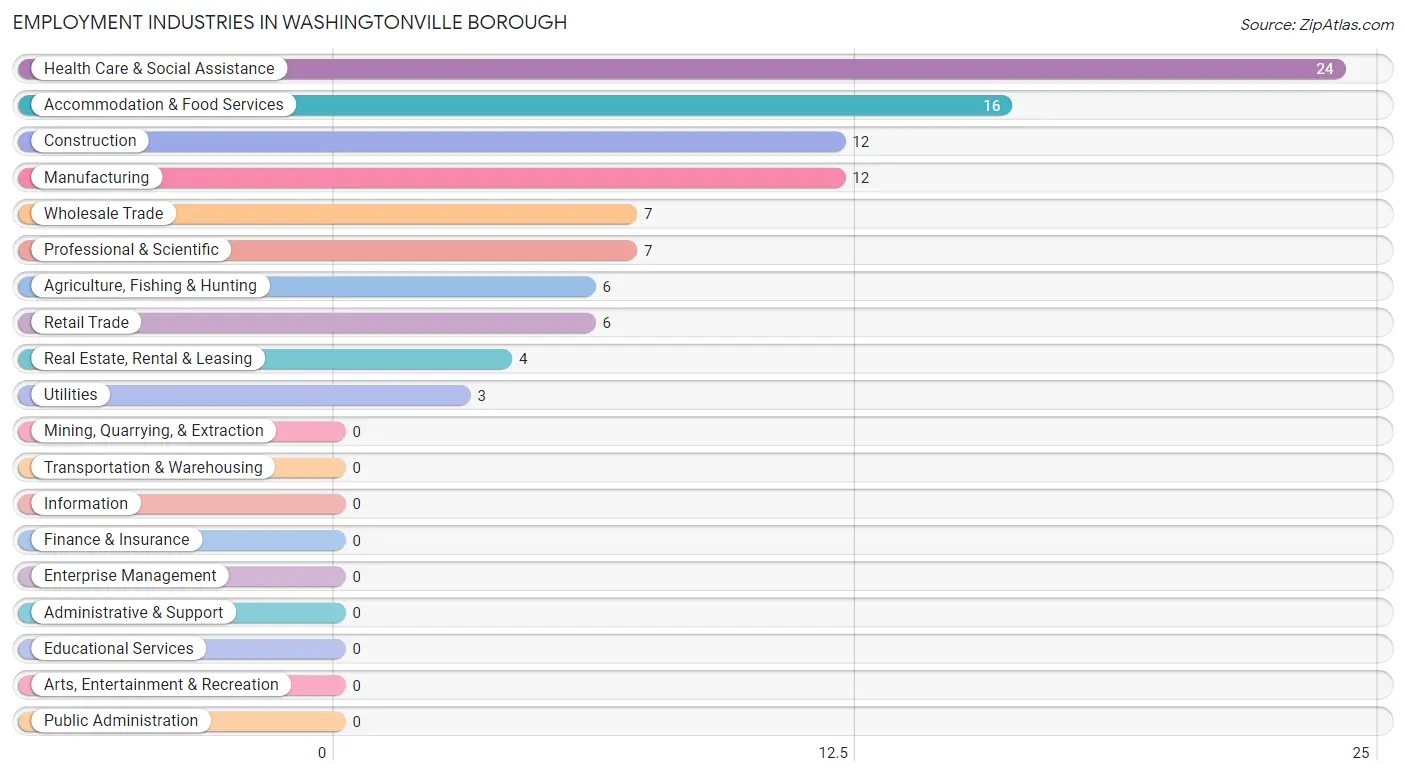
The major employment industries in Washingtonville borough include Health Care & Social Assistance (24 | 22.6%), Accommodation & Food Services (16 | 15.1%), Construction (12 | 11.3%), Manufacturing (12 | 11.3%), and Wholesale Trade (7 | 6.6%).
Employment Industries by Sex in Washingtonville borough
The Washingtonville borough industries that see more men than women are Agriculture, Fishing & Hunting (100.0%), Manufacturing (100.0%), and Wholesale Trade (100.0%), whereas the industries that tend to have a higher number of women are Retail Trade (100.0%), Real Estate, Rental & Leasing (100.0%), and Health Care & Social Assistance (100.0%).
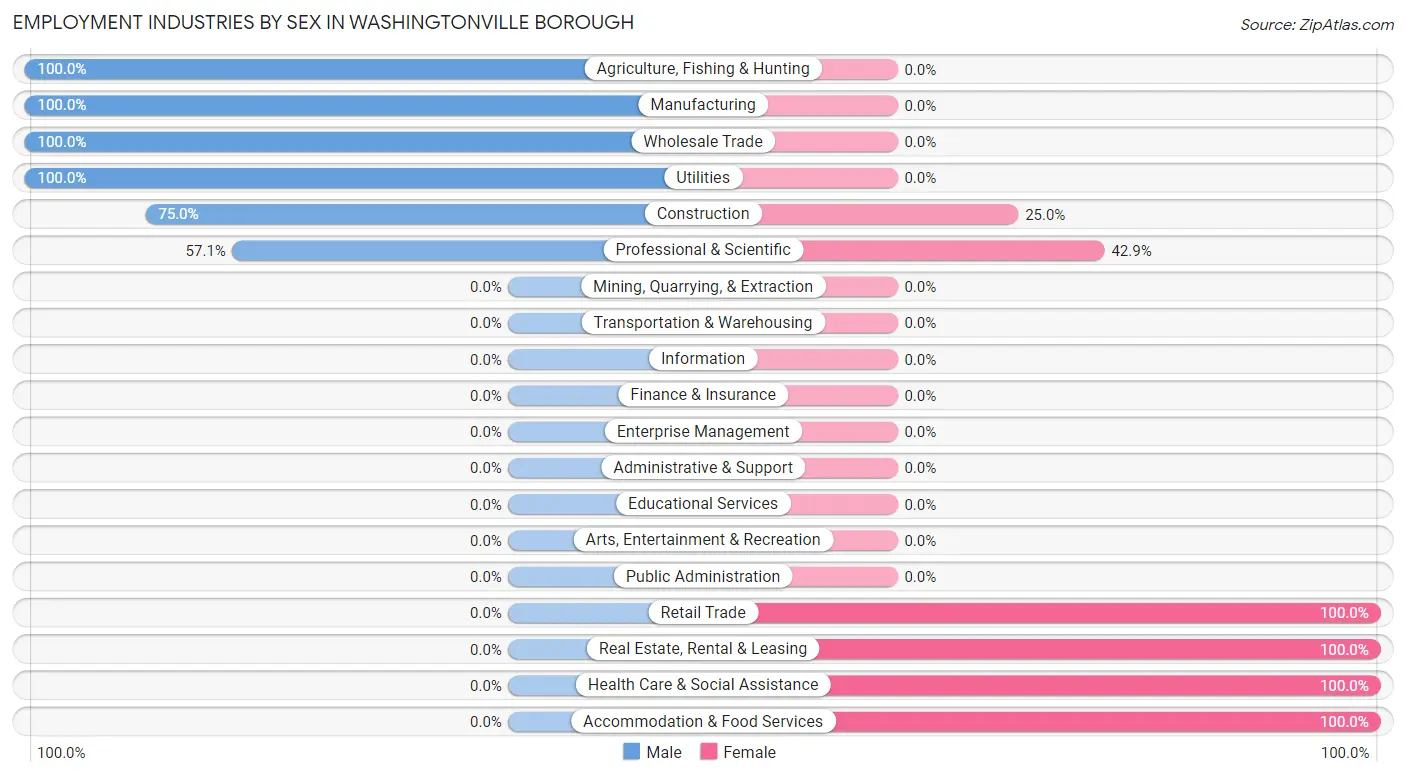
| Industry | Male | Female |
| Agriculture, Fishing & Hunting | 6 (100.0%) | 0 (0.0%) |
| Mining, Quarrying, & Extraction | 0 (0.0%) | 0 (0.0%) |
| Construction | 9 (75.0%) | 3 (25.0%) |
| Manufacturing | 12 (100.0%) | 0 (0.0%) |
| Wholesale Trade | 7 (100.0%) | 0 (0.0%) |
| Retail Trade | 0 (0.0%) | 6 (100.0%) |
| Transportation & Warehousing | 0 (0.0%) | 0 (0.0%) |
| Utilities | 3 (100.0%) | 0 (0.0%) |
| Information | 0 (0.0%) | 0 (0.0%) |
| Finance & Insurance | 0 (0.0%) | 0 (0.0%) |
| Real Estate, Rental & Leasing | 0 (0.0%) | 4 (100.0%) |
| Professional & Scientific | 4 (57.1%) | 3 (42.9%) |
| Enterprise Management | 0 (0.0%) | 0 (0.0%) |
| Administrative & Support | 0 (0.0%) | 0 (0.0%) |
| Educational Services | 0 (0.0%) | 0 (0.0%) |
| Health Care & Social Assistance | 0 (0.0%) | 24 (100.0%) |
| Arts, Entertainment & Recreation | 0 (0.0%) | 0 (0.0%) |
| Accommodation & Food Services | 0 (0.0%) | 16 (100.0%) |
| Public Administration | 0 (0.0%) | 0 (0.0%) |
| Total | 50 (47.2%) | 56 (52.8%) |
Education in Washingtonville borough
School Enrollment in Washingtonville borough
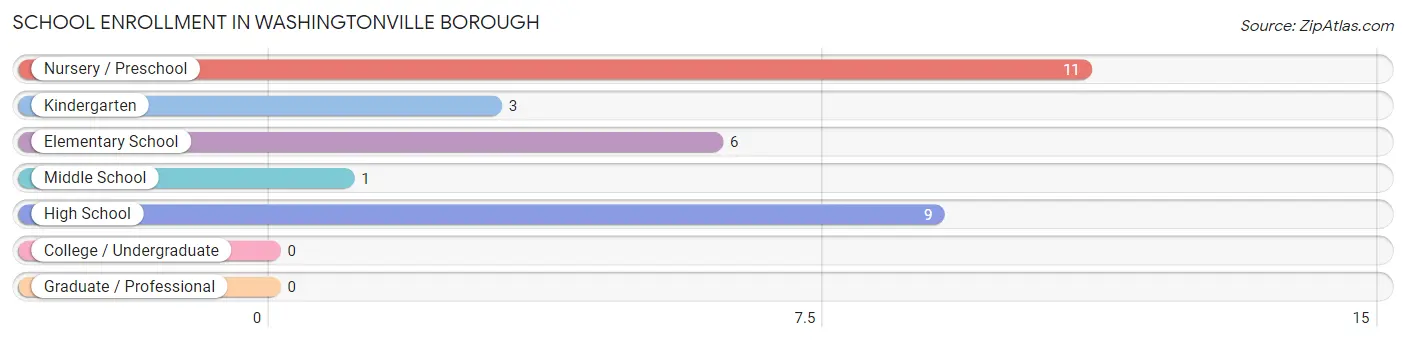
The most common levels of schooling among the 30 students in Washingtonville borough are nursery / preschool (11 | 36.7%), high school (9 | 30.0%), and elementary school (6 | 20.0%).
| School Level | # Students | % Students |
| Nursery / Preschool | 11 | 36.7% |
| Kindergarten | 3 | 10.0% |
| Elementary School | 6 | 20.0% |
| Middle School | 1 | 3.3% |
| High School | 9 | 30.0% |
| College / Undergraduate | 0 | 0.0% |
| Graduate / Professional | 0 | 0.0% |
| Total | 30 | 100.0% |
School Enrollment by Age by Funding Source in Washingtonville borough
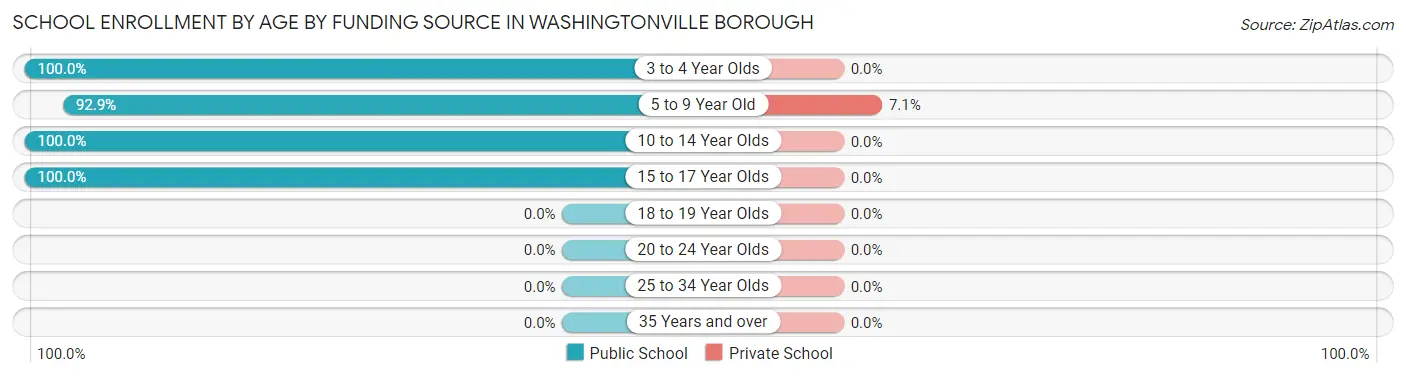
Out of a total of 30 students who are enrolled in schools in Washingtonville borough, 1 (3.3%) attend a private institution, while the remaining 29 (96.7%) are enrolled in public schools. The age group of 5 to 9 year old has the highest likelihood of being enrolled in private schools, with 1 (7.1% in the age bracket) enrolled. Conversely, the age group of 3 to 4 year olds has the lowest likelihood of being enrolled in a private school, with 6 (100.0% in the age bracket) attending a public institution.
| Age Bracket | Public School | Private School |
| 3 to 4 Year Olds | 6 (100.0%) | 0 (0.0%) |
| 5 to 9 Year Old | 13 (92.9%) | 1 (7.1%) |
| 10 to 14 Year Olds | 2 (100.0%) | 0 (0.0%) |
| 15 to 17 Year Olds | 8 (100.0%) | 0 (0.0%) |
| 18 to 19 Year Olds | 0 (0.0%) | 0 (0.0%) |
| 20 to 24 Year Olds | 0 (0.0%) | 0 (0.0%) |
| 25 to 34 Year Olds | 0 (0.0%) | 0 (0.0%) |
| 35 Years and over | 0 (0.0%) | 0 (0.0%) |
| Total | 29 (96.7%) | 1 (3.3%) |
Educational Attainment by Field of Study in Washingtonville borough
Education (9 | 45.0%), computers & mathematics (4 | 20.0%), communications (4 | 20.0%), and science & technology (3 | 15.0%) are the most common fields of study among 20 individuals in Washingtonville borough who have obtained a bachelor's degree or higher.
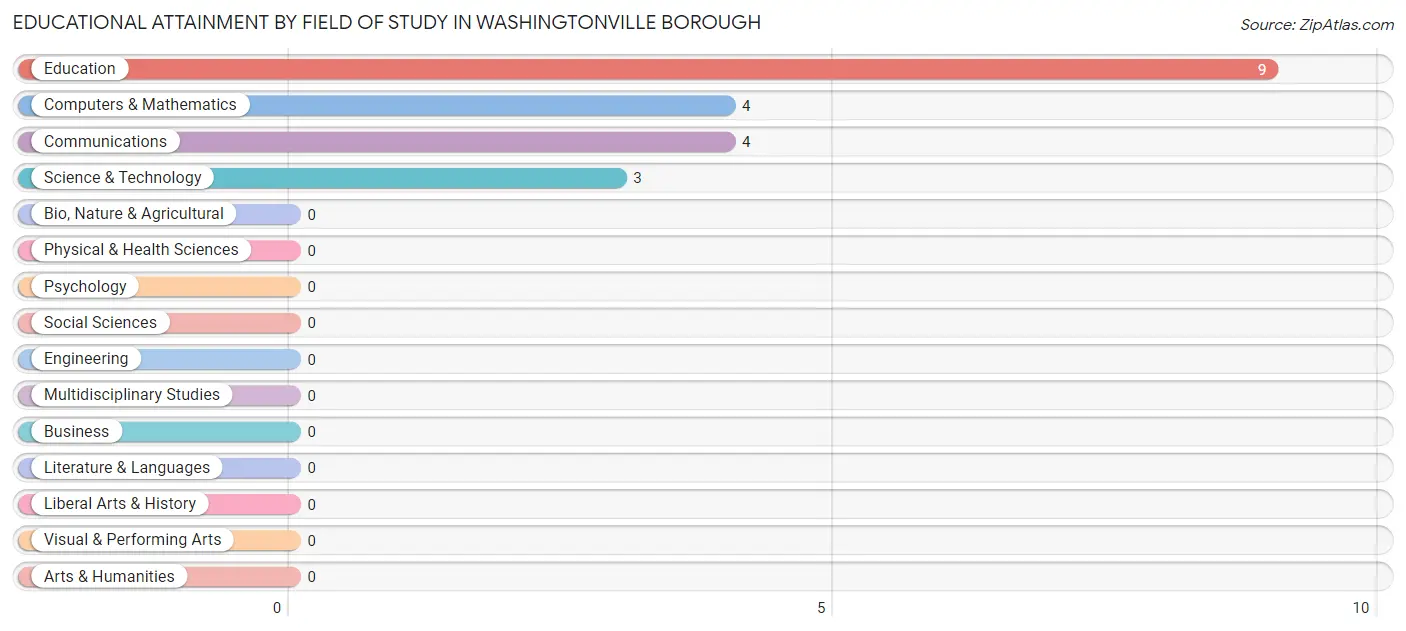
| Field of Study | # Graduates | % Graduates |
| Computers & Mathematics | 4 | 20.0% |
| Bio, Nature & Agricultural | 0 | 0.0% |
| Physical & Health Sciences | 0 | 0.0% |
| Psychology | 0 | 0.0% |
| Social Sciences | 0 | 0.0% |
| Engineering | 0 | 0.0% |
| Multidisciplinary Studies | 0 | 0.0% |
| Science & Technology | 3 | 15.0% |
| Business | 0 | 0.0% |
| Education | 9 | 45.0% |
| Literature & Languages | 0 | 0.0% |
| Liberal Arts & History | 0 | 0.0% |
| Visual & Performing Arts | 0 | 0.0% |
| Communications | 4 | 20.0% |
| Arts & Humanities | 0 | 0.0% |
| Total | 20 | 100.0% |
Transportation & Commute in Washingtonville borough
Vehicle Availability by Sex in Washingtonville borough
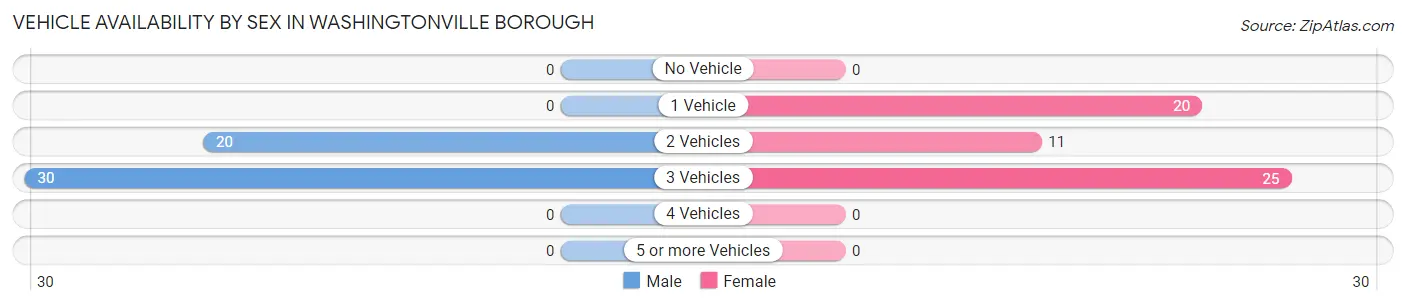
The most prevalent vehicle ownership categories in Washingtonville borough are males with 3 vehicles (30, accounting for 60.0%) and females with 3 vehicles (25, making up 53.6%).
| Vehicles Available | Male | Female |
| No Vehicle | 0 (0.0%) | 0 (0.0%) |
| 1 Vehicle | 0 (0.0%) | 20 (35.7%) |
| 2 Vehicles | 20 (40.0%) | 11 (19.6%) |
| 3 Vehicles | 30 (60.0%) | 25 (44.6%) |
| 4 Vehicles | 0 (0.0%) | 0 (0.0%) |
| 5 or more Vehicles | 0 (0.0%) | 0 (0.0%) |
| Total | 50 (100.0%) | 56 (100.0%) |
Commute Time in Washingtonville borough
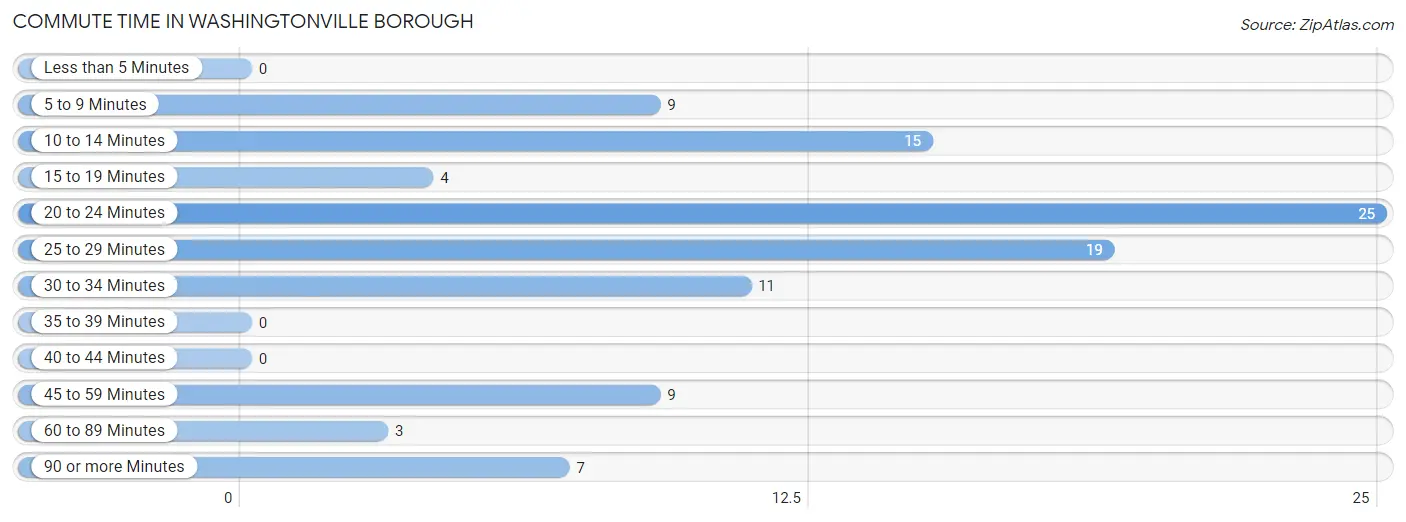
The most frequently occuring commute durations in Washingtonville borough are 20 to 24 minutes (25 commuters, 24.5%), 25 to 29 minutes (19 commuters, 18.6%), and 10 to 14 minutes (15 commuters, 14.7%).
| Commute Time | # Commuters | % Commuters |
| Less than 5 Minutes | 0 | 0.0% |
| 5 to 9 Minutes | 9 | 8.8% |
| 10 to 14 Minutes | 15 | 14.7% |
| 15 to 19 Minutes | 4 | 3.9% |
| 20 to 24 Minutes | 25 | 24.5% |
| 25 to 29 Minutes | 19 | 18.6% |
| 30 to 34 Minutes | 11 | 10.8% |
| 35 to 39 Minutes | 0 | 0.0% |
| 40 to 44 Minutes | 0 | 0.0% |
| 45 to 59 Minutes | 9 | 8.8% |
| 60 to 89 Minutes | 3 | 2.9% |
| 90 or more Minutes | 7 | 6.9% |
Commute Time by Sex in Washingtonville borough
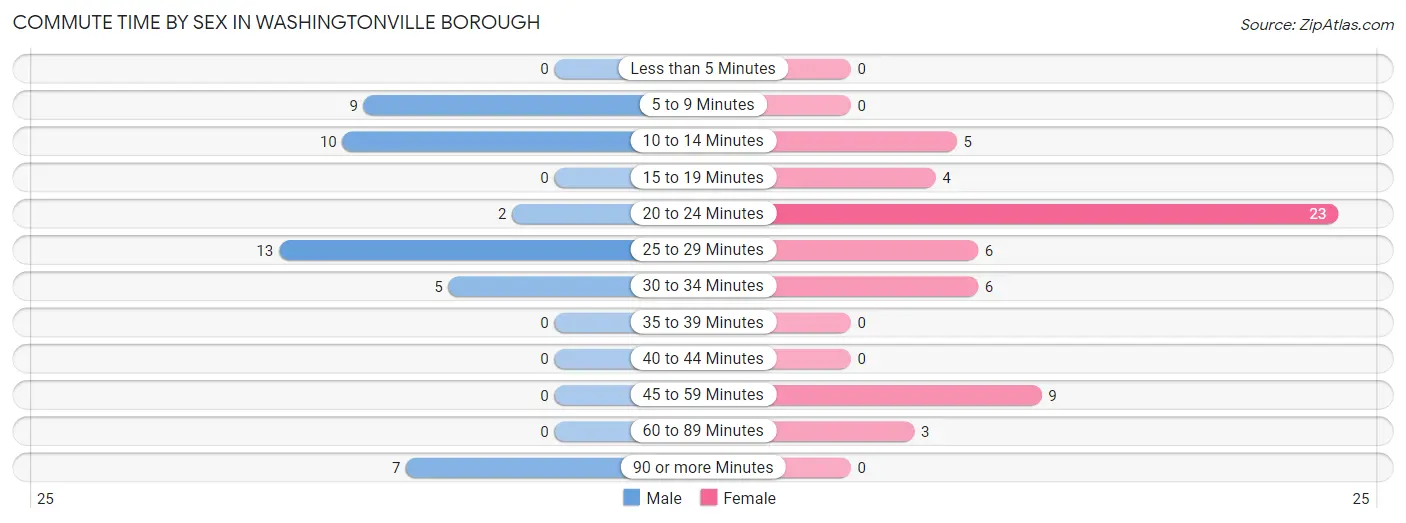
The most common commute times in Washingtonville borough are 25 to 29 minutes (13 commuters, 28.3%) for males and 20 to 24 minutes (23 commuters, 41.1%) for females.
| Commute Time | Male | Female |
| Less than 5 Minutes | 0 (0.0%) | 0 (0.0%) |
| 5 to 9 Minutes | 9 (19.6%) | 0 (0.0%) |
| 10 to 14 Minutes | 10 (21.7%) | 5 (8.9%) |
| 15 to 19 Minutes | 0 (0.0%) | 4 (7.1%) |
| 20 to 24 Minutes | 2 (4.3%) | 23 (41.1%) |
| 25 to 29 Minutes | 13 (28.3%) | 6 (10.7%) |
| 30 to 34 Minutes | 5 (10.9%) | 6 (10.7%) |
| 35 to 39 Minutes | 0 (0.0%) | 0 (0.0%) |
| 40 to 44 Minutes | 0 (0.0%) | 0 (0.0%) |
| 45 to 59 Minutes | 0 (0.0%) | 9 (16.1%) |
| 60 to 89 Minutes | 0 (0.0%) | 3 (5.4%) |
| 90 or more Minutes | 7 (15.2%) | 0 (0.0%) |
Time of Departure to Work by Sex in Washingtonville borough
The most frequent times of departure to work in Washingtonville borough are 6:00 AM to 6:29 AM (17, 37.0%) for males and 7:00 AM to 7:29 AM (29, 51.8%) for females.
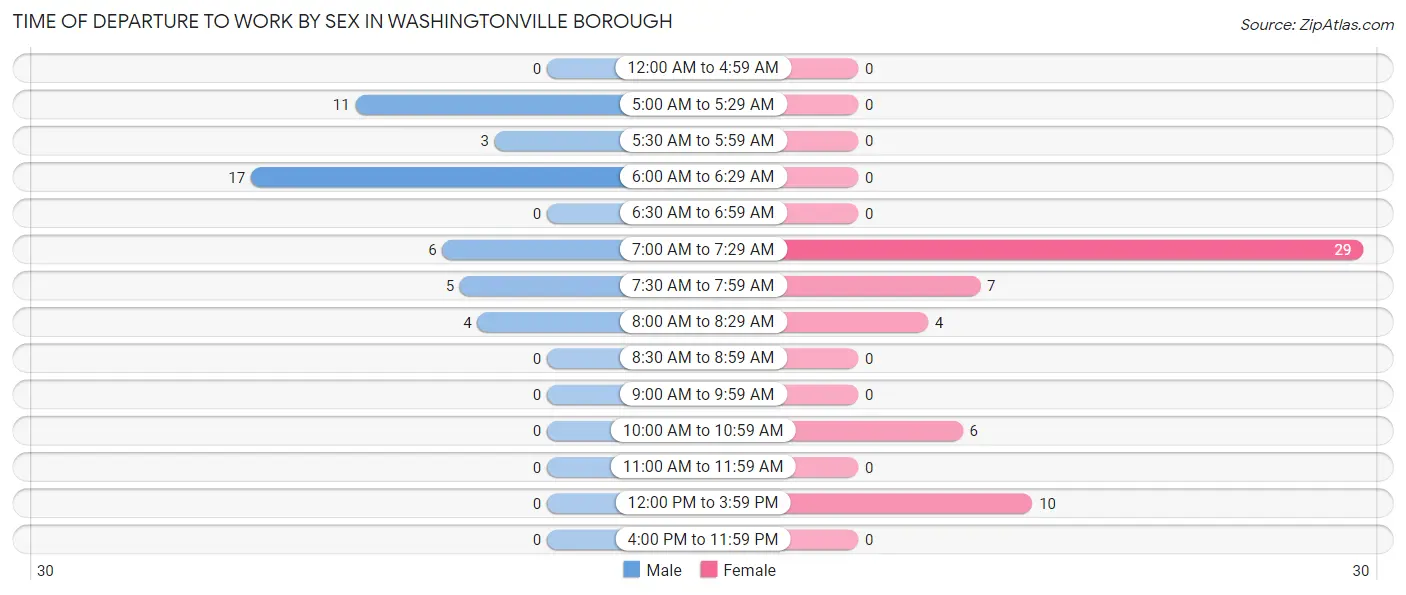
| Time of Departure | Male | Female |
| 12:00 AM to 4:59 AM | 0 (0.0%) | 0 (0.0%) |
| 5:00 AM to 5:29 AM | 11 (23.9%) | 0 (0.0%) |
| 5:30 AM to 5:59 AM | 3 (6.5%) | 0 (0.0%) |
| 6:00 AM to 6:29 AM | 17 (37.0%) | 0 (0.0%) |
| 6:30 AM to 6:59 AM | 0 (0.0%) | 0 (0.0%) |
| 7:00 AM to 7:29 AM | 6 (13.0%) | 29 (51.8%) |
| 7:30 AM to 7:59 AM | 5 (10.9%) | 7 (12.5%) |
| 8:00 AM to 8:29 AM | 4 (8.7%) | 4 (7.1%) |
| 8:30 AM to 8:59 AM | 0 (0.0%) | 0 (0.0%) |
| 9:00 AM to 9:59 AM | 0 (0.0%) | 0 (0.0%) |
| 10:00 AM to 10:59 AM | 0 (0.0%) | 6 (10.7%) |
| 11:00 AM to 11:59 AM | 0 (0.0%) | 0 (0.0%) |
| 12:00 PM to 3:59 PM | 0 (0.0%) | 10 (17.9%) |
| 4:00 PM to 11:59 PM | 0 (0.0%) | 0 (0.0%) |
| Total | 46 (100.0%) | 56 (100.0%) |
Housing Occupancy in Washingtonville borough
Occupancy by Ownership in Washingtonville borough
Of the total 108 dwellings in Washingtonville borough, owner-occupied units account for 25 (23.2%), while renter-occupied units make up 83 (76.8%).
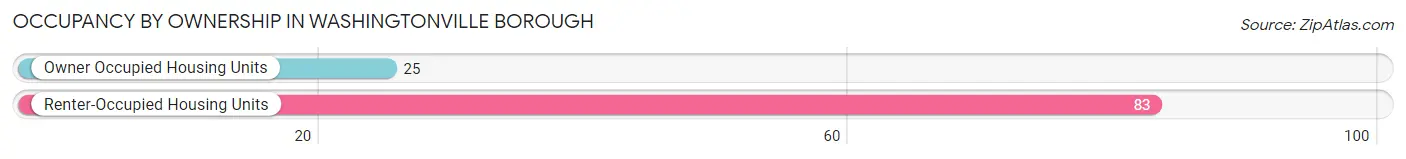
| Occupancy | # Housing Units | % Housing Units |
| Owner Occupied Housing Units | 25 | 23.2% |
| Renter-Occupied Housing Units | 83 | 76.8% |
| Total Occupied Housing Units | 108 | 100.0% |
Occupancy by Household Size in Washingtonville borough
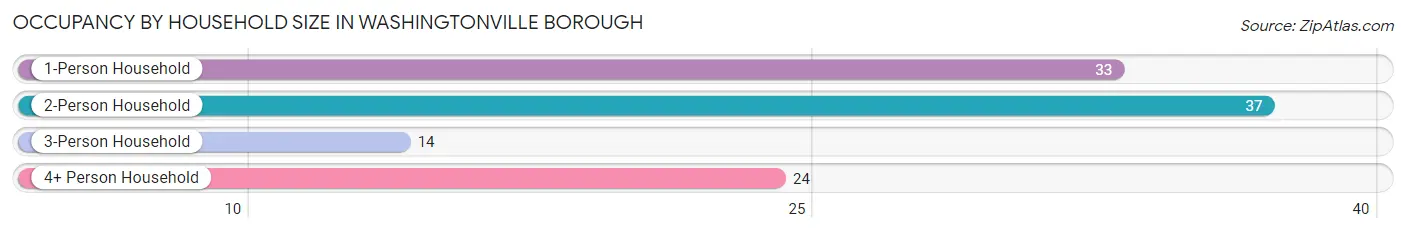
| Household Size | # Housing Units | % Housing Units |
| 1-Person Household | 33 | 30.6% |
| 2-Person Household | 37 | 34.3% |
| 3-Person Household | 14 | 13.0% |
| 4+ Person Household | 24 | 22.2% |
| Total Housing Units | 108 | 100.0% |
Occupancy by Ownership by Household Size in Washingtonville borough
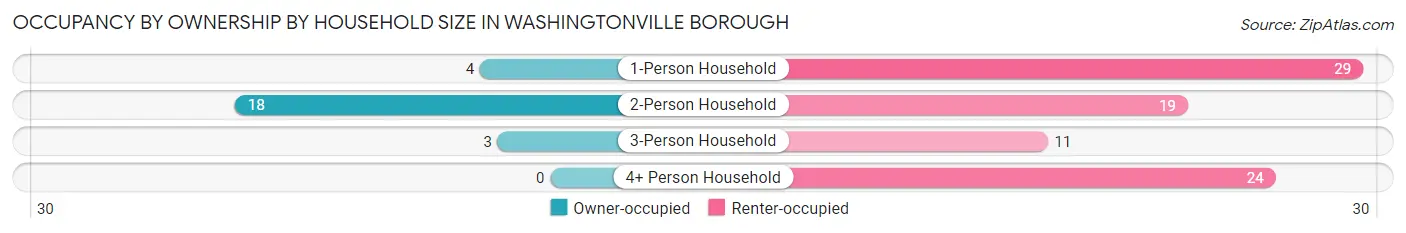
| Household Size | Owner-occupied | Renter-occupied |
| 1-Person Household | 4 (12.1%) | 29 (87.9%) |
| 2-Person Household | 18 (48.6%) | 19 (51.3%) |
| 3-Person Household | 3 (21.4%) | 11 (78.6%) |
| 4+ Person Household | 0 (0.0%) | 24 (100.0%) |
| Total Housing Units | 25 (23.2%) | 83 (76.8%) |
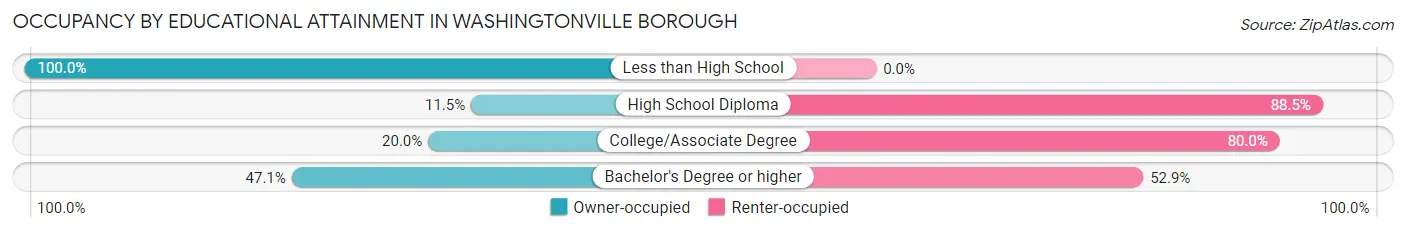
Occupancy by Educational Attainment in Washingtonville borough
| Household Size | Owner-occupied | Renter-occupied |
| Less than High School | 5 (100.0%) | 0 (0.0%) |
| High School Diploma | 7 (11.5%) | 54 (88.5%) |
| College/Associate Degree | 5 (20.0%) | 20 (80.0%) |
| Bachelor's Degree or higher | 8 (47.1%) | 9 (52.9%) |
Occupancy by Age of Householder in Washingtonville borough
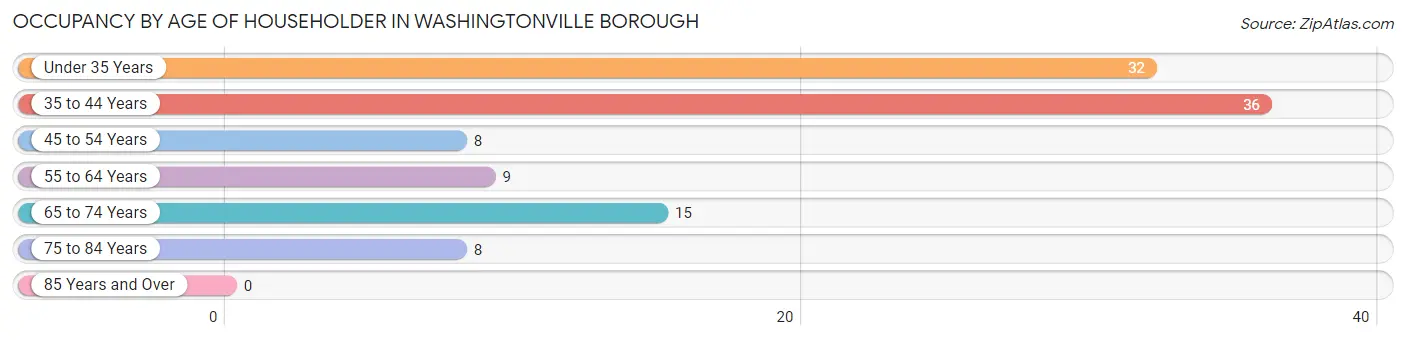
| Age Bracket | # Households | % Households |
| Under 35 Years | 32 | 29.6% |
| 35 to 44 Years | 36 | 33.3% |
| 45 to 54 Years | 8 | 7.4% |
| 55 to 64 Years | 9 | 8.3% |
| 65 to 74 Years | 15 | 13.9% |
| 75 to 84 Years | 8 | 7.4% |
| 85 Years and Over | 0 | 0.0% |
| Total | 108 | 100.0% |
Housing Finances in Washingtonville borough
Median Income by Occupancy in Washingtonville borough
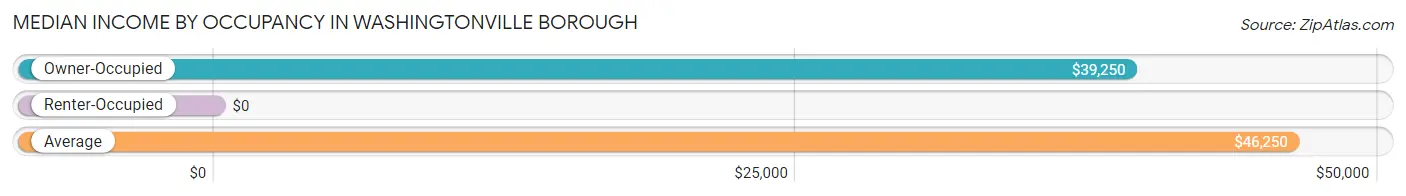
| Occupancy Type | # Households | Median Income |
| Owner-Occupied | 25 (23.2%) | $39,250 |
| Renter-Occupied | 83 (76.8%) | $0 |
| Average | 108 (100.0%) | $46,250 |
Occupancy by Householder Income Bracket in Washingtonville borough
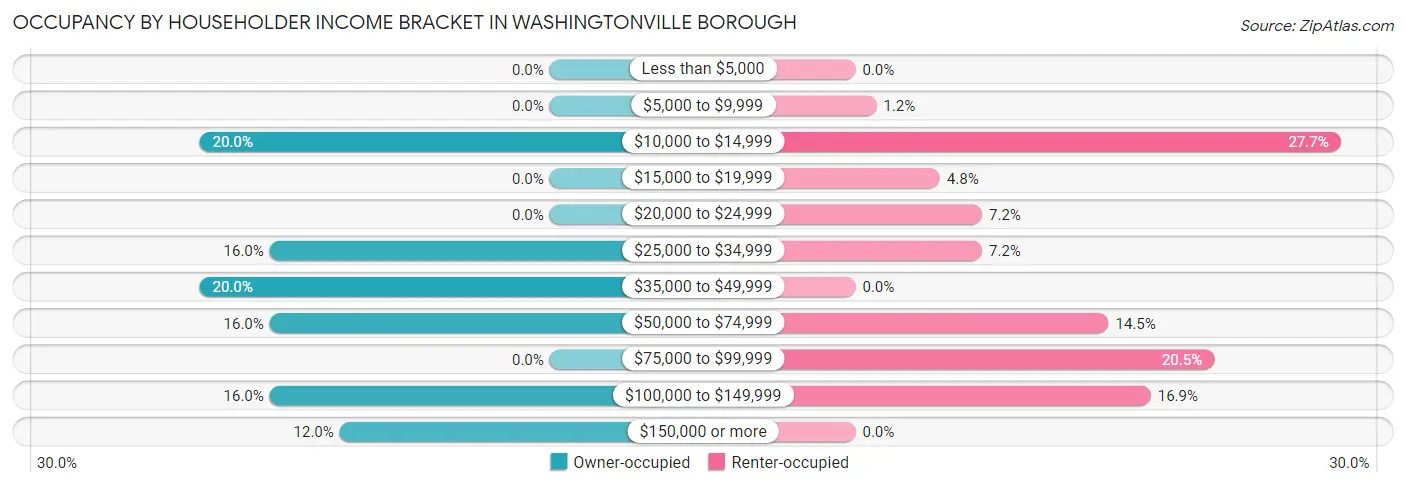
| Income Bracket | Owner-occupied | Renter-occupied |
| Less than $5,000 | 0 (0.0%) | 0 (0.0%) |
| $5,000 to $9,999 | 0 (0.0%) | 1 (1.2%) |
| $10,000 to $14,999 | 5 (20.0%) | 23 (27.7%) |
| $15,000 to $19,999 | 0 (0.0%) | 4 (4.8%) |
| $20,000 to $24,999 | 0 (0.0%) | 6 (7.2%) |
| $25,000 to $34,999 | 4 (16.0%) | 6 (7.2%) |
| $35,000 to $49,999 | 5 (20.0%) | 0 (0.0%) |
| $50,000 to $74,999 | 4 (16.0%) | 12 (14.5%) |
| $75,000 to $99,999 | 0 (0.0%) | 17 (20.5%) |
| $100,000 to $149,999 | 4 (16.0%) | 14 (16.9%) |
| $150,000 or more | 3 (12.0%) | 0 (0.0%) |
| Total | 25 (100.0%) | 83 (100.0%) |
Monthly Housing Cost Tiers in Washingtonville borough
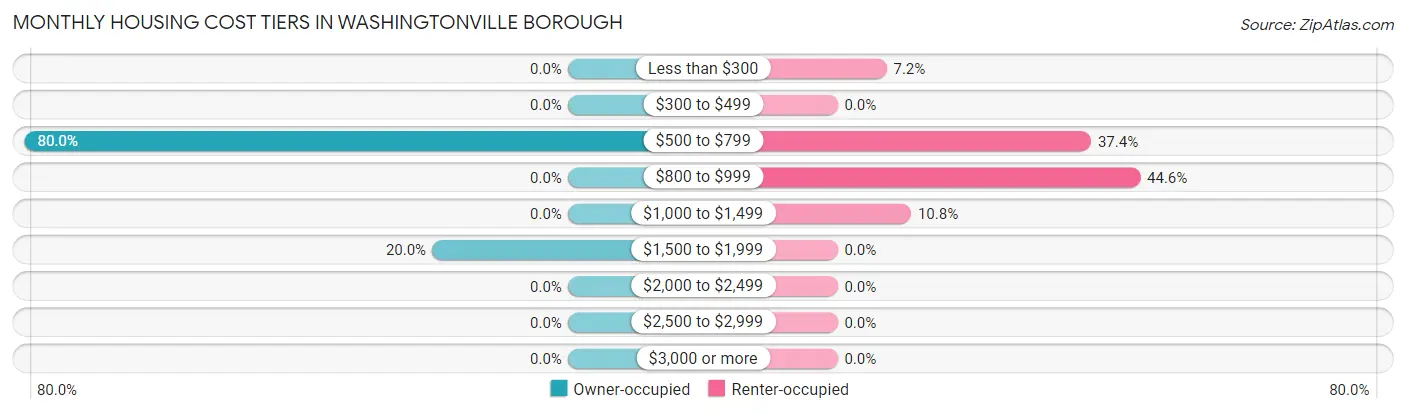
| Monthly Cost | Owner-occupied | Renter-occupied |
| Less than $300 | 0 (0.0%) | 6 (7.2%) |
| $300 to $499 | 0 (0.0%) | 0 (0.0%) |
| $500 to $799 | 20 (80.0%) | 31 (37.3%) |
| $800 to $999 | 0 (0.0%) | 37 (44.6%) |
| $1,000 to $1,499 | 0 (0.0%) | 9 (10.8%) |
| $1,500 to $1,999 | 5 (20.0%) | 0 (0.0%) |
| $2,000 to $2,499 | 0 (0.0%) | 0 (0.0%) |
| $2,500 to $2,999 | 0 (0.0%) | 0 (0.0%) |
| $3,000 or more | 0 (0.0%) | 0 (0.0%) |
| Total | 25 (100.0%) | 83 (100.0%) |
Physical Housing Characteristics in Washingtonville borough
Housing Structures in Washingtonville borough
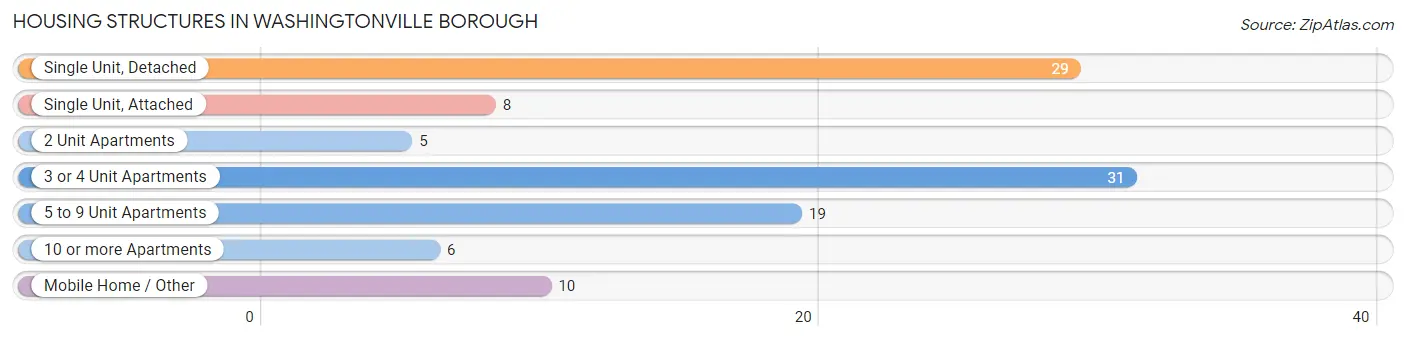
| Structure Type | # Housing Units | % Housing Units |
| Single Unit, Detached | 29 | 26.9% |
| Single Unit, Attached | 8 | 7.4% |
| 2 Unit Apartments | 5 | 4.6% |
| 3 or 4 Unit Apartments | 31 | 28.7% |
| 5 to 9 Unit Apartments | 19 | 17.6% |
| 10 or more Apartments | 6 | 5.6% |
| Mobile Home / Other | 10 | 9.3% |
| Total | 108 | 100.0% |
Housing Structures by Occupancy in Washingtonville borough
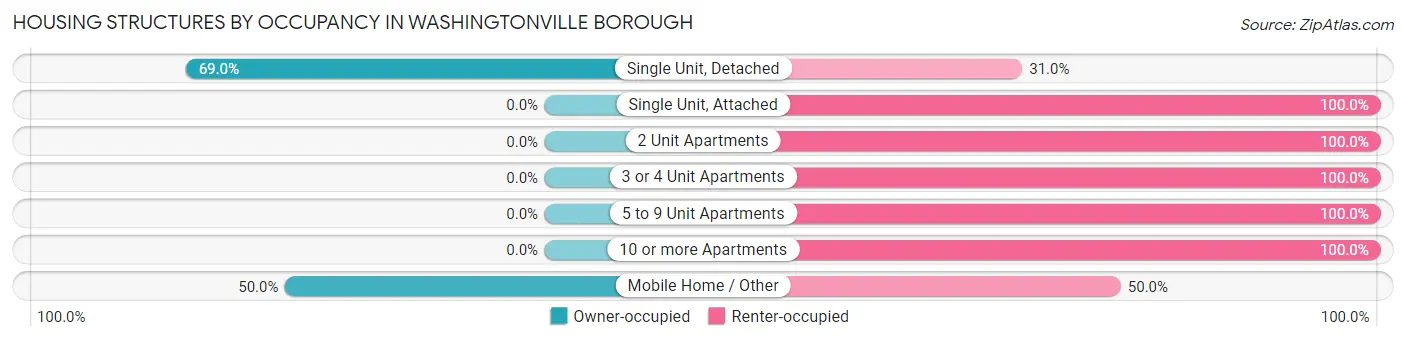
| Structure Type | Owner-occupied | Renter-occupied |
| Single Unit, Detached | 20 (69.0%) | 9 (31.0%) |
| Single Unit, Attached | 0 (0.0%) | 8 (100.0%) |
| 2 Unit Apartments | 0 (0.0%) | 5 (100.0%) |
| 3 or 4 Unit Apartments | 0 (0.0%) | 31 (100.0%) |
| 5 to 9 Unit Apartments | 0 (0.0%) | 19 (100.0%) |
| 10 or more Apartments | 0 (0.0%) | 6 (100.0%) |
| Mobile Home / Other | 5 (50.0%) | 5 (50.0%) |
| Total | 25 (23.2%) | 83 (76.8%) |
Housing Structures by Number of Rooms in Washingtonville borough
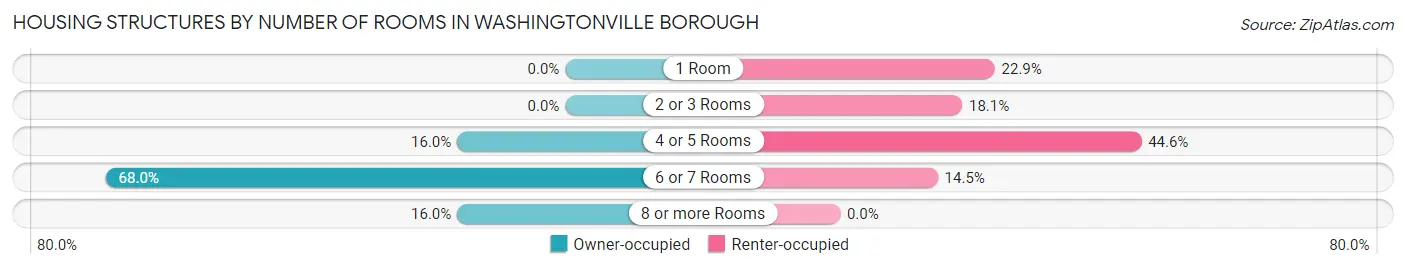
| Number of Rooms | Owner-occupied | Renter-occupied |
| 1 Room | 0 (0.0%) | 19 (22.9%) |
| 2 or 3 Rooms | 0 (0.0%) | 15 (18.1%) |
| 4 or 5 Rooms | 4 (16.0%) | 37 (44.6%) |
| 6 or 7 Rooms | 17 (68.0%) | 12 (14.5%) |
| 8 or more Rooms | 4 (16.0%) | 0 (0.0%) |
| Total | 25 (100.0%) | 83 (100.0%) |
Housing Structure by Heating Type in Washingtonville borough
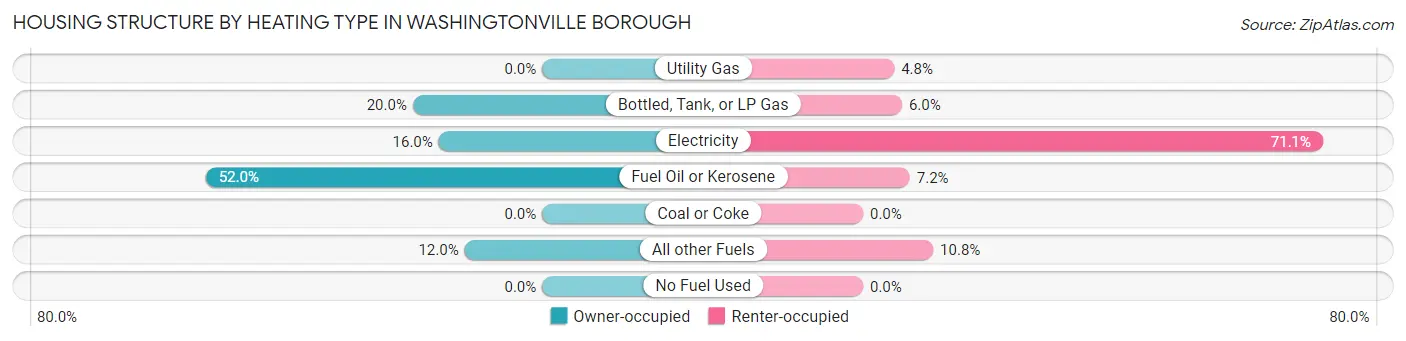
| Heating Type | Owner-occupied | Renter-occupied |
| Utility Gas | 0 (0.0%) | 4 (4.8%) |
| Bottled, Tank, or LP Gas | 5 (20.0%) | 5 (6.0%) |
| Electricity | 4 (16.0%) | 59 (71.1%) |
| Fuel Oil or Kerosene | 13 (52.0%) | 6 (7.2%) |
| Coal or Coke | 0 (0.0%) | 0 (0.0%) |
| All other Fuels | 3 (12.0%) | 9 (10.8%) |
| No Fuel Used | 0 (0.0%) | 0 (0.0%) |
| Total | 25 (100.0%) | 83 (100.0%) |
Household Vehicle Usage in Washingtonville borough
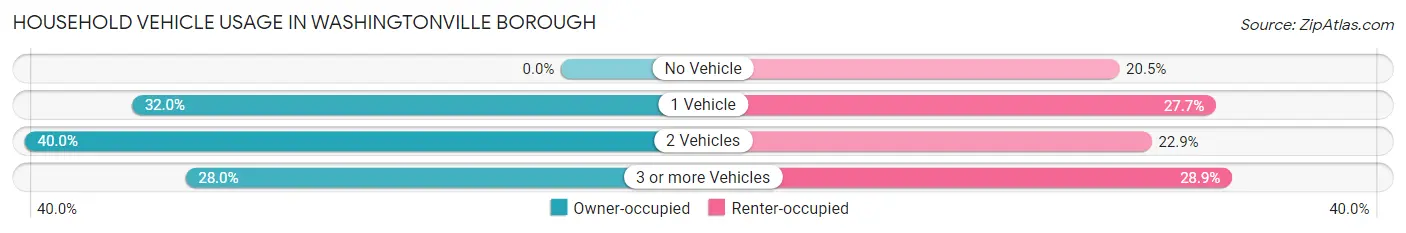
| Vehicles per Household | Owner-occupied | Renter-occupied |
| No Vehicle | 0 (0.0%) | 17 (20.5%) |
| 1 Vehicle | 8 (32.0%) | 23 (27.7%) |
| 2 Vehicles | 10 (40.0%) | 19 (22.9%) |
| 3 or more Vehicles | 7 (28.0%) | 24 (28.9%) |
| Total | 25 (100.0%) | 83 (100.0%) |
Real Estate & Mortgages in Washingtonville borough
Real Estate and Mortgage Overview in Washingtonville borough
| Characteristic | Without Mortgage | With Mortgage |
| Housing Units | 16 | 9 |
| Median Property Value | $455,600 | $0 |
| Median Household Income | - | - |
| Monthly Housing Costs | $611 | $0 |
| Real Estate Taxes | $2,385 | $0 |
Property Value by Mortgage Status in Washingtonville borough
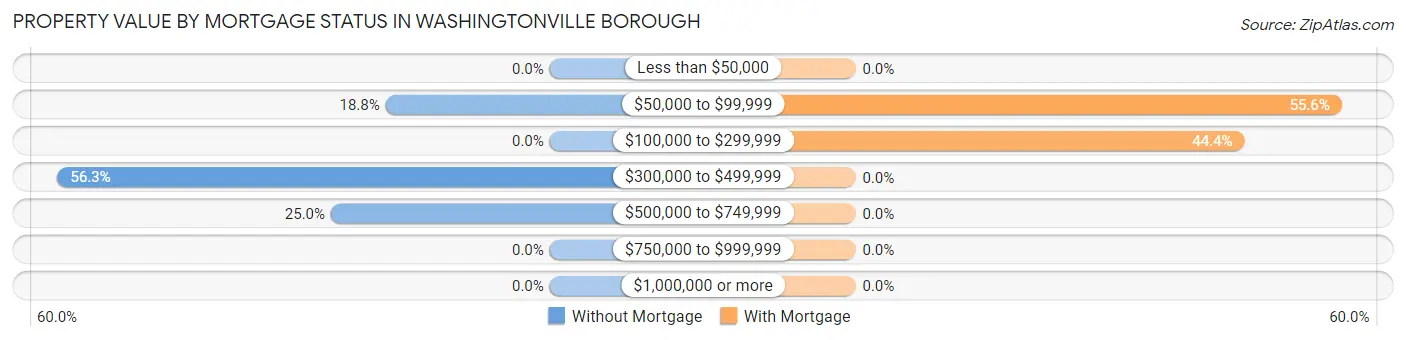
| Property Value | Without Mortgage | With Mortgage |
| Less than $50,000 | 0 (0.0%) | 0 (0.0%) |
| $50,000 to $99,999 | 3 (18.8%) | 5 (55.6%) |
| $100,000 to $299,999 | 0 (0.0%) | 4 (44.4%) |
| $300,000 to $499,999 | 9 (56.2%) | 0 (0.0%) |
| $500,000 to $749,999 | 4 (25.0%) | 0 (0.0%) |
| $750,000 to $999,999 | 0 (0.0%) | 0 (0.0%) |
| $1,000,000 or more | 0 (0.0%) | 0 (0.0%) |
| Total | 16 (100.0%) | 9 (100.0%) |
Household Income by Mortgage Status in Washingtonville borough
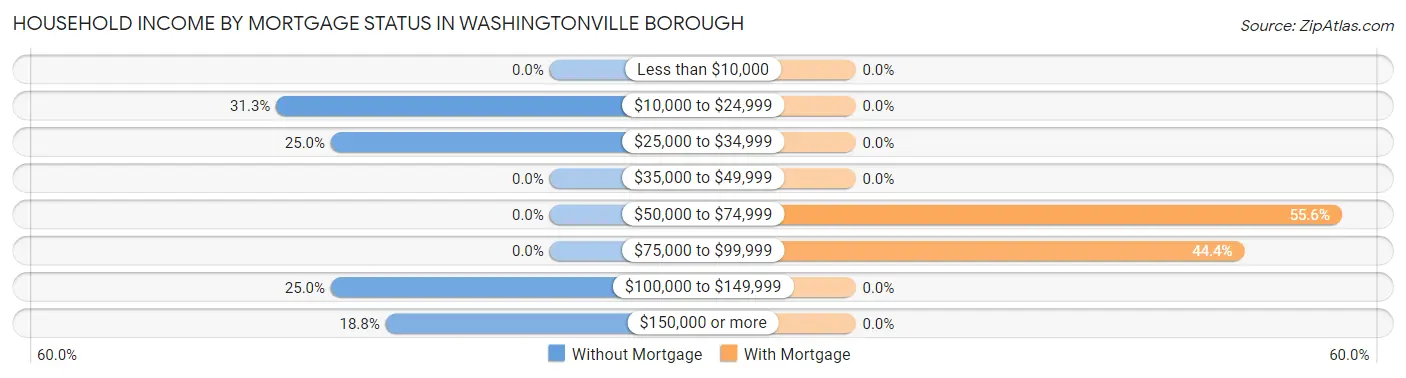
| Household Income | Without Mortgage | With Mortgage |
| Less than $10,000 | 0 (0.0%) | 0 (0.0%) |
| $10,000 to $24,999 | 5 (31.2%) | 0 (0.0%) |
| $25,000 to $34,999 | 4 (25.0%) | 0 (0.0%) |
| $35,000 to $49,999 | 0 (0.0%) | 0 (0.0%) |
| $50,000 to $74,999 | 0 (0.0%) | 5 (55.6%) |
| $75,000 to $99,999 | 0 (0.0%) | 4 (44.4%) |
| $100,000 to $149,999 | 4 (25.0%) | 0 (0.0%) |
| $150,000 or more | 3 (18.8%) | 0 (0.0%) |
| Total | 16 (100.0%) | 9 (100.0%) |
Property Value to Household Income Ratio in Washingtonville borough
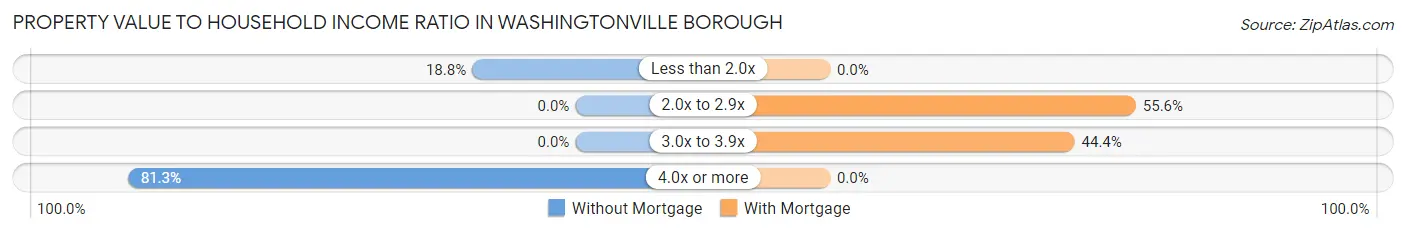
| Value-to-Income Ratio | Without Mortgage | With Mortgage |
| Less than 2.0x | 3 (18.8%) | 0 (0.0%) |
| 2.0x to 2.9x | 0 (0.0%) | 5 (55.6%) |
| 3.0x to 3.9x | 0 (0.0%) | 4 (44.4%) |
| 4.0x or more | 13 (81.2%) | 0 (0.0%) |
| Total | 16 (100.0%) | 9 (100.0%) |
Real Estate Taxes by Mortgage Status in Washingtonville borough
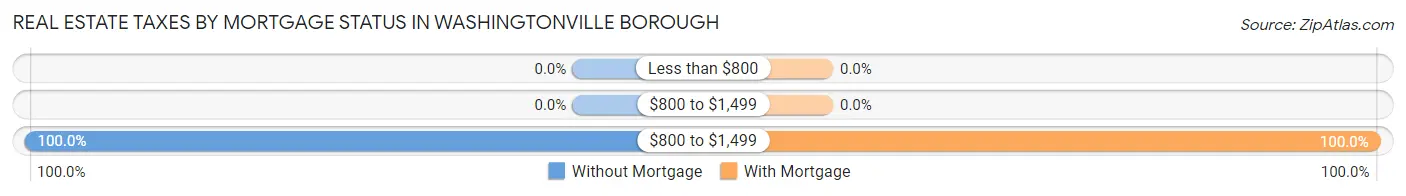
| Property Taxes | Without Mortgage | With Mortgage |
| Less than $800 | 0 (0.0%) | 0 (0.0%) |
| $800 to $1,499 | 0 (0.0%) | 0 (0.0%) |
| $800 to $1,499 | 16 (100.0%) | 9 (100.0%) |
| Total | 16 (100.0%) | 9 (100.0%) |
Health & Disability in Washingtonville borough
Health Insurance Coverage by Age in Washingtonville borough
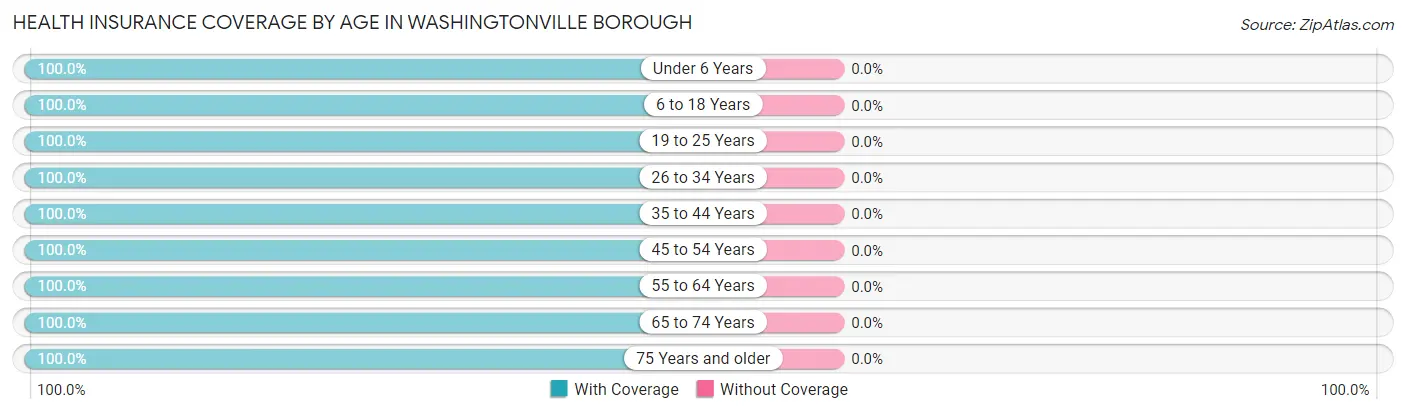
| Age Bracket | With Coverage | Without Coverage |
| Under 6 Years | 35 (100.0%) | 0 (0.0%) |
| 6 to 18 Years | 16 (100.0%) | 0 (0.0%) |
| 19 to 25 Years | 32 (100.0%) | 0 (0.0%) |
| 26 to 34 Years | 25 (100.0%) | 0 (0.0%) |
| 35 to 44 Years | 50 (100.0%) | 0 (0.0%) |
| 45 to 54 Years | 18 (100.0%) | 0 (0.0%) |
| 55 to 64 Years | 12 (100.0%) | 0 (0.0%) |
| 65 to 74 Years | 25 (100.0%) | 0 (0.0%) |
| 75 Years and older | 8 (100.0%) | 0 (0.0%) |
| Total | 221 (100.0%) | 0 (0.0%) |
Health Insurance Coverage by Citizenship Status in Washingtonville borough
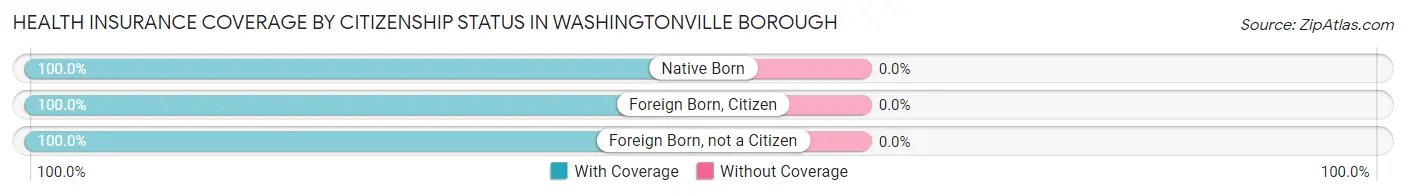
| Citizenship Status | With Coverage | Without Coverage |
| Native Born | 35 (100.0%) | 0 (0.0%) |
| Foreign Born, Citizen | 16 (100.0%) | 0 (0.0%) |
| Foreign Born, not a Citizen | 32 (100.0%) | 0 (0.0%) |
Health Insurance Coverage by Household Income in Washingtonville borough
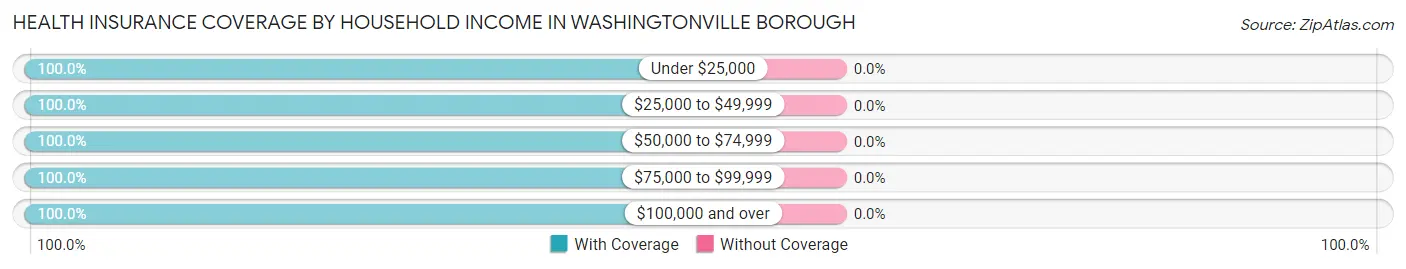
| Household Income | With Coverage | Without Coverage |
| Under $25,000 | 55 (100.0%) | 0 (0.0%) |
| $25,000 to $49,999 | 25 (100.0%) | 0 (0.0%) |
| $50,000 to $74,999 | 49 (100.0%) | 0 (0.0%) |
| $75,000 to $99,999 | 46 (100.0%) | 0 (0.0%) |
| $100,000 and over | 46 (100.0%) | 0 (0.0%) |
Public vs Private Health Insurance Coverage by Age in Washingtonville borough
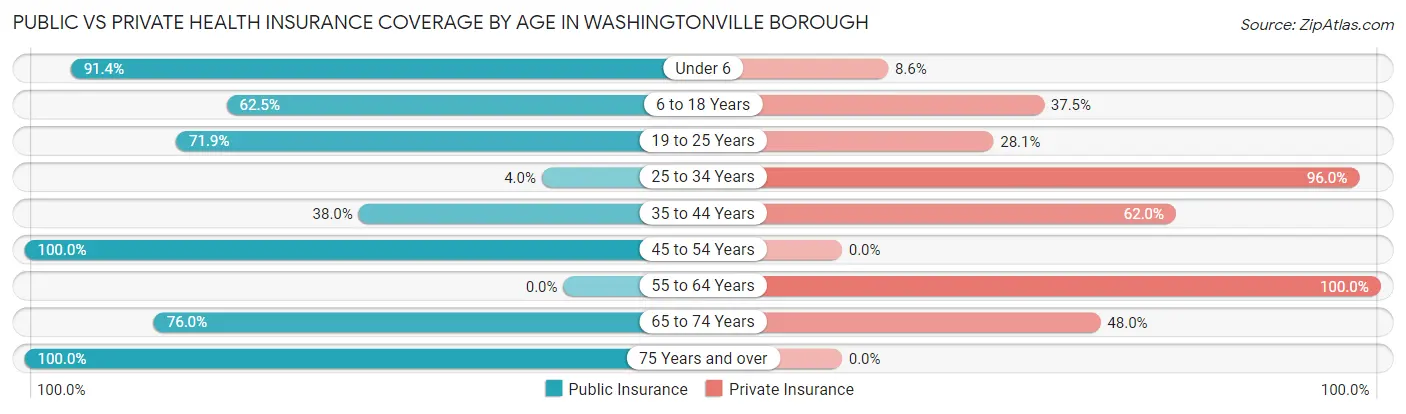
| Age Bracket | Public Insurance | Private Insurance |
| Under 6 | 32 (91.4%) | 3 (8.6%) |
| 6 to 18 Years | 10 (62.5%) | 6 (37.5%) |
| 19 to 25 Years | 23 (71.9%) | 9 (28.1%) |
| 25 to 34 Years | 1 (4.0%) | 24 (96.0%) |
| 35 to 44 Years | 19 (38.0%) | 31 (62.0%) |
| 45 to 54 Years | 18 (100.0%) | 0 (0.0%) |
| 55 to 64 Years | 0 (0.0%) | 12 (100.0%) |
| 65 to 74 Years | 19 (76.0%) | 12 (48.0%) |
| 75 Years and over | 8 (100.0%) | 0 (0.0%) |
| Total | 130 (58.8%) | 97 (43.9%) |
Disability Status by Sex by Age in Washingtonville borough
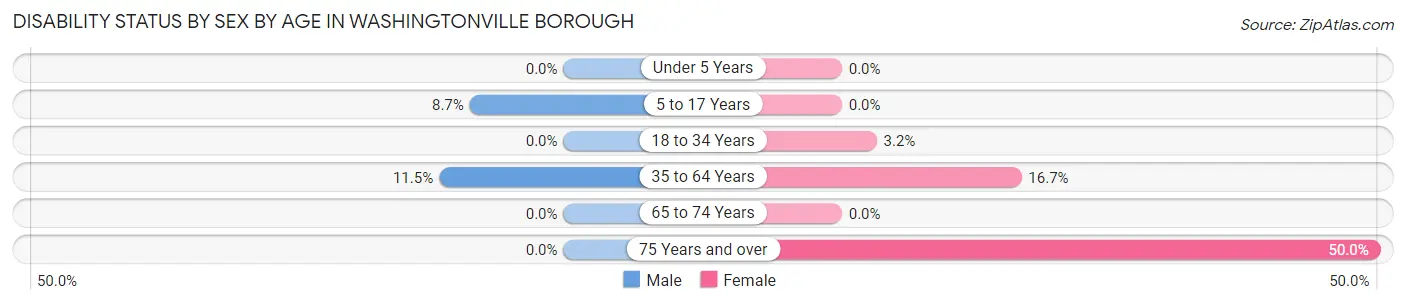
| Age Bracket | Male | Female |
| Under 5 Years | 0 (0.0%) | 0 (0.0%) |
| 5 to 17 Years | 2 (8.7%) | 0 (0.0%) |
| 18 to 34 Years | 0 (0.0%) | 1 (3.2%) |
| 35 to 64 Years | 3 (11.5%) | 9 (16.7%) |
| 65 to 74 Years | 0 (0.0%) | 0 (0.0%) |
| 75 Years and over | 0 (0.0%) | 4 (50.0%) |
Disability Class by Sex by Age in Washingtonville borough
Disability Class: Hearing Difficulty
| Age Bracket | Male | Female |
| Under 5 Years | 0 (0.0%) | 0 (0.0%) |
| 5 to 17 Years | 0 (0.0%) | 0 (0.0%) |
| 18 to 34 Years | 0 (0.0%) | 0 (0.0%) |
| 35 to 64 Years | 0 (0.0%) | 0 (0.0%) |
| 65 to 74 Years | 0 (0.0%) | 0 (0.0%) |
| 75 Years and over | 0 (0.0%) | 0 (0.0%) |
Disability Class: Vision Difficulty
| Age Bracket | Male | Female |
| Under 5 Years | 0 (0.0%) | 0 (0.0%) |
| 5 to 17 Years | 0 (0.0%) | 0 (0.0%) |
| 18 to 34 Years | 0 (0.0%) | 0 (0.0%) |
| 35 to 64 Years | 0 (0.0%) | 0 (0.0%) |
| 65 to 74 Years | 0 (0.0%) | 0 (0.0%) |
| 75 Years and over | 0 (0.0%) | 0 (0.0%) |
Disability Class: Cognitive Difficulty
| Age Bracket | Male | Female |
| 5 to 17 Years | 2 (8.7%) | 0 (0.0%) |
| 18 to 34 Years | 0 (0.0%) | 0 (0.0%) |
| 35 to 64 Years | 0 (0.0%) | 0 (0.0%) |
| 65 to 74 Years | 0 (0.0%) | 0 (0.0%) |
| 75 Years and over | 0 (0.0%) | 0 (0.0%) |
Disability Class: Ambulatory Difficulty
| Age Bracket | Male | Female |
| 5 to 17 Years | 0 (0.0%) | 0 (0.0%) |
| 18 to 34 Years | 0 (0.0%) | 1 (3.2%) |
| 35 to 64 Years | 3 (11.5%) | 0 (0.0%) |
| 65 to 74 Years | 0 (0.0%) | 0 (0.0%) |
| 75 Years and over | 0 (0.0%) | 4 (50.0%) |
Disability Class: Self-Care Difficulty
| Age Bracket | Male | Female |
| 5 to 17 Years | 0 (0.0%) | 0 (0.0%) |
| 18 to 34 Years | 0 (0.0%) | 0 (0.0%) |
| 35 to 64 Years | 0 (0.0%) | 0 (0.0%) |
| 65 to 74 Years | 0 (0.0%) | 0 (0.0%) |
| 75 Years and over | 0 (0.0%) | 0 (0.0%) |
Technology Access in Washingtonville borough
Computing Device Access in Washingtonville borough
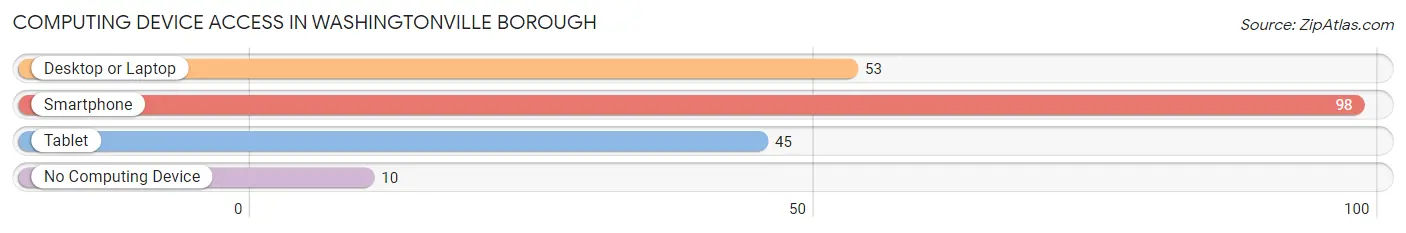
| Device Type | # Households | % Households |
| Desktop or Laptop | 53 | 49.1% |
| Smartphone | 98 | 90.7% |
| Tablet | 45 | 41.7% |
| No Computing Device | 10 | 9.3% |
| Total | 108 | 100.0% |
Internet Access in Washingtonville borough
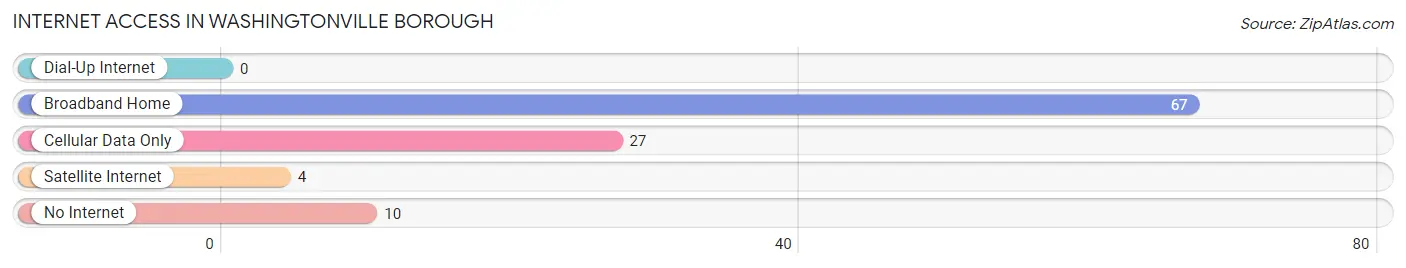
| Internet Type | # Households | % Households |
| Dial-Up Internet | 0 | 0.0% |
| Broadband Home | 67 | 62.0% |
| Cellular Data Only | 27 | 25.0% |
| Satellite Internet | 4 | 3.7% |
| No Internet | 10 | 9.3% |
| Total | 108 | 100.0% |
Washingtonville borough Summary
Introduction
Located in the heart of Pennsylvania’s Lehigh Valley, Washingtonville Borough is a small, rural community with a population of just over 1,000 people. The borough is situated in the northern part of Northampton County, and is bordered by the townships of Allen, East Allen, and Moore. The borough is home to a variety of businesses, including a grocery store, a hardware store, a restaurant, and a few small shops. The borough is also home to a number of churches, a library, and a post office.
History
Washingtonville Borough was founded in 1845 by a group of settlers from the nearby town of Bethlehem. The settlers named the borough after George Washington, the first president of the United States. The borough was officially incorporated in 1851, and the first mayor was elected in 1852.
The borough was originally a farming community, and the main crops grown were wheat, corn, and oats. In the late 19th century, the borough began to industrialize, and several factories were built in the area. The most notable of these was the Washingtonville Iron Works, which was established in 1876 and produced a variety of products, including nails, horseshoes, and farm implements.
The borough continued to grow and prosper throughout the 20th century, and in the 1950s, the borough was home to several small businesses, including a grocery store, a hardware store, a restaurant, and a few small shops. The borough also had a library, a post office, and several churches.
Geography
Washingtonville Borough is located in the northern part of Northampton County, and is bordered by the townships of Allen, East Allen, and Moore. The borough is situated on the banks of the Lehigh River, and is surrounded by rolling hills and farmland. The borough covers an area of approximately 1.2 square miles, and has a population of just over 1,000 people.
The borough is located approximately 25 miles north of Allentown, the county seat of Northampton County, and is approximately 60 miles west of Philadelphia. The borough is also located within a few miles of the Pennsylvania Turnpike, which provides easy access to the rest of the state.
Economy
The economy of Washingtonville Borough is largely based on agriculture and small businesses. The borough is home to a variety of businesses, including a grocery store, a hardware store, a restaurant, and a few small shops. The borough is also home to a number of churches, a library, and a post office.
The borough is also home to several small manufacturing companies, including a metal fabrication plant and a plastics manufacturing plant. The borough is also home to a number of farms, which produce a variety of crops, including wheat, corn, and oats.
Demographics
As of the 2010 census, the population of Washingtonville Borough was 1,072. The racial makeup of the borough was 97.2% White, 0.9% African American, 0.3% Native American, 0.3% Asian, 0.1% Pacific Islander, 0.3% from other races, and 0.9% from two or more races. Hispanic or Latino of any race were 1.2% of the population.
The median household income in the borough was $45,833, and the median family income was $51,250. The per capita income for the borough was $20,945. About 8.3% of families and 10.2% of the population were below the poverty line, including 14.3% of those under age 18 and 5.2% of those age 65 or over.
Conclusion
Washingtonville Borough is a small, rural community located in the northern part of Northampton County, Pennsylvania. The borough is home to a variety of businesses, including a grocery store, a hardware store, a restaurant, and a few small shops. The borough is also home to a number of churches, a library, and a post office. The economy of the borough is largely based on agriculture and small businesses, and the population of the borough is just over 1,000 people.
Common Questions
What is Per Capita Income in Washingtonville borough?
Per Capita income in Washingtonville borough is $23,940.
What is the Median Household income in Washingtonville borough?
Median Household Income in Washingtonville borough is $46,250.
What is Income or Wage Gap in Washingtonville borough?
Income or Wage Gap in Washingtonville borough is 68.4%.
Women in Washingtonville borough earn 31.6 cents for every dollar earned by a man.
What is Inequality or Gini Index in Washingtonville borough?
Inequality or Gini Index in Washingtonville borough is 0.42.
What is the Total Population of Washingtonville borough?
Total Population of Washingtonville borough is 221.
What is the Total Male Population of Washingtonville borough?
Total Male Population of Washingtonville borough is 112.
What is the Total Female Population of Washingtonville borough?
Total Female Population of Washingtonville borough is 109.
What is the Ratio of Males per 100 Females in Washingtonville borough?
There are 102.75 Males per 100 Females in Washingtonville borough.
What is the Ratio of Females per 100 Males in Washingtonville borough?
There are 97.32 Females per 100 Males in Washingtonville borough.
What is the Median Population Age in Washingtonville borough?
Median Population Age in Washingtonville borough is 37.3 Years.
What is the Average Family Size in Washingtonville borough
Average Family Size in Washingtonville borough is 2.3 People.
What is the Average Household Size in Washingtonville borough
Average Household Size in Washingtonville borough is 2.0 People.
How Large is the Labor Force in Washingtonville borough?
There are 107 People in the Labor Forcein in Washingtonville borough.
What is the Percentage of People in the Labor Force in Washingtonville borough?
60.1% of People are in the Labor Force in Washingtonville borough.
What is the Unemployment Rate in Washingtonville borough?
Unemployment Rate in Washingtonville borough is 0.9%.