University of Pittsburgh Johnstown, PA Map & Demographics
University of Pittsburgh Johnstown Map
University of Pittsburgh Johnstown Overview
$4,022
PER CAPITA INCOME
36.8%
WAGE / INCOME GAP [ % ]
63.2¢/ $1
WAGE / INCOME GAP [ $ ]
1,428
TOTAL POPULATION
656
MALE POPULATION
772
FEMALE POPULATION
84.97
MALES / 100 FEMALES
117.68
FEMALES / 100 MALES
19.9
MEDIAN AGE
331
LABOR FORCE [ PEOPLE ]
23.2%
PERCENT IN LABOR FORCE
6.1%
UNEMPLOYMENT RATE
Income in University of Pittsburgh Johnstown
Income Overview in University of Pittsburgh Johnstown
| Characteristic | Number | Measure |
| Per Capita Income | 1,428 | $4,022 |
| Median Family Income | 0 | $0 |
| Mean Family Income | 0 | $0 |
| Median Household Income | 0 | $0 |
| Mean Household Income | 0 | $0 |
| Income Deficit | 0 | $0 |
| Wage / Income Gap (%) | 1,428 | 36.81% |
| Wage / Income Gap ($) | 1,428 | 63.19¢ per $1 |
| Gini / Inequality Index | 1,428 | 0.00 |
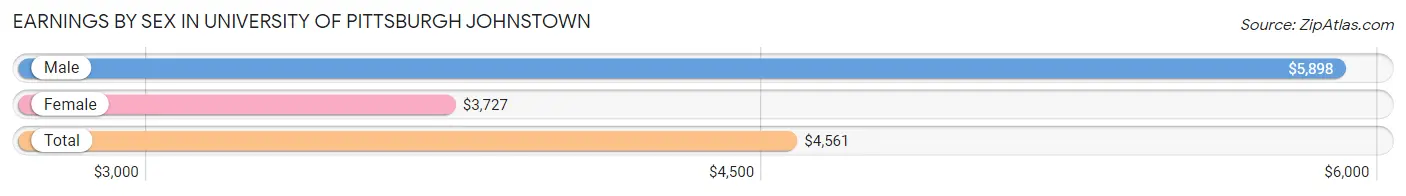
Earnings by Sex in University of Pittsburgh Johnstown
Average Earnings in University of Pittsburgh Johnstown are $4,561, $5,898 for men and $3,727 for women, a difference of 36.8%.
| Sex | Number | Average Earnings |
| Male | 439 (44.1%) | $5,898 |
| Female | 557 (55.9%) | $3,727 |
| Total | 996 (100.0%) | $4,561 |
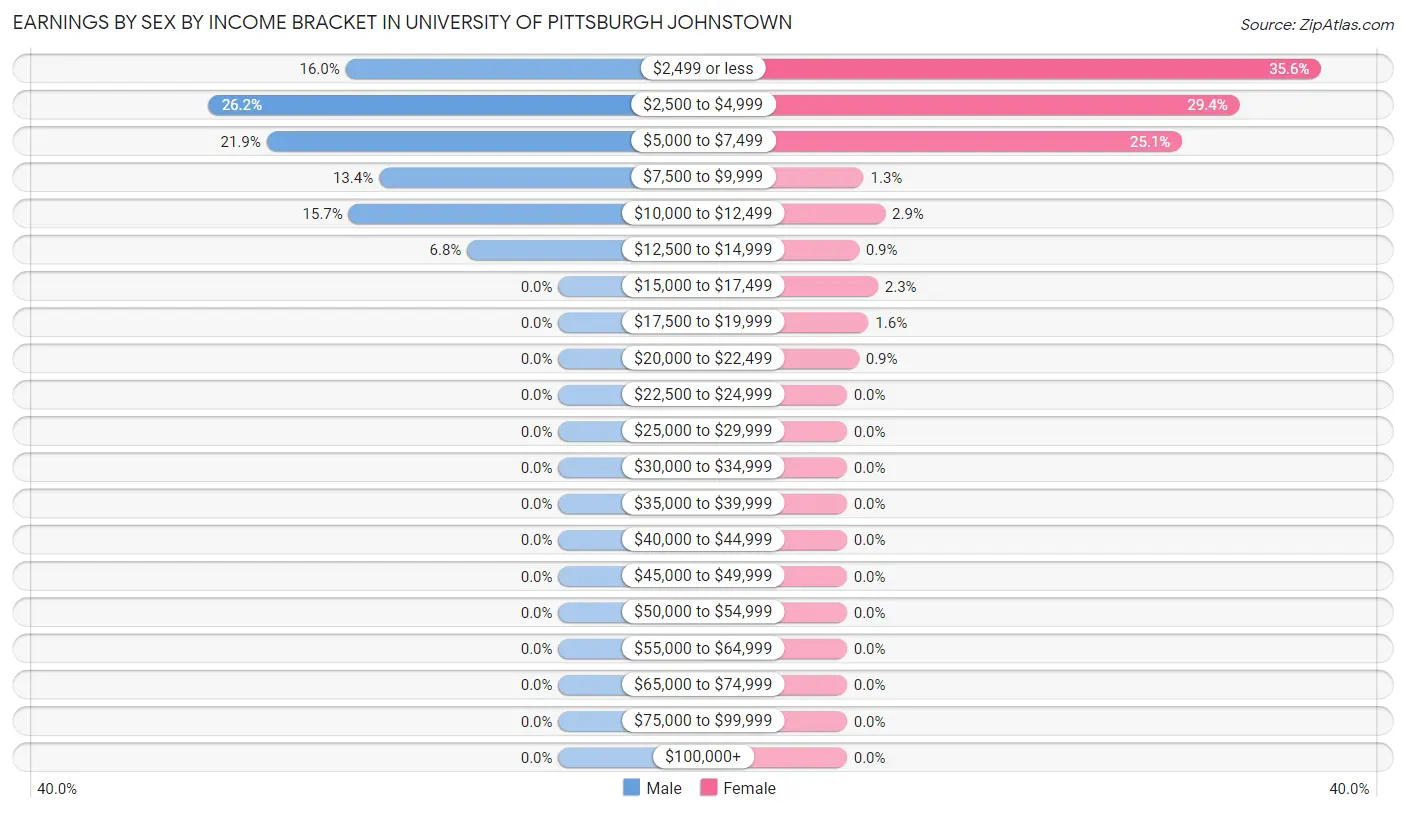
Earnings by Sex by Income Bracket in University of Pittsburgh Johnstown
The most common earnings brackets in University of Pittsburgh Johnstown are $2,500 to $4,999 for men (115 | 26.2%) and $2,499 or less for women (198 | 35.5%).
| Income | Male | Female |
| $2,499 or less | 70 (16.0%) | 198 (35.5%) |
| $2,500 to $4,999 | 115 (26.2%) | 164 (29.4%) |
| $5,000 to $7,499 | 96 (21.9%) | 140 (25.1%) |
| $7,500 to $9,999 | 59 (13.4%) | 7 (1.3%) |
| $10,000 to $12,499 | 69 (15.7%) | 16 (2.9%) |
| $12,500 to $14,999 | 30 (6.8%) | 5 (0.9%) |
| $15,000 to $17,499 | 0 (0.0%) | 13 (2.3%) |
| $17,500 to $19,999 | 0 (0.0%) | 9 (1.6%) |
| $20,000 to $22,499 | 0 (0.0%) | 5 (0.9%) |
| $22,500 to $24,999 | 0 (0.0%) | 0 (0.0%) |
| $25,000 to $29,999 | 0 (0.0%) | 0 (0.0%) |
| $30,000 to $34,999 | 0 (0.0%) | 0 (0.0%) |
| $35,000 to $39,999 | 0 (0.0%) | 0 (0.0%) |
| $40,000 to $44,999 | 0 (0.0%) | 0 (0.0%) |
| $45,000 to $49,999 | 0 (0.0%) | 0 (0.0%) |
| $50,000 to $54,999 | 0 (0.0%) | 0 (0.0%) |
| $55,000 to $64,999 | 0 (0.0%) | 0 (0.0%) |
| $65,000 to $74,999 | 0 (0.0%) | 0 (0.0%) |
| $75,000 to $99,999 | 0 (0.0%) | 0 (0.0%) |
| $100,000+ | 0 (0.0%) | 0 (0.0%) |
| Total | 439 (100.0%) | 557 (100.0%) |
Earnings by Sex by Educational Attainment in University of Pittsburgh Johnstown
| Educational Attainment | Male Income | Female Income |
| Less than High School | - | - |
| High School Diploma | - | - |
| College or Associate's Degree | - | - |
| Bachelor's Degree | - | - |
| Graduate Degree | - | - |
| Total | - | - |
Family Income in University of Pittsburgh Johnstown
Family Income Brackets in University of Pittsburgh Johnstown
| Income Bracket | # Families | % Families |
| Less than $10,000 | 0 | 0.0% |
| $10,000 to $14,999 | 0 | 0.0% |
| $15,000 to $24,999 | 0 | 0.0% |
| $25,000 to $34,999 | 0 | 0.0% |
| $35,000 to $49,999 | 0 | 0.0% |
| $50,000 to $74,999 | 0 | 0.0% |
| $75,000 to $99,999 | 0 | 0.0% |
| $100,000 to $149,999 | 0 | 0.0% |
| $150,000 to $199,999 | 0 | 0.0% |
| $200,000+ | 0 | 0.0% |
Family Income by Famaliy Size in University of Pittsburgh Johnstown
| Income Bracket | # Families | Median Income |
| 2-Person Families | 0 (0.0%) | $0 |
| 3-Person Families | 0 (0.0%) | $0 |
| 4-Person Families | 0 (0.0%) | $0 |
| 5-Person Families | 0 (0.0%) | $0 |
| 6-Person Families | 0 (0.0%) | $0 |
| 7+ Person Families | 0 (0.0%) | $0 |
| Total | 0 (0.0%) | $0 |
Family Income by Number of Earners in University of Pittsburgh Johnstown
| Number of Earners | # Families | Median Income |
| No Earners | 0 (0.0%) | $0 |
| 1 Earner | 0 (0.0%) | $0 |
| 2 Earners | 0 (0.0%) | $0 |
| 3+ Earners | 0 (0.0%) | $0 |
| Total | 0 (0.0%) | $0 |
Household Income in University of Pittsburgh Johnstown
Household Income Brackets in University of Pittsburgh Johnstown
| Income Bracket | # Households | % Households |
| Less than $10,000 | 0 | 0.0% |
| $10,000 to $14,999 | 0 | 0.0% |
| $15,000 to $24,999 | 0 | 0.0% |
| $25,000 to $34,999 | 0 | 0.0% |
| $35,000 to $49,999 | 0 | 0.0% |
| $50,000 to $74,999 | 0 | 0.0% |
| $75,000 to $99,999 | 0 | 0.0% |
| $100,000 to $149,999 | 0 | 0.0% |
| $150,000 to $199,999 | 0 | 0.0% |
| $200,000+ | 0 | 0.0% |
Household Income by Householder Age in University of Pittsburgh Johnstown
| Income Bracket | # Households | Median Income |
| 15 to 24 Years | 0 (0.0%) | $0 |
| 25 to 44 Years | 0 (0.0%) | $0 |
| 45 to 64 Years | 0 (0.0%) | $0 |
| 65+ Years | 0 (0.0%) | $0 |
| Total | 0 (0.0%) | $0 |
Poverty in University of Pittsburgh Johnstown
Income Below Poverty by Sex and Age in University of Pittsburgh Johnstown
| Age Bracket | Male | Female |
| Under 5 Years | 0 (0.0%) | 0 (0.0%) |
| 5 Years | 0 (0.0%) | 0 (0.0%) |
| 6 to 11 Years | 0 (0.0%) | 0 (0.0%) |
| 12 to 14 Years | 0 (0.0%) | 0 (0.0%) |
| 15 Years | 0 (0.0%) | 0 (0.0%) |
| 16 and 17 Years | 0 (0.0%) | 0 (0.0%) |
| 18 to 24 Years | 0 (0.0%) | 0 (0.0%) |
| 25 to 34 Years | 0 (0.0%) | 0 (0.0%) |
| 35 to 44 Years | 0 (0.0%) | 0 (0.0%) |
| 45 to 54 Years | 0 (0.0%) | 0 (0.0%) |
| 55 to 64 Years | 0 (0.0%) | 0 (0.0%) |
| 65 to 74 Years | 0 (0.0%) | 0 (0.0%) |
| 75 Years and over | 0 (0.0%) | 0 (0.0%) |
| Total | 0 (0.0%) | 0 (0.0%) |
Income Above Poverty by Sex and Age in University of Pittsburgh Johnstown
| Age Bracket | Male | Female |
| Under 5 Years | 0 (0.0%) | 0 (0.0%) |
| 5 Years | 0 (0.0%) | 0 (0.0%) |
| 6 to 11 Years | 0 (0.0%) | 0 (0.0%) |
| 12 to 14 Years | 0 (0.0%) | 0 (0.0%) |
| 15 Years | 0 (0.0%) | 0 (0.0%) |
| 16 and 17 Years | 0 (0.0%) | 0 (0.0%) |
| 18 to 24 Years | 0 (0.0%) | 0 (0.0%) |
| 25 to 34 Years | 0 (0.0%) | 0 (0.0%) |
| 35 to 44 Years | 0 (0.0%) | 0 (0.0%) |
| 45 to 54 Years | 0 (0.0%) | 0 (0.0%) |
| 55 to 64 Years | 0 (0.0%) | 0 (0.0%) |
| 65 to 74 Years | 0 (0.0%) | 0 (0.0%) |
| 75 Years and over | 0 (0.0%) | 0 (0.0%) |
| Total | 0 (0.0%) | 0 (0.0%) |
Income Below Poverty Among Married-Couple Families in University of Pittsburgh Johnstown
| Children | Above Poverty | Below Poverty |
| No Children | 0 (0.0%) | 0 (0.0%) |
| 1 or 2 Children | 0 (0.0%) | 0 (0.0%) |
| 3 or 4 Children | 0 (0.0%) | 0 (0.0%) |
| 5 or more Children | 0 (0.0%) | 0 (0.0%) |
| Total | 0 (0.0%) | 0 (0.0%) |
Income Below Poverty Among Single-Parent Households in University of Pittsburgh Johnstown
| Children | Single Father | Single Mother |
| No Children | 0 (0.0%) | 0 (0.0%) |
| 1 or 2 Children | 0 (0.0%) | 0 (0.0%) |
| 3 or 4 Children | 0 (0.0%) | 0 (0.0%) |
| 5 or more Children | 0 (0.0%) | 0 (0.0%) |
| Total | 0 (0.0%) | 0 (0.0%) |
Income Below Poverty Among Married-Couple vs Single-Parent Households in University of Pittsburgh Johnstown
| Children | Married-Couple Families | Single-Parent Households |
| No Children | 0 (0.0%) | 0 (0.0%) |
| 1 or 2 Children | 0 (0.0%) | 0 (0.0%) |
| 3 or 4 Children | 0 (0.0%) | 0 (0.0%) |
| 5 or more Children | 0 (0.0%) | 0 (0.0%) |
| Total | 0 (0.0%) | 0 (0.0%) |
Race in University of Pittsburgh Johnstown
The most populous races in University of Pittsburgh Johnstown are White / Caucasian (1,294 | 90.6%), Two or more Races (63 | 4.4%), and Hispanic or Latino (48 | 3.4%).
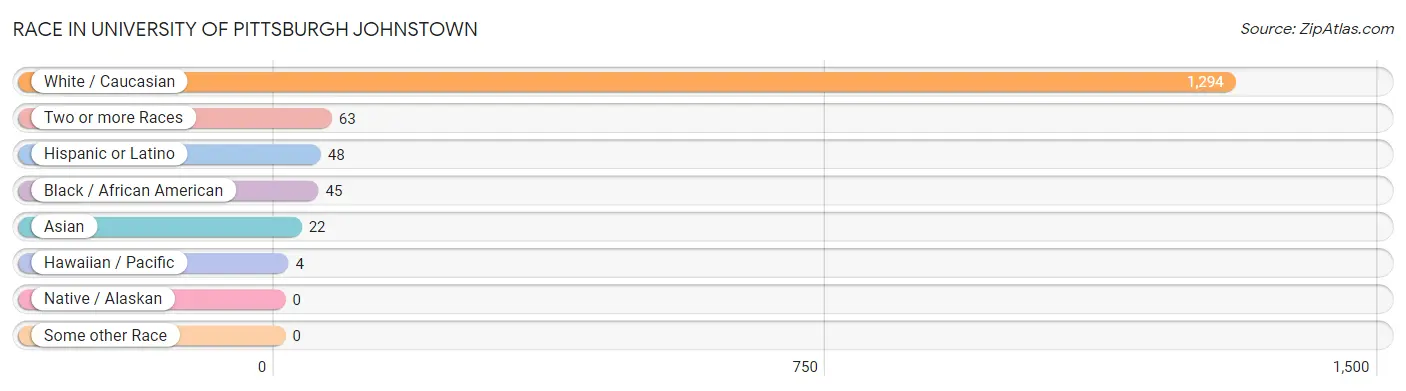
| Race | # Population | % Population |
| Asian | 22 | 1.5% |
| Black / African American | 45 | 3.2% |
| Hawaiian / Pacific | 4 | 0.3% |
| Hispanic or Latino | 48 | 3.4% |
| Native / Alaskan | 0 | 0.0% |
| White / Caucasian | 1,294 | 90.6% |
| Two or more Races | 63 | 4.4% |
| Some other Race | 0 | 0.0% |
| Total | 1,428 | 100.0% |
Ancestry in University of Pittsburgh Johnstown
The most populous ancestries reported in University of Pittsburgh Johnstown are German (615 | 43.1%), Irish (357 | 25.0%), Italian (187 | 13.1%), Polish (65 | 4.5%), and English (51 | 3.6%), together accounting for 89.3% of all University of Pittsburgh Johnstown residents.
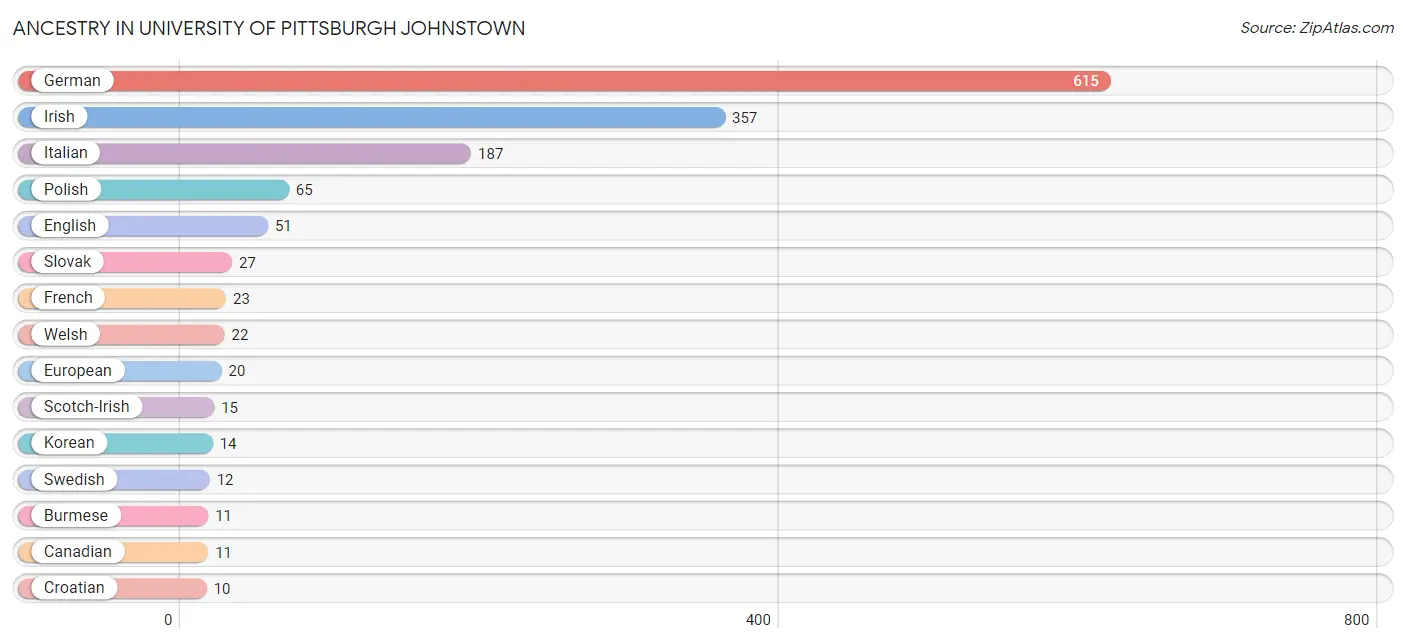
| Ancestry | # Population | % Population |
| American | 3 | 0.2% |
| Arab | 5 | 0.4% |
| Burmese | 11 | 0.8% |
| Canadian | 11 | 0.8% |
| Central American | 9 | 0.6% |
| Croatian | 10 | 0.7% |
| Cuban | 9 | 0.6% |
| Czech | 8 | 0.6% |
| Czechoslovakian | 8 | 0.6% |
| Dutch | 10 | 0.7% |
| Eastern European | 3 | 0.2% |
| English | 51 | 3.6% |
| European | 20 | 1.4% |
| French | 23 | 1.6% |
| German | 615 | 43.1% |
| Hungarian | 6 | 0.4% |
| Indian (Asian) | 3 | 0.2% |
| Irish | 357 | 25.0% |
| Italian | 187 | 13.1% |
| Jamaican | 3 | 0.2% |
| Korean | 14 | 1.0% |
| Lebanese | 5 | 0.4% |
| Native Hawaiian | 4 | 0.3% |
| Panamanian | 9 | 0.6% |
| Pennsylvania German | 5 | 0.4% |
| Polish | 65 | 4.5% |
| Scotch-Irish | 15 | 1.1% |
| Scottish | 9 | 0.6% |
| Slovak | 27 | 1.9% |
| Sri Lankan | 10 | 0.7% |
| Swedish | 12 | 0.8% |
| Welsh | 22 | 1.5% | View All 32 Rows |
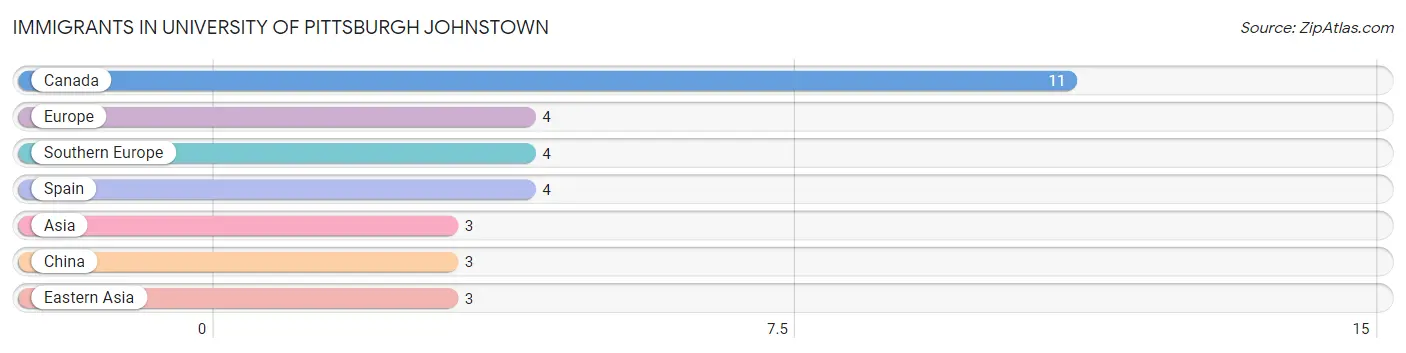
Immigrants in University of Pittsburgh Johnstown
The most numerous immigrant groups reported in University of Pittsburgh Johnstown came from Canada (11 | 0.8%), Europe (4 | 0.3%), Southern Europe (4 | 0.3%), Spain (4 | 0.3%), and Asia (3 | 0.2%), together accounting for 1.8% of all University of Pittsburgh Johnstown residents.
| Immigration Origin | # Population | % Population |
| Asia | 3 | 0.2% |
| Canada | 11 | 0.8% |
| China | 3 | 0.2% |
| Eastern Asia | 3 | 0.2% |
| Europe | 4 | 0.3% |
| Southern Europe | 4 | 0.3% |
| Spain | 4 | 0.3% | View All 7 Rows |
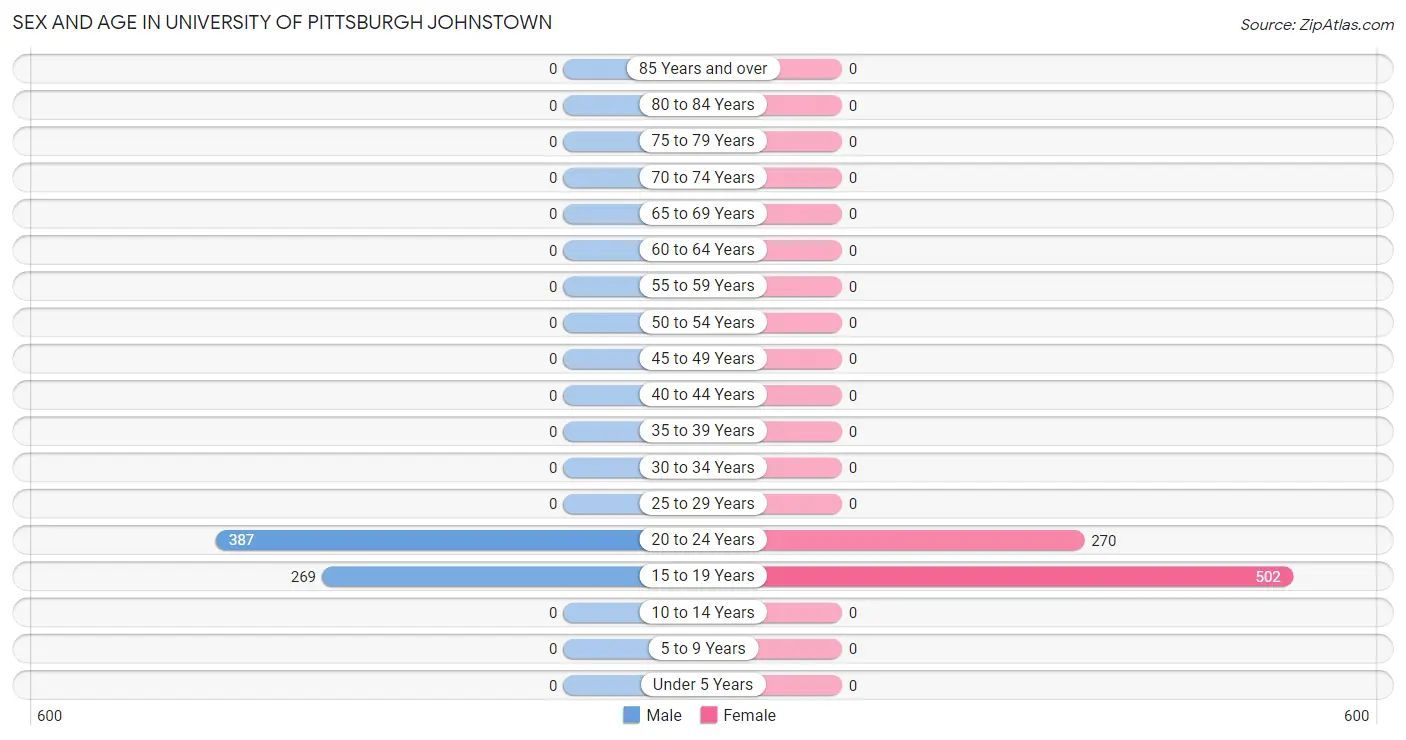
Sex and Age in University of Pittsburgh Johnstown
Sex and Age in University of Pittsburgh Johnstown
The most populous age groups in University of Pittsburgh Johnstown are 20 to 24 Years (387 | 59.0%) for men and 15 to 19 Years (502 | 65.0%) for women.
| Age Bracket | Male | Female |
| Under 5 Years | 0 (0.0%) | 0 (0.0%) |
| 5 to 9 Years | 0 (0.0%) | 0 (0.0%) |
| 10 to 14 Years | 0 (0.0%) | 0 (0.0%) |
| 15 to 19 Years | 269 (41.0%) | 502 (65.0%) |
| 20 to 24 Years | 387 (59.0%) | 270 (35.0%) |
| 25 to 29 Years | 0 (0.0%) | 0 (0.0%) |
| 30 to 34 Years | 0 (0.0%) | 0 (0.0%) |
| 35 to 39 Years | 0 (0.0%) | 0 (0.0%) |
| 40 to 44 Years | 0 (0.0%) | 0 (0.0%) |
| 45 to 49 Years | 0 (0.0%) | 0 (0.0%) |
| 50 to 54 Years | 0 (0.0%) | 0 (0.0%) |
| 55 to 59 Years | 0 (0.0%) | 0 (0.0%) |
| 60 to 64 Years | 0 (0.0%) | 0 (0.0%) |
| 65 to 69 Years | 0 (0.0%) | 0 (0.0%) |
| 70 to 74 Years | 0 (0.0%) | 0 (0.0%) |
| 75 to 79 Years | 0 (0.0%) | 0 (0.0%) |
| 80 to 84 Years | 0 (0.0%) | 0 (0.0%) |
| 85 Years and over | 0 (0.0%) | 0 (0.0%) |
| Total | 656 (100.0%) | 772 (100.0%) |
Families and Households in University of Pittsburgh Johnstown
Median Family Size in University of Pittsburgh Johnstown
| Family Type | # Families | Family Size |
| Married-Couple | 0 (0.0%) | - |
| Single Male/Father | 0 (0.0%) | - |
| Single Female/Mother | 0 (0.0%) | - |
| Total Families | 0 (0.0%) | - |
Median Household Size in University of Pittsburgh Johnstown
| Household Type | # Households | Household Size |
| Married-Couple | 0 (0.0%) | - |
| Single Male/Father | 0 (0.0%) | - |
| Single Female/Mother | 0 (0.0%) | - |
| Non-family | 0 (0.0%) | - |
| Total Households | 0 (0.0%) | - |
Household Size by Marriage Status in University of Pittsburgh Johnstown
| Household Size | Family Households | Nonfamily Households |
| 1-Person Households | - | 0 (0.0%) |
| 2-Person Households | 0 (0.0%) | 0 (0.0%) |
| 3-Person Households | 0 (0.0%) | 0 (0.0%) |
| 4-Person Households | 0 (0.0%) | 0 (0.0%) |
| 5-Person Households | 0 (0.0%) | 0 (0.0%) |
| 6-Person Households | 0 (0.0%) | 0 (0.0%) |
| 7+ Person Households | 0 (0.0%) | 0 (0.0%) |
| Total | 0 (0.0%) | 0 (0.0%) |
Female Fertility in University of Pittsburgh Johnstown
Fertility by Age in University of Pittsburgh Johnstown
| Age Bracket | Women with Births | Births / 1,000 Women |
| 15 to 19 years | 0 (0.0%) | 0.0 |
| 20 to 34 years | 0 (0.0%) | 0.0 |
| 35 to 50 years | 0 (0.0%) | 0.0 |
| Total | 0 (0.0%) | 0.0 |
Fertility by Age by Marriage Status in University of Pittsburgh Johnstown
| Age Bracket | Married | Unmarried |
| 15 to 19 years | 0 (0.0%) | 0 (0.0%) |
| 20 to 34 years | 0 (0.0%) | 0 (0.0%) |
| 35 to 50 years | 0 (0.0%) | 0 (0.0%) |
| Total | 0 (0.0%) | 0 (0.0%) |
Fertility by Education in University of Pittsburgh Johnstown
| Educational Attainment | Women with Births | Births / 1,000 Women |
| Less than High School | 0 (0.0%) | 0.0 |
| High School Diploma | 0 (0.0%) | 0.0 |
| College or Associate's Degree | 0 (0.0%) | 0.0 |
| Bachelor's Degree | 0 (0.0%) | 0.0 |
| Graduate Degree | 0 (0.0%) | 0.0 |
| Total | 0 (0.0%) | 0.0 |
Fertility by Education by Marriage Status in University of Pittsburgh Johnstown
| Educational Attainment | Married | Unmarried |
| Less than High School | 0 (0.0%) | 0 (0.0%) |
| High School Diploma | 0 (0.0%) | 0 (0.0%) |
| College or Associate's Degree | 0 (0.0%) | 0 (0.0%) |
| Bachelor's Degree | 0 (0.0%) | 0 (0.0%) |
| Graduate Degree | 0 (0.0%) | 0 (0.0%) |
| Total | 0 (0.0%) | 0 (0.0%) |
Employment Characteristics in University of Pittsburgh Johnstown
Employment by Class of Employer in University of Pittsburgh Johnstown
Among the 252 employed individuals in University of Pittsburgh Johnstown, private company employees (213 | 84.5%), not-for-profit organizations (25 | 9.9%), and self-employed (not incorporated) (7 | 2.8%) make up the most common classes of employment.
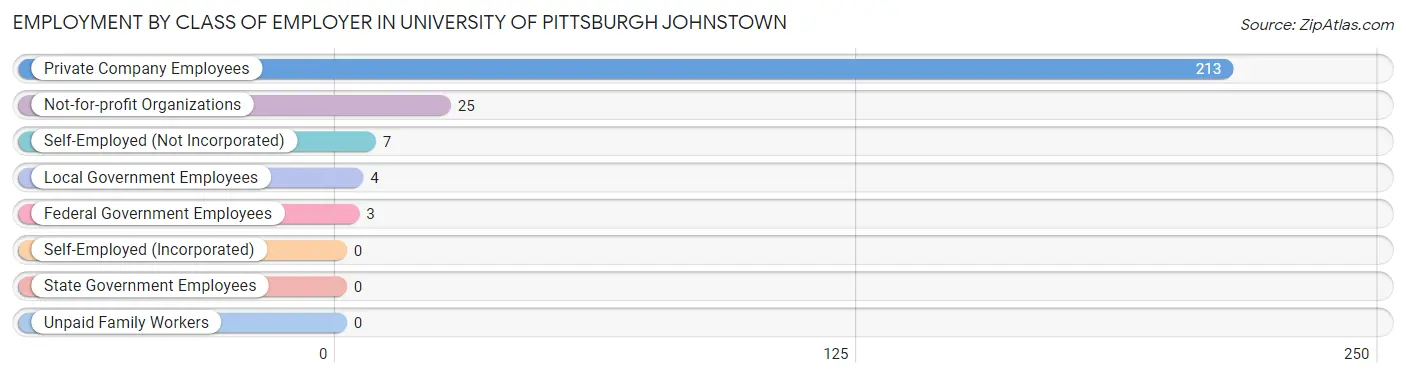
| Employer Class | # Employees | % Employees |
| Private Company Employees | 213 | 84.5% |
| Self-Employed (Incorporated) | 0 | 0.0% |
| Self-Employed (Not Incorporated) | 7 | 2.8% |
| Not-for-profit Organizations | 25 | 9.9% |
| Local Government Employees | 4 | 1.6% |
| State Government Employees | 0 | 0.0% |
| Federal Government Employees | 3 | 1.2% |
| Unpaid Family Workers | 0 | 0.0% |
| Total | 252 | 100.0% |
Employment Status by Age in University of Pittsburgh Johnstown
According to the labor force statistics for University of Pittsburgh Johnstown, out of the total population over 16 years of age (1,428), 23.2% or 331 individuals are in the labor force, with 6.1% or 20 of them unemployed. The age group with the highest labor force participation rate is 20 to 24 years, with 28.9% or 190 individuals in the labor force. Within the labor force, the 16 to 19 years age range has the highest percentage of unemployed individuals, with 12.7% or 18 of them being unemployed.
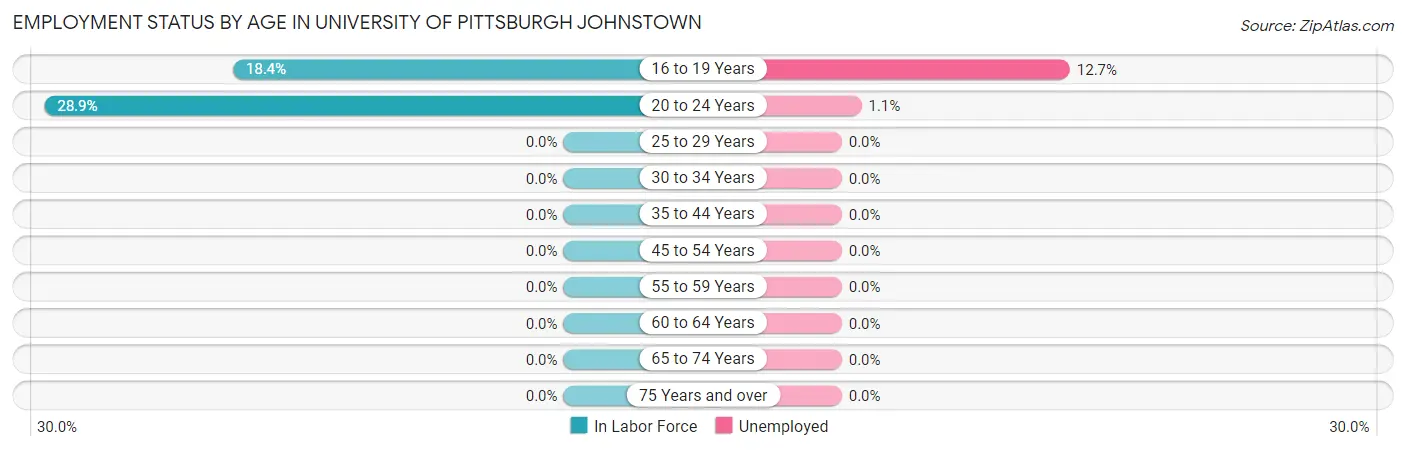
| Age Bracket | In Labor Force | Unemployed |
| 16 to 19 Years | 142 (18.4%) | 18 (12.7%) |
| 20 to 24 Years | 190 (28.9%) | 2 (1.1%) |
| 25 to 29 Years | 0 (0.0%) | 0 (0.0%) |
| 30 to 34 Years | 0 (0.0%) | 0 (0.0%) |
| 35 to 44 Years | 0 (0.0%) | 0 (0.0%) |
| 45 to 54 Years | 0 (0.0%) | 0 (0.0%) |
| 55 to 59 Years | 0 (0.0%) | 0 (0.0%) |
| 60 to 64 Years | 0 (0.0%) | 0 (0.0%) |
| 65 to 74 Years | 0 (0.0%) | 0 (0.0%) |
| 75 Years and over | 0 (0.0%) | 0 (0.0%) |
| Total | 331 (23.2%) | 20 (6.1%) |
Employment Status by Educational Attainment in University of Pittsburgh Johnstown
| Educational Attainment | In Labor Force | Unemployed |
| Less than High School | 0 (0.0%) | 0 (0.0%) |
| High School Diploma | 0 (0.0%) | 0 (0.0%) |
| College / Associate Degree | 0 (0.0%) | 0 (0.0%) |
| Bachelor's Degree or higher | 0 (0.0%) | 0 (0.0%) |
| Total | 0 (0.0%) | 0 (0.0%) |
Employment Occupations by Sex in University of Pittsburgh Johnstown
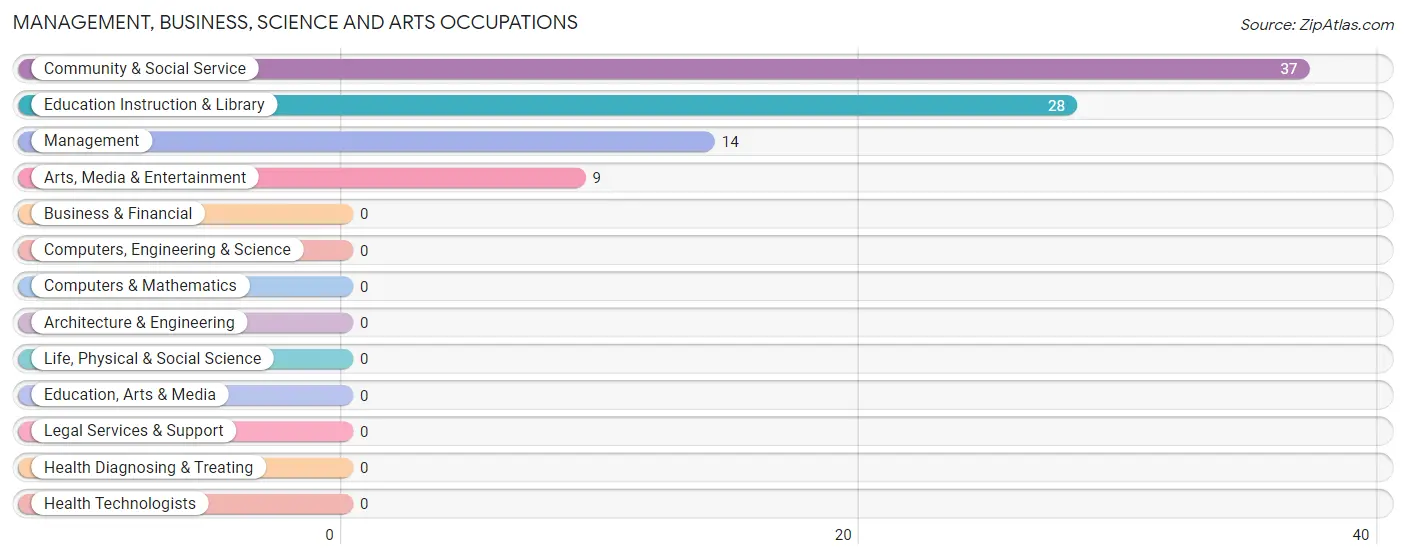
Management, Business, Science and Arts Occupations
The most common Management, Business, Science and Arts occupations in University of Pittsburgh Johnstown are Community & Social Service (37 | 12.0%), Education Instruction & Library (28 | 9.1%), Management (14 | 4.5%), and Arts, Media & Entertainment (9 | 2.9%).
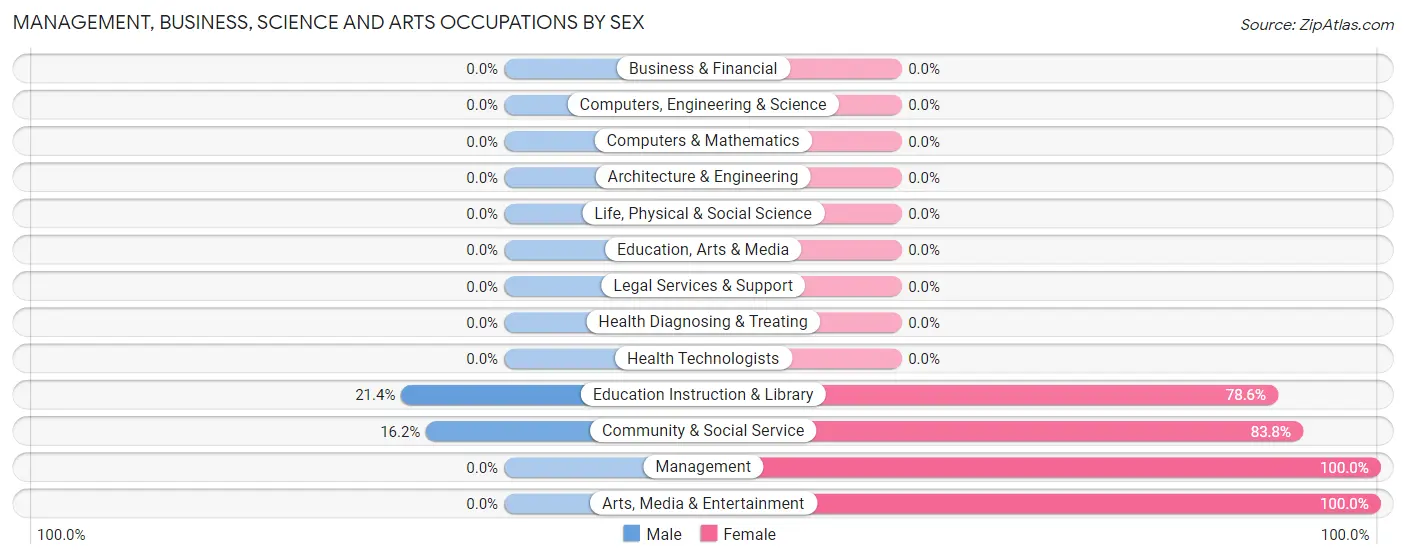
Management, Business, Science and Arts Occupations by Sex
Within the Management, Business, Science and Arts occupations in University of Pittsburgh Johnstown, the most male-oriented occupations are Education Instruction & Library (21.4%), and Community & Social Service (16.2%), while the most female-oriented occupations are Management (100.0%), Arts, Media & Entertainment (100.0%), and Community & Social Service (83.8%).
| Occupation | Male | Female |
| Management | 0 (0.0%) | 14 (100.0%) |
| Business & Financial | 0 (0.0%) | 0 (0.0%) |
| Computers, Engineering & Science | 0 (0.0%) | 0 (0.0%) |
| Computers & Mathematics | 0 (0.0%) | 0 (0.0%) |
| Architecture & Engineering | 0 (0.0%) | 0 (0.0%) |
| Life, Physical & Social Science | 0 (0.0%) | 0 (0.0%) |
| Community & Social Service | 6 (16.2%) | 31 (83.8%) |
| Education, Arts & Media | 0 (0.0%) | 0 (0.0%) |
| Legal Services & Support | 0 (0.0%) | 0 (0.0%) |
| Education Instruction & Library | 6 (21.4%) | 22 (78.6%) |
| Arts, Media & Entertainment | 0 (0.0%) | 9 (100.0%) |
| Health Diagnosing & Treating | 0 (0.0%) | 0 (0.0%) |
| Health Technologists | 0 (0.0%) | 0 (0.0%) |
| Total (Category) | 6 (11.8%) | 45 (88.2%) |
| Total (Overall) | 156 (50.5%) | 153 (49.5%) |
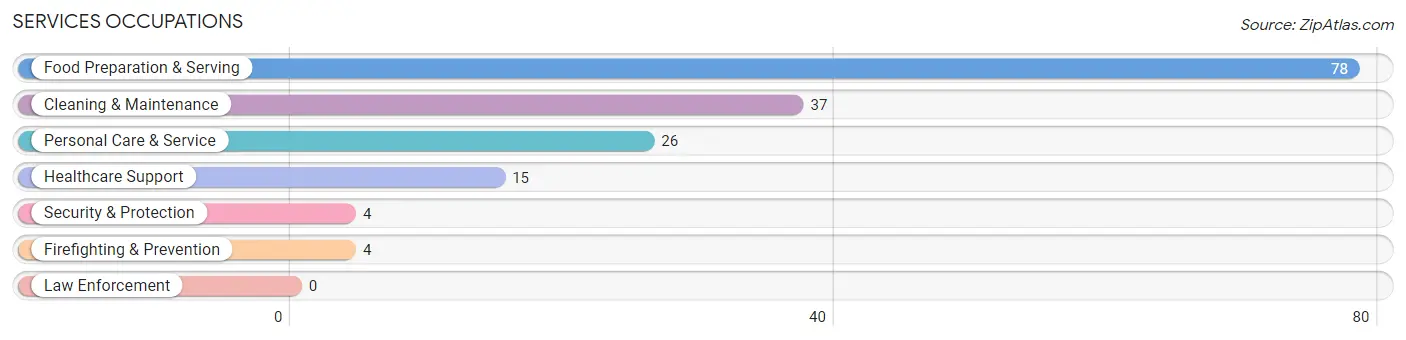
Services Occupations
The most common Services occupations in University of Pittsburgh Johnstown are Food Preparation & Serving (78 | 25.2%), Cleaning & Maintenance (37 | 12.0%), Personal Care & Service (26 | 8.4%), Healthcare Support (15 | 4.9%), and Security & Protection (4 | 1.3%).
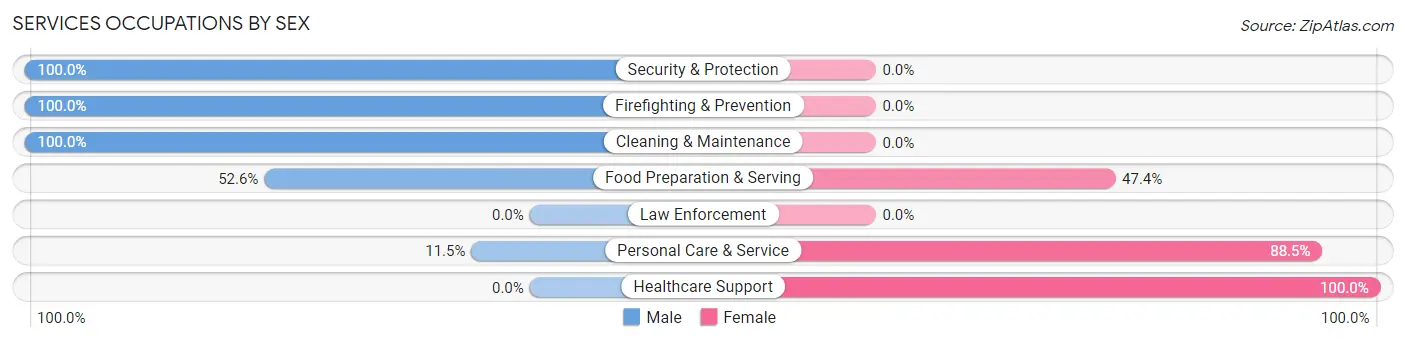
Services Occupations by Sex
Within the Services occupations in University of Pittsburgh Johnstown, the most male-oriented occupations are Security & Protection (100.0%), Firefighting & Prevention (100.0%), and Cleaning & Maintenance (100.0%), while the most female-oriented occupations are Healthcare Support (100.0%), Personal Care & Service (88.5%), and Food Preparation & Serving (47.4%).
| Occupation | Male | Female |
| Healthcare Support | 0 (0.0%) | 15 (100.0%) |
| Security & Protection | 4 (100.0%) | 0 (0.0%) |
| Firefighting & Prevention | 4 (100.0%) | 0 (0.0%) |
| Law Enforcement | 0 (0.0%) | 0 (0.0%) |
| Food Preparation & Serving | 41 (52.6%) | 37 (47.4%) |
| Cleaning & Maintenance | 37 (100.0%) | 0 (0.0%) |
| Personal Care & Service | 3 (11.5%) | 23 (88.5%) |
| Total (Category) | 85 (53.1%) | 75 (46.9%) |
| Total (Overall) | 156 (50.5%) | 153 (49.5%) |
Sales and Office Occupations
The most common Sales and Office occupations in University of Pittsburgh Johnstown are Office & Administration (28 | 9.1%), and Sales & Related (22 | 7.1%).

Sales and Office Occupations by Sex
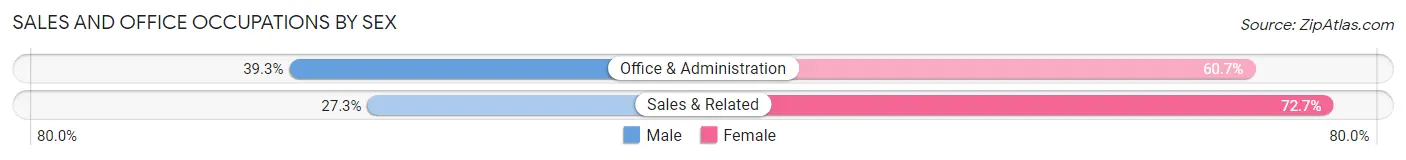
| Occupation | Male | Female |
| Sales & Related | 6 (27.3%) | 16 (72.7%) |
| Office & Administration | 11 (39.3%) | 17 (60.7%) |
| Total (Category) | 17 (34.0%) | 33 (66.0%) |
| Total (Overall) | 156 (50.5%) | 153 (49.5%) |
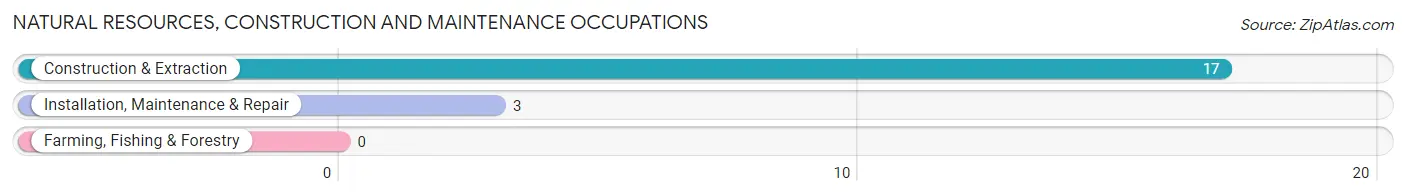
Natural Resources, Construction and Maintenance Occupations
The most common Natural Resources, Construction and Maintenance occupations in University of Pittsburgh Johnstown are Construction & Extraction (17 | 5.5%), and Installation, Maintenance & Repair (3 | 1.0%).
Natural Resources, Construction and Maintenance Occupations by Sex
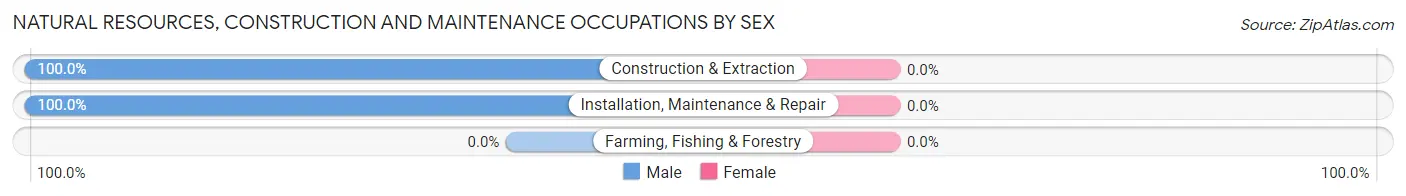
| Occupation | Male | Female |
| Farming, Fishing & Forestry | 0 (0.0%) | 0 (0.0%) |
| Construction & Extraction | 17 (100.0%) | 0 (0.0%) |
| Installation, Maintenance & Repair | 3 (100.0%) | 0 (0.0%) |
| Total (Category) | 20 (100.0%) | 0 (0.0%) |
| Total (Overall) | 156 (50.5%) | 153 (49.5%) |
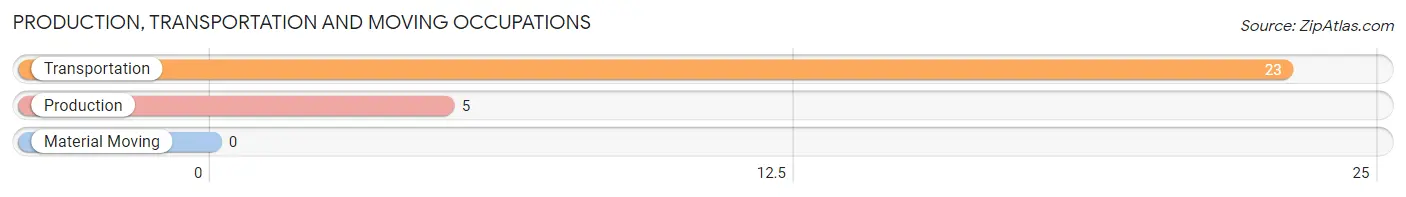
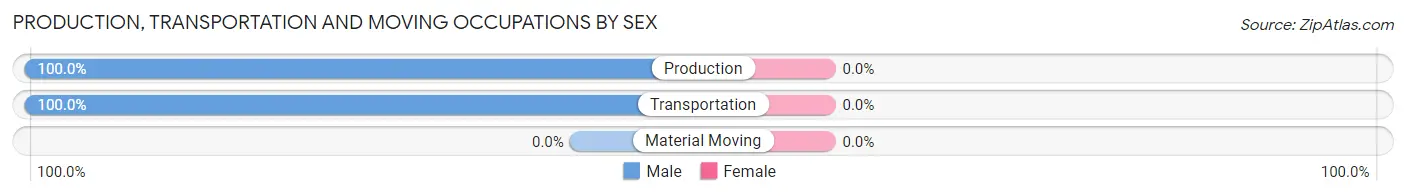
Production, Transportation and Moving Occupations
The most common Production, Transportation and Moving occupations in University of Pittsburgh Johnstown are Transportation (23 | 7.4%), and Production (5 | 1.6%).
Production, Transportation and Moving Occupations by Sex
| Occupation | Male | Female |
| Production | 5 (100.0%) | 0 (0.0%) |
| Transportation | 23 (100.0%) | 0 (0.0%) |
| Material Moving | 0 (0.0%) | 0 (0.0%) |
| Total (Category) | 28 (100.0%) | 0 (0.0%) |
| Total (Overall) | 156 (50.5%) | 153 (49.5%) |
Employment Industries by Sex in University of Pittsburgh Johnstown
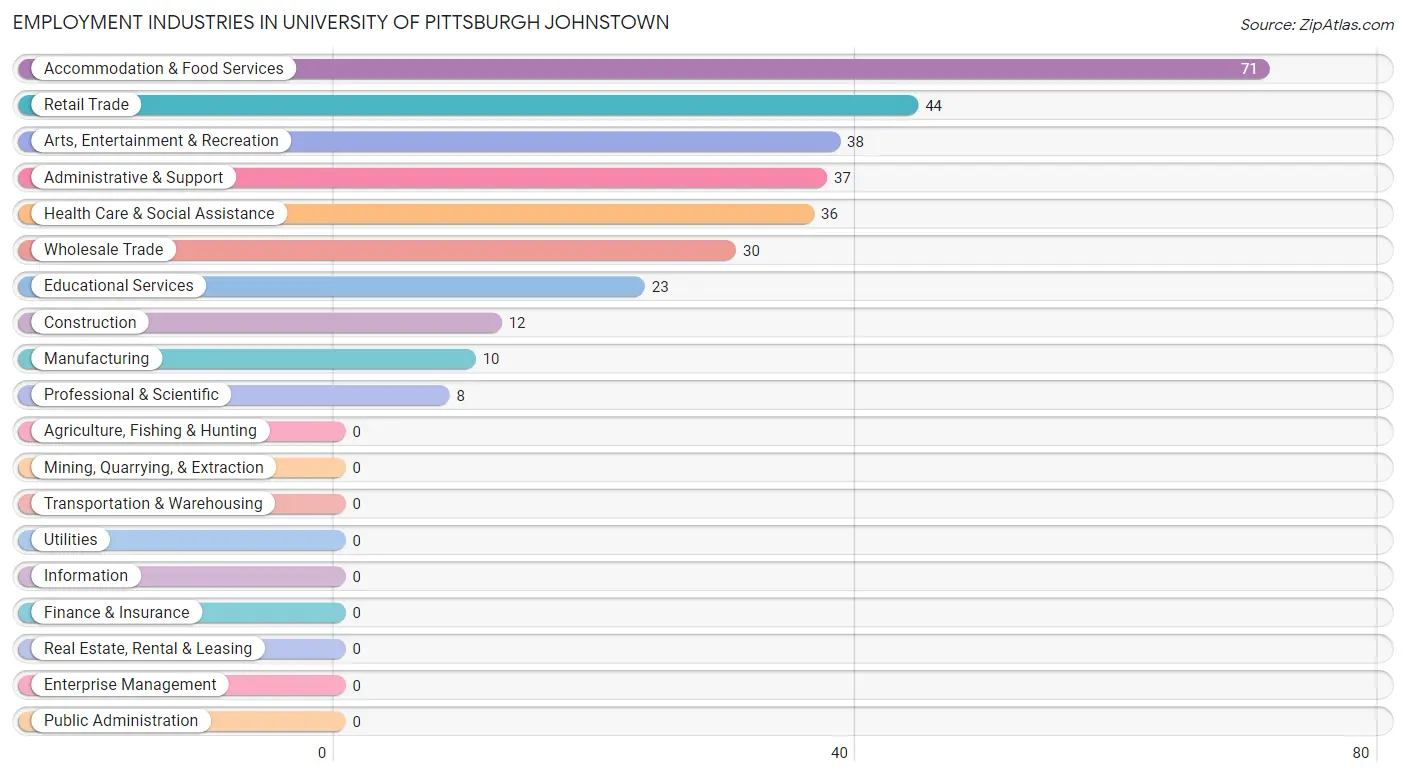
Employment Industries in University of Pittsburgh Johnstown
The major employment industries in University of Pittsburgh Johnstown include Accommodation & Food Services (71 | 23.0%), Retail Trade (44 | 14.2%), Arts, Entertainment & Recreation (38 | 12.3%), Administrative & Support (37 | 12.0%), and Health Care & Social Assistance (36 | 11.7%).
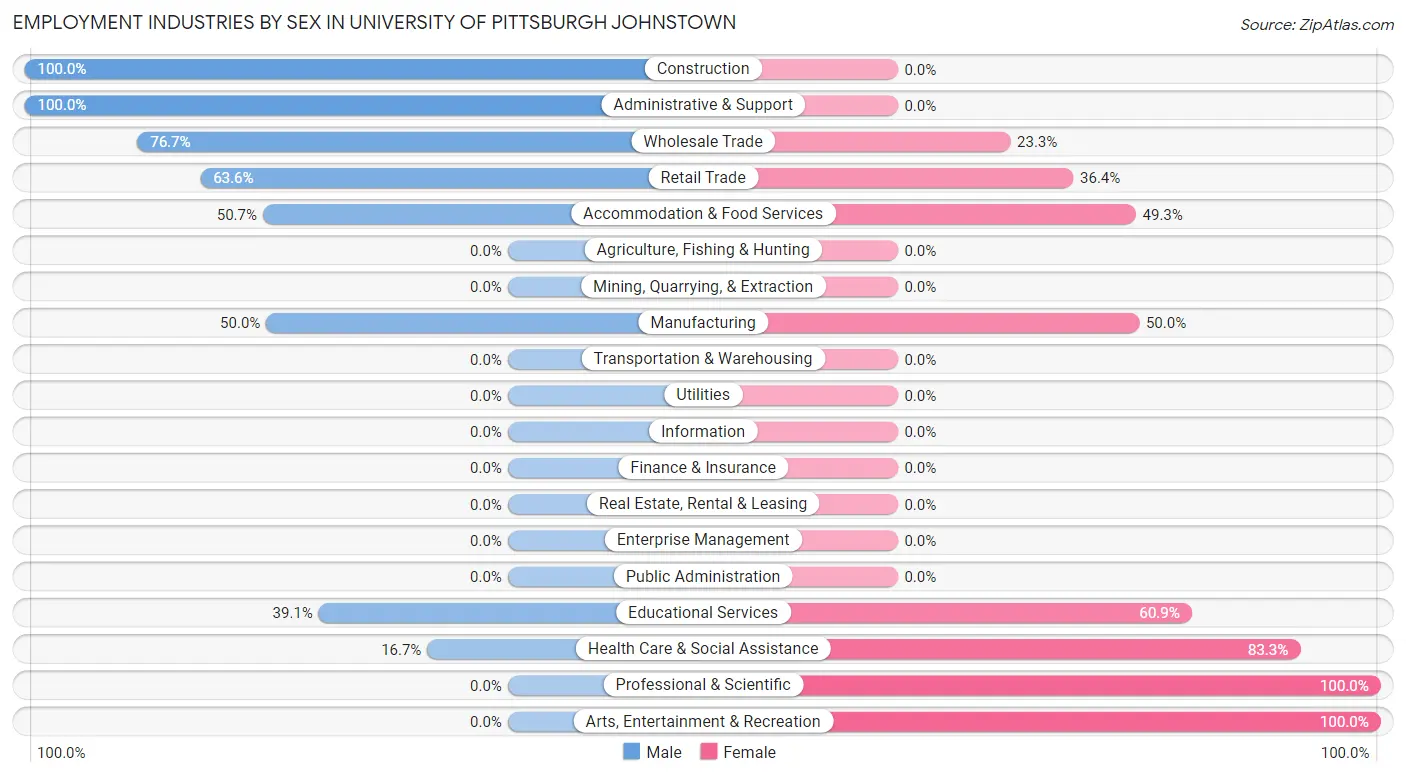
Employment Industries by Sex in University of Pittsburgh Johnstown
The University of Pittsburgh Johnstown industries that see more men than women are Construction (100.0%), Administrative & Support (100.0%), and Wholesale Trade (76.7%), whereas the industries that tend to have a higher number of women are Professional & Scientific (100.0%), Arts, Entertainment & Recreation (100.0%), and Health Care & Social Assistance (83.3%).
| Industry | Male | Female |
| Agriculture, Fishing & Hunting | 0 (0.0%) | 0 (0.0%) |
| Mining, Quarrying, & Extraction | 0 (0.0%) | 0 (0.0%) |
| Construction | 12 (100.0%) | 0 (0.0%) |
| Manufacturing | 5 (50.0%) | 5 (50.0%) |
| Wholesale Trade | 23 (76.7%) | 7 (23.3%) |
| Retail Trade | 28 (63.6%) | 16 (36.4%) |
| Transportation & Warehousing | 0 (0.0%) | 0 (0.0%) |
| Utilities | 0 (0.0%) | 0 (0.0%) |
| Information | 0 (0.0%) | 0 (0.0%) |
| Finance & Insurance | 0 (0.0%) | 0 (0.0%) |
| Real Estate, Rental & Leasing | 0 (0.0%) | 0 (0.0%) |
| Professional & Scientific | 0 (0.0%) | 8 (100.0%) |
| Enterprise Management | 0 (0.0%) | 0 (0.0%) |
| Administrative & Support | 37 (100.0%) | 0 (0.0%) |
| Educational Services | 9 (39.1%) | 14 (60.9%) |
| Health Care & Social Assistance | 6 (16.7%) | 30 (83.3%) |
| Arts, Entertainment & Recreation | 0 (0.0%) | 38 (100.0%) |
| Accommodation & Food Services | 36 (50.7%) | 35 (49.3%) |
| Public Administration | 0 (0.0%) | 0 (0.0%) |
| Total | 156 (50.5%) | 153 (49.5%) |
Education in University of Pittsburgh Johnstown
School Enrollment in University of Pittsburgh Johnstown
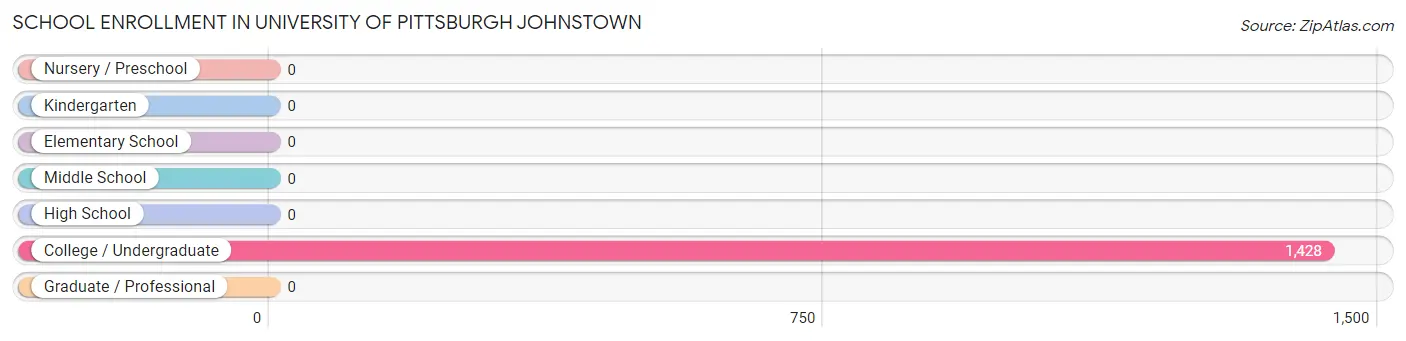
| School Level | # Students | % Students |
| Nursery / Preschool | 0 | 0.0% |
| Kindergarten | 0 | 0.0% |
| Elementary School | 0 | 0.0% |
| Middle School | 0 | 0.0% |
| High School | 0 | 0.0% |
| College / Undergraduate | 1,428 | 100.0% |
| Graduate / Professional | 0 | 0.0% |
| Total | 1,428 | 100.0% |
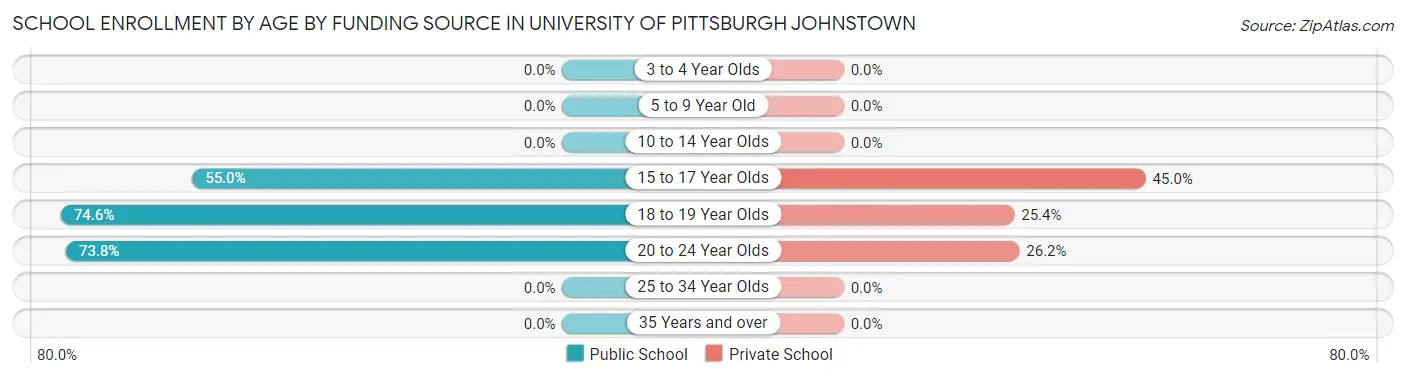
School Enrollment by Age by Funding Source in University of Pittsburgh Johnstown
Out of a total of 1,428 students who are enrolled in schools in University of Pittsburgh Johnstown, 373 (26.1%) attend a private institution, while the remaining 1,055 (73.9%) are enrolled in public schools. The age group of 15 to 17 year olds has the highest likelihood of being enrolled in private schools, with 9 (45.0% in the age bracket) enrolled. Conversely, the age group of 18 to 19 year olds has the lowest likelihood of being enrolled in a private school, with 560 (74.6% in the age bracket) attending a public institution.
| Age Bracket | Public School | Private School |
| 3 to 4 Year Olds | 0 (0.0%) | 0 (0.0%) |
| 5 to 9 Year Old | 0 (0.0%) | 0 (0.0%) |
| 10 to 14 Year Olds | 0 (0.0%) | 0 (0.0%) |
| 15 to 17 Year Olds | 11 (55.0%) | 9 (45.0%) |
| 18 to 19 Year Olds | 560 (74.6%) | 191 (25.4%) |
| 20 to 24 Year Olds | 485 (73.8%) | 172 (26.2%) |
| 25 to 34 Year Olds | 0 (0.0%) | 0 (0.0%) |
| 35 Years and over | 0 (0.0%) | 0 (0.0%) |
| Total | 1,055 (73.9%) | 373 (26.1%) |
Educational Attainment by Field of Study in University of Pittsburgh Johnstown
| Field of Study | # Graduates | % Graduates |
| Computers & Mathematics | 0 | 0.0% |
| Bio, Nature & Agricultural | 0 | 0.0% |
| Physical & Health Sciences | 0 | 0.0% |
| Psychology | 0 | 0.0% |
| Social Sciences | 0 | 0.0% |
| Engineering | 0 | 0.0% |
| Multidisciplinary Studies | 0 | 0.0% |
| Science & Technology | 0 | 0.0% |
| Business | 0 | 0.0% |
| Education | 0 | 0.0% |
| Literature & Languages | 0 | 0.0% |
| Liberal Arts & History | 0 | 0.0% |
| Visual & Performing Arts | 0 | 0.0% |
| Communications | 0 | 0.0% |
| Arts & Humanities | 0 | 0.0% |
| Total | 0 | 0.0% |
Transportation & Commute in University of Pittsburgh Johnstown
Vehicle Availability by Sex in University of Pittsburgh Johnstown
| Vehicles Available | Male | Female |
| No Vehicle | 0 (0.0%) | 0 (0.0%) |
| 1 Vehicle | 0 (0.0%) | 0 (0.0%) |
| 2 Vehicles | 0 (0.0%) | 0 (0.0%) |
| 3 Vehicles | 0 (0.0%) | 0 (0.0%) |
| 4 Vehicles | 0 (0.0%) | 0 (0.0%) |
| 5 or more Vehicles | 0 (0.0%) | 0 (0.0%) |
| Total | 0 (0.0%) | 0 (0.0%) |
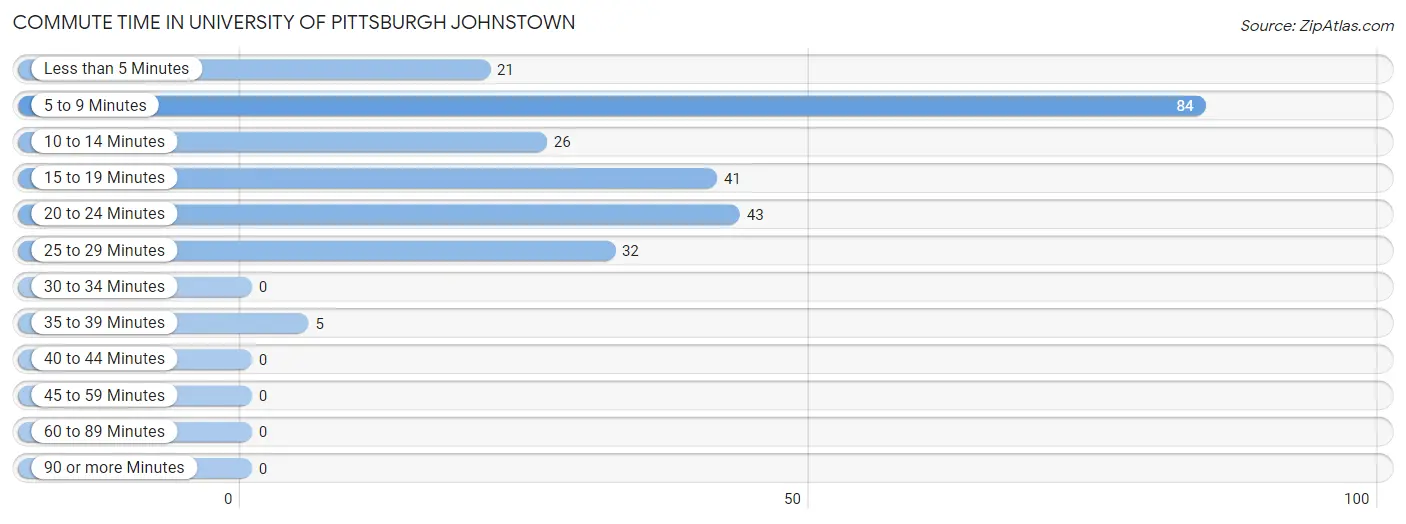
Commute Time in University of Pittsburgh Johnstown
The most frequently occuring commute durations in University of Pittsburgh Johnstown are 5 to 9 minutes (84 commuters, 33.3%), 20 to 24 minutes (43 commuters, 17.1%), and 15 to 19 minutes (41 commuters, 16.3%).
| Commute Time | # Commuters | % Commuters |
| Less than 5 Minutes | 21 | 8.3% |
| 5 to 9 Minutes | 84 | 33.3% |
| 10 to 14 Minutes | 26 | 10.3% |
| 15 to 19 Minutes | 41 | 16.3% |
| 20 to 24 Minutes | 43 | 17.1% |
| 25 to 29 Minutes | 32 | 12.7% |
| 30 to 34 Minutes | 0 | 0.0% |
| 35 to 39 Minutes | 5 | 2.0% |
| 40 to 44 Minutes | 0 | 0.0% |
| 45 to 59 Minutes | 0 | 0.0% |
| 60 to 89 Minutes | 0 | 0.0% |
| 90 or more Minutes | 0 | 0.0% |
Commute Time by Sex in University of Pittsburgh Johnstown
The most common commute times in University of Pittsburgh Johnstown are 5 to 9 minutes (41 commuters, 32.5%) for males and 5 to 9 minutes (43 commuters, 34.1%) for females.
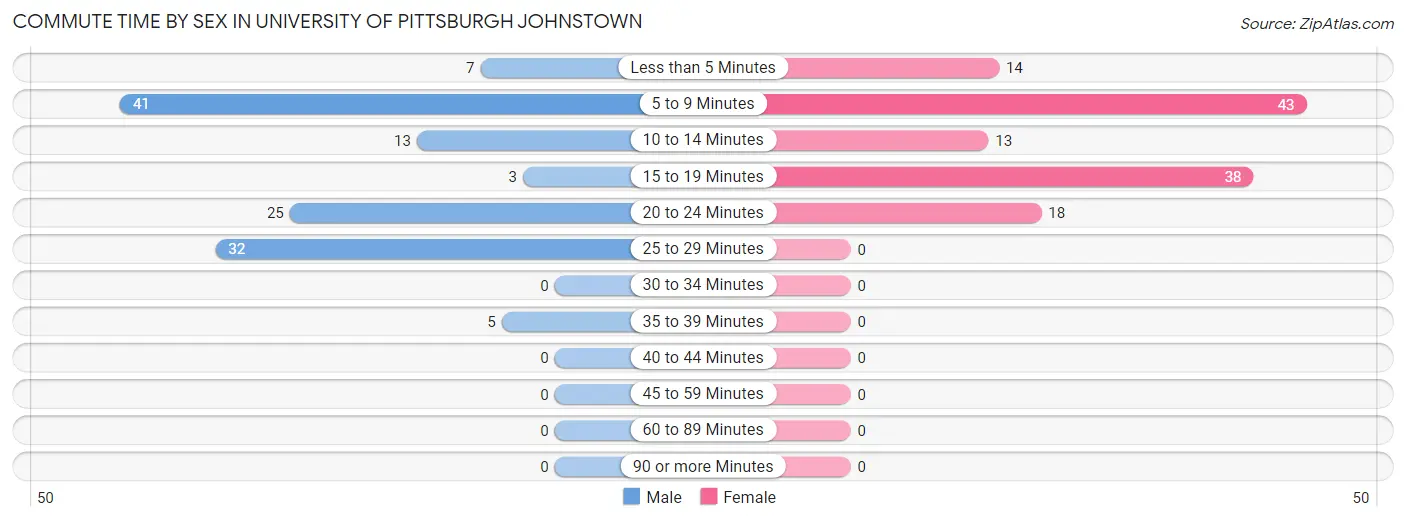
| Commute Time | Male | Female |
| Less than 5 Minutes | 7 (5.6%) | 14 (11.1%) |
| 5 to 9 Minutes | 41 (32.5%) | 43 (34.1%) |
| 10 to 14 Minutes | 13 (10.3%) | 13 (10.3%) |
| 15 to 19 Minutes | 3 (2.4%) | 38 (30.2%) |
| 20 to 24 Minutes | 25 (19.8%) | 18 (14.3%) |
| 25 to 29 Minutes | 32 (25.4%) | 0 (0.0%) |
| 30 to 34 Minutes | 0 (0.0%) | 0 (0.0%) |
| 35 to 39 Minutes | 5 (4.0%) | 0 (0.0%) |
| 40 to 44 Minutes | 0 (0.0%) | 0 (0.0%) |
| 45 to 59 Minutes | 0 (0.0%) | 0 (0.0%) |
| 60 to 89 Minutes | 0 (0.0%) | 0 (0.0%) |
| 90 or more Minutes | 0 (0.0%) | 0 (0.0%) |
Time of Departure to Work by Sex in University of Pittsburgh Johnstown
The most frequent times of departure to work in University of Pittsburgh Johnstown are 4:00 PM to 11:59 PM (48, 38.1%) for males and 12:00 PM to 3:59 PM (66, 52.4%) for females.
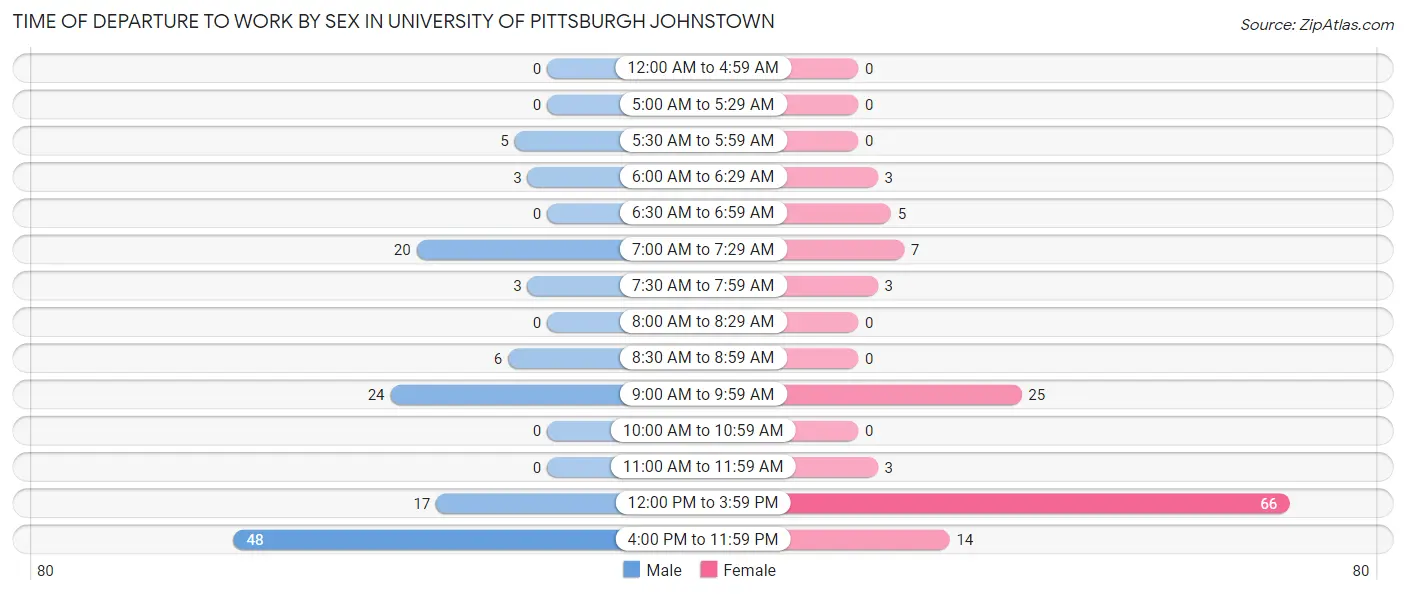
| Time of Departure | Male | Female |
| 12:00 AM to 4:59 AM | 0 (0.0%) | 0 (0.0%) |
| 5:00 AM to 5:29 AM | 0 (0.0%) | 0 (0.0%) |
| 5:30 AM to 5:59 AM | 5 (4.0%) | 0 (0.0%) |
| 6:00 AM to 6:29 AM | 3 (2.4%) | 3 (2.4%) |
| 6:30 AM to 6:59 AM | 0 (0.0%) | 5 (4.0%) |
| 7:00 AM to 7:29 AM | 20 (15.9%) | 7 (5.6%) |
| 7:30 AM to 7:59 AM | 3 (2.4%) | 3 (2.4%) |
| 8:00 AM to 8:29 AM | 0 (0.0%) | 0 (0.0%) |
| 8:30 AM to 8:59 AM | 6 (4.8%) | 0 (0.0%) |
| 9:00 AM to 9:59 AM | 24 (19.1%) | 25 (19.8%) |
| 10:00 AM to 10:59 AM | 0 (0.0%) | 0 (0.0%) |
| 11:00 AM to 11:59 AM | 0 (0.0%) | 3 (2.4%) |
| 12:00 PM to 3:59 PM | 17 (13.5%) | 66 (52.4%) |
| 4:00 PM to 11:59 PM | 48 (38.1%) | 14 (11.1%) |
| Total | 126 (100.0%) | 126 (100.0%) |
Housing Occupancy in University of Pittsburgh Johnstown
Occupancy by Ownership in University of Pittsburgh Johnstown
| Occupancy | # Housing Units | % Housing Units |
| Owner Occupied Housing Units | 0 | 0.0% |
| Renter-Occupied Housing Units | 0 | 0.0% |
| Total Occupied Housing Units | 0 | 0.0% |
Occupancy by Household Size in University of Pittsburgh Johnstown
| Household Size | # Housing Units | % Housing Units |
| 1-Person Household | 0 | 0.0% |
| 2-Person Household | 0 | 0.0% |
| 3-Person Household | 0 | 0.0% |
| 4+ Person Household | 0 | 0.0% |
| Total Housing Units | 0 | 0.0% |
Occupancy by Ownership by Household Size in University of Pittsburgh Johnstown
| Household Size | Owner-occupied | Renter-occupied |
| 1-Person Household | 0 (0.0%) | 0 (0.0%) |
| 2-Person Household | 0 (0.0%) | 0 (0.0%) |
| 3-Person Household | 0 (0.0%) | 0 (0.0%) |
| 4+ Person Household | 0 (0.0%) | 0 (0.0%) |
| Total Housing Units | 0 (0.0%) | 0 (0.0%) |
Occupancy by Educational Attainment in University of Pittsburgh Johnstown
| Household Size | Owner-occupied | Renter-occupied |
| Less than High School | 0 (0.0%) | 0 (0.0%) |
| High School Diploma | 0 (0.0%) | 0 (0.0%) |
| College/Associate Degree | 0 (0.0%) | 0 (0.0%) |
| Bachelor's Degree or higher | 0 (0.0%) | 0 (0.0%) |
Occupancy by Age of Householder in University of Pittsburgh Johnstown
| Age Bracket | # Households | % Households |
| Under 35 Years | 0 | 0.0% |
| 35 to 44 Years | 0 | 0.0% |
| 45 to 54 Years | 0 | 0.0% |
| 55 to 64 Years | 0 | 0.0% |
| 65 to 74 Years | 0 | 0.0% |
| 75 to 84 Years | 0 | 0.0% |
| 85 Years and Over | 0 | 0.0% |
| Total | 0 | 0.0% |
Housing Finances in University of Pittsburgh Johnstown
Median Income by Occupancy in University of Pittsburgh Johnstown
| Occupancy Type | # Households | Median Income |
| Owner-Occupied | 0 (0.0%) | $0 |
| Renter-Occupied | 0 (0.0%) | $0 |
| Average | 0 (0.0%) | $0 |
Occupancy by Householder Income Bracket in University of Pittsburgh Johnstown
| Income Bracket | Owner-occupied | Renter-occupied |
| Less than $5,000 | 0 (0.0%) | 0 (0.0%) |
| $5,000 to $9,999 | 0 (0.0%) | 0 (0.0%) |
| $10,000 to $14,999 | 0 (0.0%) | 0 (0.0%) |
| $15,000 to $19,999 | 0 (0.0%) | 0 (0.0%) |
| $20,000 to $24,999 | 0 (0.0%) | 0 (0.0%) |
| $25,000 to $34,999 | 0 (0.0%) | 0 (0.0%) |
| $35,000 to $49,999 | 0 (0.0%) | 0 (0.0%) |
| $50,000 to $74,999 | 0 (0.0%) | 0 (0.0%) |
| $75,000 to $99,999 | 0 (0.0%) | 0 (0.0%) |
| $100,000 to $149,999 | 0 (0.0%) | 0 (0.0%) |
| $150,000 or more | 0 (0.0%) | 0 (0.0%) |
| Total | 0 (0.0%) | 0 (0.0%) |
Monthly Housing Cost Tiers in University of Pittsburgh Johnstown
| Monthly Cost | Owner-occupied | Renter-occupied |
| Less than $300 | 0 (0.0%) | 0 (0.0%) |
| $300 to $499 | 0 (0.0%) | 0 (0.0%) |
| $500 to $799 | 0 (0.0%) | 0 (0.0%) |
| $800 to $999 | 0 (0.0%) | 0 (0.0%) |
| $1,000 to $1,499 | 0 (0.0%) | 0 (0.0%) |
| $1,500 to $1,999 | 0 (0.0%) | 0 (0.0%) |
| $2,000 to $2,499 | 0 (0.0%) | 0 (0.0%) |
| $2,500 to $2,999 | 0 (0.0%) | 0 (0.0%) |
| $3,000 or more | 0 (0.0%) | 0 (0.0%) |
| Total | 0 (0.0%) | 0 (0.0%) |
Physical Housing Characteristics in University of Pittsburgh Johnstown
Housing Structures in University of Pittsburgh Johnstown
| Structure Type | # Housing Units | % Housing Units |
| Single Unit, Detached | 0 | 0.0% |
| Single Unit, Attached | 0 | 0.0% |
| 2 Unit Apartments | 0 | 0.0% |
| 3 or 4 Unit Apartments | 0 | 0.0% |
| 5 to 9 Unit Apartments | 0 | 0.0% |
| 10 or more Apartments | 0 | 0.0% |
| Mobile Home / Other | 0 | 0.0% |
| Total | 0 | 0.0% |
Housing Structures by Occupancy in University of Pittsburgh Johnstown
| Structure Type | Owner-occupied | Renter-occupied |
| Single Unit, Detached | 0 (0.0%) | 0 (0.0%) |
| Single Unit, Attached | 0 (0.0%) | 0 (0.0%) |
| 2 Unit Apartments | 0 (0.0%) | 0 (0.0%) |
| 3 or 4 Unit Apartments | 0 (0.0%) | 0 (0.0%) |
| 5 to 9 Unit Apartments | 0 (0.0%) | 0 (0.0%) |
| 10 or more Apartments | 0 (0.0%) | 0 (0.0%) |
| Mobile Home / Other | 0 (0.0%) | 0 (0.0%) |
| Total | 0 (0.0%) | 0 (0.0%) |
Housing Structures by Number of Rooms in University of Pittsburgh Johnstown
| Number of Rooms | Owner-occupied | Renter-occupied |
| 1 Room | 0 (0.0%) | 0 (0.0%) |
| 2 or 3 Rooms | 0 (0.0%) | 0 (0.0%) |
| 4 or 5 Rooms | 0 (0.0%) | 0 (0.0%) |
| 6 or 7 Rooms | 0 (0.0%) | 0 (0.0%) |
| 8 or more Rooms | 0 (0.0%) | 0 (0.0%) |
| Total | 0 (0.0%) | 0 (0.0%) |
Housing Structure by Heating Type in University of Pittsburgh Johnstown
| Heating Type | Owner-occupied | Renter-occupied |
| Utility Gas | 0 (0.0%) | 0 (0.0%) |
| Bottled, Tank, or LP Gas | 0 (0.0%) | 0 (0.0%) |
| Electricity | 0 (0.0%) | 0 (0.0%) |
| Fuel Oil or Kerosene | 0 (0.0%) | 0 (0.0%) |
| Coal or Coke | 0 (0.0%) | 0 (0.0%) |
| All other Fuels | 0 (0.0%) | 0 (0.0%) |
| No Fuel Used | 0 (0.0%) | 0 (0.0%) |
| Total | 0 (0.0%) | 0 (0.0%) |
Household Vehicle Usage in University of Pittsburgh Johnstown
| Vehicles per Household | Owner-occupied | Renter-occupied |
| No Vehicle | 0 (0.0%) | 0 (0.0%) |
| 1 Vehicle | 0 (0.0%) | 0 (0.0%) |
| 2 Vehicles | 0 (0.0%) | 0 (0.0%) |
| 3 or more Vehicles | 0 (0.0%) | 0 (0.0%) |
| Total | 0 (0.0%) | 0 (0.0%) |
Real Estate & Mortgages in University of Pittsburgh Johnstown
Real Estate and Mortgage Overview in University of Pittsburgh Johnstown
| Characteristic | Without Mortgage | With Mortgage |
| Housing Units | 0 | 0 |
| Median Property Value | - | - |
| Median Household Income | - | - |
| Monthly Housing Costs | - | - |
| Real Estate Taxes | - | - |
Property Value by Mortgage Status in University of Pittsburgh Johnstown
| Property Value | Without Mortgage | With Mortgage |
| Less than $50,000 | 0 (0.0%) | 0 (0.0%) |
| $50,000 to $99,999 | 0 (0.0%) | 0 (0.0%) |
| $100,000 to $299,999 | 0 (0.0%) | 0 (0.0%) |
| $300,000 to $499,999 | 0 (0.0%) | 0 (0.0%) |
| $500,000 to $749,999 | 0 (0.0%) | 0 (0.0%) |
| $750,000 to $999,999 | 0 (0.0%) | 0 (0.0%) |
| $1,000,000 or more | 0 (0.0%) | 0 (0.0%) |
| Total | 0 (0.0%) | 0 (0.0%) |
Household Income by Mortgage Status in University of Pittsburgh Johnstown
| Household Income | Without Mortgage | With Mortgage |
| Less than $10,000 | 0 (0.0%) | 0 (0.0%) |
| $10,000 to $24,999 | 0 (0.0%) | 0 (0.0%) |
| $25,000 to $34,999 | 0 (0.0%) | 0 (0.0%) |
| $35,000 to $49,999 | 0 (0.0%) | 0 (0.0%) |
| $50,000 to $74,999 | 0 (0.0%) | 0 (0.0%) |
| $75,000 to $99,999 | 0 (0.0%) | 0 (0.0%) |
| $100,000 to $149,999 | 0 (0.0%) | 0 (0.0%) |
| $150,000 or more | 0 (0.0%) | 0 (0.0%) |
| Total | 0 (0.0%) | 0 (0.0%) |
Property Value to Household Income Ratio in University of Pittsburgh Johnstown
| Value-to-Income Ratio | Without Mortgage | With Mortgage |
| Less than 2.0x | 0 (0.0%) | 0 (0.0%) |
| 2.0x to 2.9x | 0 (0.0%) | 0 (0.0%) |
| 3.0x to 3.9x | 0 (0.0%) | 0 (0.0%) |
| 4.0x or more | 0 (0.0%) | 0 (0.0%) |
| Total | 0 (0.0%) | 0 (0.0%) |
Real Estate Taxes by Mortgage Status in University of Pittsburgh Johnstown
| Property Taxes | Without Mortgage | With Mortgage |
| Less than $800 | 0 (0.0%) | 0 (0.0%) |
| $800 to $1,499 | 0 (0.0%) | 0 (0.0%) |
| $800 to $1,499 | 0 (0.0%) | 0 (0.0%) |
| Total | 0 (0.0%) | 0 (0.0%) |
Health & Disability in University of Pittsburgh Johnstown
Health Insurance Coverage by Age in University of Pittsburgh Johnstown
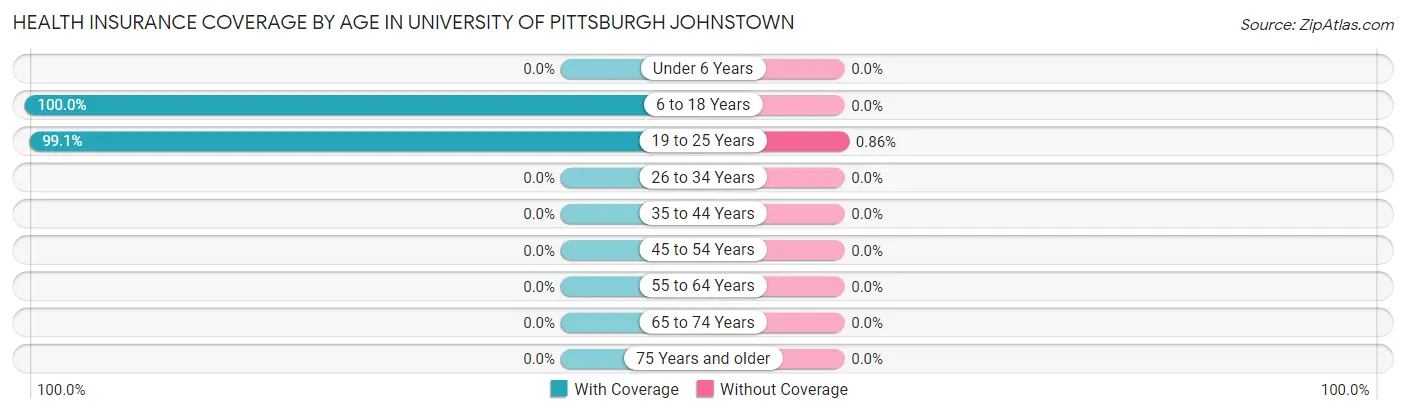
| Age Bracket | With Coverage | Without Coverage |
| Under 6 Years | 0 (0.0%) | 0 (0.0%) |
| 6 to 18 Years | 258 (100.0%) | 0 (0.0%) |
| 19 to 25 Years | 1,157 (99.1%) | 10 (0.9%) |
| 26 to 34 Years | 0 (0.0%) | 0 (0.0%) |
| 35 to 44 Years | 0 (0.0%) | 0 (0.0%) |
| 45 to 54 Years | 0 (0.0%) | 0 (0.0%) |
| 55 to 64 Years | 0 (0.0%) | 0 (0.0%) |
| 65 to 74 Years | 0 (0.0%) | 0 (0.0%) |
| 75 Years and older | 0 (0.0%) | 0 (0.0%) |
| Total | 1,415 (99.3%) | 10 (0.7%) |
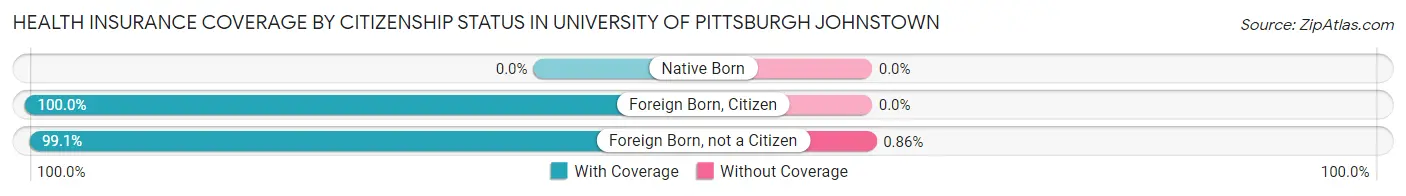
Health Insurance Coverage by Citizenship Status in University of Pittsburgh Johnstown
| Citizenship Status | With Coverage | Without Coverage |
| Native Born | 0 (0.0%) | 0 (0.0%) |
| Foreign Born, Citizen | 258 (100.0%) | 0 (0.0%) |
| Foreign Born, not a Citizen | 1,157 (99.1%) | 10 (0.9%) |
Health Insurance Coverage by Household Income in University of Pittsburgh Johnstown
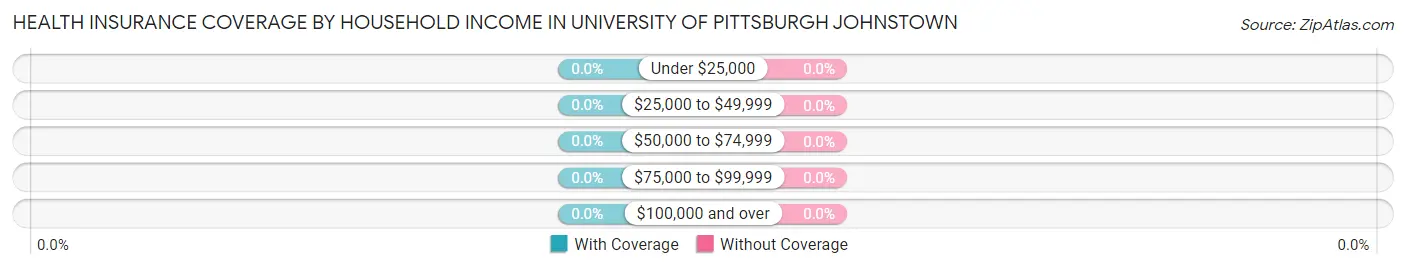
| Household Income | With Coverage | Without Coverage |
| Under $25,000 | 0 (0.0%) | 0 (0.0%) |
| $25,000 to $49,999 | 0 (0.0%) | 0 (0.0%) |
| $50,000 to $74,999 | 0 (0.0%) | 0 (0.0%) |
| $75,000 to $99,999 | 0 (0.0%) | 0 (0.0%) |
| $100,000 and over | 0 (0.0%) | 0 (0.0%) |
Public vs Private Health Insurance Coverage by Age in University of Pittsburgh Johnstown
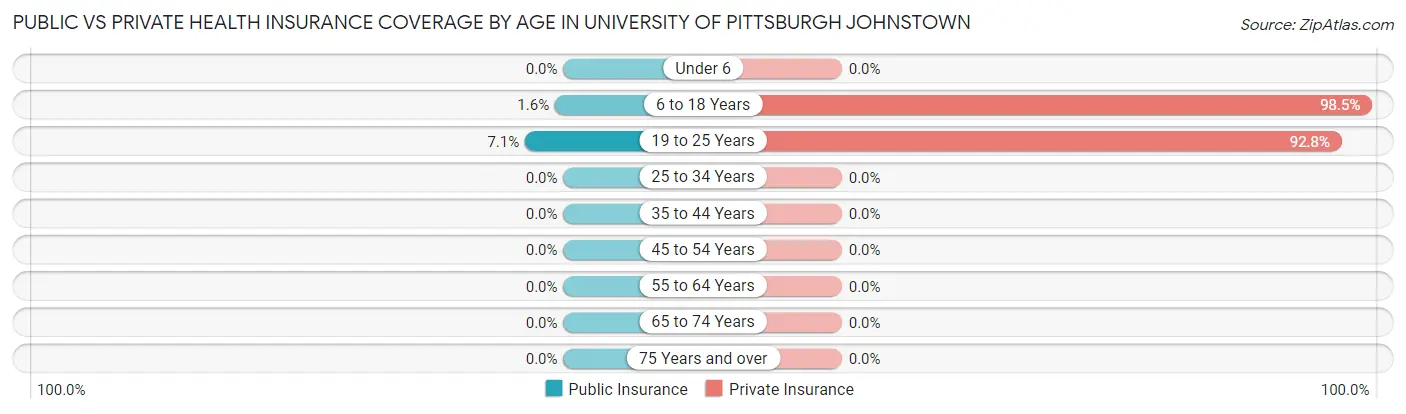
| Age Bracket | Public Insurance | Private Insurance |
| Under 6 | 0 (0.0%) | 0 (0.0%) |
| 6 to 18 Years | 4 (1.5%) | 254 (98.5%) |
| 19 to 25 Years | 83 (7.1%) | 1,083 (92.8%) |
| 25 to 34 Years | 0 (0.0%) | 0 (0.0%) |
| 35 to 44 Years | 0 (0.0%) | 0 (0.0%) |
| 45 to 54 Years | 0 (0.0%) | 0 (0.0%) |
| 55 to 64 Years | 0 (0.0%) | 0 (0.0%) |
| 65 to 74 Years | 0 (0.0%) | 0 (0.0%) |
| 75 Years and over | 0 (0.0%) | 0 (0.0%) |
| Total | 87 (6.1%) | 1,337 (93.8%) |
Disability Status by Sex by Age in University of Pittsburgh Johnstown
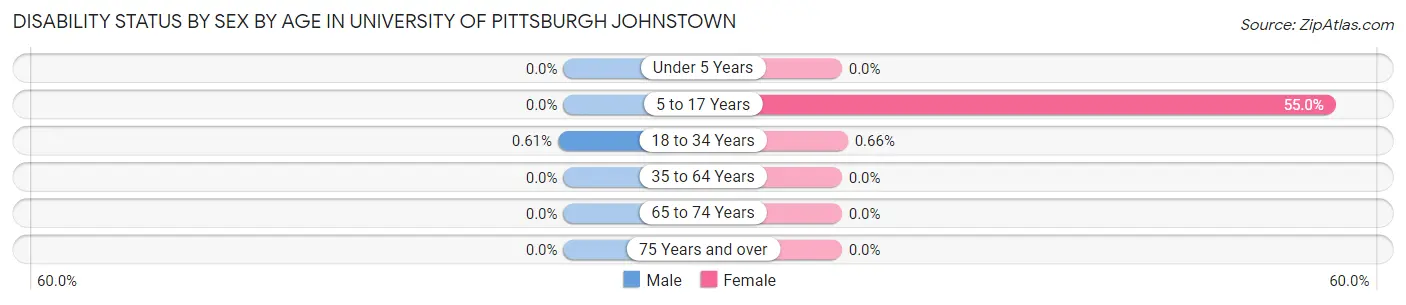
| Age Bracket | Male | Female |
| Under 5 Years | 0 (0.0%) | 0 (0.0%) |
| 5 to 17 Years | 0 (0.0%) | 11 (55.0%) |
| 18 to 34 Years | 4 (0.6%) | 5 (0.7%) |
| 35 to 64 Years | 0 (0.0%) | 0 (0.0%) |
| 65 to 74 Years | 0 (0.0%) | 0 (0.0%) |
| 75 Years and over | 0 (0.0%) | 0 (0.0%) |
Disability Class by Sex by Age in University of Pittsburgh Johnstown
Disability Class: Hearing Difficulty
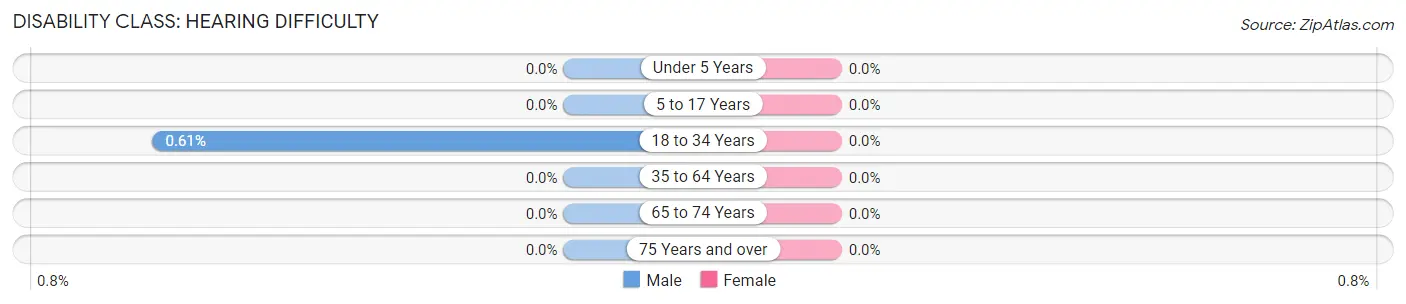
| Age Bracket | Male | Female |
| Under 5 Years | 0 (0.0%) | 0 (0.0%) |
| 5 to 17 Years | 0 (0.0%) | 0 (0.0%) |
| 18 to 34 Years | 4 (0.6%) | 0 (0.0%) |
| 35 to 64 Years | 0 (0.0%) | 0 (0.0%) |
| 65 to 74 Years | 0 (0.0%) | 0 (0.0%) |
| 75 Years and over | 0 (0.0%) | 0 (0.0%) |
Disability Class: Vision Difficulty
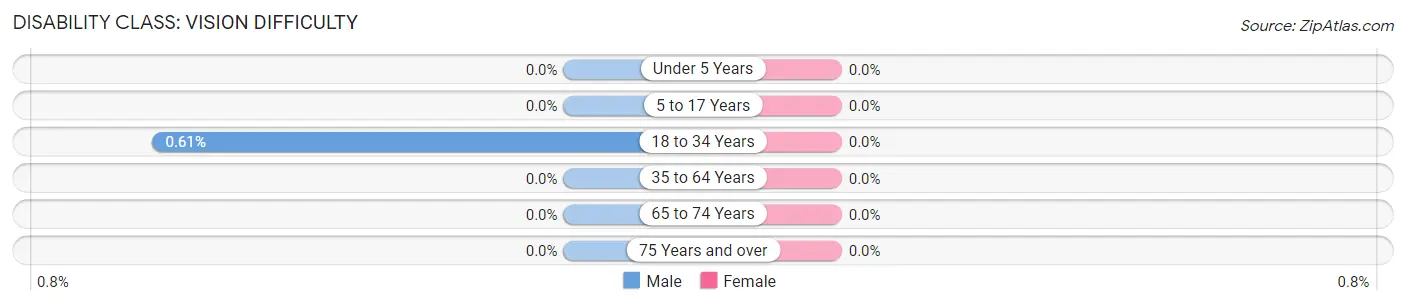
| Age Bracket | Male | Female |
| Under 5 Years | 0 (0.0%) | 0 (0.0%) |
| 5 to 17 Years | 0 (0.0%) | 0 (0.0%) |
| 18 to 34 Years | 4 (0.6%) | 0 (0.0%) |
| 35 to 64 Years | 0 (0.0%) | 0 (0.0%) |
| 65 to 74 Years | 0 (0.0%) | 0 (0.0%) |
| 75 Years and over | 0 (0.0%) | 0 (0.0%) |
Disability Class: Cognitive Difficulty
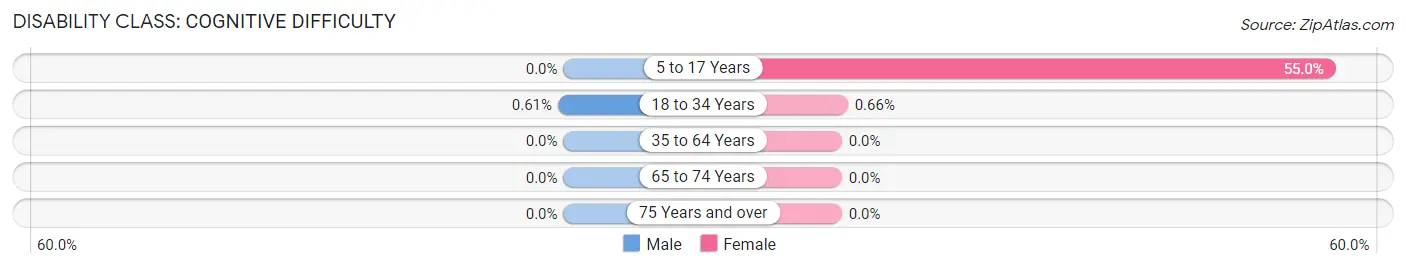
| Age Bracket | Male | Female |
| 5 to 17 Years | 0 (0.0%) | 11 (55.0%) |
| 18 to 34 Years | 4 (0.6%) | 5 (0.7%) |
| 35 to 64 Years | 0 (0.0%) | 0 (0.0%) |
| 65 to 74 Years | 0 (0.0%) | 0 (0.0%) |
| 75 Years and over | 0 (0.0%) | 0 (0.0%) |
Disability Class: Ambulatory Difficulty
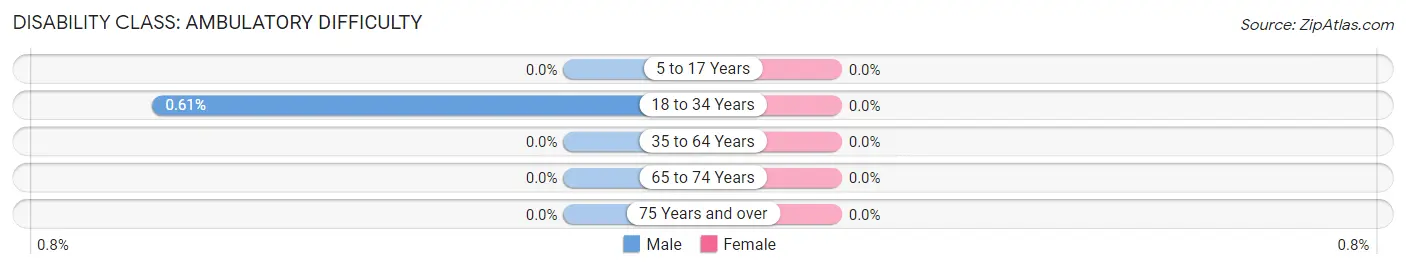
| Age Bracket | Male | Female |
| 5 to 17 Years | 0 (0.0%) | 0 (0.0%) |
| 18 to 34 Years | 4 (0.6%) | 0 (0.0%) |
| 35 to 64 Years | 0 (0.0%) | 0 (0.0%) |
| 65 to 74 Years | 0 (0.0%) | 0 (0.0%) |
| 75 Years and over | 0 (0.0%) | 0 (0.0%) |
Disability Class: Self-Care Difficulty
| Age Bracket | Male | Female |
| 5 to 17 Years | 0 (0.0%) | 0 (0.0%) |
| 18 to 34 Years | 4 (0.6%) | 0 (0.0%) |
| 35 to 64 Years | 0 (0.0%) | 0 (0.0%) |
| 65 to 74 Years | 0 (0.0%) | 0 (0.0%) |
| 75 Years and over | 0 (0.0%) | 0 (0.0%) |
Technology Access in University of Pittsburgh Johnstown
Computing Device Access in University of Pittsburgh Johnstown
| Device Type | # Households | % Households |
| Desktop or Laptop | 0 | 0.0% |
| Smartphone | 0 | 0.0% |
| Tablet | 0 | 0.0% |
| No Computing Device | 0 | 0.0% |
| Total | 0 | 0.0% |
Internet Access in University of Pittsburgh Johnstown
| Internet Type | # Households | % Households |
| Dial-Up Internet | 0 | 0.0% |
| Broadband Home | 0 | 0.0% |
| Cellular Data Only | 0 | 0.0% |
| Satellite Internet | 0 | 0.0% |
| No Internet | 0 | 0.0% |
| Total | 0 | 0.0% |
University of Pittsburgh Johnstown Summary
University of Pittsburgh Johnstown (UPJ) is a regional campus of the University of Pittsburgh located in Johnstown, Pennsylvania. UPJ was founded in 1927 as a branch of the University of Pittsburgh and is the only regional campus of the University of Pittsburgh. UPJ is located in the foothills of the Allegheny Mountains in Cambria County, Pennsylvania. The campus is situated on a hill overlooking the city of Johnstown and the Conemaugh River Valley. UPJ is a comprehensive regional campus offering a wide range of undergraduate and graduate degree programs.
History
The University of Pittsburgh Johnstown was founded in 1927 as a branch of the University of Pittsburgh. The campus was established to provide educational opportunities to the residents of the Johnstown area. The original campus consisted of a single building, the Johnstown High School, which was donated to the University of Pittsburgh by the Johnstown School District. The building was renovated and expanded over the years to accommodate the growing student population.
In the 1950s, the University of Pittsburgh began to expand its presence in Johnstown. The campus was relocated to its current location on the hill overlooking the city of Johnstown and the Conemaugh River Valley. The new campus included a library, student union, and several academic buildings. In the 1960s, the University of Pittsburgh Johnstown began to offer graduate degree programs.
Geography
The University of Pittsburgh Johnstown is located in the foothills of the Allegheny Mountains in Cambria County, Pennsylvania. The campus is situated on a hill overlooking the city of Johnstown and the Conemaugh River Valley. The campus is surrounded by a variety of natural features including forests, streams, and rolling hills. The campus is also located near several recreational areas including the Allegheny National Forest, Laurel Hill State Park, and the Youghiogheny River.
Economy
The University of Pittsburgh Johnstown is an important economic engine for the region. The campus provides jobs for faculty, staff, and students and contributes to the local economy through the purchase of goods and services. UPJ also serves as an incubator for new businesses and provides educational opportunities for the local workforce.
Demographics
The University of Pittsburgh Johnstown has a diverse student body. The student population is composed of students from all over the world. The student body is also diverse in terms of race, ethnicity, and gender. The student body is approximately 60% female and 40% male. The student body is also composed of a variety of racial and ethnic backgrounds. The most common racial/ethnic backgrounds represented on campus are White (60%), African American (15%), Hispanic (10%), Asian (7%), and Native American (3%).
Common Questions
What is Per Capita Income in University of Pittsburgh Johnstown?
Per Capita income in University of Pittsburgh Johnstown is $4,022.
What is Income or Wage Gap in University of Pittsburgh Johnstown?
Income or Wage Gap in University of Pittsburgh Johnstown is 36.8%.
Women in University of Pittsburgh Johnstown earn 63.2 cents for every dollar earned by a man.
What is the Total Population of University of Pittsburgh Johnstown?
Total Population of University of Pittsburgh Johnstown is 1,428.
What is the Total Male Population of University of Pittsburgh Johnstown?
Total Male Population of University of Pittsburgh Johnstown is 656.
What is the Total Female Population of University of Pittsburgh Johnstown?
Total Female Population of University of Pittsburgh Johnstown is 772.
What is the Ratio of Males per 100 Females in University of Pittsburgh Johnstown?
There are 84.97 Males per 100 Females in University of Pittsburgh Johnstown.
What is the Ratio of Females per 100 Males in University of Pittsburgh Johnstown?
There are 117.68 Females per 100 Males in University of Pittsburgh Johnstown.
What is the Median Population Age in University of Pittsburgh Johnstown?
Median Population Age in University of Pittsburgh Johnstown is 19.9 Years.
How Large is the Labor Force in University of Pittsburgh Johnstown?
There are 331 People in the Labor Forcein in University of Pittsburgh Johnstown.
What is the Percentage of People in the Labor Force in University of Pittsburgh Johnstown?
23.2% of People are in the Labor Force in University of Pittsburgh Johnstown.
What is the Unemployment Rate in University of Pittsburgh Johnstown?
Unemployment Rate in University of Pittsburgh Johnstown is 6.1%.