Siglerville, PA Map & Demographics
Siglerville Map
Siglerville Overview
$32,999
PER CAPITA INCOME
56.4%
WAGE / INCOME GAP [ % ]
43.6¢/ $1
WAGE / INCOME GAP [ $ ]
0.30
INEQUALITY / GINI INDEX
197
TOTAL POPULATION
117
MALE POPULATION
80
FEMALE POPULATION
146.25
MALES / 100 FEMALES
68.38
FEMALES / 100 MALES
60.1
MEDIAN AGE
2.1
AVG FAMILY SIZE
2.0
AVG HOUSEHOLD SIZE
88
LABOR FORCE [ PEOPLE ]
54.0%
PERCENT IN LABOR FORCE
Income in Siglerville
Income Overview in Siglerville
| Characteristic | Number | Measure |
| Per Capita Income | 197 | $32,999 |
| Median Family Income | 88 | $0 |
| Mean Family Income | 88 | $74,984 |
| Median Household Income | 98 | $0 |
| Mean Household Income | 98 | $73,229 |
| Income Deficit | 88 | $0 |
| Wage / Income Gap (%) | 197 | 56.42% |
| Wage / Income Gap ($) | 197 | 43.58¢ per $1 |
| Gini / Inequality Index | 197 | 0.30 |
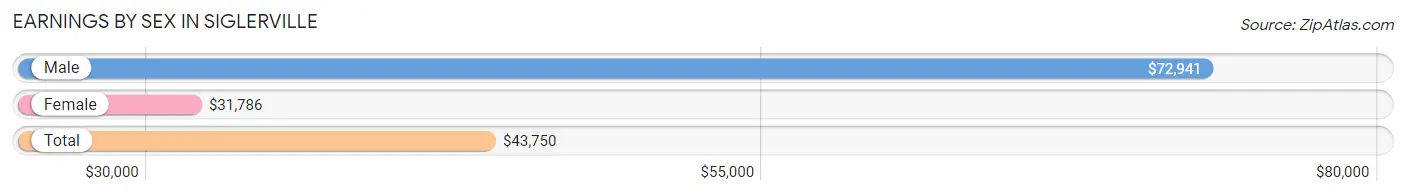
Earnings by Sex in Siglerville
Average Earnings in Siglerville are $43,750, $72,941 for men and $31,786 for women, a difference of 56.4%.
| Sex | Number | Average Earnings |
| Male | 74 (69.8%) | $72,941 |
| Female | 32 (30.2%) | $31,786 |
| Total | 106 (100.0%) | $43,750 |
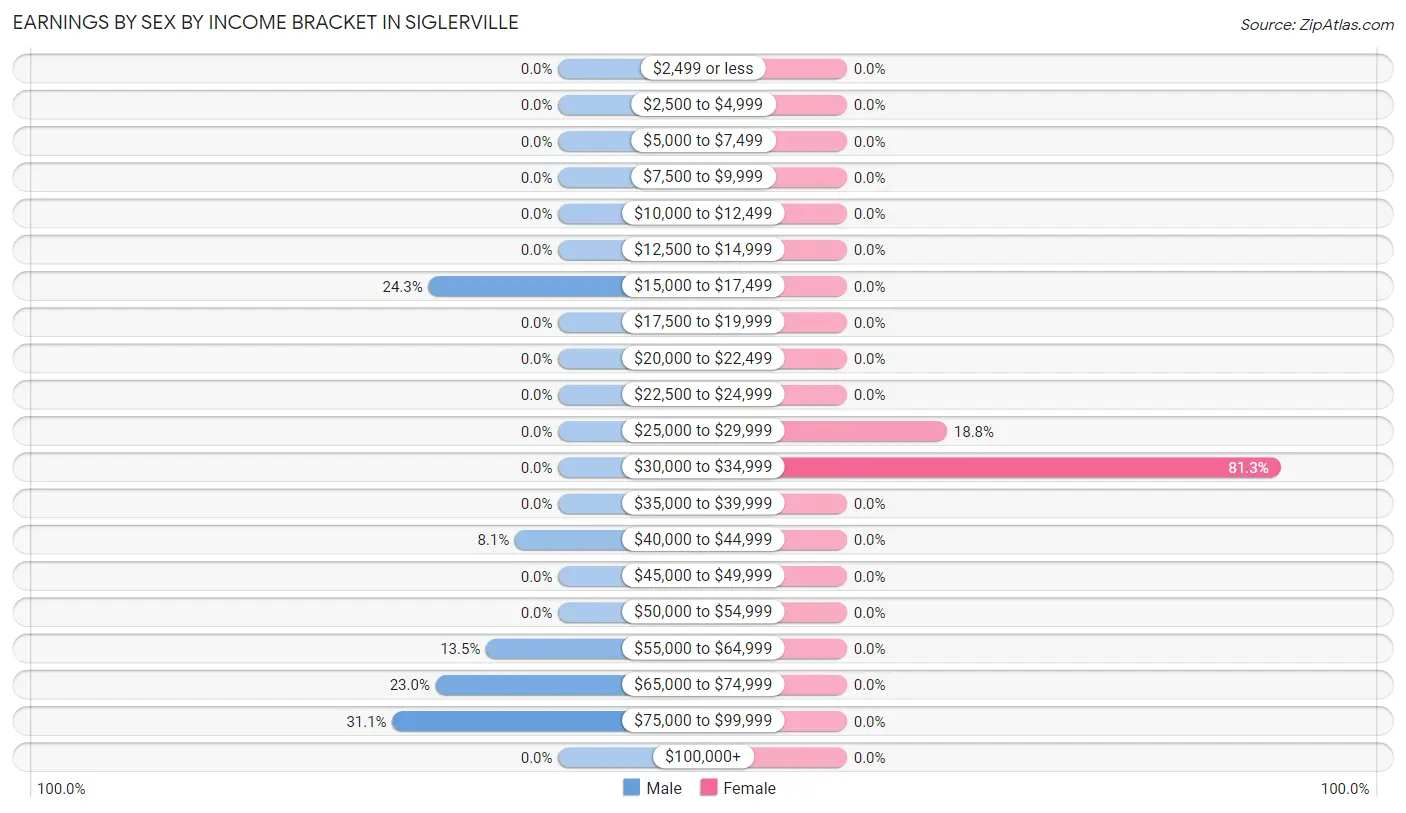
Earnings by Sex by Income Bracket in Siglerville
The most common earnings brackets in Siglerville are $75,000 to $99,999 for men (23 | 31.1%) and $30,000 to $34,999 for women (26 | 81.2%).
| Income | Male | Female |
| $2,499 or less | 0 (0.0%) | 0 (0.0%) |
| $2,500 to $4,999 | 0 (0.0%) | 0 (0.0%) |
| $5,000 to $7,499 | 0 (0.0%) | 0 (0.0%) |
| $7,500 to $9,999 | 0 (0.0%) | 0 (0.0%) |
| $10,000 to $12,499 | 0 (0.0%) | 0 (0.0%) |
| $12,500 to $14,999 | 0 (0.0%) | 0 (0.0%) |
| $15,000 to $17,499 | 18 (24.3%) | 0 (0.0%) |
| $17,500 to $19,999 | 0 (0.0%) | 0 (0.0%) |
| $20,000 to $22,499 | 0 (0.0%) | 0 (0.0%) |
| $22,500 to $24,999 | 0 (0.0%) | 0 (0.0%) |
| $25,000 to $29,999 | 0 (0.0%) | 6 (18.8%) |
| $30,000 to $34,999 | 0 (0.0%) | 26 (81.2%) |
| $35,000 to $39,999 | 0 (0.0%) | 0 (0.0%) |
| $40,000 to $44,999 | 6 (8.1%) | 0 (0.0%) |
| $45,000 to $49,999 | 0 (0.0%) | 0 (0.0%) |
| $50,000 to $54,999 | 0 (0.0%) | 0 (0.0%) |
| $55,000 to $64,999 | 10 (13.5%) | 0 (0.0%) |
| $65,000 to $74,999 | 17 (23.0%) | 0 (0.0%) |
| $75,000 to $99,999 | 23 (31.1%) | 0 (0.0%) |
| $100,000+ | 0 (0.0%) | 0 (0.0%) |
| Total | 74 (100.0%) | 32 (100.0%) |
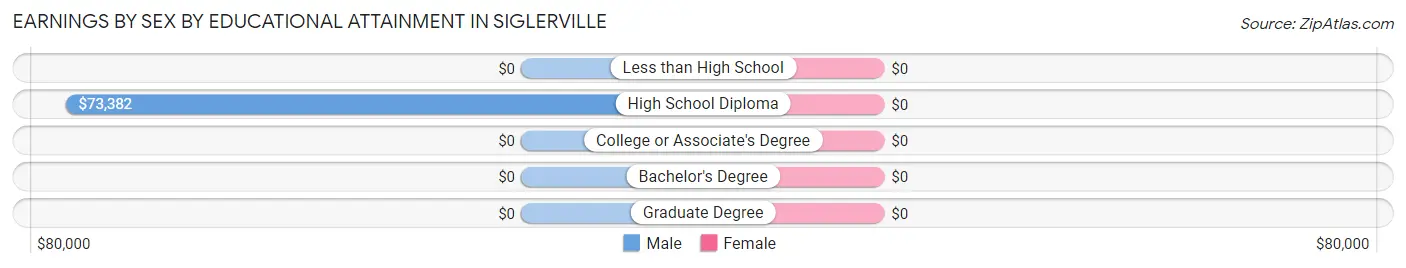
Earnings by Sex by Educational Attainment in Siglerville
| Educational Attainment | Male Income | Female Income |
| Less than High School | - | - |
| High School Diploma | $73,382 | $0 |
| College or Associate's Degree | - | - |
| Bachelor's Degree | - | - |
| Graduate Degree | - | - |
| Total | $72,941 | $31,786 |
Family Income in Siglerville
Family Income Brackets in Siglerville
According to the Siglerville family income data, there are 40 families falling into the $100,000 to $149,999 income range, which is the most common income bracket and makes up 45.5% of all families.
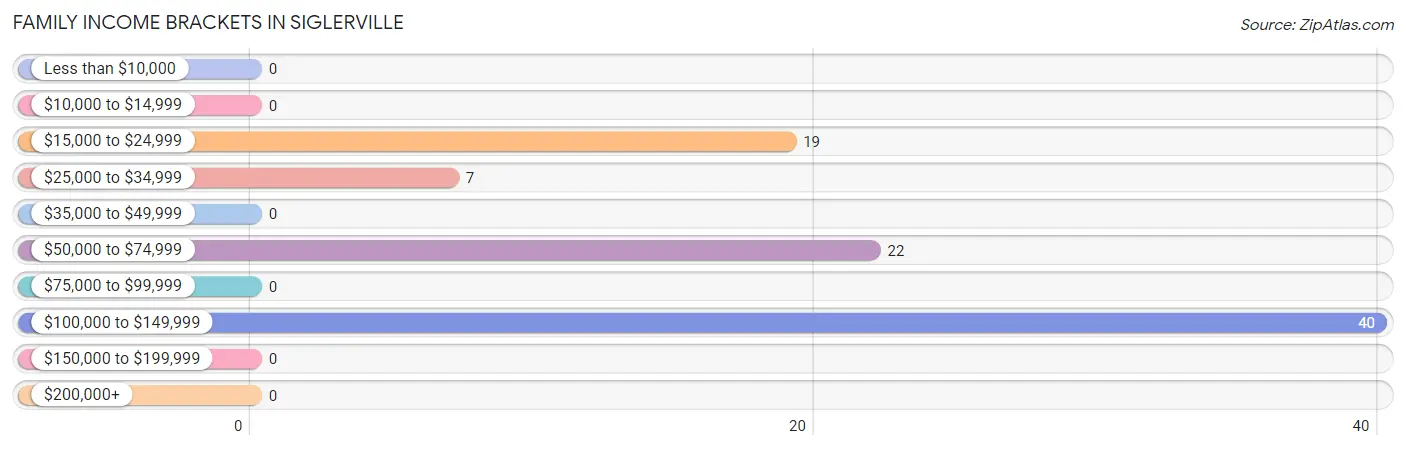
| Income Bracket | # Families | % Families |
| Less than $10,000 | 0 | 0.0% |
| $10,000 to $14,999 | 0 | 0.0% |
| $15,000 to $24,999 | 19 | 21.6% |
| $25,000 to $34,999 | 7 | 8.0% |
| $35,000 to $49,999 | 0 | 0.0% |
| $50,000 to $74,999 | 22 | 25.0% |
| $75,000 to $99,999 | 0 | 0.0% |
| $100,000 to $149,999 | 40 | 45.5% |
| $150,000 to $199,999 | 0 | 0.0% |
| $200,000+ | 0 | 0.0% |
Family Income by Famaliy Size in Siglerville
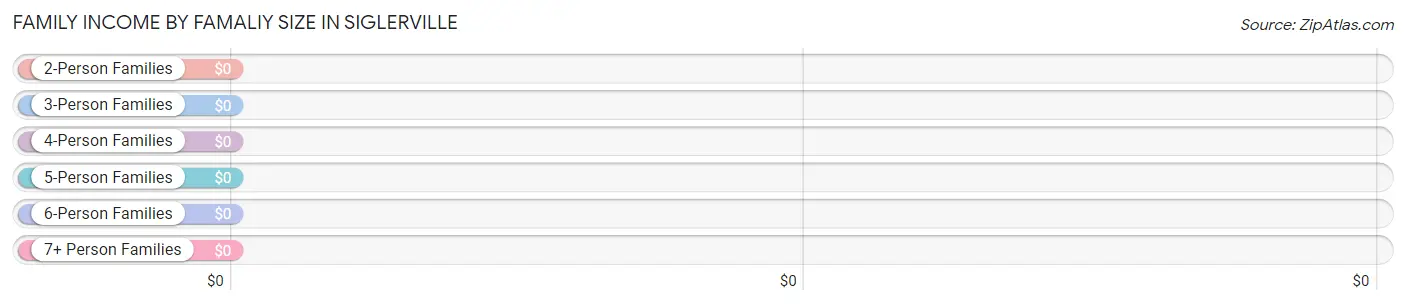
| Income Bracket | # Families | Median Income |
| 2-Person Families | 65 (73.9%) | $0 |
| 3-Person Families | 6 (6.8%) | $0 |
| 4-Person Families | 17 (19.3%) | $0 |
| 5-Person Families | 0 (0.0%) | $0 |
| 6-Person Families | 0 (0.0%) | $0 |
| 7+ Person Families | 0 (0.0%) | $0 |
| Total | 88 (100.0%) | $0 |
Family Income by Number of Earners in Siglerville
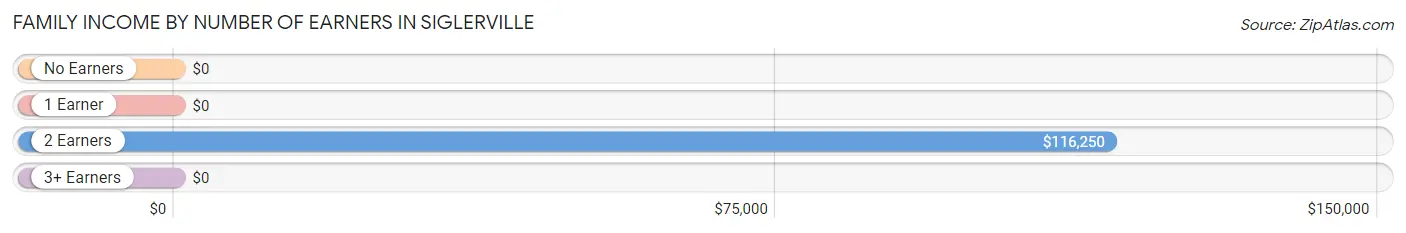
| Number of Earners | # Families | Median Income |
| No Earners | 23 (26.1%) | $0 |
| 1 Earner | 19 (21.6%) | $0 |
| 2 Earners | 46 (52.3%) | $116,250 |
| 3+ Earners | 0 (0.0%) | $0 |
| Total | 88 (100.0%) | $0 |
Household Income in Siglerville
Household Income Brackets in Siglerville
With 40 households falling in the category, the $100,000 to $149,999 income range is the most frequent in Siglerville, accounting for 40.8% of all households.
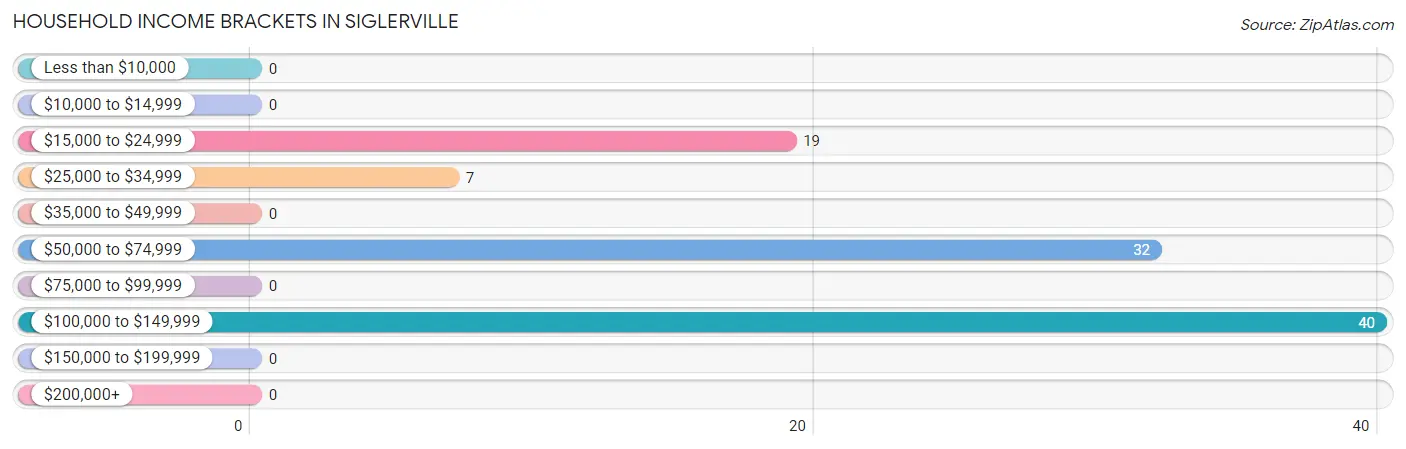
| Income Bracket | # Households | % Households |
| Less than $10,000 | 0 | 0.0% |
| $10,000 to $14,999 | 0 | 0.0% |
| $15,000 to $24,999 | 19 | 19.4% |
| $25,000 to $34,999 | 7 | 7.1% |
| $35,000 to $49,999 | 0 | 0.0% |
| $50,000 to $74,999 | 32 | 32.7% |
| $75,000 to $99,999 | 0 | 0.0% |
| $100,000 to $149,999 | 40 | 40.8% |
| $150,000 to $199,999 | 0 | 0.0% |
| $200,000+ | 0 | 0.0% |
Household Income by Householder Age in Siglerville
| Income Bracket | # Households | Median Income |
| 15 to 24 Years | 0 (0.0%) | $0 |
| 25 to 44 Years | 23 (23.5%) | $0 |
| 45 to 64 Years | 52 (53.1%) | $0 |
| 65+ Years | 23 (23.5%) | $0 |
| Total | 98 (100.0%) | $0 |
Poverty in Siglerville
Income Below Poverty by Sex and Age in Siglerville
| Age Bracket | Male | Female |
| Under 5 Years | 0 (0.0%) | 0 (0.0%) |
| 5 Years | 0 (0.0%) | 0 (0.0%) |
| 6 to 11 Years | 0 (0.0%) | 0 (0.0%) |
| 12 to 14 Years | 0 (0.0%) | 0 (0.0%) |
| 15 Years | 0 (0.0%) | 0 (0.0%) |
| 16 and 17 Years | 0 (0.0%) | 0 (0.0%) |
| 18 to 24 Years | 0 (0.0%) | 0 (0.0%) |
| 25 to 34 Years | 0 (0.0%) | 0 (0.0%) |
| 35 to 44 Years | 0 (0.0%) | 0 (0.0%) |
| 45 to 54 Years | 0 (0.0%) | 0 (0.0%) |
| 55 to 64 Years | 0 (0.0%) | 0 (0.0%) |
| 65 to 74 Years | 0 (0.0%) | 0 (0.0%) |
| 75 Years and over | 0 (0.0%) | 0 (0.0%) |
| Total | 0 (0.0%) | 0 (0.0%) |
Income Above Poverty by Sex and Age in Siglerville
According to the poverty statistics in Siglerville, males aged under 5 years and females aged 12 to 14 years are the age groups that are most secure financially, with 100.0% of males and 100.0% of females in these age groups living above the poverty line.
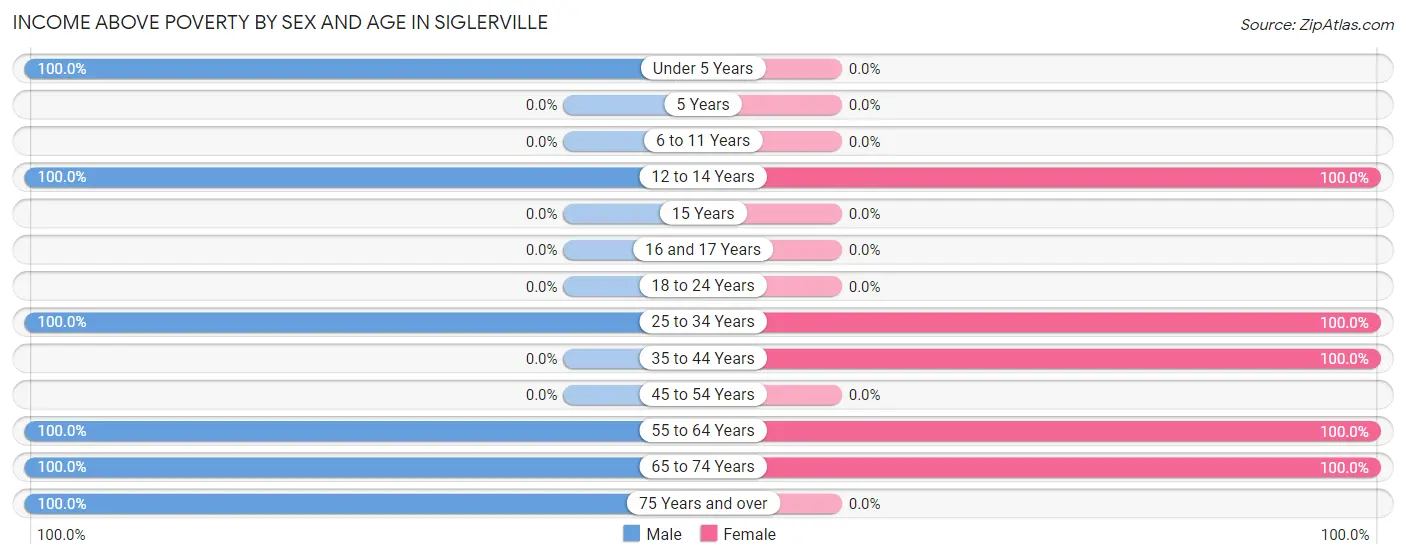
| Age Bracket | Male | Female |
| Under 5 Years | 7 (100.0%) | 0 (0.0%) |
| 5 Years | 0 (0.0%) | 0 (0.0%) |
| 6 to 11 Years | 0 (0.0%) | 0 (0.0%) |
| 12 to 14 Years | 13 (100.0%) | 14 (100.0%) |
| 15 Years | 0 (0.0%) | 0 (0.0%) |
| 16 and 17 Years | 0 (0.0%) | 0 (0.0%) |
| 18 to 24 Years | 0 (0.0%) | 0 (0.0%) |
| 25 to 34 Years | 23 (100.0%) | 6 (100.0%) |
| 35 to 44 Years | 0 (0.0%) | 12 (100.0%) |
| 45 to 54 Years | 0 (0.0%) | 0 (0.0%) |
| 55 to 64 Years | 51 (100.0%) | 33 (100.0%) |
| 65 to 74 Years | 7 (100.0%) | 15 (100.0%) |
| 75 Years and over | 16 (100.0%) | 0 (0.0%) |
| Total | 117 (100.0%) | 80 (100.0%) |
Income Below Poverty Among Married-Couple Families in Siglerville
| Children | Above Poverty | Below Poverty |
| No Children | 65 (100.0%) | 0 (0.0%) |
| 1 or 2 Children | 23 (100.0%) | 0 (0.0%) |
| 3 or 4 Children | 0 (0.0%) | 0 (0.0%) |
| 5 or more Children | 0 (0.0%) | 0 (0.0%) |
| Total | 88 (100.0%) | 0 (0.0%) |
Income Below Poverty Among Single-Parent Households in Siglerville
| Children | Single Father | Single Mother |
| No Children | 0 (0.0%) | 0 (0.0%) |
| 1 or 2 Children | 0 (0.0%) | 0 (0.0%) |
| 3 or 4 Children | 0 (0.0%) | 0 (0.0%) |
| 5 or more Children | 0 (0.0%) | 0 (0.0%) |
| Total | 0 (0.0%) | 0 (0.0%) |
Income Below Poverty Among Married-Couple vs Single-Parent Households in Siglerville
| Children | Married-Couple Families | Single-Parent Households |
| No Children | 0 (0.0%) | 0 (0.0%) |
| 1 or 2 Children | 0 (0.0%) | 0 (0.0%) |
| 3 or 4 Children | 0 (0.0%) | 0 (0.0%) |
| 5 or more Children | 0 (0.0%) | 0 (0.0%) |
| Total | 0 (0.0%) | 0 (0.0%) |
Race in Siglerville
The most populous races in Siglerville are , and White / Caucasian (197 | 100.0%).
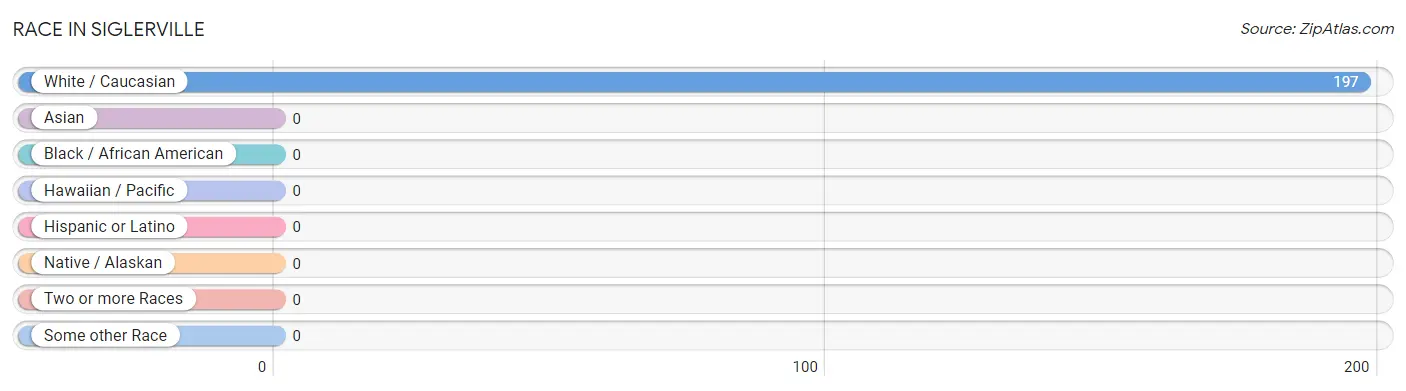
| Race | # Population | % Population |
| Asian | 0 | 0.0% |
| Black / African American | 0 | 0.0% |
| Hawaiian / Pacific | 0 | 0.0% |
| Hispanic or Latino | 0 | 0.0% |
| Native / Alaskan | 0 | 0.0% |
| White / Caucasian | 197 | 100.0% |
| Two or more Races | 0 | 0.0% |
| Some other Race | 0 | 0.0% |
| Total | 197 | 100.0% |
Ancestry in Siglerville
The most populous ancestries reported in Siglerville are German (63 | 32.0%), American (24 | 12.2%), Irish (19 | 9.6%), European (16 | 8.1%), and Scottish (14 | 7.1%), together accounting for 69.0% of all Siglerville residents.
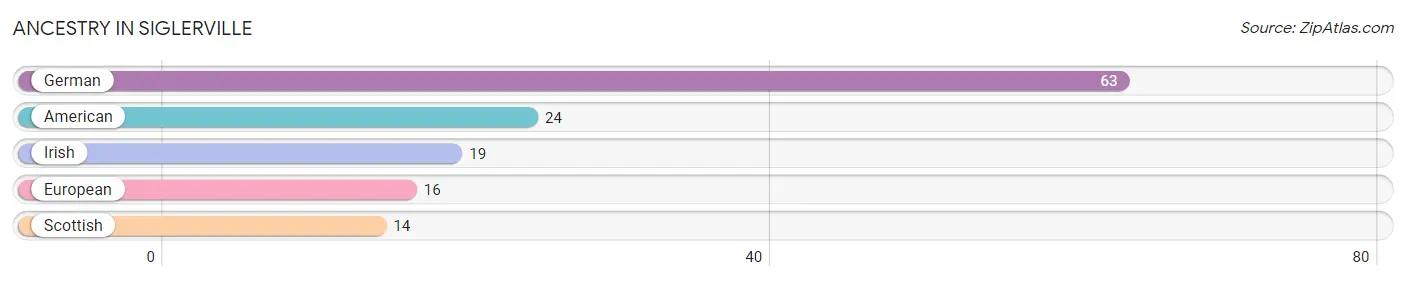
| Ancestry | # Population | % Population |
| American | 24 | 12.2% |
| European | 16 | 8.1% |
| German | 63 | 32.0% |
| Irish | 19 | 9.6% |
| Scottish | 14 | 7.1% | View All 5 Rows |
Immigrants in Siglerville

| Immigration Origin | # Population | % Population | View All 0 Rows |
Sex and Age in Siglerville
Sex and Age in Siglerville
The most populous age groups in Siglerville are 60 to 64 Years (28 | 23.9%) for men and 60 to 64 Years (33 | 41.2%) for women.
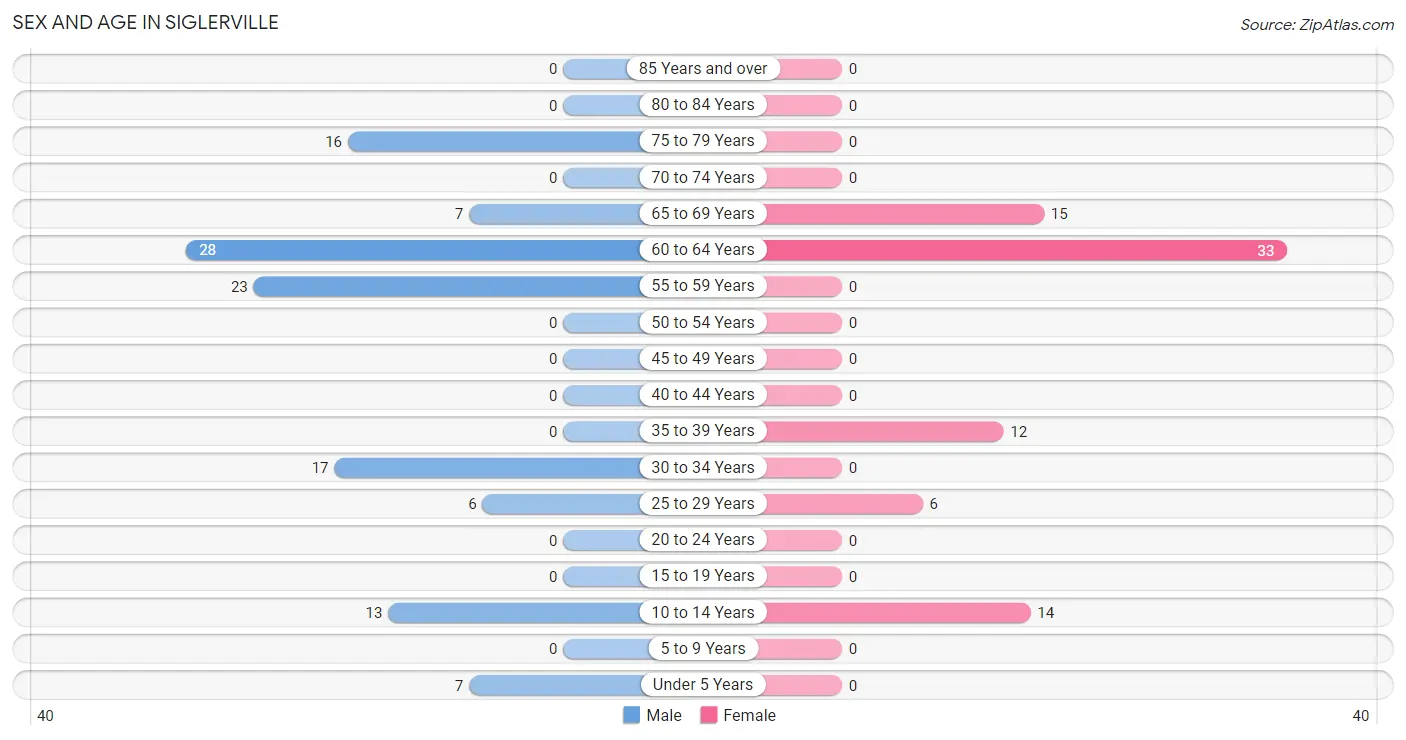
| Age Bracket | Male | Female |
| Under 5 Years | 7 (6.0%) | 0 (0.0%) |
| 5 to 9 Years | 0 (0.0%) | 0 (0.0%) |
| 10 to 14 Years | 13 (11.1%) | 14 (17.5%) |
| 15 to 19 Years | 0 (0.0%) | 0 (0.0%) |
| 20 to 24 Years | 0 (0.0%) | 0 (0.0%) |
| 25 to 29 Years | 6 (5.1%) | 6 (7.5%) |
| 30 to 34 Years | 17 (14.5%) | 0 (0.0%) |
| 35 to 39 Years | 0 (0.0%) | 12 (15.0%) |
| 40 to 44 Years | 0 (0.0%) | 0 (0.0%) |
| 45 to 49 Years | 0 (0.0%) | 0 (0.0%) |
| 50 to 54 Years | 0 (0.0%) | 0 (0.0%) |
| 55 to 59 Years | 23 (19.7%) | 0 (0.0%) |
| 60 to 64 Years | 28 (23.9%) | 33 (41.2%) |
| 65 to 69 Years | 7 (6.0%) | 15 (18.8%) |
| 70 to 74 Years | 0 (0.0%) | 0 (0.0%) |
| 75 to 79 Years | 16 (13.7%) | 0 (0.0%) |
| 80 to 84 Years | 0 (0.0%) | 0 (0.0%) |
| 85 Years and over | 0 (0.0%) | 0 (0.0%) |
| Total | 117 (100.0%) | 80 (100.0%) |
Families and Households in Siglerville
Median Family Size in Siglerville
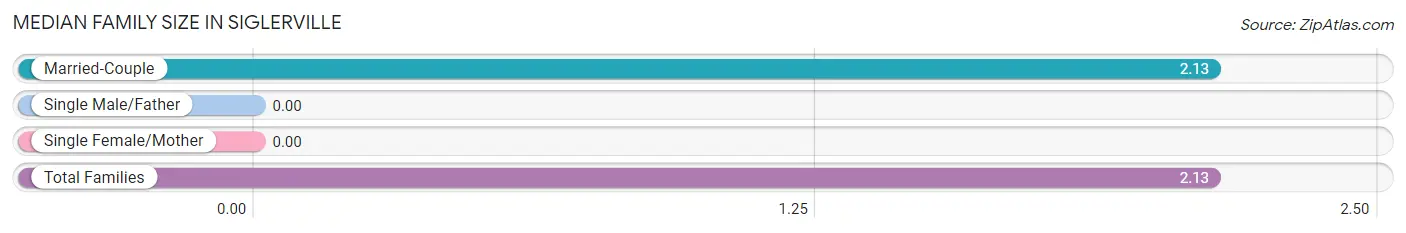
| Family Type | # Families | Family Size |
| Married-Couple | 88 (100.0%) | 2.13 |
| Single Male/Father | 0 (0.0%) | - |
| Single Female/Mother | 0 (0.0%) | - |
| Total Families | 88 (100.0%) | 2.13 |
Median Household Size in Siglerville
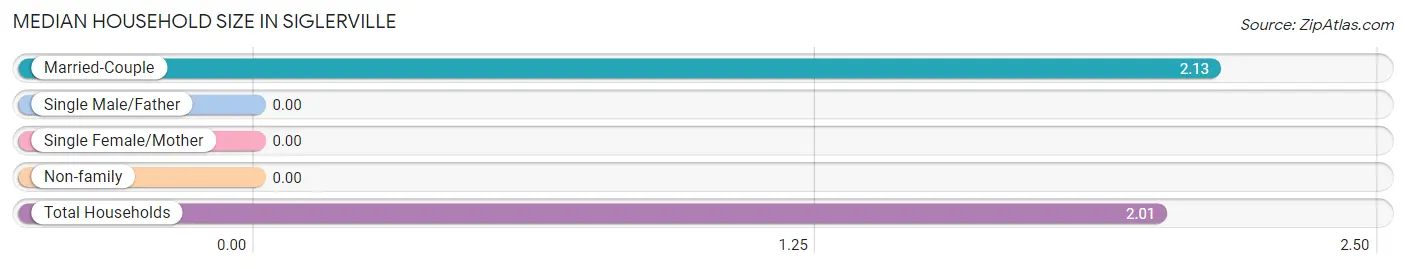
| Household Type | # Households | Household Size |
| Married-Couple | 88 (89.8%) | 2.13 |
| Single Male/Father | 0 (0.0%) | - |
| Single Female/Mother | 0 (0.0%) | - |
| Non-family | 10 (10.2%) | - |
| Total Households | 98 (100.0%) | 2.01 |
Household Size by Marriage Status in Siglerville
Out of a total of 98 households in Siglerville, 88 (89.8%) are family households, while 10 (10.2%) are nonfamily households. The most numerous type of family households are 2-person households, comprising 65, and the most common type of nonfamily households are 1-person households, comprising 10.
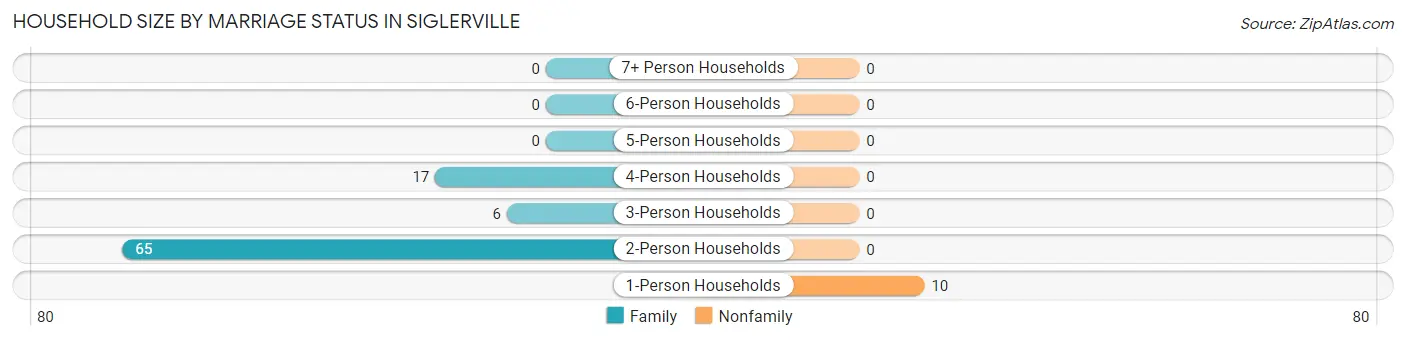
| Household Size | Family Households | Nonfamily Households |
| 1-Person Households | - | 10 (10.2%) |
| 2-Person Households | 65 (66.3%) | 0 (0.0%) |
| 3-Person Households | 6 (6.1%) | 0 (0.0%) |
| 4-Person Households | 17 (17.3%) | 0 (0.0%) |
| 5-Person Households | 0 (0.0%) | 0 (0.0%) |
| 6-Person Households | 0 (0.0%) | 0 (0.0%) |
| 7+ Person Households | 0 (0.0%) | 0 (0.0%) |
| Total | 88 (89.8%) | 10 (10.2%) |
Female Fertility in Siglerville
Fertility by Age in Siglerville
| Age Bracket | Women with Births | Births / 1,000 Women |
| 15 to 19 years | 0 (0.0%) | 0.0 |
| 20 to 34 years | 0 (0.0%) | 0.0 |
| 35 to 50 years | 0 (0.0%) | 0.0 |
| Total | 0 (0.0%) | 0.0 |
Fertility by Age by Marriage Status in Siglerville
| Age Bracket | Married | Unmarried |
| 15 to 19 years | 0 (0.0%) | 0 (0.0%) |
| 20 to 34 years | 0 (0.0%) | 0 (0.0%) |
| 35 to 50 years | 0 (0.0%) | 0 (0.0%) |
| Total | 0 (0.0%) | 0 (0.0%) |
Fertility by Education in Siglerville
| Educational Attainment | Women with Births | Births / 1,000 Women |
| Less than High School | 0 (0.0%) | 0.0 |
| High School Diploma | 0 (0.0%) | 0.0 |
| College or Associate's Degree | 0 (0.0%) | 0.0 |
| Bachelor's Degree | 0 (0.0%) | 0.0 |
| Graduate Degree | 0 (0.0%) | 0.0 |
| Total | 0 (0.0%) | 0.0 |
Fertility by Education by Marriage Status in Siglerville
| Educational Attainment | Married | Unmarried |
| Less than High School | 0 (0.0%) | 0 (0.0%) |
| High School Diploma | 0 (0.0%) | 0 (0.0%) |
| College or Associate's Degree | 0 (0.0%) | 0 (0.0%) |
| Bachelor's Degree | 0 (0.0%) | 0 (0.0%) |
| Graduate Degree | 0 (0.0%) | 0 (0.0%) |
| Total | 0 (0.0%) | 0 (0.0%) |
Employment Characteristics in Siglerville
Employment by Class of Employer in Siglerville
Among the 88 employed individuals in Siglerville, private company employees (55 | 62.5%), self-employed (not incorporated) (23 | 26.1%), and federal government employees (10 | 11.4%) make up the most common classes of employment.
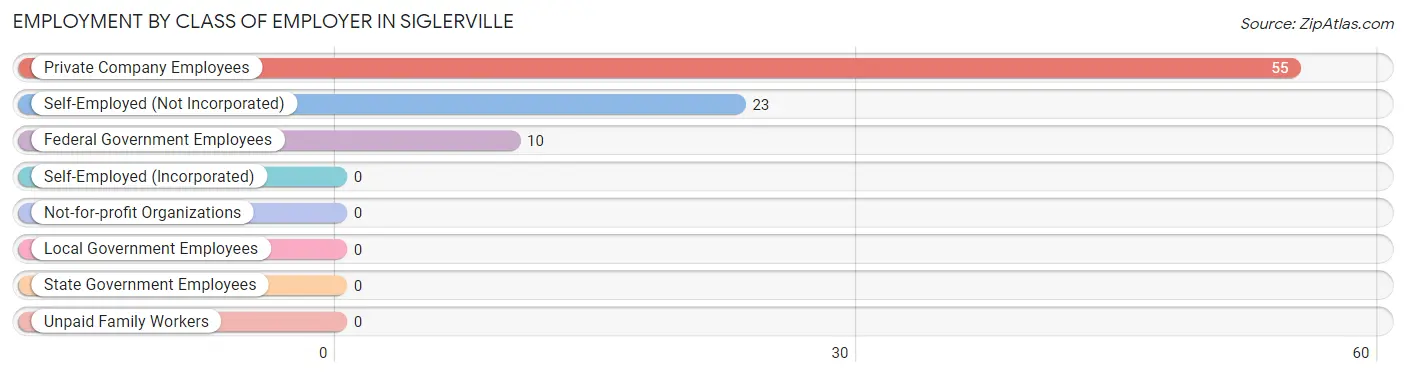
| Employer Class | # Employees | % Employees |
| Private Company Employees | 55 | 62.5% |
| Self-Employed (Incorporated) | 0 | 0.0% |
| Self-Employed (Not Incorporated) | 23 | 26.1% |
| Not-for-profit Organizations | 0 | 0.0% |
| Local Government Employees | 0 | 0.0% |
| State Government Employees | 0 | 0.0% |
| Federal Government Employees | 10 | 11.4% |
| Unpaid Family Workers | 0 | 0.0% |
| Total | 88 | 100.0% |
Employment Status by Age in Siglerville
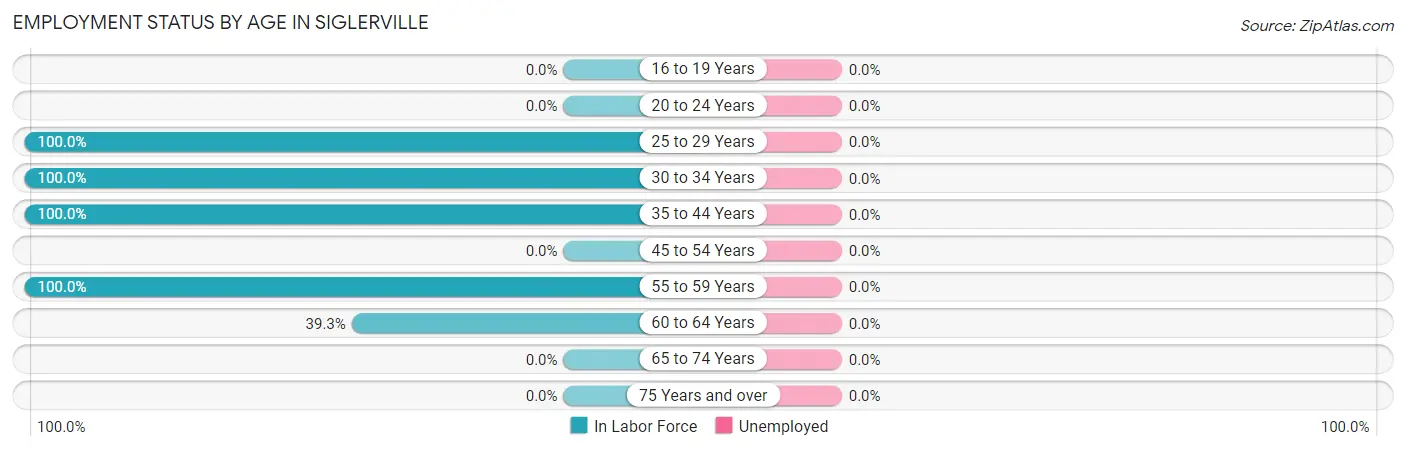
| Age Bracket | In Labor Force | Unemployed |
| 16 to 19 Years | 0 (0.0%) | 0 (0.0%) |
| 20 to 24 Years | 0 (0.0%) | 0 (0.0%) |
| 25 to 29 Years | 12 (100.0%) | 0 (0.0%) |
| 30 to 34 Years | 17 (100.0%) | 0 (0.0%) |
| 35 to 44 Years | 12 (100.0%) | 0 (0.0%) |
| 45 to 54 Years | 0 (0.0%) | 0 (0.0%) |
| 55 to 59 Years | 23 (100.0%) | 0 (0.0%) |
| 60 to 64 Years | 24 (39.3%) | 0 (0.0%) |
| 65 to 74 Years | 0 (0.0%) | 0 (0.0%) |
| 75 Years and over | 0 (0.0%) | 0 (0.0%) |
| Total | 88 (54.0%) | 0 (0.0%) |
Employment Status by Educational Attainment in Siglerville
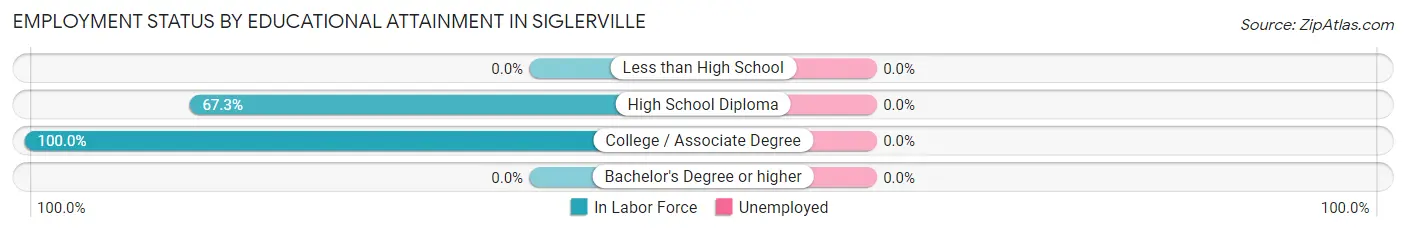
| Educational Attainment | In Labor Force | Unemployed |
| Less than High School | 0 (0.0%) | 0 (0.0%) |
| High School Diploma | 76 (67.3%) | 0 (0.0%) |
| College / Associate Degree | 12 (100.0%) | 0 (0.0%) |
| Bachelor's Degree or higher | 0 (0.0%) | 0 (0.0%) |
| Total | 88 (70.4%) | 0 (0.0%) |
Employment Occupations by Sex in Siglerville
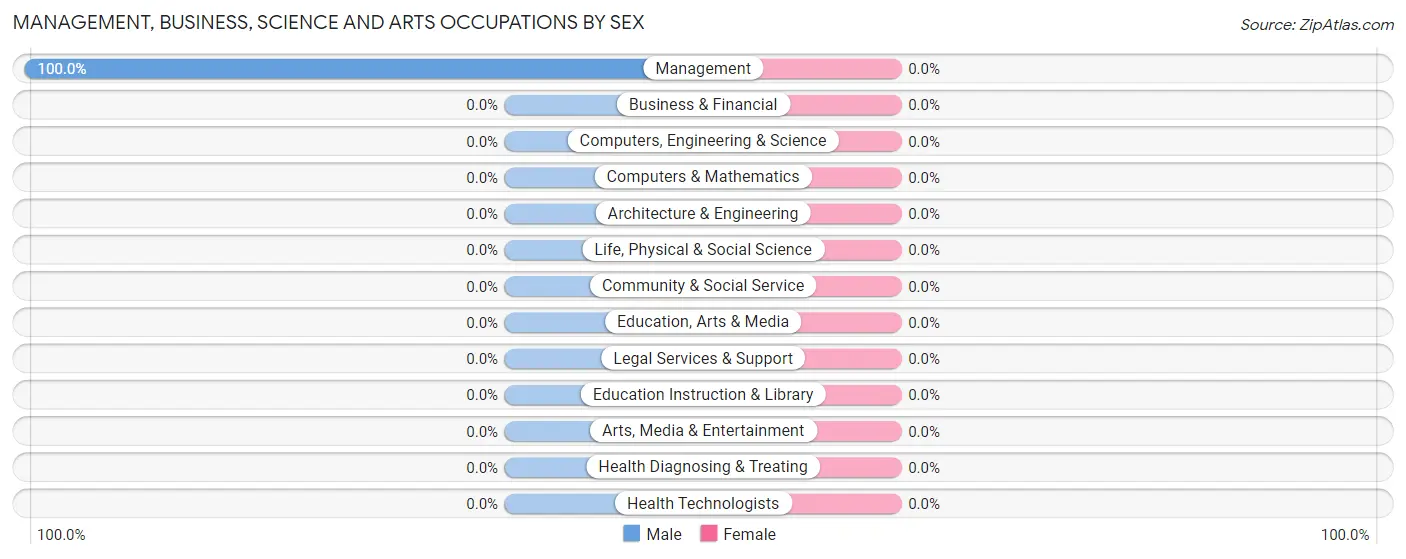
Management, Business, Science and Arts Occupations
The most common Management, Business, Science and Arts occupations in Siglerville are , and Management (23 | 26.1%).
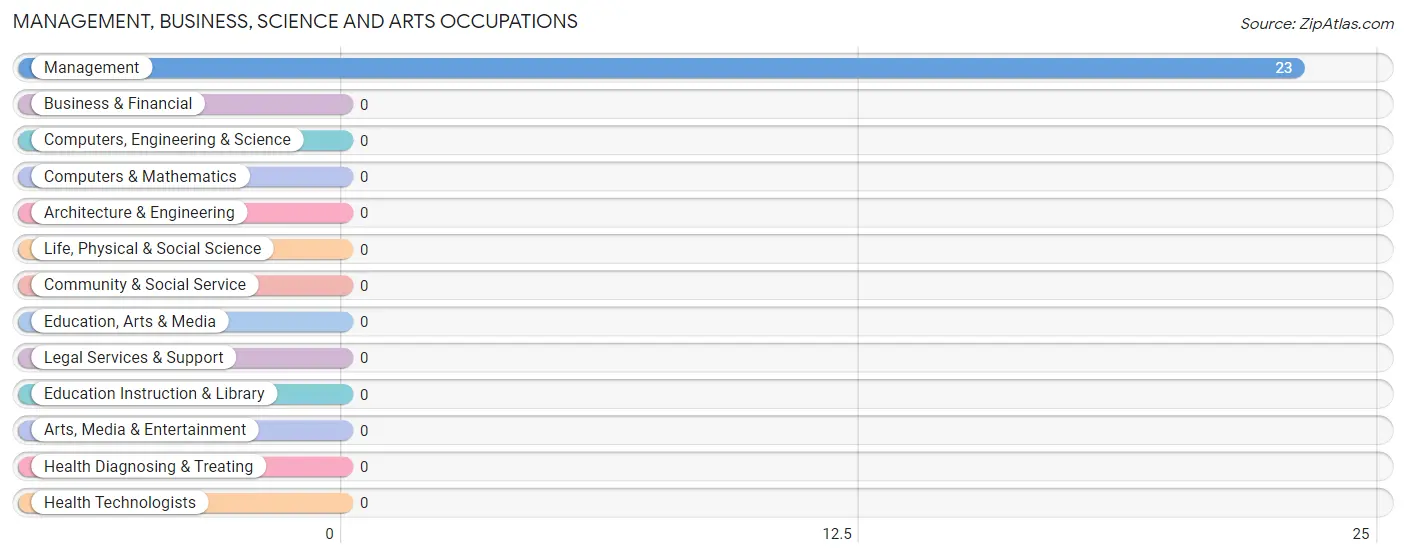
Management, Business, Science and Arts Occupations by Sex
| Occupation | Male | Female |
| Management | 23 (100.0%) | 0 (0.0%) |
| Business & Financial | 0 (0.0%) | 0 (0.0%) |
| Computers, Engineering & Science | 0 (0.0%) | 0 (0.0%) |
| Computers & Mathematics | 0 (0.0%) | 0 (0.0%) |
| Architecture & Engineering | 0 (0.0%) | 0 (0.0%) |
| Life, Physical & Social Science | 0 (0.0%) | 0 (0.0%) |
| Community & Social Service | 0 (0.0%) | 0 (0.0%) |
| Education, Arts & Media | 0 (0.0%) | 0 (0.0%) |
| Legal Services & Support | 0 (0.0%) | 0 (0.0%) |
| Education Instruction & Library | 0 (0.0%) | 0 (0.0%) |
| Arts, Media & Entertainment | 0 (0.0%) | 0 (0.0%) |
| Health Diagnosing & Treating | 0 (0.0%) | 0 (0.0%) |
| Health Technologists | 0 (0.0%) | 0 (0.0%) |
| Total (Category) | 23 (100.0%) | 0 (0.0%) |
| Total (Overall) | 56 (63.6%) | 32 (36.4%) |
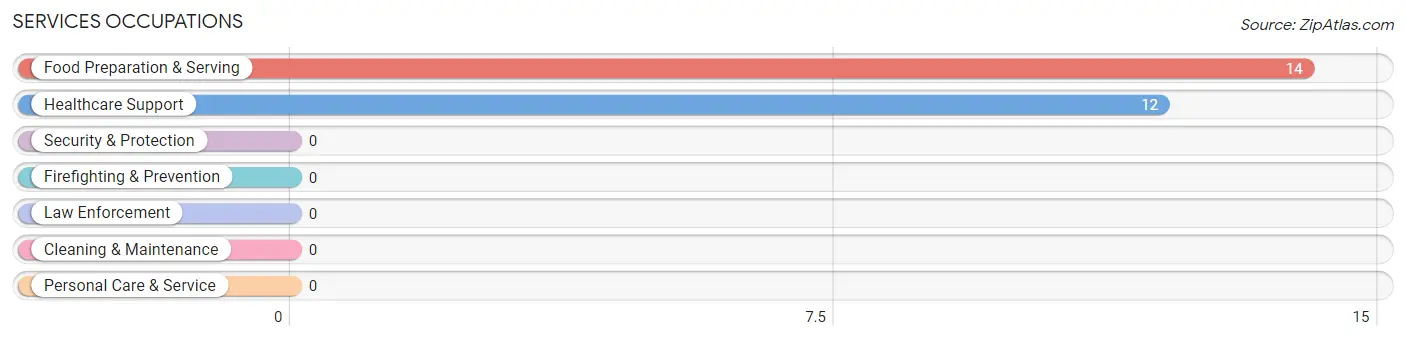
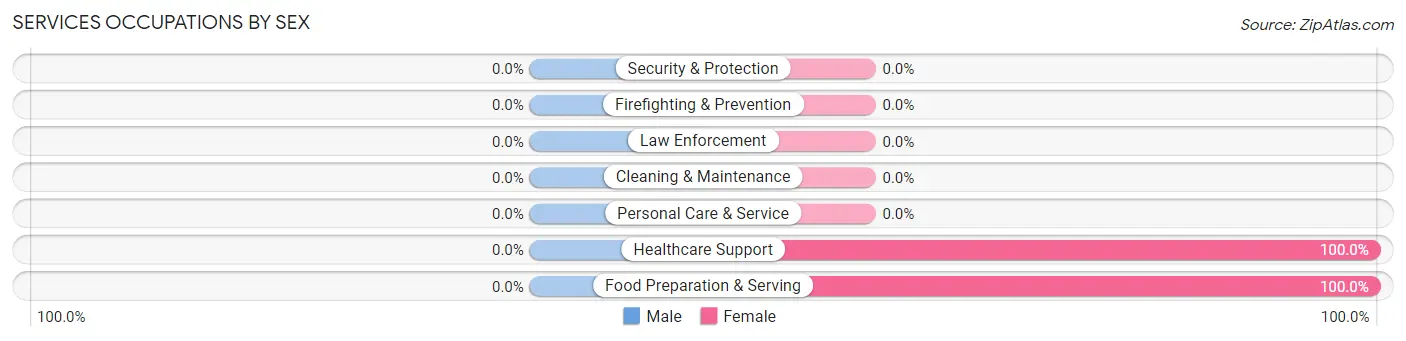
Services Occupations
The most common Services occupations in Siglerville are Food Preparation & Serving (14 | 15.9%), and Healthcare Support (12 | 13.6%).
Services Occupations by Sex
| Occupation | Male | Female |
| Healthcare Support | 0 (0.0%) | 12 (100.0%) |
| Security & Protection | 0 (0.0%) | 0 (0.0%) |
| Firefighting & Prevention | 0 (0.0%) | 0 (0.0%) |
| Law Enforcement | 0 (0.0%) | 0 (0.0%) |
| Food Preparation & Serving | 0 (0.0%) | 14 (100.0%) |
| Cleaning & Maintenance | 0 (0.0%) | 0 (0.0%) |
| Personal Care & Service | 0 (0.0%) | 0 (0.0%) |
| Total (Category) | 0 (0.0%) | 26 (100.0%) |
| Total (Overall) | 56 (63.6%) | 32 (36.4%) |
Sales and Office Occupations
The most common Sales and Office occupations in Siglerville are , and Office & Administration (33 | 37.5%).
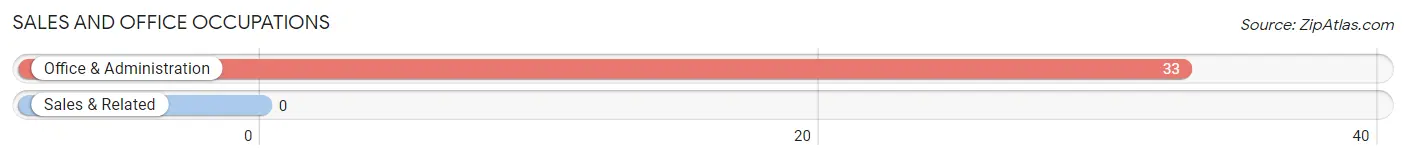
Sales and Office Occupations by Sex

| Occupation | Male | Female |
| Sales & Related | 0 (0.0%) | 0 (0.0%) |
| Office & Administration | 27 (81.8%) | 6 (18.2%) |
| Total (Category) | 27 (81.8%) | 6 (18.2%) |
| Total (Overall) | 56 (63.6%) | 32 (36.4%) |
Natural Resources, Construction and Maintenance Occupations
The most common Natural Resources, Construction and Maintenance occupations in Siglerville are , and Construction & Extraction (6 | 6.8%).

Natural Resources, Construction and Maintenance Occupations by Sex

| Occupation | Male | Female |
| Farming, Fishing & Forestry | 0 (0.0%) | 0 (0.0%) |
| Construction & Extraction | 6 (100.0%) | 0 (0.0%) |
| Installation, Maintenance & Repair | 0 (0.0%) | 0 (0.0%) |
| Total (Category) | 6 (100.0%) | 0 (0.0%) |
| Total (Overall) | 56 (63.6%) | 32 (36.4%) |
Production, Transportation and Moving Occupations
Production, Transportation and Moving Occupations by Sex
| Occupation | Male | Female |
| Production | 0 (0.0%) | 0 (0.0%) |
| Transportation | 0 (0.0%) | 0 (0.0%) |
| Material Moving | 0 (0.0%) | 0 (0.0%) |
| Total (Category) | 0 (0.0%) | 0 (0.0%) |
| Total (Overall) | 56 (63.6%) | 32 (36.4%) |
Employment Industries by Sex in Siglerville
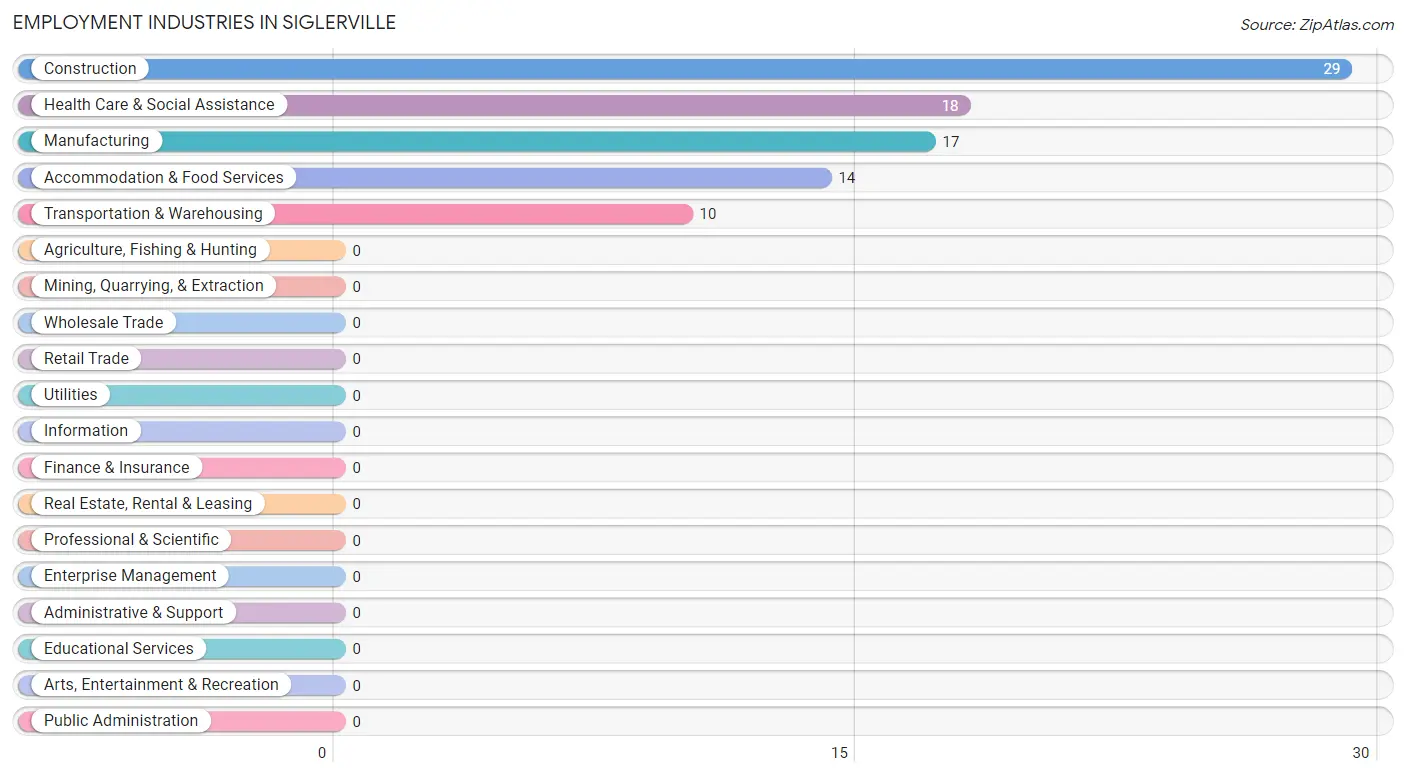
Employment Industries in Siglerville
The major employment industries in Siglerville include Construction (29 | 33.0%), Health Care & Social Assistance (18 | 20.4%), Manufacturing (17 | 19.3%), Accommodation & Food Services (14 | 15.9%), and Transportation & Warehousing (10 | 11.4%).
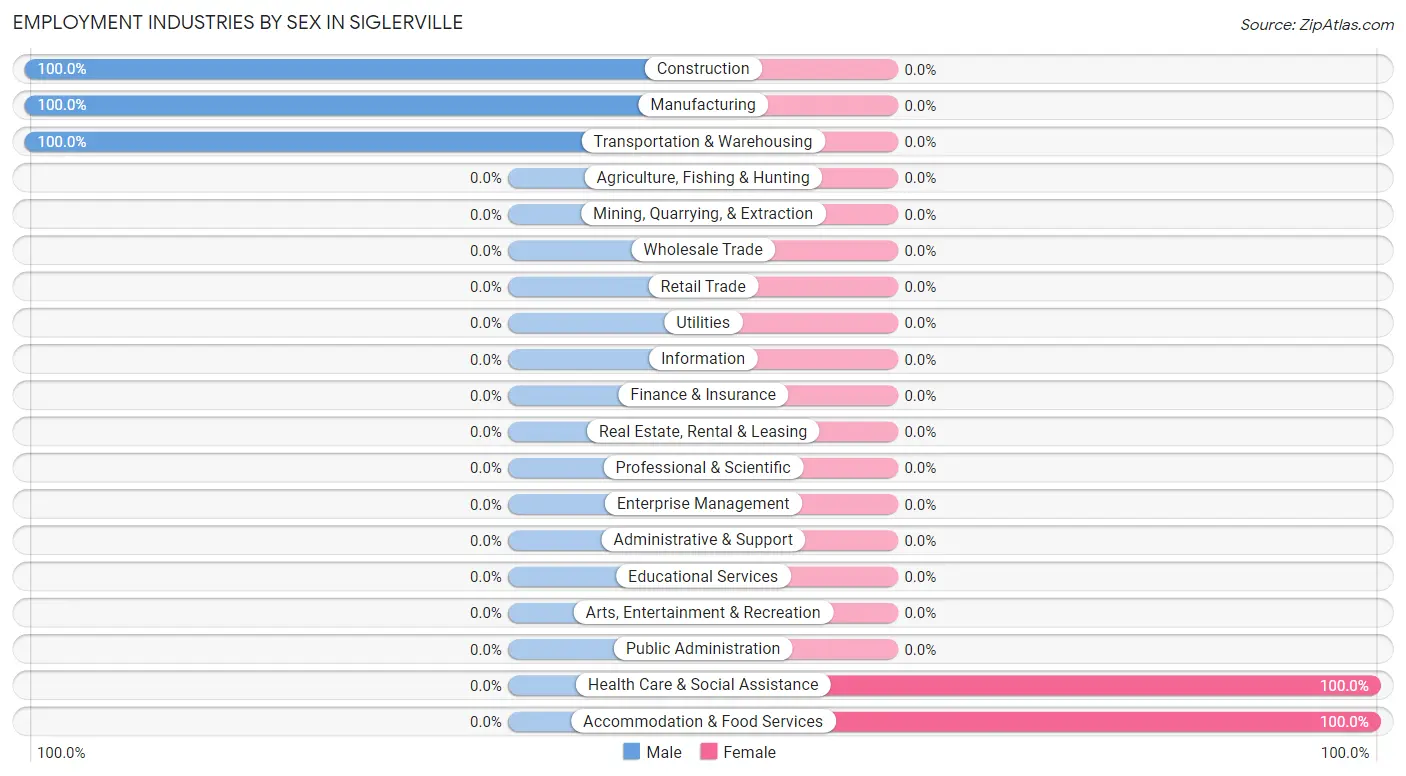
Employment Industries by Sex in Siglerville
The Siglerville industries that see more men than women are Construction (100.0%), Manufacturing (100.0%), and Transportation & Warehousing (100.0%), whereas the industries that tend to have a higher number of women are Health Care & Social Assistance (100.0%), and Accommodation & Food Services (100.0%).
| Industry | Male | Female |
| Agriculture, Fishing & Hunting | 0 (0.0%) | 0 (0.0%) |
| Mining, Quarrying, & Extraction | 0 (0.0%) | 0 (0.0%) |
| Construction | 29 (100.0%) | 0 (0.0%) |
| Manufacturing | 17 (100.0%) | 0 (0.0%) |
| Wholesale Trade | 0 (0.0%) | 0 (0.0%) |
| Retail Trade | 0 (0.0%) | 0 (0.0%) |
| Transportation & Warehousing | 10 (100.0%) | 0 (0.0%) |
| Utilities | 0 (0.0%) | 0 (0.0%) |
| Information | 0 (0.0%) | 0 (0.0%) |
| Finance & Insurance | 0 (0.0%) | 0 (0.0%) |
| Real Estate, Rental & Leasing | 0 (0.0%) | 0 (0.0%) |
| Professional & Scientific | 0 (0.0%) | 0 (0.0%) |
| Enterprise Management | 0 (0.0%) | 0 (0.0%) |
| Administrative & Support | 0 (0.0%) | 0 (0.0%) |
| Educational Services | 0 (0.0%) | 0 (0.0%) |
| Health Care & Social Assistance | 0 (0.0%) | 18 (100.0%) |
| Arts, Entertainment & Recreation | 0 (0.0%) | 0 (0.0%) |
| Accommodation & Food Services | 0 (0.0%) | 14 (100.0%) |
| Public Administration | 0 (0.0%) | 0 (0.0%) |
| Total | 56 (63.6%) | 32 (36.4%) |
Education in Siglerville
School Enrollment in Siglerville
The most common levels of schooling among the 27 students in Siglerville are high school (14 | 51.8%), and middle school (13 | 48.1%).
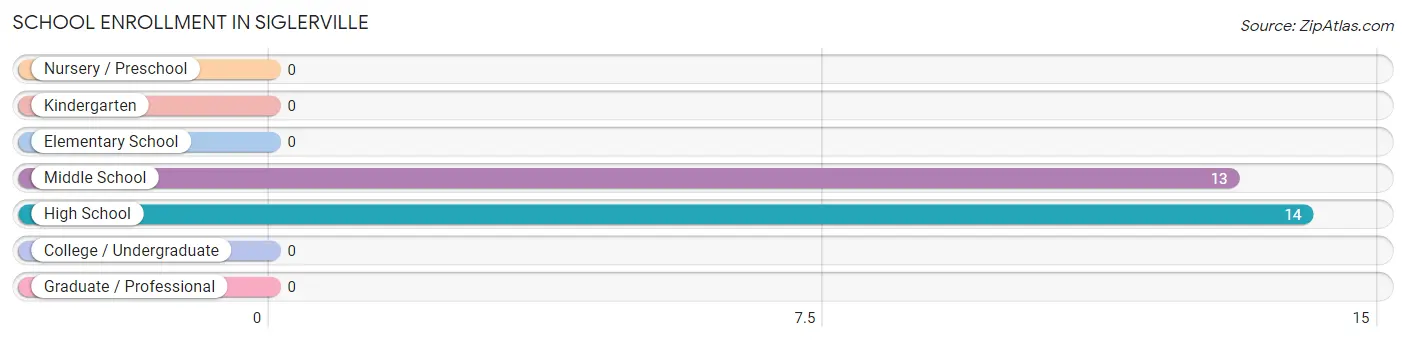
| School Level | # Students | % Students |
| Nursery / Preschool | 0 | 0.0% |
| Kindergarten | 0 | 0.0% |
| Elementary School | 0 | 0.0% |
| Middle School | 13 | 48.1% |
| High School | 14 | 51.8% |
| College / Undergraduate | 0 | 0.0% |
| Graduate / Professional | 0 | 0.0% |
| Total | 27 | 100.0% |
School Enrollment by Age by Funding Source in Siglerville
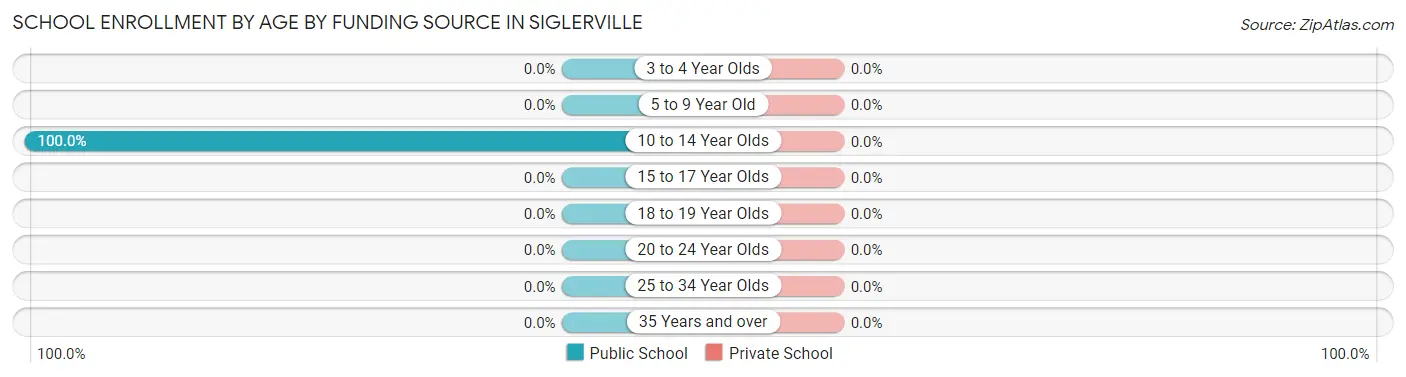
| Age Bracket | Public School | Private School |
| 3 to 4 Year Olds | 0 (0.0%) | 0 (0.0%) |
| 5 to 9 Year Old | 0 (0.0%) | 0 (0.0%) |
| 10 to 14 Year Olds | 27 (100.0%) | 0 (0.0%) |
| 15 to 17 Year Olds | 0 (0.0%) | 0 (0.0%) |
| 18 to 19 Year Olds | 0 (0.0%) | 0 (0.0%) |
| 20 to 24 Year Olds | 0 (0.0%) | 0 (0.0%) |
| 25 to 34 Year Olds | 0 (0.0%) | 0 (0.0%) |
| 35 Years and over | 0 (0.0%) | 0 (0.0%) |
| Total | 27 (100.0%) | 0 (0.0%) |
Educational Attainment by Field of Study in Siglerville
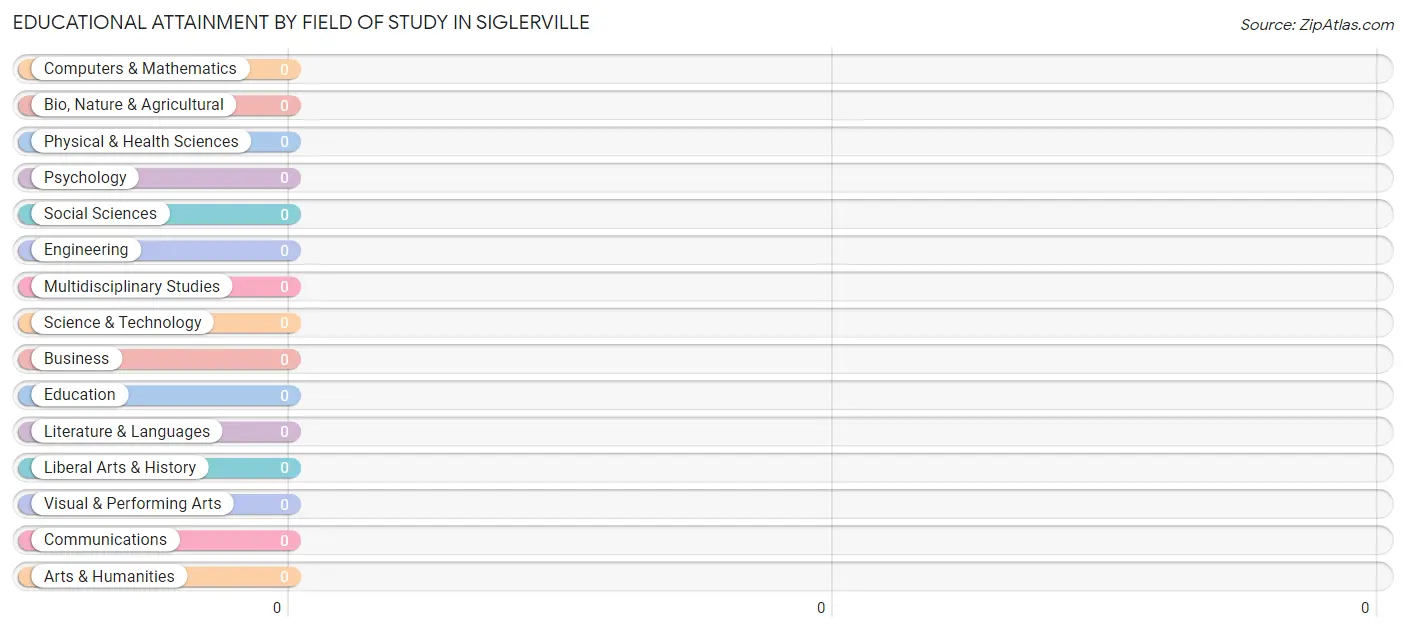
| Field of Study | # Graduates | % Graduates |
| Computers & Mathematics | 0 | 0.0% |
| Bio, Nature & Agricultural | 0 | 0.0% |
| Physical & Health Sciences | 0 | 0.0% |
| Psychology | 0 | 0.0% |
| Social Sciences | 0 | 0.0% |
| Engineering | 0 | 0.0% |
| Multidisciplinary Studies | 0 | 0.0% |
| Science & Technology | 0 | 0.0% |
| Business | 0 | 0.0% |
| Education | 0 | 0.0% |
| Literature & Languages | 0 | 0.0% |
| Liberal Arts & History | 0 | 0.0% |
| Visual & Performing Arts | 0 | 0.0% |
| Communications | 0 | 0.0% |
| Arts & Humanities | 0 | 0.0% |
| Total | 0 | 0.0% |
Transportation & Commute in Siglerville
Vehicle Availability by Sex in Siglerville
The most prevalent vehicle ownership categories in Siglerville are males with 2 vehicles (40, accounting for 71.4%) and females with 2 vehicles (26, making up 125.0%).
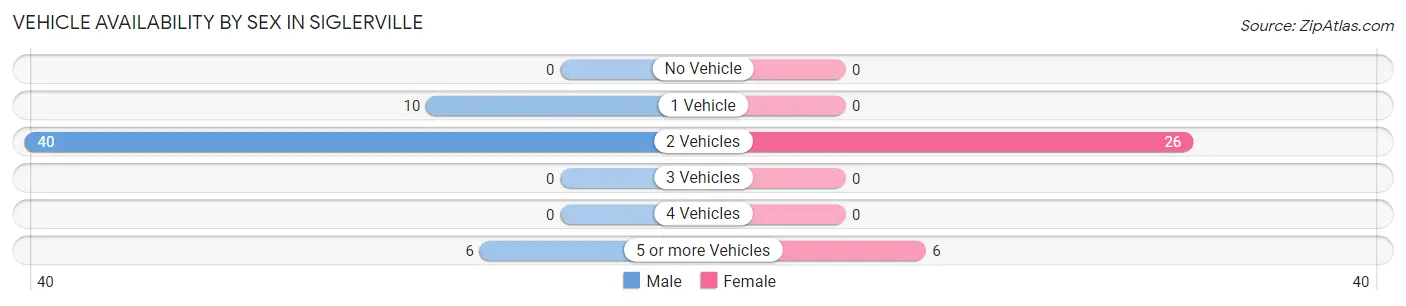
| Vehicles Available | Male | Female |
| No Vehicle | 0 (0.0%) | 0 (0.0%) |
| 1 Vehicle | 10 (17.9%) | 0 (0.0%) |
| 2 Vehicles | 40 (71.4%) | 26 (81.2%) |
| 3 Vehicles | 0 (0.0%) | 0 (0.0%) |
| 4 Vehicles | 0 (0.0%) | 0 (0.0%) |
| 5 or more Vehicles | 6 (10.7%) | 6 (18.8%) |
| Total | 56 (100.0%) | 32 (100.0%) |
Commute Time in Siglerville
The most frequently occuring commute durations in Siglerville are 20 to 24 minutes (35 commuters, 39.8%), 60 to 89 minutes (23 commuters, 26.1%), and 10 to 14 minutes (14 commuters, 15.9%).
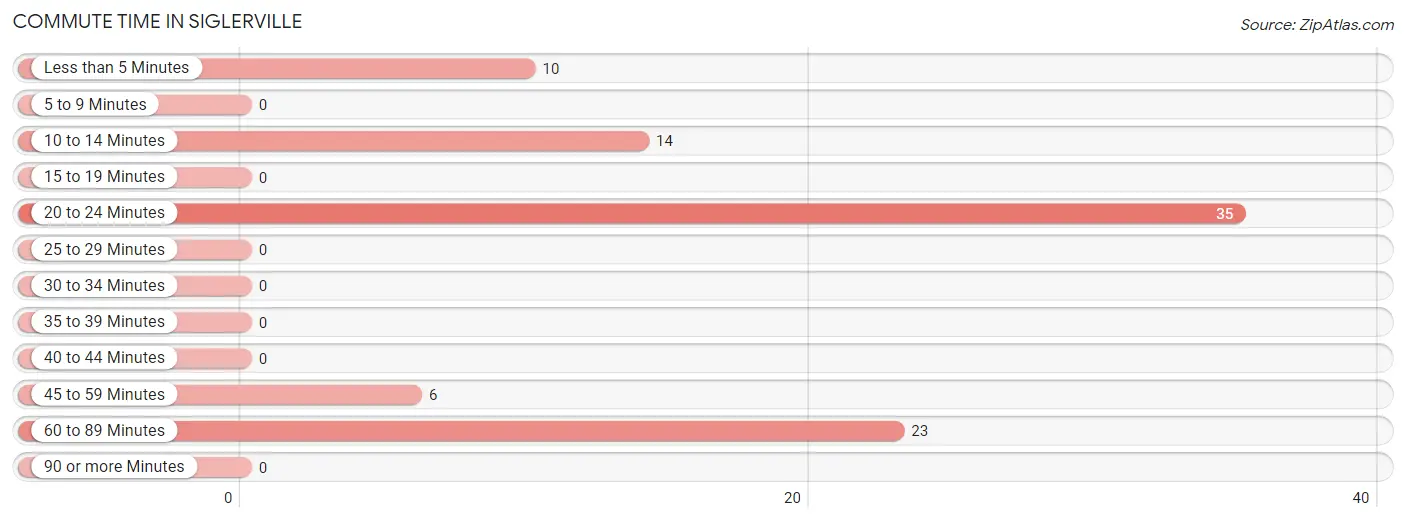
| Commute Time | # Commuters | % Commuters |
| Less than 5 Minutes | 10 | 11.4% |
| 5 to 9 Minutes | 0 | 0.0% |
| 10 to 14 Minutes | 14 | 15.9% |
| 15 to 19 Minutes | 0 | 0.0% |
| 20 to 24 Minutes | 35 | 39.8% |
| 25 to 29 Minutes | 0 | 0.0% |
| 30 to 34 Minutes | 0 | 0.0% |
| 35 to 39 Minutes | 0 | 0.0% |
| 40 to 44 Minutes | 0 | 0.0% |
| 45 to 59 Minutes | 6 | 6.8% |
| 60 to 89 Minutes | 23 | 26.1% |
| 90 or more Minutes | 0 | 0.0% |
Commute Time by Sex in Siglerville
The most common commute times in Siglerville are 60 to 89 minutes (23 commuters, 41.1%) for males and 20 to 24 minutes (18 commuters, 56.2%) for females.
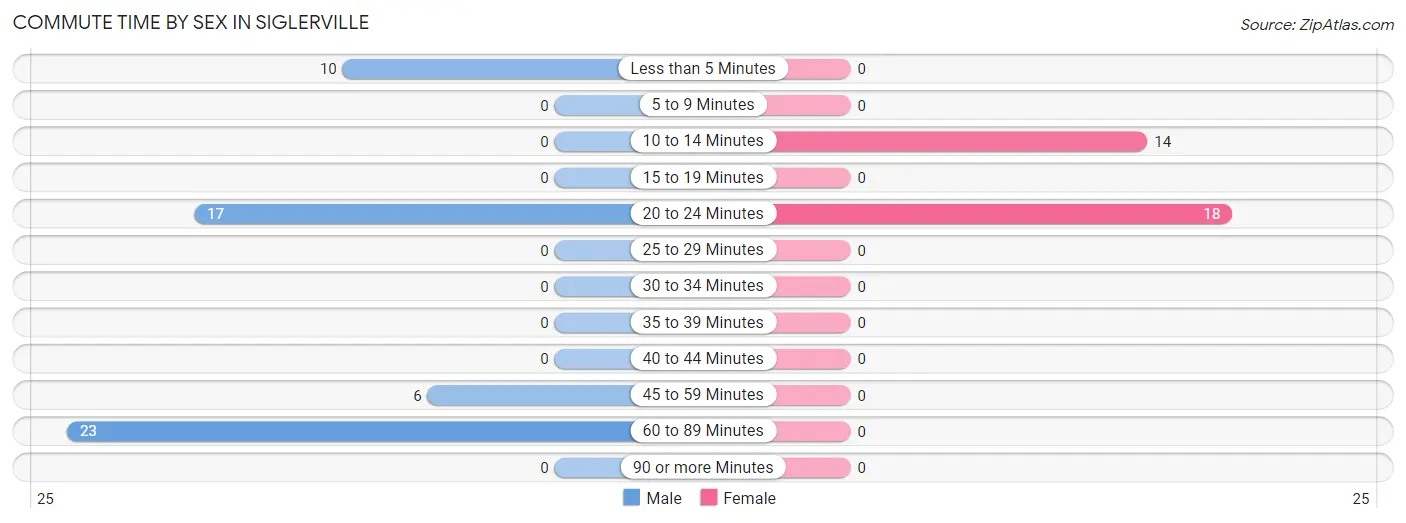
| Commute Time | Male | Female |
| Less than 5 Minutes | 10 (17.9%) | 0 (0.0%) |
| 5 to 9 Minutes | 0 (0.0%) | 0 (0.0%) |
| 10 to 14 Minutes | 0 (0.0%) | 14 (43.8%) |
| 15 to 19 Minutes | 0 (0.0%) | 0 (0.0%) |
| 20 to 24 Minutes | 17 (30.4%) | 18 (56.2%) |
| 25 to 29 Minutes | 0 (0.0%) | 0 (0.0%) |
| 30 to 34 Minutes | 0 (0.0%) | 0 (0.0%) |
| 35 to 39 Minutes | 0 (0.0%) | 0 (0.0%) |
| 40 to 44 Minutes | 0 (0.0%) | 0 (0.0%) |
| 45 to 59 Minutes | 6 (10.7%) | 0 (0.0%) |
| 60 to 89 Minutes | 23 (41.1%) | 0 (0.0%) |
| 90 or more Minutes | 0 (0.0%) | 0 (0.0%) |
Time of Departure to Work by Sex in Siglerville
The most frequent times of departure to work in Siglerville are 6:00 AM to 6:29 AM (40, 71.4%) for males and 7:00 AM to 7:29 AM (18, 56.2%) for females.
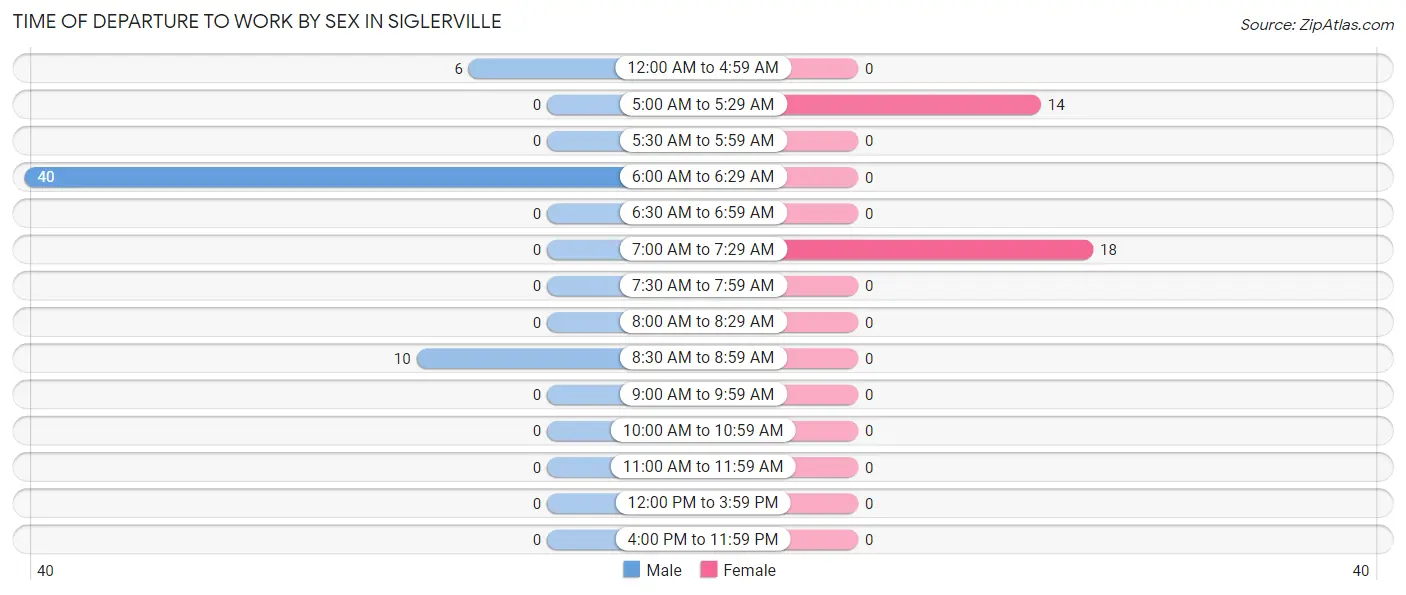
| Time of Departure | Male | Female |
| 12:00 AM to 4:59 AM | 6 (10.7%) | 0 (0.0%) |
| 5:00 AM to 5:29 AM | 0 (0.0%) | 14 (43.8%) |
| 5:30 AM to 5:59 AM | 0 (0.0%) | 0 (0.0%) |
| 6:00 AM to 6:29 AM | 40 (71.4%) | 0 (0.0%) |
| 6:30 AM to 6:59 AM | 0 (0.0%) | 0 (0.0%) |
| 7:00 AM to 7:29 AM | 0 (0.0%) | 18 (56.2%) |
| 7:30 AM to 7:59 AM | 0 (0.0%) | 0 (0.0%) |
| 8:00 AM to 8:29 AM | 0 (0.0%) | 0 (0.0%) |
| 8:30 AM to 8:59 AM | 10 (17.9%) | 0 (0.0%) |
| 9:00 AM to 9:59 AM | 0 (0.0%) | 0 (0.0%) |
| 10:00 AM to 10:59 AM | 0 (0.0%) | 0 (0.0%) |
| 11:00 AM to 11:59 AM | 0 (0.0%) | 0 (0.0%) |
| 12:00 PM to 3:59 PM | 0 (0.0%) | 0 (0.0%) |
| 4:00 PM to 11:59 PM | 0 (0.0%) | 0 (0.0%) |
| Total | 56 (100.0%) | 32 (100.0%) |
Housing Occupancy in Siglerville
Occupancy by Ownership in Siglerville
Of the total 98 dwellings in Siglerville, owner-occupied units account for 81 (82.7%), while renter-occupied units make up 17 (17.3%).
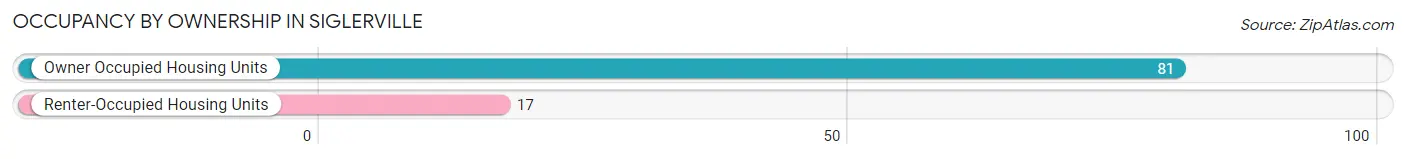
| Occupancy | # Housing Units | % Housing Units |
| Owner Occupied Housing Units | 81 | 82.7% |
| Renter-Occupied Housing Units | 17 | 17.3% |
| Total Occupied Housing Units | 98 | 100.0% |
Occupancy by Household Size in Siglerville
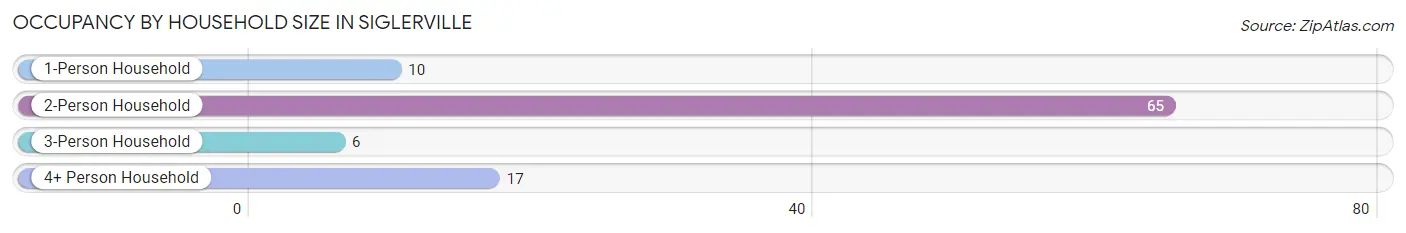
| Household Size | # Housing Units | % Housing Units |
| 1-Person Household | 10 | 10.2% |
| 2-Person Household | 65 | 66.3% |
| 3-Person Household | 6 | 6.1% |
| 4+ Person Household | 17 | 17.3% |
| Total Housing Units | 98 | 100.0% |
Occupancy by Ownership by Household Size in Siglerville
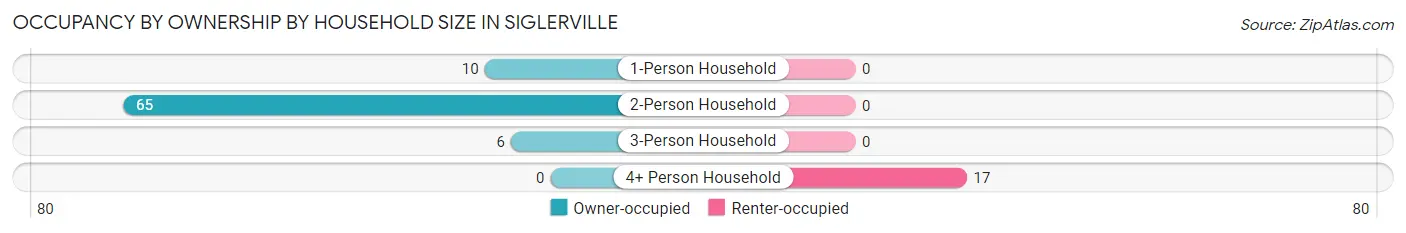
| Household Size | Owner-occupied | Renter-occupied |
| 1-Person Household | 10 (100.0%) | 0 (0.0%) |
| 2-Person Household | 65 (100.0%) | 0 (0.0%) |
| 3-Person Household | 6 (100.0%) | 0 (0.0%) |
| 4+ Person Household | 0 (0.0%) | 17 (100.0%) |
| Total Housing Units | 81 (82.7%) | 17 (17.3%) |
Occupancy by Educational Attainment in Siglerville
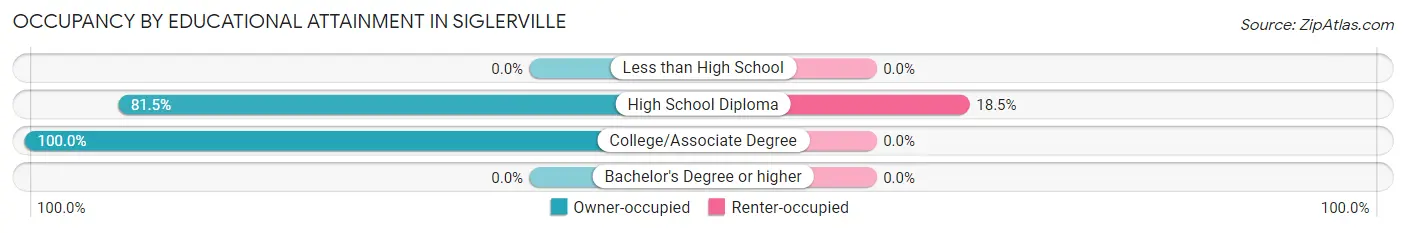
| Household Size | Owner-occupied | Renter-occupied |
| Less than High School | 0 (0.0%) | 0 (0.0%) |
| High School Diploma | 75 (81.5%) | 17 (18.5%) |
| College/Associate Degree | 6 (100.0%) | 0 (0.0%) |
| Bachelor's Degree or higher | 0 (0.0%) | 0 (0.0%) |
Occupancy by Age of Householder in Siglerville
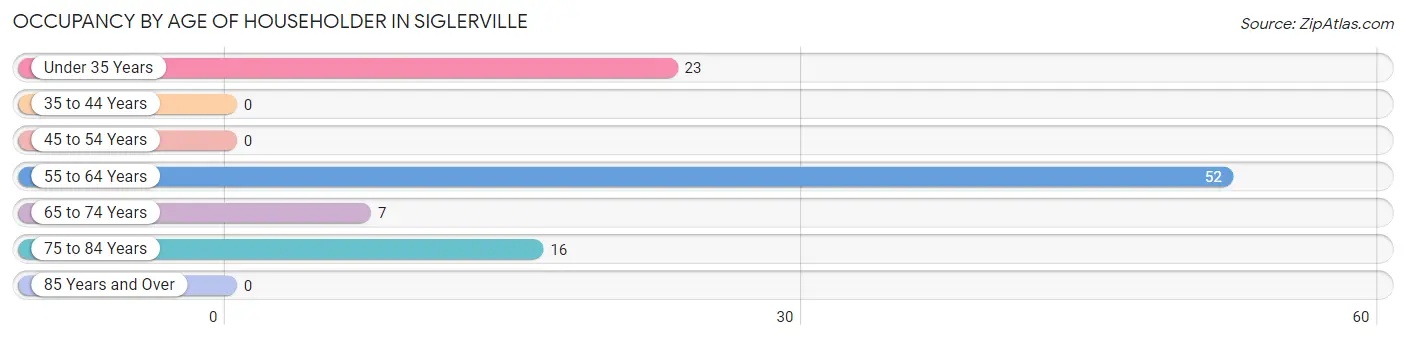
| Age Bracket | # Households | % Households |
| Under 35 Years | 23 | 23.5% |
| 35 to 44 Years | 0 | 0.0% |
| 45 to 54 Years | 0 | 0.0% |
| 55 to 64 Years | 52 | 53.1% |
| 65 to 74 Years | 7 | 7.1% |
| 75 to 84 Years | 16 | 16.3% |
| 85 Years and Over | 0 | 0.0% |
| Total | 98 | 100.0% |
Housing Finances in Siglerville
Median Income by Occupancy in Siglerville
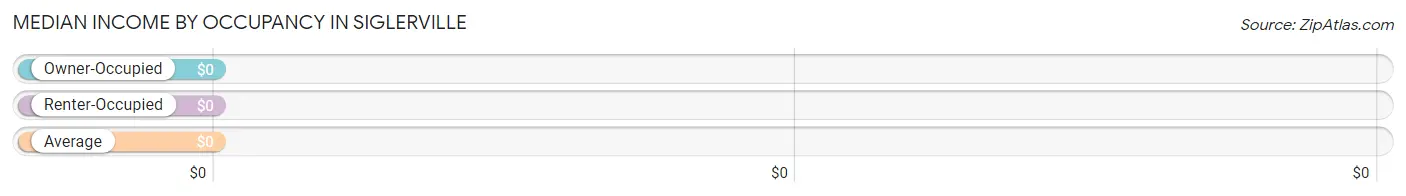
| Occupancy Type | # Households | Median Income |
| Owner-Occupied | 81 (82.7%) | $0 |
| Renter-Occupied | 17 (17.3%) | $0 |
| Average | 98 (100.0%) | $0 |
Occupancy by Householder Income Bracket in Siglerville
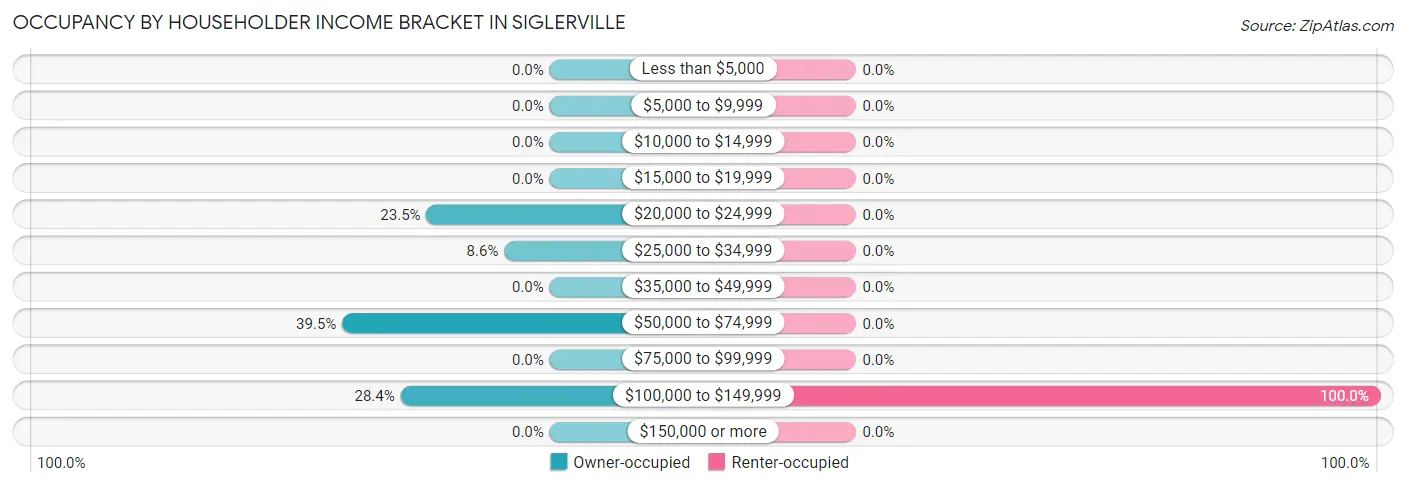
| Income Bracket | Owner-occupied | Renter-occupied |
| Less than $5,000 | 0 (0.0%) | 0 (0.0%) |
| $5,000 to $9,999 | 0 (0.0%) | 0 (0.0%) |
| $10,000 to $14,999 | 0 (0.0%) | 0 (0.0%) |
| $15,000 to $19,999 | 0 (0.0%) | 0 (0.0%) |
| $20,000 to $24,999 | 19 (23.5%) | 0 (0.0%) |
| $25,000 to $34,999 | 7 (8.6%) | 0 (0.0%) |
| $35,000 to $49,999 | 0 (0.0%) | 0 (0.0%) |
| $50,000 to $74,999 | 32 (39.5%) | 0 (0.0%) |
| $75,000 to $99,999 | 0 (0.0%) | 0 (0.0%) |
| $100,000 to $149,999 | 23 (28.4%) | 17 (100.0%) |
| $150,000 or more | 0 (0.0%) | 0 (0.0%) |
| Total | 81 (100.0%) | 17 (100.0%) |
Monthly Housing Cost Tiers in Siglerville
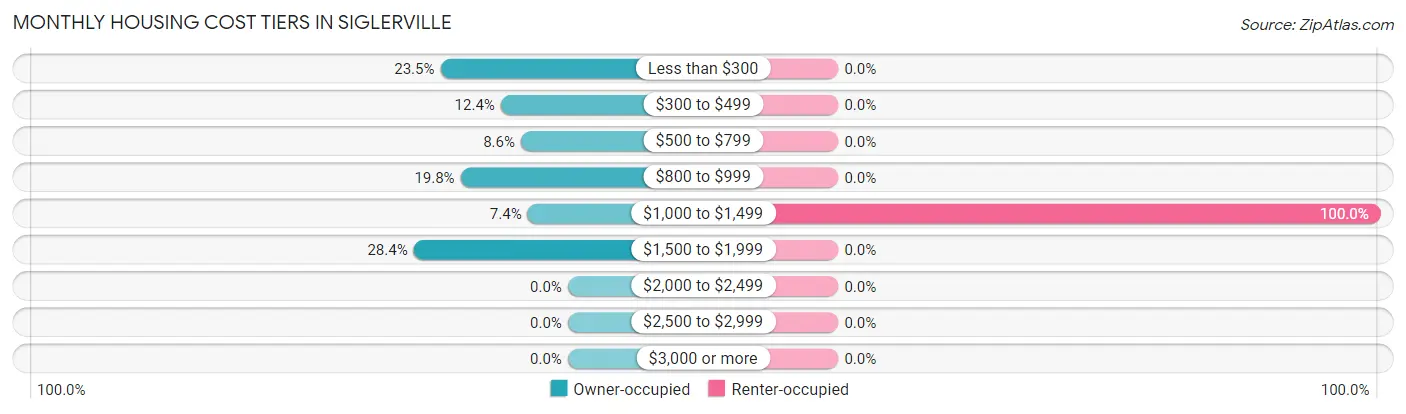
| Monthly Cost | Owner-occupied | Renter-occupied |
| Less than $300 | 19 (23.5%) | 0 (0.0%) |
| $300 to $499 | 10 (12.3%) | 0 (0.0%) |
| $500 to $799 | 7 (8.6%) | 0 (0.0%) |
| $800 to $999 | 16 (19.8%) | 0 (0.0%) |
| $1,000 to $1,499 | 6 (7.4%) | 17 (100.0%) |
| $1,500 to $1,999 | 23 (28.4%) | 0 (0.0%) |
| $2,000 to $2,499 | 0 (0.0%) | 0 (0.0%) |
| $2,500 to $2,999 | 0 (0.0%) | 0 (0.0%) |
| $3,000 or more | 0 (0.0%) | 0 (0.0%) |
| Total | 81 (100.0%) | 17 (100.0%) |
Physical Housing Characteristics in Siglerville
Housing Structures in Siglerville
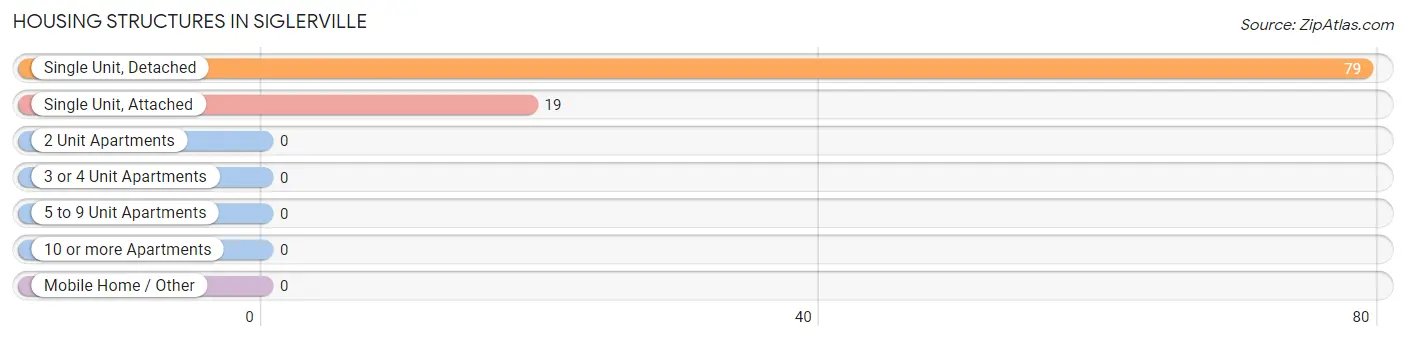
| Structure Type | # Housing Units | % Housing Units |
| Single Unit, Detached | 79 | 80.6% |
| Single Unit, Attached | 19 | 19.4% |
| 2 Unit Apartments | 0 | 0.0% |
| 3 or 4 Unit Apartments | 0 | 0.0% |
| 5 to 9 Unit Apartments | 0 | 0.0% |
| 10 or more Apartments | 0 | 0.0% |
| Mobile Home / Other | 0 | 0.0% |
| Total | 98 | 100.0% |
Housing Structures by Occupancy in Siglerville
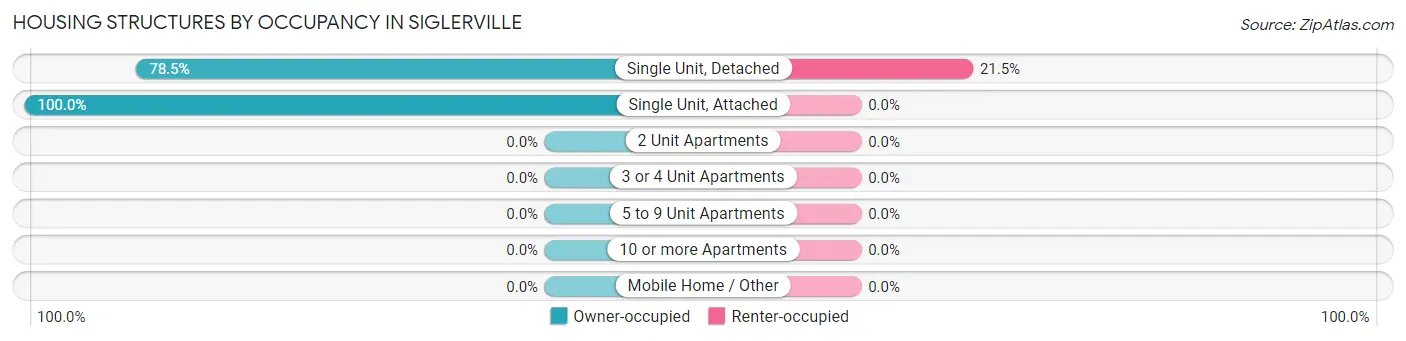
| Structure Type | Owner-occupied | Renter-occupied |
| Single Unit, Detached | 62 (78.5%) | 17 (21.5%) |
| Single Unit, Attached | 19 (100.0%) | 0 (0.0%) |
| 2 Unit Apartments | 0 (0.0%) | 0 (0.0%) |
| 3 or 4 Unit Apartments | 0 (0.0%) | 0 (0.0%) |
| 5 to 9 Unit Apartments | 0 (0.0%) | 0 (0.0%) |
| 10 or more Apartments | 0 (0.0%) | 0 (0.0%) |
| Mobile Home / Other | 0 (0.0%) | 0 (0.0%) |
| Total | 81 (82.7%) | 17 (17.3%) |
Housing Structures by Number of Rooms in Siglerville
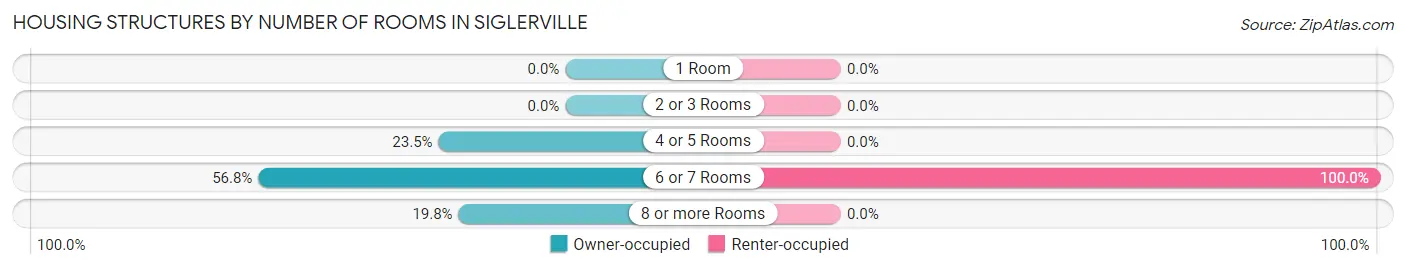
| Number of Rooms | Owner-occupied | Renter-occupied |
| 1 Room | 0 (0.0%) | 0 (0.0%) |
| 2 or 3 Rooms | 0 (0.0%) | 0 (0.0%) |
| 4 or 5 Rooms | 19 (23.5%) | 0 (0.0%) |
| 6 or 7 Rooms | 46 (56.8%) | 17 (100.0%) |
| 8 or more Rooms | 16 (19.8%) | 0 (0.0%) |
| Total | 81 (100.0%) | 17 (100.0%) |
Housing Structure by Heating Type in Siglerville
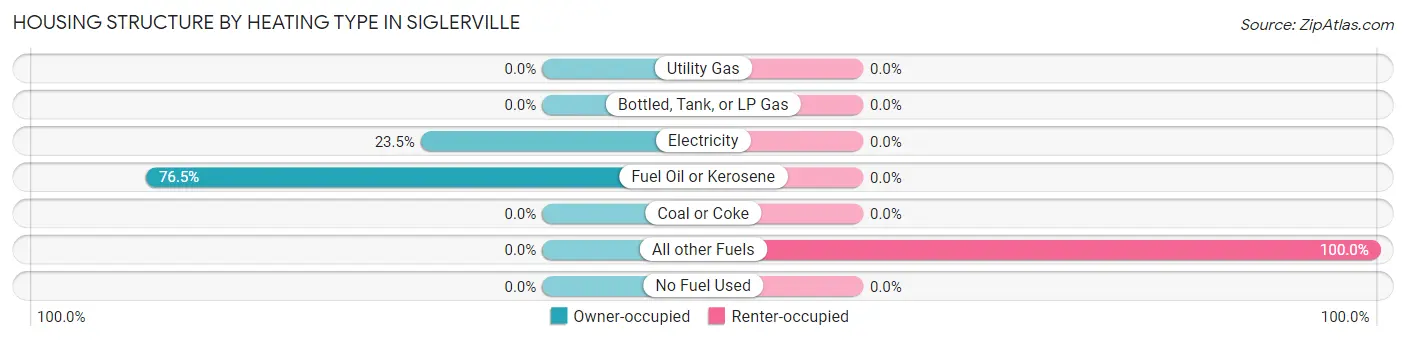
| Heating Type | Owner-occupied | Renter-occupied |
| Utility Gas | 0 (0.0%) | 0 (0.0%) |
| Bottled, Tank, or LP Gas | 0 (0.0%) | 0 (0.0%) |
| Electricity | 19 (23.5%) | 0 (0.0%) |
| Fuel Oil or Kerosene | 62 (76.5%) | 0 (0.0%) |
| Coal or Coke | 0 (0.0%) | 0 (0.0%) |
| All other Fuels | 0 (0.0%) | 17 (100.0%) |
| No Fuel Used | 0 (0.0%) | 0 (0.0%) |
| Total | 81 (100.0%) | 17 (100.0%) |
Household Vehicle Usage in Siglerville
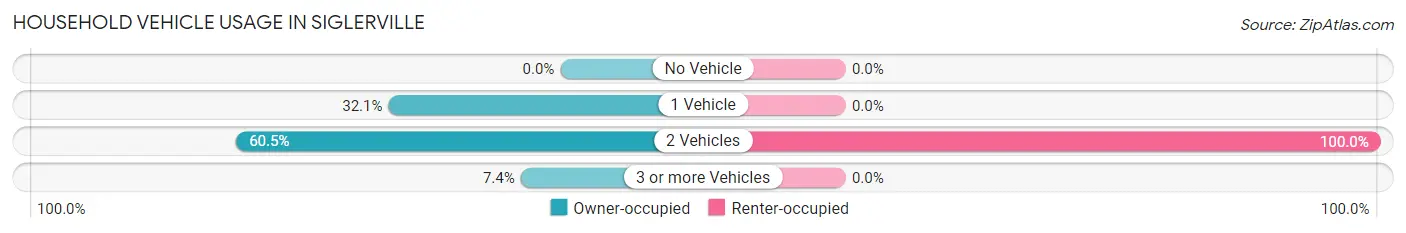
| Vehicles per Household | Owner-occupied | Renter-occupied |
| No Vehicle | 0 (0.0%) | 0 (0.0%) |
| 1 Vehicle | 26 (32.1%) | 0 (0.0%) |
| 2 Vehicles | 49 (60.5%) | 17 (100.0%) |
| 3 or more Vehicles | 6 (7.4%) | 0 (0.0%) |
| Total | 81 (100.0%) | 17 (100.0%) |
Real Estate & Mortgages in Siglerville
Real Estate and Mortgage Overview in Siglerville
| Characteristic | Without Mortgage | With Mortgage |
| Housing Units | 52 | 29 |
| Median Property Value | $223,700 | $0 |
| Median Household Income | - | - |
| Monthly Housing Costs | - | - |
| Real Estate Taxes | $1,350 | $0 |
Property Value by Mortgage Status in Siglerville
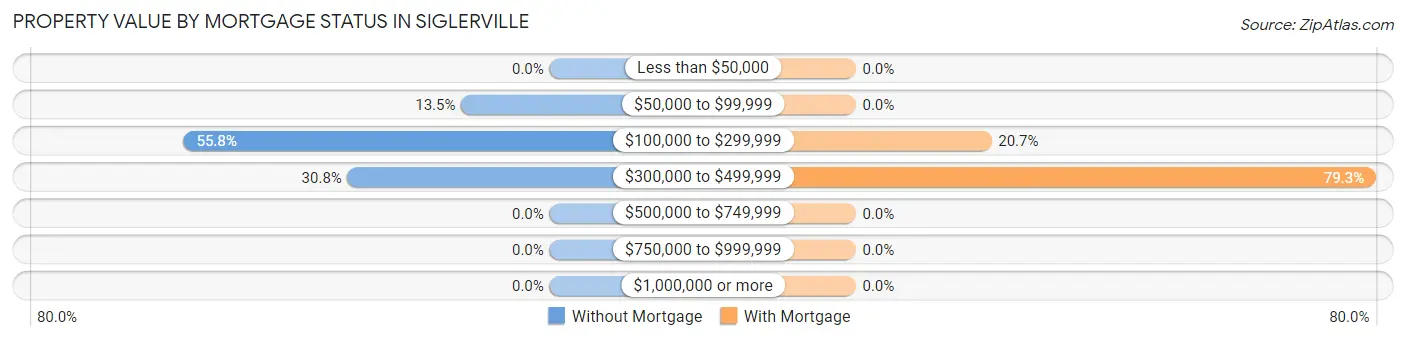
| Property Value | Without Mortgage | With Mortgage |
| Less than $50,000 | 0 (0.0%) | 0 (0.0%) |
| $50,000 to $99,999 | 7 (13.5%) | 0 (0.0%) |
| $100,000 to $299,999 | 29 (55.8%) | 6 (20.7%) |
| $300,000 to $499,999 | 16 (30.8%) | 23 (79.3%) |
| $500,000 to $749,999 | 0 (0.0%) | 0 (0.0%) |
| $750,000 to $999,999 | 0 (0.0%) | 0 (0.0%) |
| $1,000,000 or more | 0 (0.0%) | 0 (0.0%) |
| Total | 52 (100.0%) | 29 (100.0%) |
Household Income by Mortgage Status in Siglerville
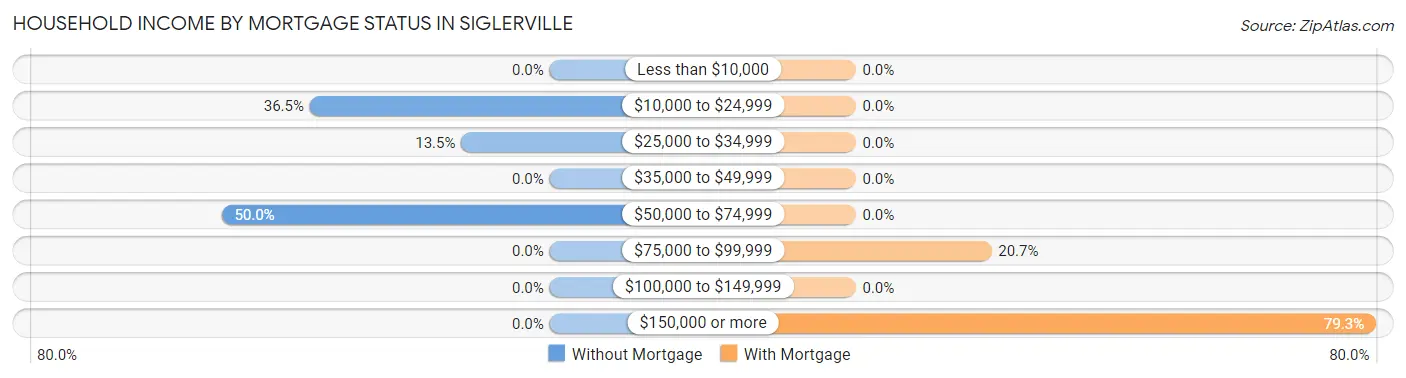
| Household Income | Without Mortgage | With Mortgage |
| Less than $10,000 | 0 (0.0%) | 0 (0.0%) |
| $10,000 to $24,999 | 19 (36.5%) | 0 (0.0%) |
| $25,000 to $34,999 | 7 (13.5%) | 0 (0.0%) |
| $35,000 to $49,999 | 0 (0.0%) | 0 (0.0%) |
| $50,000 to $74,999 | 26 (50.0%) | 0 (0.0%) |
| $75,000 to $99,999 | 0 (0.0%) | 6 (20.7%) |
| $100,000 to $149,999 | 0 (0.0%) | 0 (0.0%) |
| $150,000 or more | 0 (0.0%) | 23 (79.3%) |
| Total | 52 (100.0%) | 29 (100.0%) |
Property Value to Household Income Ratio in Siglerville
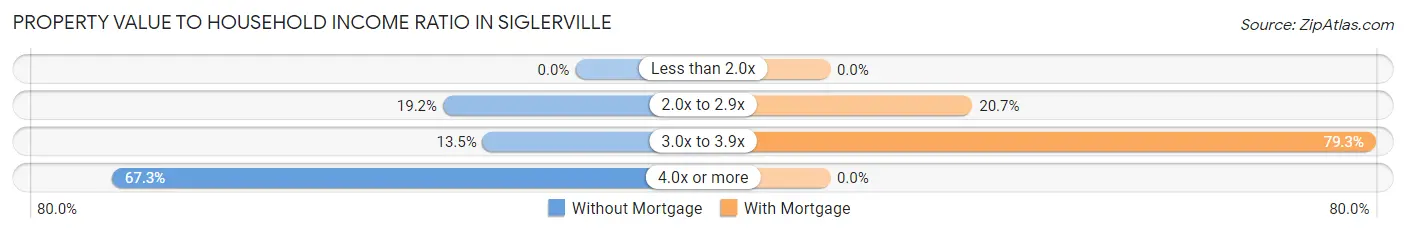
| Value-to-Income Ratio | Without Mortgage | With Mortgage |
| Less than 2.0x | 0 (0.0%) | 0 (0.0%) |
| 2.0x to 2.9x | 10 (19.2%) | 6 (20.7%) |
| 3.0x to 3.9x | 7 (13.5%) | 23 (79.3%) |
| 4.0x or more | 35 (67.3%) | 0 (0.0%) |
| Total | 52 (100.0%) | 29 (100.0%) |
Real Estate Taxes by Mortgage Status in Siglerville
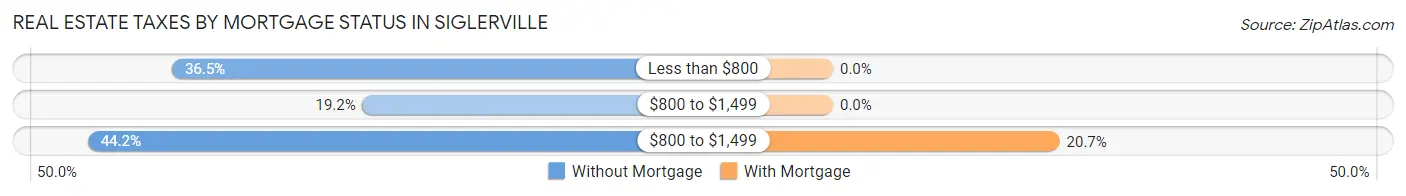
| Property Taxes | Without Mortgage | With Mortgage |
| Less than $800 | 19 (36.5%) | 0 (0.0%) |
| $800 to $1,499 | 10 (19.2%) | 0 (0.0%) |
| $800 to $1,499 | 23 (44.2%) | 6 (20.7%) |
| Total | 52 (100.0%) | 29 (100.0%) |
Health & Disability in Siglerville
Health Insurance Coverage by Age in Siglerville
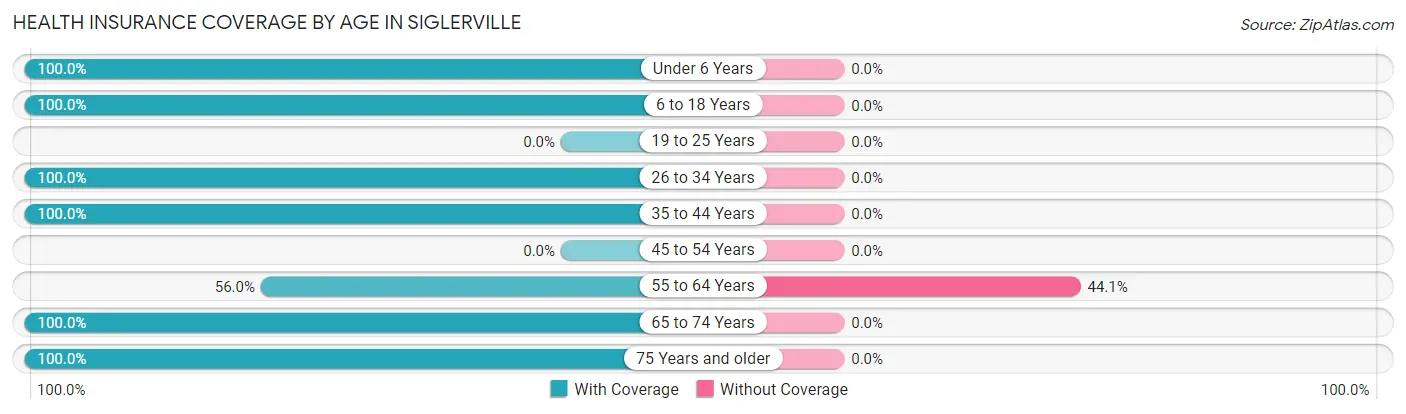
| Age Bracket | With Coverage | Without Coverage |
| Under 6 Years | 7 (100.0%) | 0 (0.0%) |
| 6 to 18 Years | 27 (100.0%) | 0 (0.0%) |
| 19 to 25 Years | 0 (0.0%) | 0 (0.0%) |
| 26 to 34 Years | 29 (100.0%) | 0 (0.0%) |
| 35 to 44 Years | 12 (100.0%) | 0 (0.0%) |
| 45 to 54 Years | 0 (0.0%) | 0 (0.0%) |
| 55 to 64 Years | 47 (55.9%) | 37 (44.1%) |
| 65 to 74 Years | 22 (100.0%) | 0 (0.0%) |
| 75 Years and older | 16 (100.0%) | 0 (0.0%) |
| Total | 160 (81.2%) | 37 (18.8%) |
Health Insurance Coverage by Citizenship Status in Siglerville

| Citizenship Status | With Coverage | Without Coverage |
| Native Born | 7 (100.0%) | 0 (0.0%) |
| Foreign Born, Citizen | 27 (100.0%) | 0 (0.0%) |
| Foreign Born, not a Citizen | 0 (0.0%) | 0 (0.0%) |
Health Insurance Coverage by Household Income in Siglerville
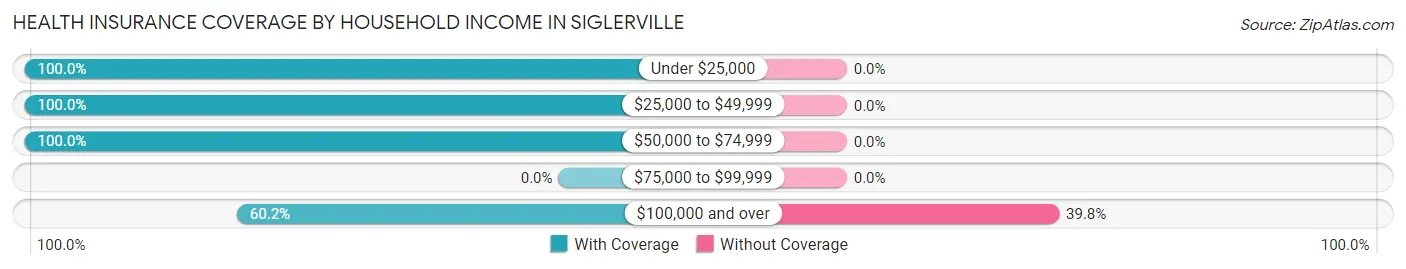
| Household Income | With Coverage | Without Coverage |
| Under $25,000 | 37 (100.0%) | 0 (0.0%) |
| $25,000 to $49,999 | 14 (100.0%) | 0 (0.0%) |
| $50,000 to $74,999 | 53 (100.0%) | 0 (0.0%) |
| $75,000 to $99,999 | 0 (0.0%) | 0 (0.0%) |
| $100,000 and over | 56 (60.2%) | 37 (39.8%) |
Public vs Private Health Insurance Coverage by Age in Siglerville
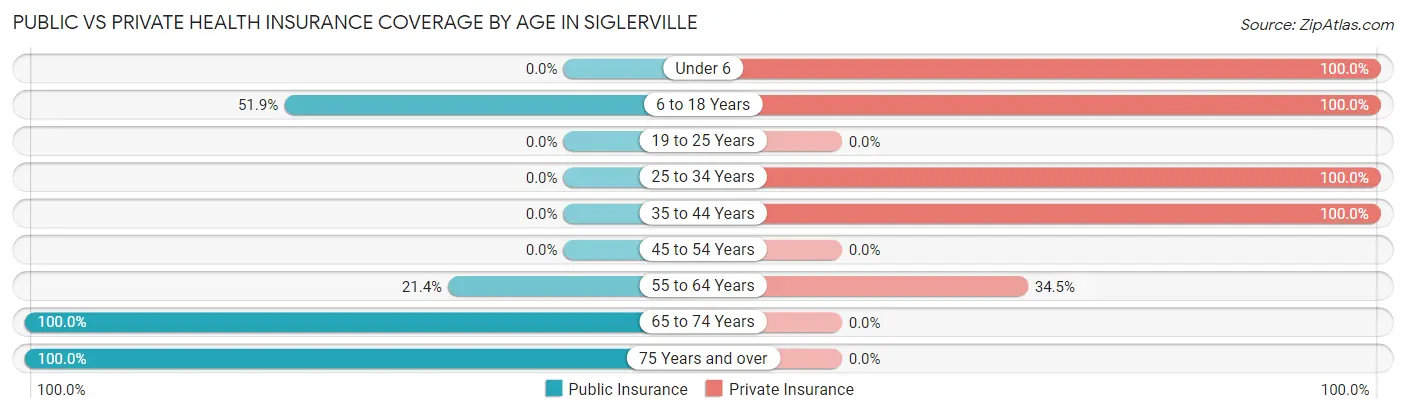
| Age Bracket | Public Insurance | Private Insurance |
| Under 6 | 0 (0.0%) | 7 (100.0%) |
| 6 to 18 Years | 14 (51.8%) | 27 (100.0%) |
| 19 to 25 Years | 0 (0.0%) | 0 (0.0%) |
| 25 to 34 Years | 0 (0.0%) | 29 (100.0%) |
| 35 to 44 Years | 0 (0.0%) | 12 (100.0%) |
| 45 to 54 Years | 0 (0.0%) | 0 (0.0%) |
| 55 to 64 Years | 18 (21.4%) | 29 (34.5%) |
| 65 to 74 Years | 22 (100.0%) | 0 (0.0%) |
| 75 Years and over | 16 (100.0%) | 0 (0.0%) |
| Total | 70 (35.5%) | 104 (52.8%) |
Disability Status by Sex by Age in Siglerville
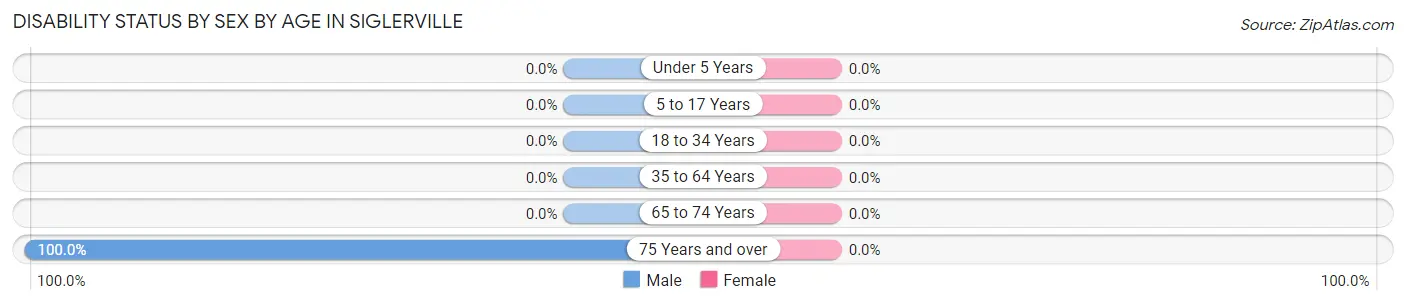
| Age Bracket | Male | Female |
| Under 5 Years | 0 (0.0%) | 0 (0.0%) |
| 5 to 17 Years | 0 (0.0%) | 0 (0.0%) |
| 18 to 34 Years | 0 (0.0%) | 0 (0.0%) |
| 35 to 64 Years | 0 (0.0%) | 0 (0.0%) |
| 65 to 74 Years | 0 (0.0%) | 0 (0.0%) |
| 75 Years and over | 16 (100.0%) | 0 (0.0%) |
Disability Class by Sex by Age in Siglerville
Disability Class: Hearing Difficulty
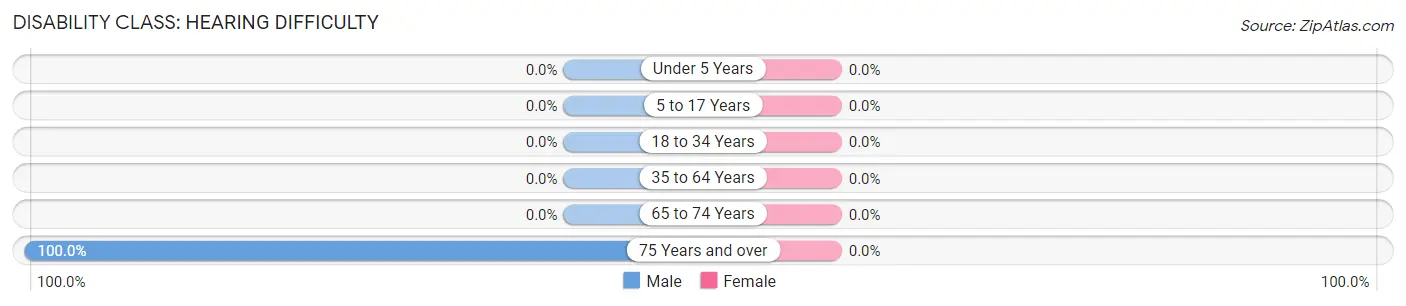
| Age Bracket | Male | Female |
| Under 5 Years | 0 (0.0%) | 0 (0.0%) |
| 5 to 17 Years | 0 (0.0%) | 0 (0.0%) |
| 18 to 34 Years | 0 (0.0%) | 0 (0.0%) |
| 35 to 64 Years | 0 (0.0%) | 0 (0.0%) |
| 65 to 74 Years | 0 (0.0%) | 0 (0.0%) |
| 75 Years and over | 16 (100.0%) | 0 (0.0%) |
Disability Class: Vision Difficulty
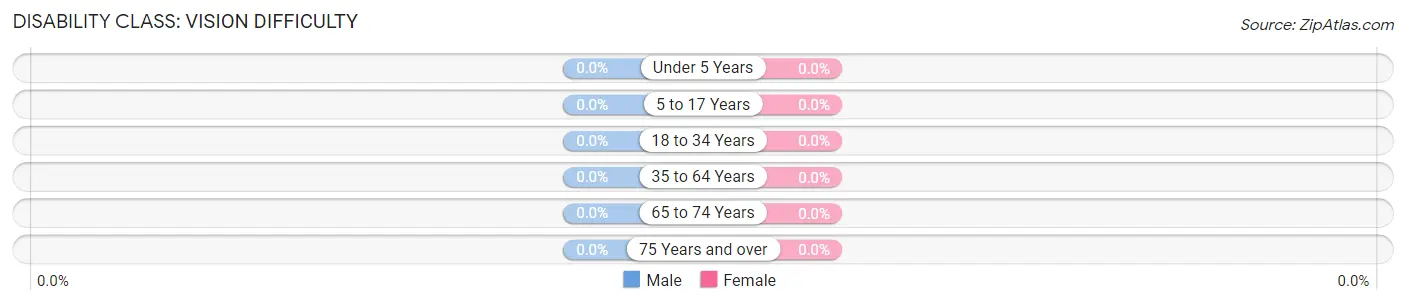
| Age Bracket | Male | Female |
| Under 5 Years | 0 (0.0%) | 0 (0.0%) |
| 5 to 17 Years | 0 (0.0%) | 0 (0.0%) |
| 18 to 34 Years | 0 (0.0%) | 0 (0.0%) |
| 35 to 64 Years | 0 (0.0%) | 0 (0.0%) |
| 65 to 74 Years | 0 (0.0%) | 0 (0.0%) |
| 75 Years and over | 0 (0.0%) | 0 (0.0%) |
Disability Class: Cognitive Difficulty
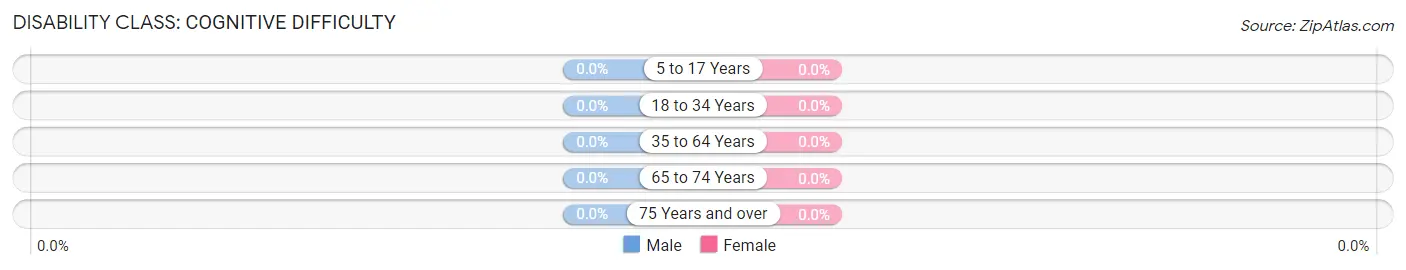
| Age Bracket | Male | Female |
| 5 to 17 Years | 0 (0.0%) | 0 (0.0%) |
| 18 to 34 Years | 0 (0.0%) | 0 (0.0%) |
| 35 to 64 Years | 0 (0.0%) | 0 (0.0%) |
| 65 to 74 Years | 0 (0.0%) | 0 (0.0%) |
| 75 Years and over | 0 (0.0%) | 0 (0.0%) |
Disability Class: Ambulatory Difficulty
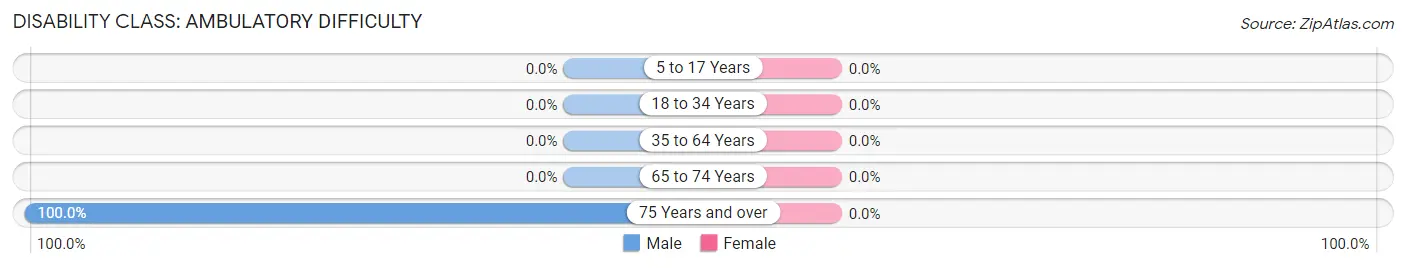
| Age Bracket | Male | Female |
| 5 to 17 Years | 0 (0.0%) | 0 (0.0%) |
| 18 to 34 Years | 0 (0.0%) | 0 (0.0%) |
| 35 to 64 Years | 0 (0.0%) | 0 (0.0%) |
| 65 to 74 Years | 0 (0.0%) | 0 (0.0%) |
| 75 Years and over | 16 (100.0%) | 0 (0.0%) |
Disability Class: Self-Care Difficulty
| Age Bracket | Male | Female |
| 5 to 17 Years | 0 (0.0%) | 0 (0.0%) |
| 18 to 34 Years | 0 (0.0%) | 0 (0.0%) |
| 35 to 64 Years | 0 (0.0%) | 0 (0.0%) |
| 65 to 74 Years | 0 (0.0%) | 0 (0.0%) |
| 75 Years and over | 0 (0.0%) | 0 (0.0%) |
Technology Access in Siglerville
Computing Device Access in Siglerville
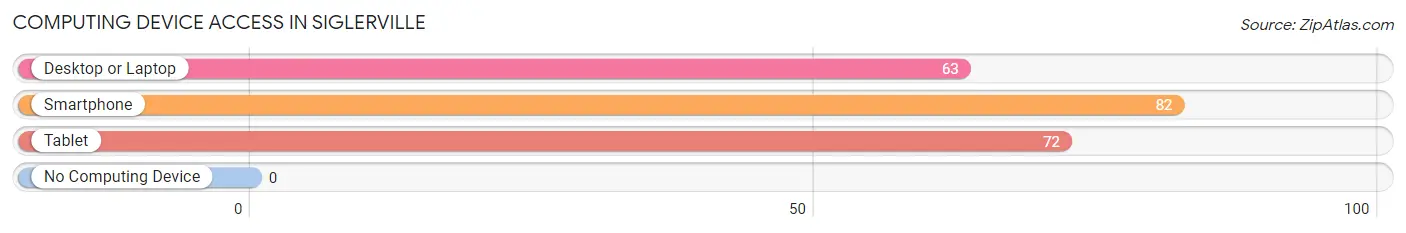
| Device Type | # Households | % Households |
| Desktop or Laptop | 63 | 64.3% |
| Smartphone | 82 | 83.7% |
| Tablet | 72 | 73.5% |
| No Computing Device | 0 | 0.0% |
| Total | 98 | 100.0% |
Internet Access in Siglerville
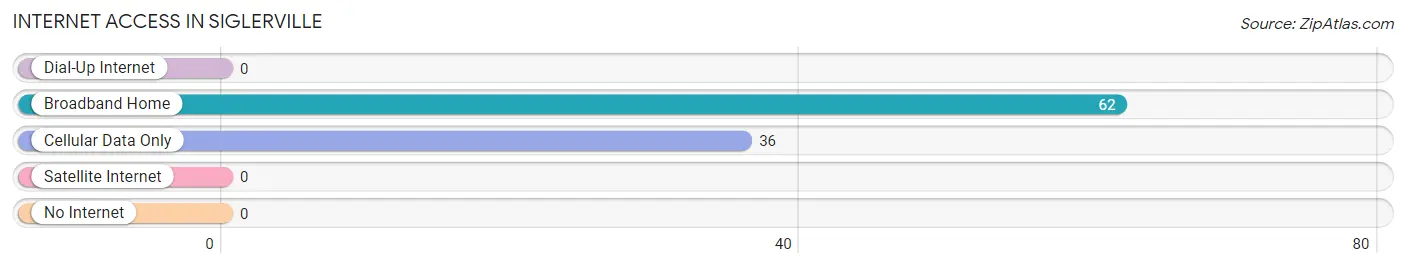
| Internet Type | # Households | % Households |
| Dial-Up Internet | 0 | 0.0% |
| Broadband Home | 62 | 63.3% |
| Cellular Data Only | 36 | 36.7% |
| Satellite Internet | 0 | 0.0% |
| No Internet | 0 | 0.0% |
| Total | 98 | 100.0% |
Siglerville Summary
Siglerville is a small unincorporated community located in Franklin County, Pennsylvania. It is situated in the south-central part of the state, approximately 10 miles south of Chambersburg and about 20 miles north of Hagerstown, Maryland. The population of Siglerville was estimated to be around 1,000 people in 2000.
History
Siglerville was founded in 1790 by John Sigler, a German immigrant who had settled in the area. He purchased a large tract of land and built a log cabin on it. The area was originally known as Sigler's Settlement, but the name was eventually changed to Siglerville.
The town grew slowly over the years, and by the mid-1800s it had become a thriving agricultural community. The town was home to several mills, including a grist mill, a saw mill, and a woolen mill. The town also had a blacksmith shop, a general store, and a post office.
In the late 1800s, the town began to decline as the railroad bypassed it. The population decreased and many of the businesses closed. However, the town was able to survive and remain a small, rural community.
Geography
Siglerville is located in the Appalachian Mountains of south-central Pennsylvania. The town is situated in a valley between two mountain ridges. The town is surrounded by rolling hills and farmland. The town is located near the headwaters of the Conococheague Creek, which flows south into the Potomac River.
The climate in Siglerville is temperate, with cold winters and warm summers. The average annual temperature is around 50 degrees Fahrenheit. The average annual precipitation is around 40 inches.
Economy
The economy of Siglerville is largely based on agriculture. The town is home to several farms, which produce a variety of crops, including corn, soybeans, wheat, and hay. The town also has several small businesses, including a general store, a hardware store, and a restaurant.
Demographics
The population of Siglerville was estimated to be around 1,000 people in 2000. The town is predominantly white, with a small African American population. The median household income is around $35,000. The town has a low unemployment rate and a low poverty rate.
Conclusion
Siglerville is a small, rural community located in Franklin County, Pennsylvania. The town was founded in 1790 and has a long history of agriculture and small businesses. The town has a population of around 1,000 people and is predominantly white. The economy of Siglerville is largely based on agriculture, and the town has a low unemployment rate and a low poverty rate.
Common Questions
What is Per Capita Income in Siglerville?
Per Capita income in Siglerville is $32,999.
What is Income or Wage Gap in Siglerville?
Income or Wage Gap in Siglerville is 56.4%.
Women in Siglerville earn 43.6 cents for every dollar earned by a man.
What is Inequality or Gini Index in Siglerville?
Inequality or Gini Index in Siglerville is 0.30.
What is the Total Population of Siglerville?
Total Population of Siglerville is 197.
What is the Total Male Population of Siglerville?
Total Male Population of Siglerville is 117.
What is the Total Female Population of Siglerville?
Total Female Population of Siglerville is 80.
What is the Ratio of Males per 100 Females in Siglerville?
There are 146.25 Males per 100 Females in Siglerville.
What is the Ratio of Females per 100 Males in Siglerville?
There are 68.38 Females per 100 Males in Siglerville.
What is the Median Population Age in Siglerville?
Median Population Age in Siglerville is 60.1 Years.
What is the Average Family Size in Siglerville
Average Family Size in Siglerville is 2.1 People.
What is the Average Household Size in Siglerville
Average Household Size in Siglerville is 2.0 People.
How Large is the Labor Force in Siglerville?
There are 88 People in the Labor Forcein in Siglerville.
What is the Percentage of People in the Labor Force in Siglerville?
54.0% of People are in the Labor Force in Siglerville.