Elco borough, PA Map & Demographics
Elco borough Overview
$28,019
PER CAPITA INCOME
$77,589
AVG FAMILY INCOME
$60,625
AVG HOUSEHOLD INCOME
50.0%
WAGE / INCOME GAP [ % ]
50.0¢/ $1
WAGE / INCOME GAP [ $ ]
0.40
INEQUALITY / GINI INDEX
272
TOTAL POPULATION
128
MALE POPULATION
144
FEMALE POPULATION
88.89
MALES / 100 FEMALES
112.50
FEMALES / 100 MALES
45.4
MEDIAN AGE
2.6
AVG FAMILY SIZE
2.0
AVG HOUSEHOLD SIZE
113
LABOR FORCE [ PEOPLE ]
45.7%
PERCENT IN LABOR FORCE
7.1%
UNEMPLOYMENT RATE
Income in Elco borough
Income Overview in Elco borough
Per Capita Income in Elco borough is $28,019, while median incomes of families and households are $77,589 and $60,625 respectively.
| Characteristic | Number | Measure |
| Per Capita Income | 272 | $28,019 |
| Median Family Income | 69 | $77,589 |
| Mean Family Income | 69 | $70,667 |
| Median Household Income | 123 | $60,625 |
| Mean Household Income | 123 | $59,601 |
| Income Deficit | 69 | $0 |
| Wage / Income Gap (%) | 272 | 50.00% |
| Wage / Income Gap ($) | 272 | 50.00¢ per $1 |
| Gini / Inequality Index | 272 | 0.40 |
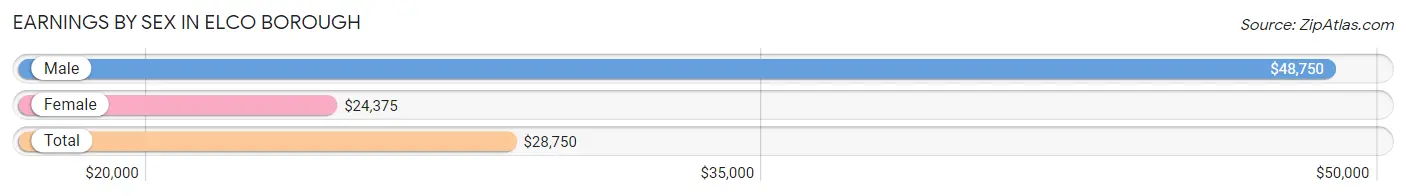
Earnings by Sex in Elco borough
Average Earnings in Elco borough are $28,750, $48,750 for men and $24,375 for women, a difference of 50.0%.
| Sex | Number | Average Earnings |
| Male | 65 (47.8%) | $48,750 |
| Female | 71 (52.2%) | $24,375 |
| Total | 136 (100.0%) | $28,750 |
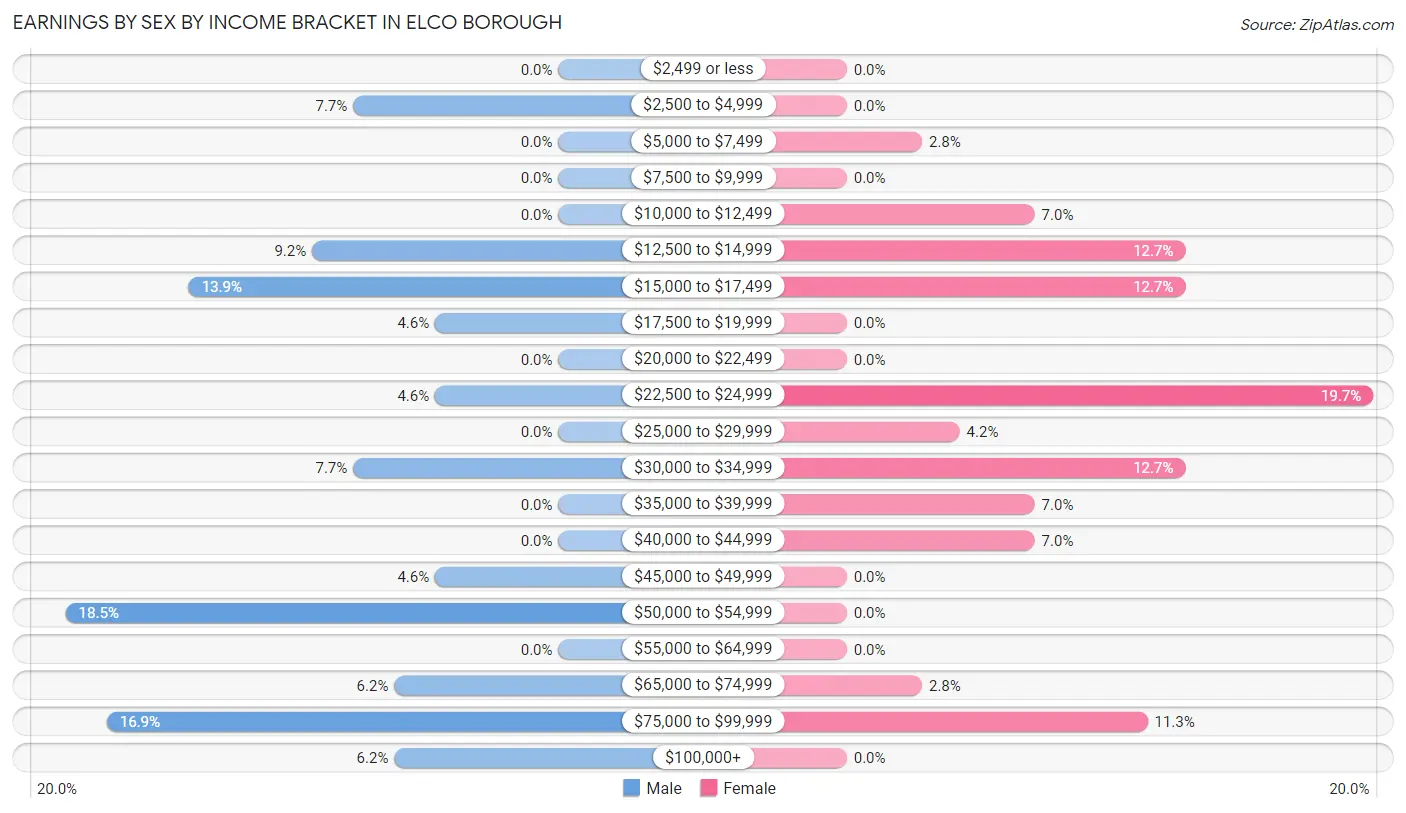
Earnings by Sex by Income Bracket in Elco borough
The most common earnings brackets in Elco borough are $50,000 to $54,999 for men (12 | 18.5%) and $22,500 to $24,999 for women (14 | 19.7%).
| Income | Male | Female |
| $2,499 or less | 0 (0.0%) | 0 (0.0%) |
| $2,500 to $4,999 | 5 (7.7%) | 0 (0.0%) |
| $5,000 to $7,499 | 0 (0.0%) | 2 (2.8%) |
| $7,500 to $9,999 | 0 (0.0%) | 0 (0.0%) |
| $10,000 to $12,499 | 0 (0.0%) | 5 (7.0%) |
| $12,500 to $14,999 | 6 (9.2%) | 9 (12.7%) |
| $15,000 to $17,499 | 9 (13.9%) | 9 (12.7%) |
| $17,500 to $19,999 | 3 (4.6%) | 0 (0.0%) |
| $20,000 to $22,499 | 0 (0.0%) | 0 (0.0%) |
| $22,500 to $24,999 | 3 (4.6%) | 14 (19.7%) |
| $25,000 to $29,999 | 0 (0.0%) | 3 (4.2%) |
| $30,000 to $34,999 | 5 (7.7%) | 9 (12.7%) |
| $35,000 to $39,999 | 0 (0.0%) | 5 (7.0%) |
| $40,000 to $44,999 | 0 (0.0%) | 5 (7.0%) |
| $45,000 to $49,999 | 3 (4.6%) | 0 (0.0%) |
| $50,000 to $54,999 | 12 (18.5%) | 0 (0.0%) |
| $55,000 to $64,999 | 0 (0.0%) | 0 (0.0%) |
| $65,000 to $74,999 | 4 (6.1%) | 2 (2.8%) |
| $75,000 to $99,999 | 11 (16.9%) | 8 (11.3%) |
| $100,000+ | 4 (6.1%) | 0 (0.0%) |
| Total | 65 (100.0%) | 71 (100.0%) |
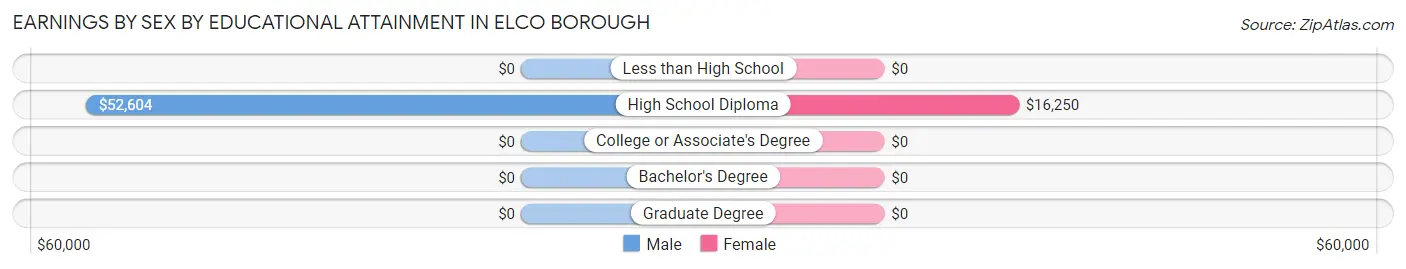
Earnings by Sex by Educational Attainment in Elco borough
Average earnings in Elco borough are $53,021 for men and $25,000 for women, a difference of 52.8%. Men with an educational attainment of high school diploma enjoy the highest average annual earnings of $52,604, while those with high school diploma education earn the least with $52,604. Women with an educational attainment of high school diploma earn the most with the average annual earnings of $16,250, while those with high school diploma education have the smallest earnings of $16,250.
| Educational Attainment | Male Income | Female Income |
| Less than High School | - | - |
| High School Diploma | $52,604 | $16,250 |
| College or Associate's Degree | - | - |
| Bachelor's Degree | - | - |
| Graduate Degree | - | - |
| Total | $53,021 | $25,000 |
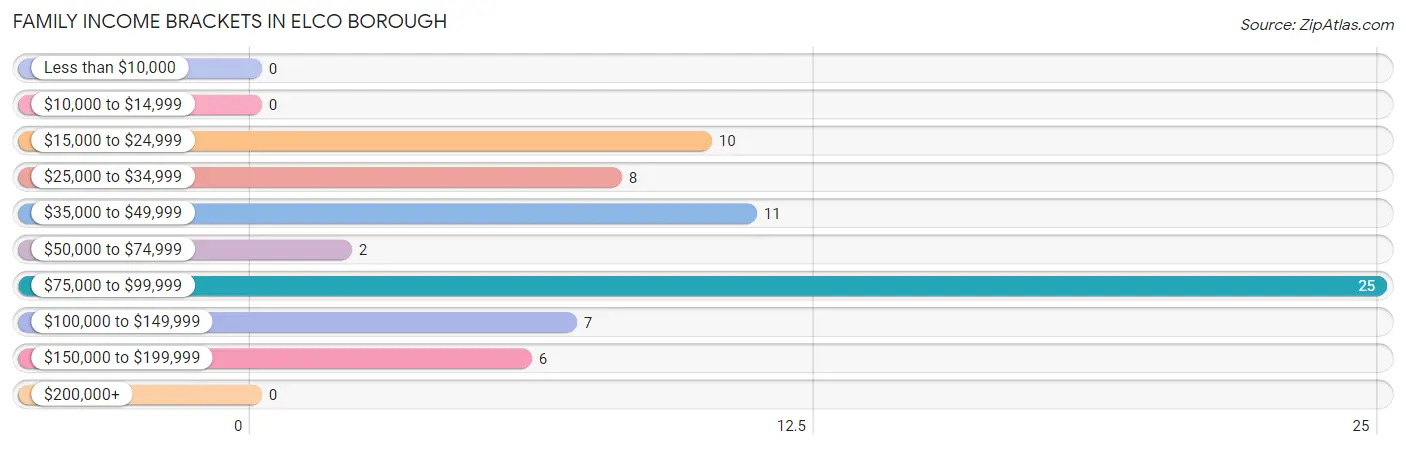
Family Income in Elco borough
Family Income Brackets in Elco borough
According to the Elco borough family income data, there are 25 families falling into the $75,000 to $99,999 income range, which is the most common income bracket and makes up 36.2% of all families.
| Income Bracket | # Families | % Families |
| Less than $10,000 | 0 | 0.0% |
| $10,000 to $14,999 | 0 | 0.0% |
| $15,000 to $24,999 | 10 | 14.5% |
| $25,000 to $34,999 | 8 | 11.6% |
| $35,000 to $49,999 | 11 | 15.9% |
| $50,000 to $74,999 | 2 | 2.9% |
| $75,000 to $99,999 | 25 | 36.2% |
| $100,000 to $149,999 | 7 | 10.1% |
| $150,000 to $199,999 | 6 | 8.7% |
| $200,000+ | 0 | 0.0% |
Family Income by Famaliy Size in Elco borough
3-person families (9 | 13.0%) account for the highest median family income in Elco borough with $158,438 per family, while 3-person families (9 | 13.0%) have the highest median income of $52,813 per family member.
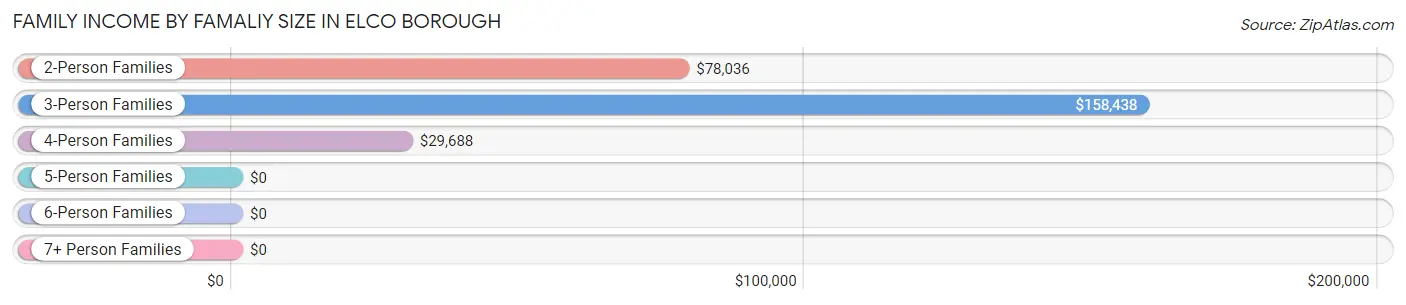
| Income Bracket | # Families | Median Income |
| 2-Person Families | 46 (66.7%) | $78,036 |
| 3-Person Families | 9 (13.0%) | $158,438 |
| 4-Person Families | 14 (20.3%) | $29,688 |
| 5-Person Families | 0 (0.0%) | $0 |
| 6-Person Families | 0 (0.0%) | $0 |
| 7+ Person Families | 0 (0.0%) | $0 |
| Total | 69 (100.0%) | $77,589 |
Family Income by Number of Earners in Elco borough
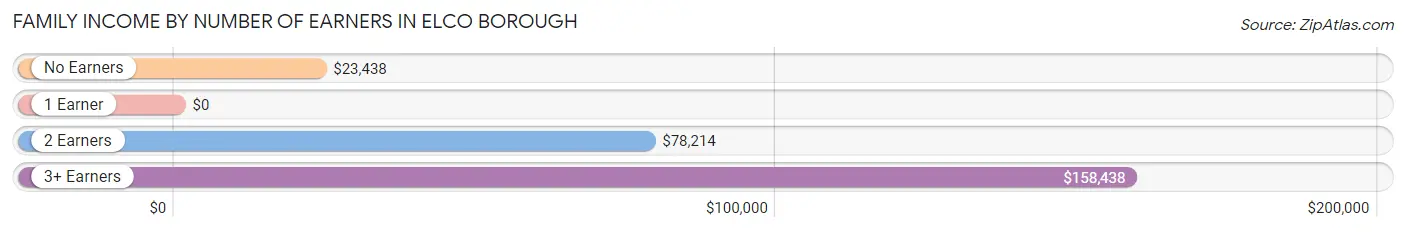
| Number of Earners | # Families | Median Income |
| No Earners | 15 (21.7%) | $23,438 |
| 1 Earner | 19 (27.5%) | $0 |
| 2 Earners | 26 (37.7%) | $78,214 |
| 3+ Earners | 9 (13.0%) | $158,438 |
| Total | 69 (100.0%) | $77,589 |
Household Income in Elco borough
Household Income Brackets in Elco borough
With 40 households falling in the category, the $75,000 to $99,999 income range is the most frequent in Elco borough, accounting for 32.5% of all households.
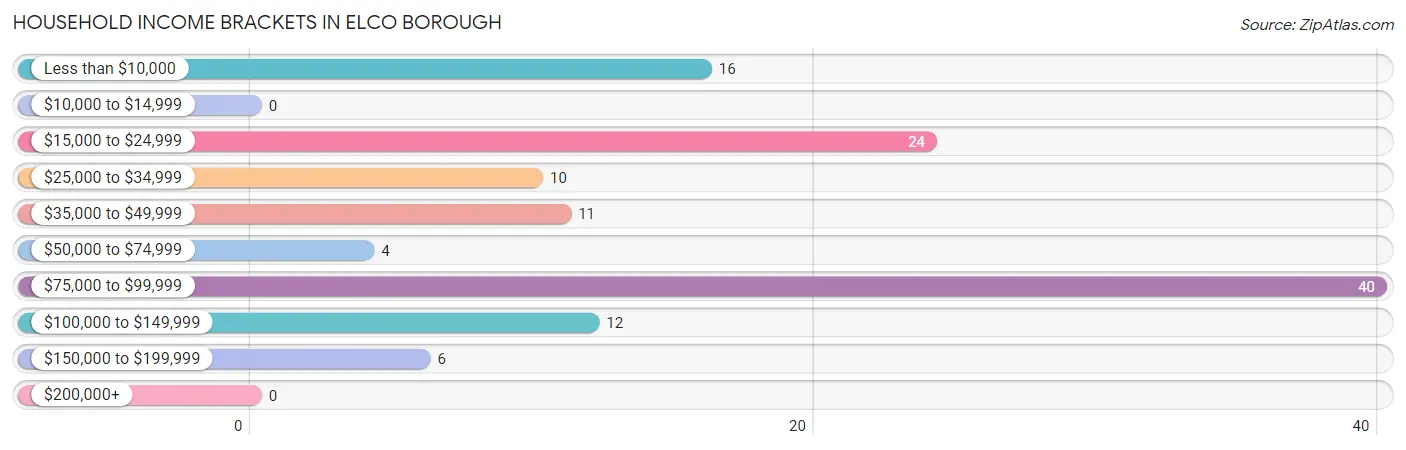
| Income Bracket | # Households | % Households |
| Less than $10,000 | 16 | 13.0% |
| $10,000 to $14,999 | 0 | 0.0% |
| $15,000 to $24,999 | 24 | 19.5% |
| $25,000 to $34,999 | 10 | 8.1% |
| $35,000 to $49,999 | 11 | 8.9% |
| $50,000 to $74,999 | 4 | 3.3% |
| $75,000 to $99,999 | 40 | 32.5% |
| $100,000 to $149,999 | 12 | 9.8% |
| $150,000 to $199,999 | 6 | 4.9% |
| $200,000+ | 0 | 0.0% |
Household Income by Householder Age in Elco borough
The median household income in Elco borough is $60,625, with the highest median household income of $88,750 found in the 45 to 64 years age bracket for the primary householder. A total of 37 households (30.1%) fall into this category.
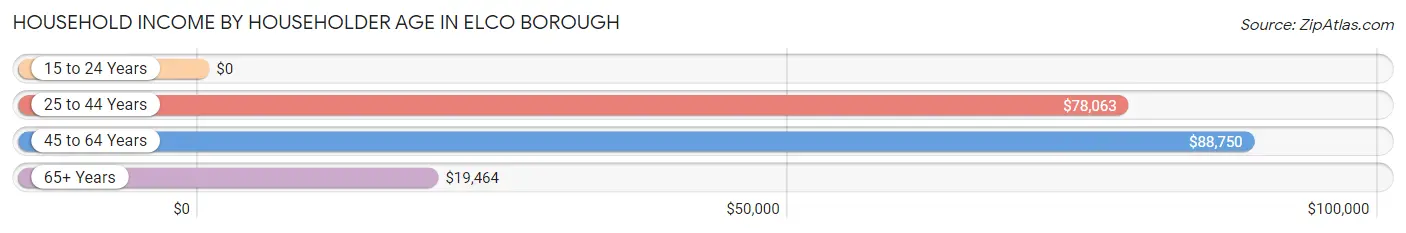
| Income Bracket | # Households | Median Income |
| 15 to 24 Years | 0 (0.0%) | $0 |
| 25 to 44 Years | 49 (39.8%) | $78,063 |
| 45 to 64 Years | 37 (30.1%) | $88,750 |
| 65+ Years | 37 (30.1%) | $19,464 |
| Total | 123 (100.0%) | $60,625 |
Poverty in Elco borough
Income Below Poverty by Sex and Age in Elco borough
With 31.8% poverty level for males and 25.7% for females among the residents of Elco borough, 6 to 11 year old males and 6 to 11 year old females are the most vulnerable to poverty, with 4 males (100.0%) and 5 females (100.0%) in their respective age groups living below the poverty level.
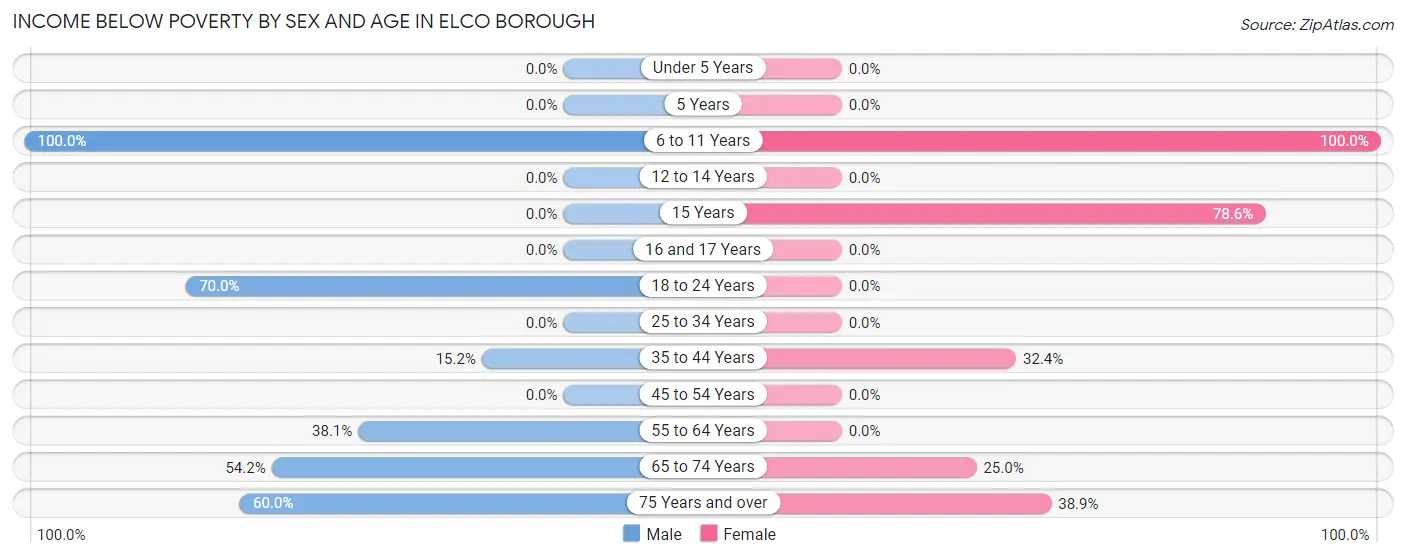
| Age Bracket | Male | Female |
| Under 5 Years | 0 (0.0%) | 0 (0.0%) |
| 5 Years | 0 (0.0%) | 0 (0.0%) |
| 6 to 11 Years | 4 (100.0%) | 5 (100.0%) |
| 12 to 14 Years | 0 (0.0%) | 0 (0.0%) |
| 15 Years | 0 (0.0%) | 11 (78.6%) |
| 16 and 17 Years | 0 (0.0%) | 0 (0.0%) |
| 18 to 24 Years | 7 (70.0%) | 0 (0.0%) |
| 25 to 34 Years | 0 (0.0%) | 0 (0.0%) |
| 35 to 44 Years | 5 (15.1%) | 11 (32.4%) |
| 45 to 54 Years | 0 (0.0%) | 0 (0.0%) |
| 55 to 64 Years | 8 (38.1%) | 0 (0.0%) |
| 65 to 74 Years | 13 (54.2%) | 3 (25.0%) |
| 75 Years and over | 3 (60.0%) | 7 (38.9%) |
| Total | 40 (31.8%) | 37 (25.7%) |
Income Above Poverty by Sex and Age in Elco borough
According to the poverty statistics in Elco borough, males aged 16 and 17 years and females aged 18 to 24 years are the age groups that are most secure financially, with 100.0% of males and 100.0% of females in these age groups living above the poverty line.
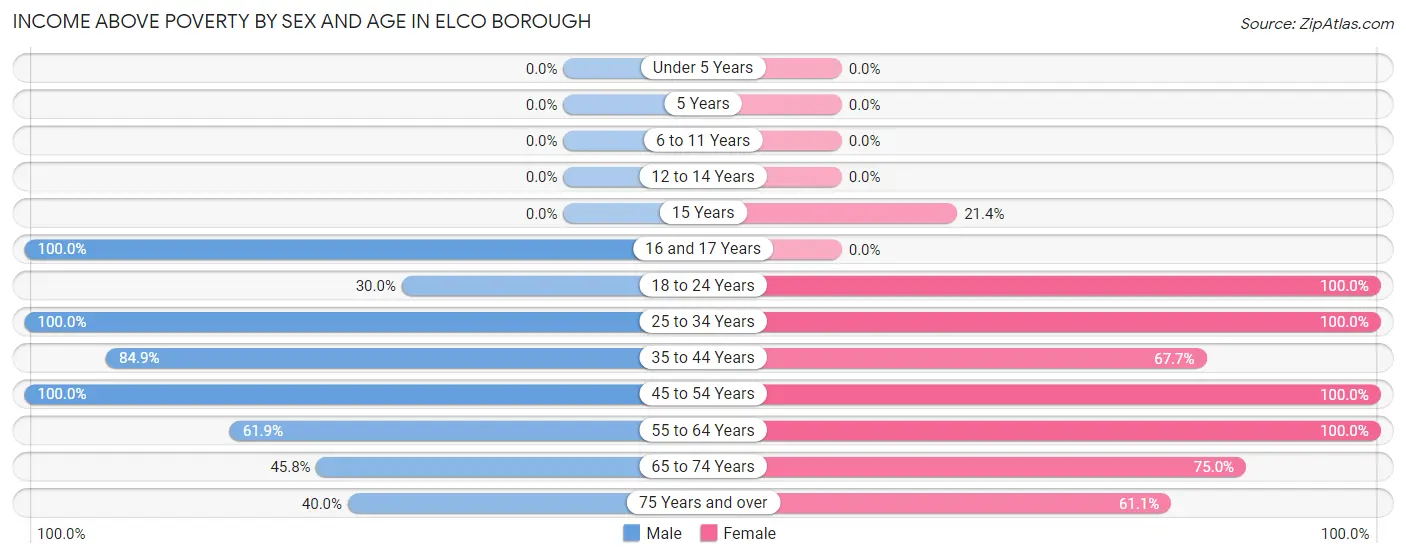
| Age Bracket | Male | Female |
| Under 5 Years | 0 (0.0%) | 0 (0.0%) |
| 5 Years | 0 (0.0%) | 0 (0.0%) |
| 6 to 11 Years | 0 (0.0%) | 0 (0.0%) |
| 12 to 14 Years | 0 (0.0%) | 0 (0.0%) |
| 15 Years | 0 (0.0%) | 3 (21.4%) |
| 16 and 17 Years | 11 (100.0%) | 0 (0.0%) |
| 18 to 24 Years | 3 (30.0%) | 13 (100.0%) |
| 25 to 34 Years | 5 (100.0%) | 3 (100.0%) |
| 35 to 44 Years | 28 (84.9%) | 23 (67.6%) |
| 45 to 54 Years | 13 (100.0%) | 24 (100.0%) |
| 55 to 64 Years | 13 (61.9%) | 21 (100.0%) |
| 65 to 74 Years | 11 (45.8%) | 9 (75.0%) |
| 75 Years and over | 2 (40.0%) | 11 (61.1%) |
| Total | 86 (68.2%) | 107 (74.3%) |
Income Below Poverty Among Married-Couple Families in Elco borough
The poverty statistics for married-couple families in Elco borough show that 18.8% or 9 of the total 48 families live below the poverty line. Families with 1 or 2 children have the highest poverty rate of 30.0%, comprising of 3 families. On the other hand, families with no children have the lowest poverty rate of 15.8%, which includes 6 families.
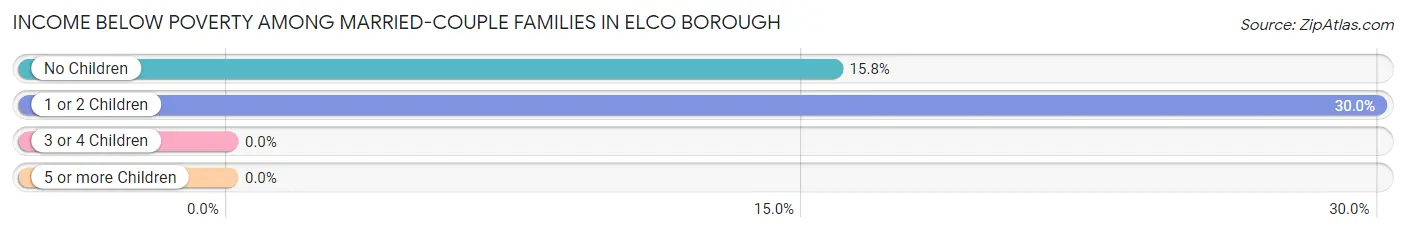
| Children | Above Poverty | Below Poverty |
| No Children | 32 (84.2%) | 6 (15.8%) |
| 1 or 2 Children | 7 (70.0%) | 3 (30.0%) |
| 3 or 4 Children | 0 (0.0%) | 0 (0.0%) |
| 5 or more Children | 0 (0.0%) | 0 (0.0%) |
| Total | 39 (81.2%) | 9 (18.8%) |
Income Below Poverty Among Single-Parent Households in Elco borough
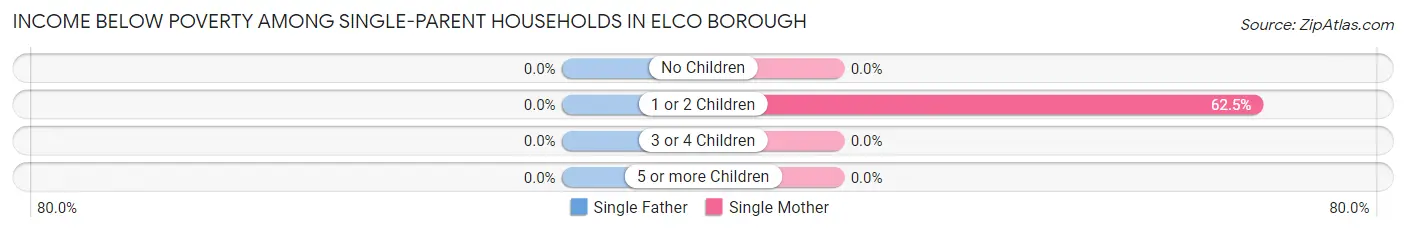
| Children | Single Father | Single Mother |
| No Children | 0 (0.0%) | 0 (0.0%) |
| 1 or 2 Children | 0 (0.0%) | 5 (62.5%) |
| 3 or 4 Children | 0 (0.0%) | 0 (0.0%) |
| 5 or more Children | 0 (0.0%) | 0 (0.0%) |
| Total | 0 (0.0%) | 5 (33.3%) |
Income Below Poverty Among Married-Couple vs Single-Parent Households in Elco borough
The poverty data for Elco borough shows that 9 of the married-couple family households (18.8%) and 5 of the single-parent households (23.8%) are living below the poverty level. Within the married-couple family households, those with 1 or 2 children have the highest poverty rate, with 3 households (30.0%) falling below the poverty line. Among the single-parent households, those with 1 or 2 children have the highest poverty rate, with 5 household (62.5%) living below poverty.
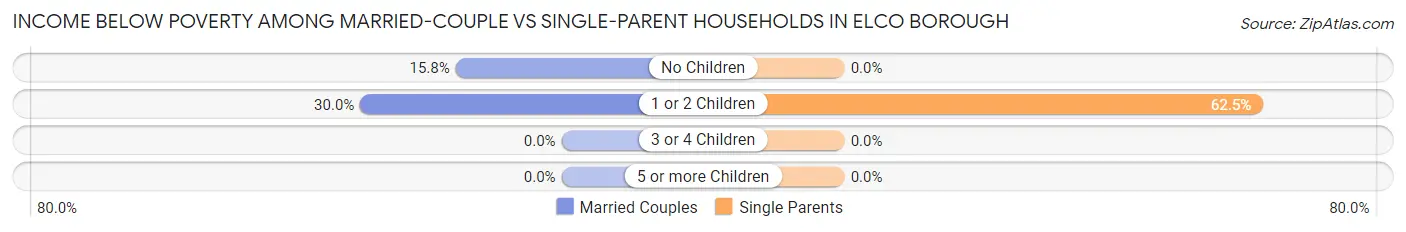
| Children | Married-Couple Families | Single-Parent Households |
| No Children | 6 (15.8%) | 0 (0.0%) |
| 1 or 2 Children | 3 (30.0%) | 5 (62.5%) |
| 3 or 4 Children | 0 (0.0%) | 0 (0.0%) |
| 5 or more Children | 0 (0.0%) | 0 (0.0%) |
| Total | 9 (18.8%) | 5 (23.8%) |
Race in Elco borough
The most populous races in Elco borough are White / Caucasian (230 | 84.6%), Two or more Races (31 | 11.4%), and Black / African American (11 | 4.0%).
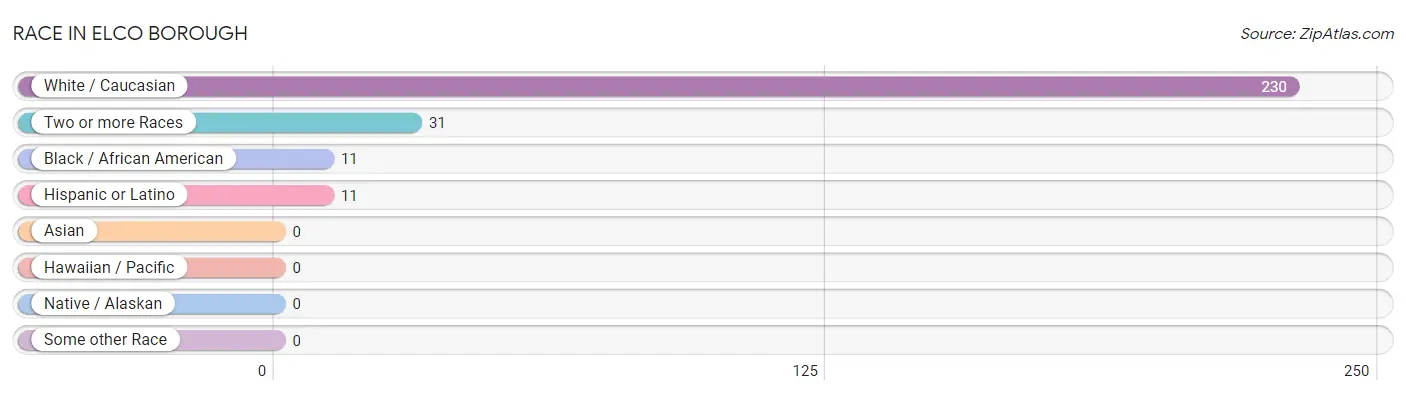
| Race | # Population | % Population |
| Asian | 0 | 0.0% |
| Black / African American | 11 | 4.0% |
| Hawaiian / Pacific | 0 | 0.0% |
| Hispanic or Latino | 11 | 4.0% |
| Native / Alaskan | 0 | 0.0% |
| White / Caucasian | 230 | 84.6% |
| Two or more Races | 31 | 11.4% |
| Some other Race | 0 | 0.0% |
| Total | 272 | 100.0% |
Ancestry in Elco borough
The most populous ancestries reported in Elco borough are English (50 | 18.4%), German (45 | 16.5%), Polish (24 | 8.8%), Irish (19 | 7.0%), and Slovak (16 | 5.9%), together accounting for 56.6% of all Elco borough residents.
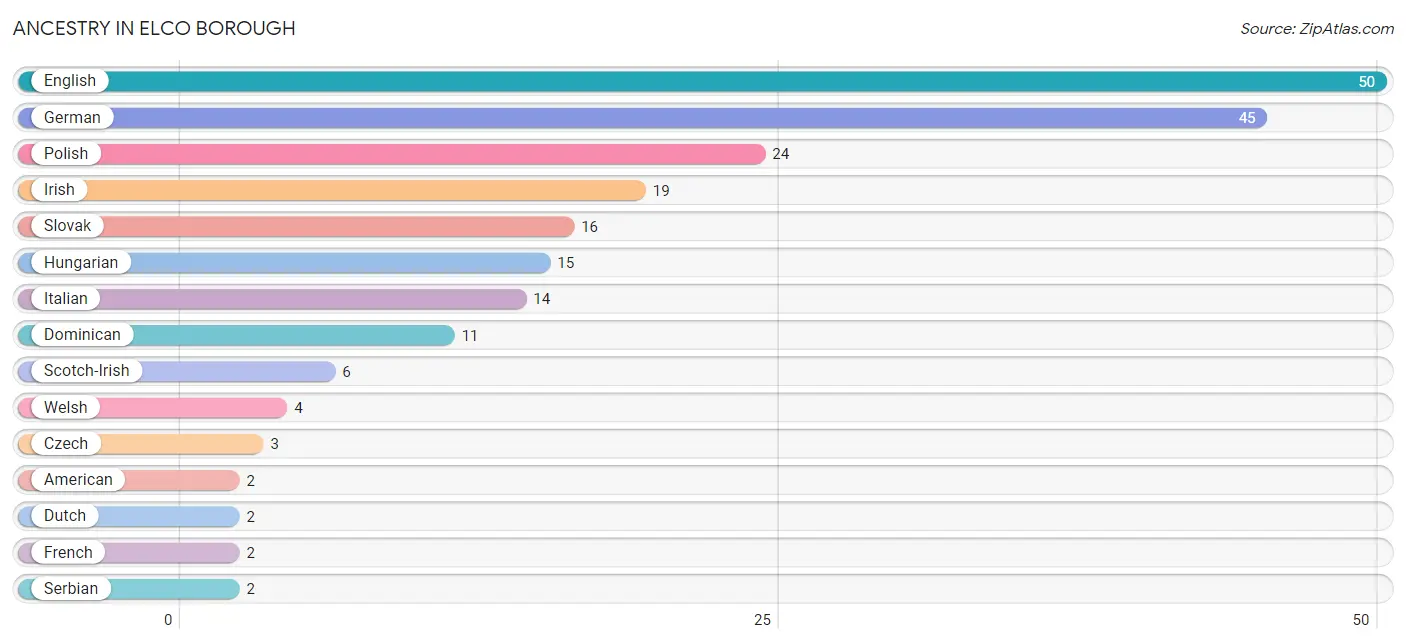
| Ancestry | # Population | % Population |
| American | 2 | 0.7% |
| Czech | 3 | 1.1% |
| Dominican | 11 | 4.0% |
| Dutch | 2 | 0.7% |
| English | 50 | 18.4% |
| French | 2 | 0.7% |
| German | 45 | 16.5% |
| Hungarian | 15 | 5.5% |
| Irish | 19 | 7.0% |
| Italian | 14 | 5.1% |
| Polish | 24 | 8.8% |
| Scotch-Irish | 6 | 2.2% |
| Serbian | 2 | 0.7% |
| Slovak | 16 | 5.9% |
| Welsh | 4 | 1.5% | View All 15 Rows |
Immigrants in Elco borough
The most numerous immigrant groups reported in Elco borough came from Caribbean (11 | 4.0%), Dominican Republic (11 | 4.0%), and Latin America (11 | 4.0%), together accounting for 12.1% of all Elco borough residents.
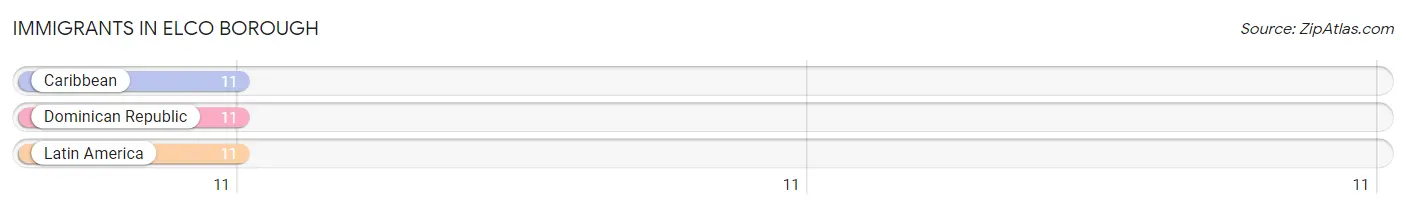
| Immigration Origin | # Population | % Population |
| Caribbean | 11 | 4.0% |
| Dominican Republic | 11 | 4.0% |
| Latin America | 11 | 4.0% | View All 3 Rows |
Sex and Age in Elco borough
Sex and Age in Elco borough
The most populous age groups in Elco borough are 35 to 39 Years (25 | 19.5%) for men and 35 to 39 Years (26 | 18.1%) for women.
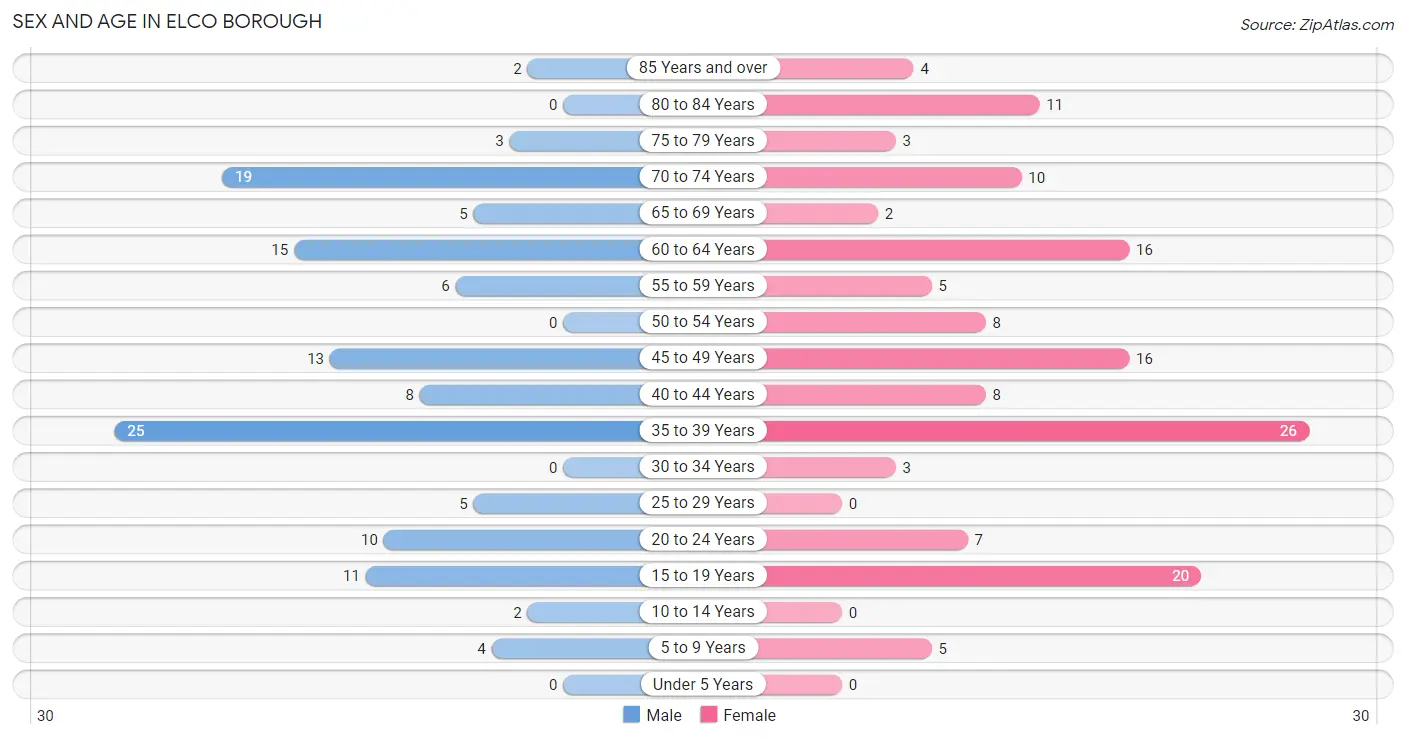
| Age Bracket | Male | Female |
| Under 5 Years | 0 (0.0%) | 0 (0.0%) |
| 5 to 9 Years | 4 (3.1%) | 5 (3.5%) |
| 10 to 14 Years | 2 (1.6%) | 0 (0.0%) |
| 15 to 19 Years | 11 (8.6%) | 20 (13.9%) |
| 20 to 24 Years | 10 (7.8%) | 7 (4.9%) |
| 25 to 29 Years | 5 (3.9%) | 0 (0.0%) |
| 30 to 34 Years | 0 (0.0%) | 3 (2.1%) |
| 35 to 39 Years | 25 (19.5%) | 26 (18.1%) |
| 40 to 44 Years | 8 (6.2%) | 8 (5.6%) |
| 45 to 49 Years | 13 (10.2%) | 16 (11.1%) |
| 50 to 54 Years | 0 (0.0%) | 8 (5.6%) |
| 55 to 59 Years | 6 (4.7%) | 5 (3.5%) |
| 60 to 64 Years | 15 (11.7%) | 16 (11.1%) |
| 65 to 69 Years | 5 (3.9%) | 2 (1.4%) |
| 70 to 74 Years | 19 (14.8%) | 10 (6.9%) |
| 75 to 79 Years | 3 (2.3%) | 3 (2.1%) |
| 80 to 84 Years | 0 (0.0%) | 11 (7.6%) |
| 85 Years and over | 2 (1.6%) | 4 (2.8%) |
| Total | 128 (100.0%) | 144 (100.0%) |
Families and Households in Elco borough
Median Family Size in Elco borough
The median family size in Elco borough is 2.59 persons per family, with single female/mother families (15 | 21.7%) accounting for the largest median family size of 3.33 persons per family. On the other hand, single male/father families (6 | 8.7%) represent the smallest median family size with 2.17 persons per family.
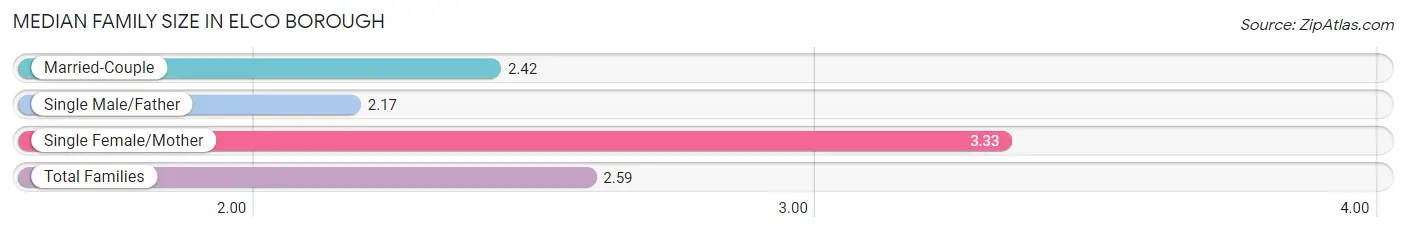
| Family Type | # Families | Family Size |
| Married-Couple | 48 (69.6%) | 2.42 |
| Single Male/Father | 6 (8.7%) | 2.17 |
| Single Female/Mother | 15 (21.7%) | 3.33 |
| Total Families | 69 (100.0%) | 2.59 |
Median Household Size in Elco borough
The median household size in Elco borough is 2.04 persons per household, with single female/mother households (15 | 12.2%) accounting for the largest median household size of 3.67 persons per household. non-family households (54 | 43.9%) represent the smallest median household size with 1.24 persons per household.
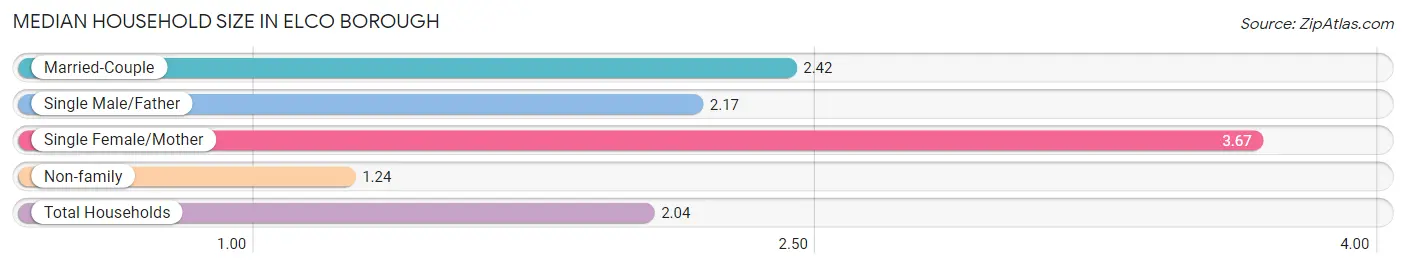
| Household Type | # Households | Household Size |
| Married-Couple | 48 (39.0%) | 2.42 |
| Single Male/Father | 6 (4.9%) | 2.17 |
| Single Female/Mother | 15 (12.2%) | 3.67 |
| Non-family | 54 (43.9%) | 1.24 |
| Total Households | 123 (100.0%) | 2.04 |
Household Size by Marriage Status in Elco borough
Out of a total of 123 households in Elco borough, 69 (56.1%) are family households, while 54 (43.9%) are nonfamily households. The most numerous type of family households are 2-person households, comprising 46, and the most common type of nonfamily households are 1-person households, comprising 46.
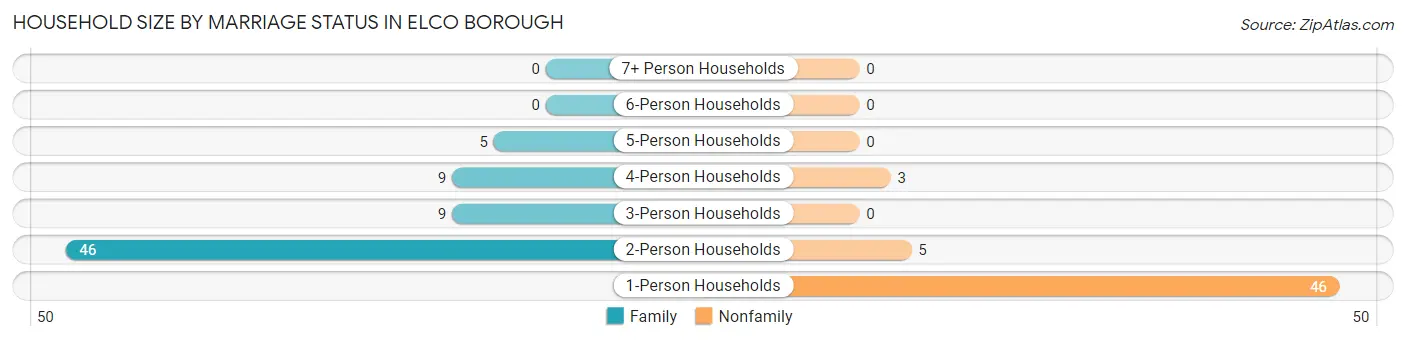
| Household Size | Family Households | Nonfamily Households |
| 1-Person Households | - | 46 (37.4%) |
| 2-Person Households | 46 (37.4%) | 5 (4.1%) |
| 3-Person Households | 9 (7.3%) | 0 (0.0%) |
| 4-Person Households | 9 (7.3%) | 3 (2.4%) |
| 5-Person Households | 5 (4.1%) | 0 (0.0%) |
| 6-Person Households | 0 (0.0%) | 0 (0.0%) |
| 7+ Person Households | 0 (0.0%) | 0 (0.0%) |
| Total | 69 (56.1%) | 54 (43.9%) |
Female Fertility in Elco borough
Fertility by Age in Elco borough
| Age Bracket | Women with Births | Births / 1,000 Women |
| 15 to 19 years | 0 (0.0%) | 0.0 |
| 20 to 34 years | 0 (0.0%) | 0.0 |
| 35 to 50 years | 0 (0.0%) | 0.0 |
| Total | 0 (0.0%) | 0.0 |
Fertility by Age by Marriage Status in Elco borough
| Age Bracket | Married | Unmarried |
| 15 to 19 years | 0 (0.0%) | 0 (0.0%) |
| 20 to 34 years | 0 (0.0%) | 0 (0.0%) |
| 35 to 50 years | 0 (0.0%) | 0 (0.0%) |
| Total | 0 (0.0%) | 0 (0.0%) |
Fertility by Education in Elco borough
| Educational Attainment | Women with Births | Births / 1,000 Women |
| Less than High School | 0 (0.0%) | 0.0 |
| High School Diploma | 0 (0.0%) | 0.0 |
| College or Associate's Degree | 0 (0.0%) | 0.0 |
| Bachelor's Degree | 0 (0.0%) | 0.0 |
| Graduate Degree | 0 (0.0%) | 0.0 |
| Total | 0 (0.0%) | 0.0 |
Fertility by Education by Marriage Status in Elco borough
| Educational Attainment | Married | Unmarried |
| Less than High School | 0 (0.0%) | 0 (0.0%) |
| High School Diploma | 0 (0.0%) | 0 (0.0%) |
| College or Associate's Degree | 0 (0.0%) | 0 (0.0%) |
| Bachelor's Degree | 0 (0.0%) | 0 (0.0%) |
| Graduate Degree | 0 (0.0%) | 0 (0.0%) |
| Total | 0 (0.0%) | 0 (0.0%) |
Employment Characteristics in Elco borough
Employment by Class of Employer in Elco borough
Among the 105 employed individuals in Elco borough, private company employees (89 | 84.8%), self-employed (not incorporated) (6 | 5.7%), and self-employed (incorporated) (5 | 4.8%) make up the most common classes of employment.
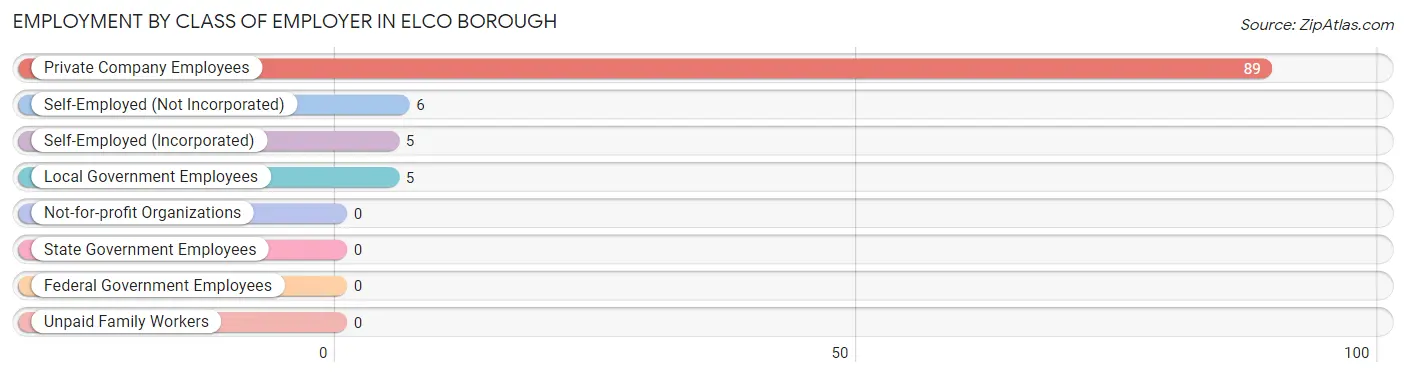
| Employer Class | # Employees | % Employees |
| Private Company Employees | 89 | 84.8% |
| Self-Employed (Incorporated) | 5 | 4.8% |
| Self-Employed (Not Incorporated) | 6 | 5.7% |
| Not-for-profit Organizations | 0 | 0.0% |
| Local Government Employees | 5 | 4.8% |
| State Government Employees | 0 | 0.0% |
| Federal Government Employees | 0 | 0.0% |
| Unpaid Family Workers | 0 | 0.0% |
| Total | 105 | 100.0% |
Employment Status by Age in Elco borough
According to the labor force statistics for Elco borough, out of the total population over 16 years of age (247), 45.7% or 113 individuals are in the labor force, with 7.1% or 8 of them unemployed. The age group with the highest labor force participation rate is 25 to 29 years, with 100.0% or 5 individuals in the labor force. Within the labor force, the 35 to 44 years age range has the highest percentage of unemployed individuals, with 24.2% or 8 of them being unemployed.
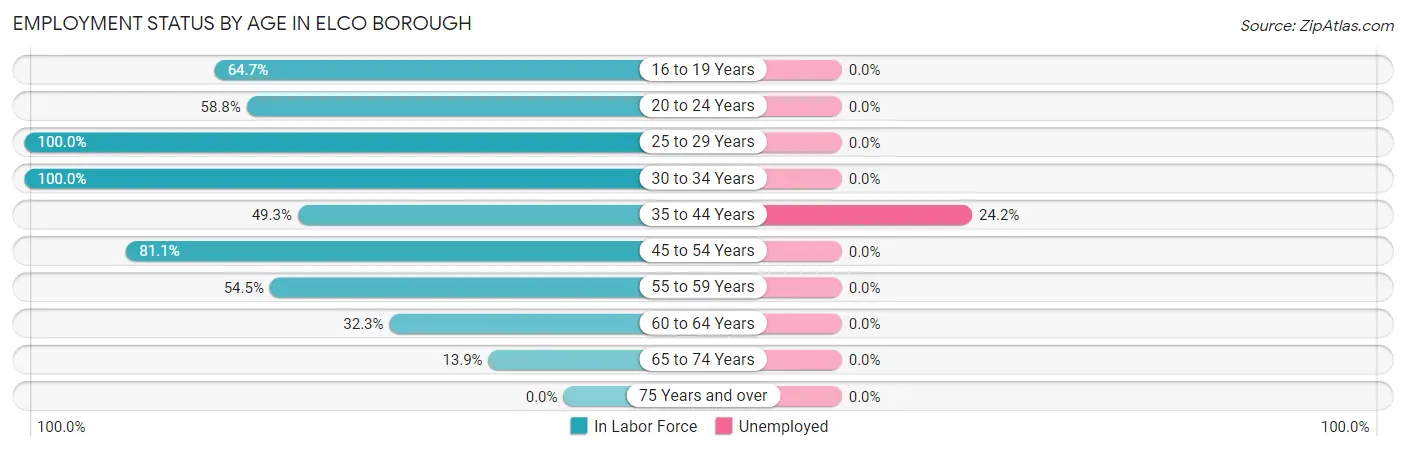
| Age Bracket | In Labor Force | Unemployed |
| 16 to 19 Years | 11 (64.7%) | 0 (0.0%) |
| 20 to 24 Years | 10 (58.8%) | 0 (0.0%) |
| 25 to 29 Years | 5 (100.0%) | 0 (0.0%) |
| 30 to 34 Years | 3 (100.0%) | 0 (0.0%) |
| 35 to 44 Years | 33 (49.3%) | 8 (24.2%) |
| 45 to 54 Years | 30 (81.1%) | 0 (0.0%) |
| 55 to 59 Years | 6 (54.5%) | 0 (0.0%) |
| 60 to 64 Years | 10 (32.3%) | 0 (0.0%) |
| 65 to 74 Years | 5 (13.9%) | 0 (0.0%) |
| 75 Years and over | 0 (0.0%) | 0 (0.0%) |
| Total | 113 (45.7%) | 8 (7.1%) |
Employment Status by Educational Attainment in Elco borough
According to labor force statistics for Elco borough, 56.5% of individuals (87) out of the total population between 25 and 64 years of age (154) are in the labor force, with 9.2% or 8 of them being unemployed. The group with the highest labor force participation rate are those with the educational attainment of college / associate degree, with 82.4% or 28 individuals in the labor force. Within the labor force, individuals with high school diploma education have the highest percentage of unemployment, with 12.8% or 5 of them being unemployed.
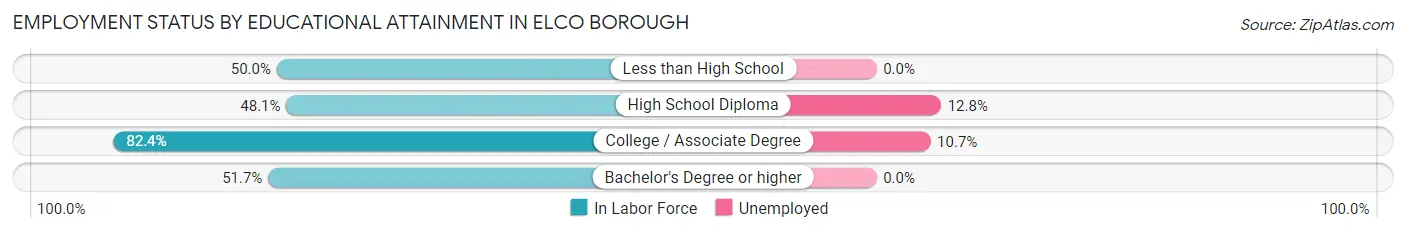
| Educational Attainment | In Labor Force | Unemployed |
| Less than High School | 5 (50.0%) | 0 (0.0%) |
| High School Diploma | 39 (48.1%) | 10 (12.8%) |
| College / Associate Degree | 28 (82.4%) | 4 (10.7%) |
| Bachelor's Degree or higher | 15 (51.7%) | 0 (0.0%) |
| Total | 87 (56.5%) | 14 (9.2%) |
Employment Occupations by Sex in Elco borough
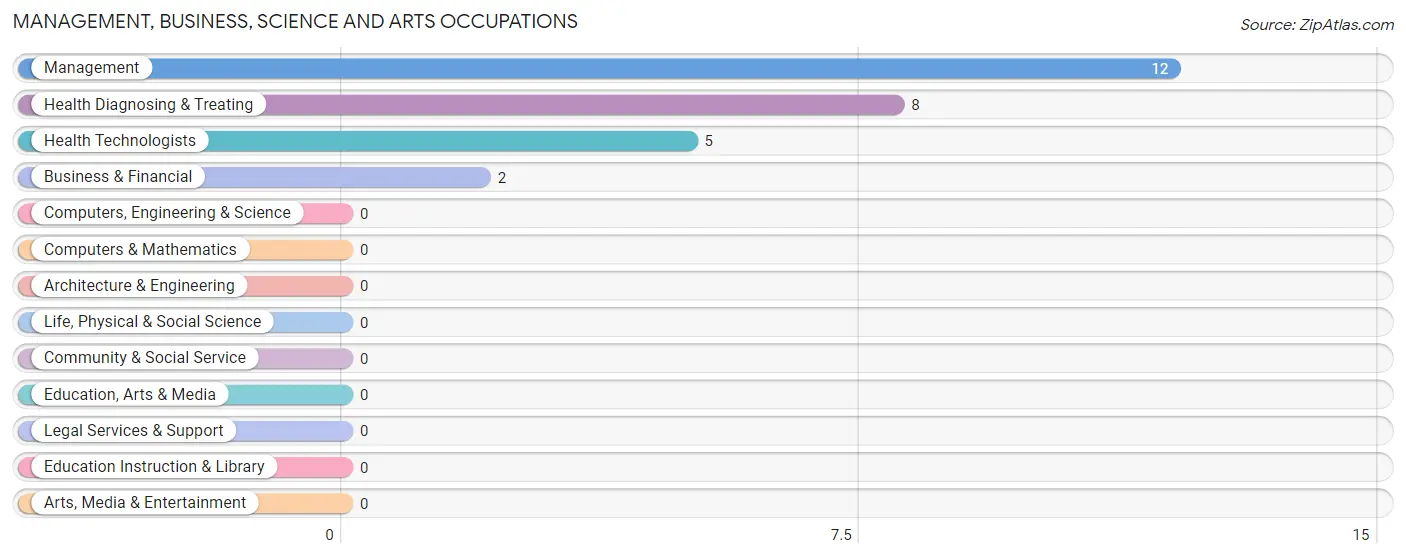
Management, Business, Science and Arts Occupations
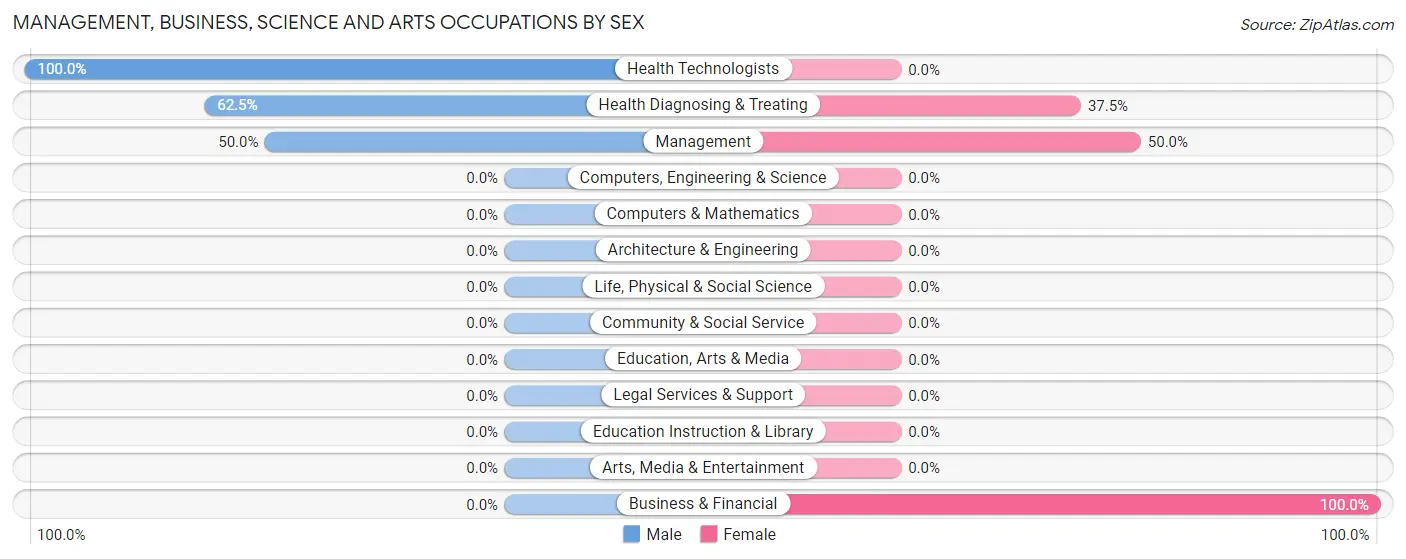
The most common Management, Business, Science and Arts occupations in Elco borough are Management (12 | 11.4%), Health Diagnosing & Treating (8 | 7.6%), Health Technologists (5 | 4.8%), and Business & Financial (2 | 1.9%).
Management, Business, Science and Arts Occupations by Sex
Within the Management, Business, Science and Arts occupations in Elco borough, the most male-oriented occupations are Health Technologists (100.0%), Health Diagnosing & Treating (62.5%), and Management (50.0%), while the most female-oriented occupations are Business & Financial (100.0%), Management (50.0%), and Health Diagnosing & Treating (37.5%).
| Occupation | Male | Female |
| Management | 6 (50.0%) | 6 (50.0%) |
| Business & Financial | 0 (0.0%) | 2 (100.0%) |
| Computers, Engineering & Science | 0 (0.0%) | 0 (0.0%) |
| Computers & Mathematics | 0 (0.0%) | 0 (0.0%) |
| Architecture & Engineering | 0 (0.0%) | 0 (0.0%) |
| Life, Physical & Social Science | 0 (0.0%) | 0 (0.0%) |
| Community & Social Service | 0 (0.0%) | 0 (0.0%) |
| Education, Arts & Media | 0 (0.0%) | 0 (0.0%) |
| Legal Services & Support | 0 (0.0%) | 0 (0.0%) |
| Education Instruction & Library | 0 (0.0%) | 0 (0.0%) |
| Arts, Media & Entertainment | 0 (0.0%) | 0 (0.0%) |
| Health Diagnosing & Treating | 5 (62.5%) | 3 (37.5%) |
| Health Technologists | 5 (100.0%) | 0 (0.0%) |
| Total (Category) | 11 (50.0%) | 11 (50.0%) |
| Total (Overall) | 53 (50.5%) | 52 (49.5%) |
Services Occupations
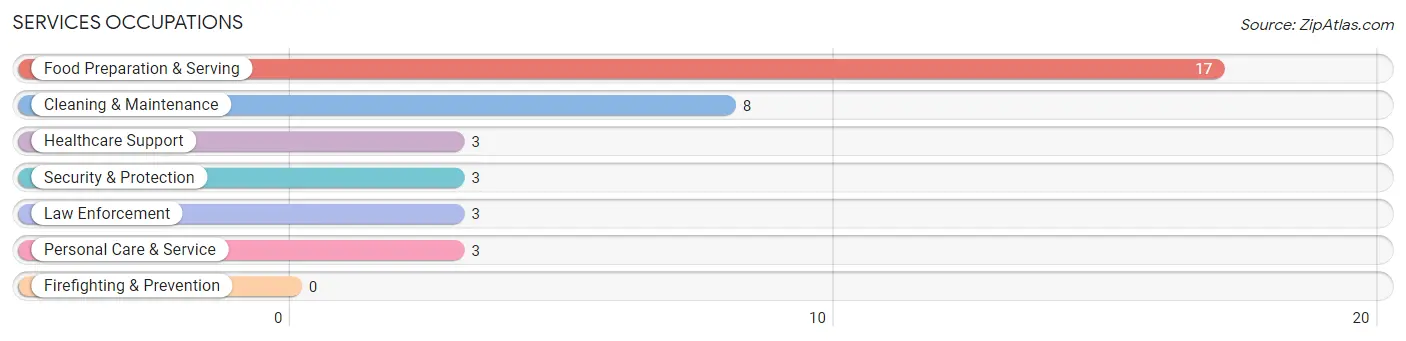
The most common Services occupations in Elco borough are Food Preparation & Serving (17 | 16.2%), Cleaning & Maintenance (8 | 7.6%), Healthcare Support (3 | 2.9%), Security & Protection (3 | 2.9%), and Law Enforcement (3 | 2.9%).
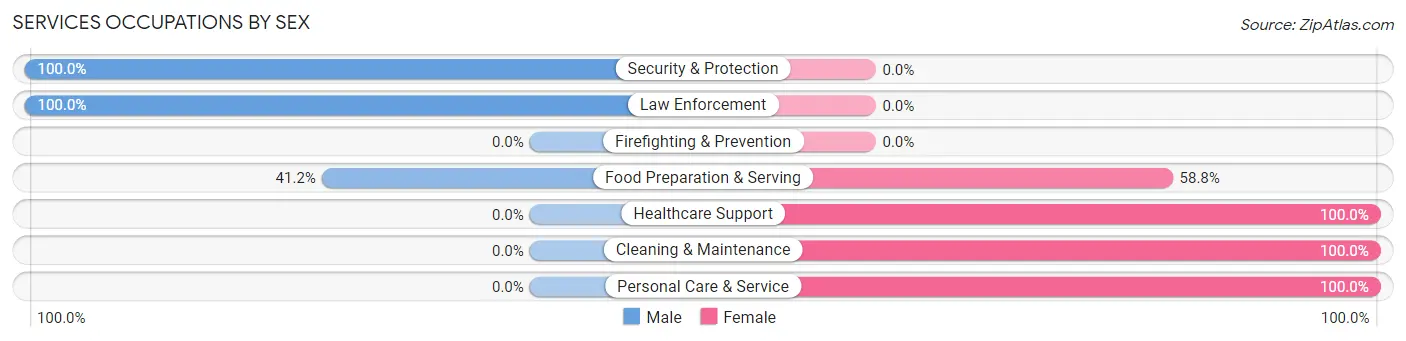
Services Occupations by Sex
Within the Services occupations in Elco borough, the most male-oriented occupations are Security & Protection (100.0%), Law Enforcement (100.0%), and Food Preparation & Serving (41.2%), while the most female-oriented occupations are Healthcare Support (100.0%), Cleaning & Maintenance (100.0%), and Personal Care & Service (100.0%).
| Occupation | Male | Female |
| Healthcare Support | 0 (0.0%) | 3 (100.0%) |
| Security & Protection | 3 (100.0%) | 0 (0.0%) |
| Firefighting & Prevention | 0 (0.0%) | 0 (0.0%) |
| Law Enforcement | 3 (100.0%) | 0 (0.0%) |
| Food Preparation & Serving | 7 (41.2%) | 10 (58.8%) |
| Cleaning & Maintenance | 0 (0.0%) | 8 (100.0%) |
| Personal Care & Service | 0 (0.0%) | 3 (100.0%) |
| Total (Category) | 10 (29.4%) | 24 (70.6%) |
| Total (Overall) | 53 (50.5%) | 52 (49.5%) |
Sales and Office Occupations
The most common Sales and Office occupations in Elco borough are Sales & Related (11 | 10.5%), and Office & Administration (10 | 9.5%).

Sales and Office Occupations by Sex

| Occupation | Male | Female |
| Sales & Related | 0 (0.0%) | 11 (100.0%) |
| Office & Administration | 7 (70.0%) | 3 (30.0%) |
| Total (Category) | 7 (33.3%) | 14 (66.7%) |
| Total (Overall) | 53 (50.5%) | 52 (49.5%) |
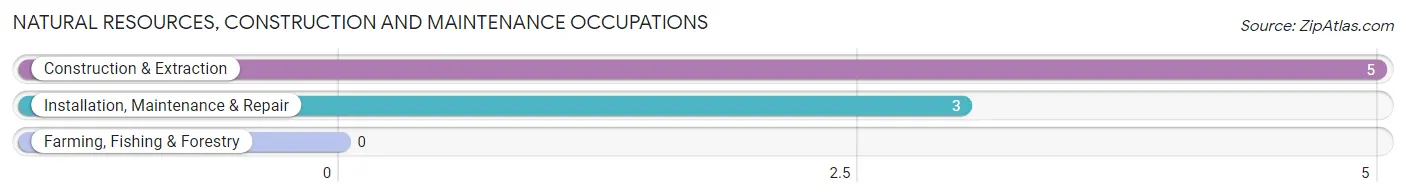
Natural Resources, Construction and Maintenance Occupations
The most common Natural Resources, Construction and Maintenance occupations in Elco borough are Construction & Extraction (5 | 4.8%), and Installation, Maintenance & Repair (3 | 2.9%).
Natural Resources, Construction and Maintenance Occupations by Sex

| Occupation | Male | Female |
| Farming, Fishing & Forestry | 0 (0.0%) | 0 (0.0%) |
| Construction & Extraction | 5 (100.0%) | 0 (0.0%) |
| Installation, Maintenance & Repair | 3 (100.0%) | 0 (0.0%) |
| Total (Category) | 8 (100.0%) | 0 (0.0%) |
| Total (Overall) | 53 (50.5%) | 52 (49.5%) |
Production, Transportation and Moving Occupations
The most common Production, Transportation and Moving occupations in Elco borough are Transportation (12 | 11.4%), Production (5 | 4.8%), and Material Moving (3 | 2.9%).
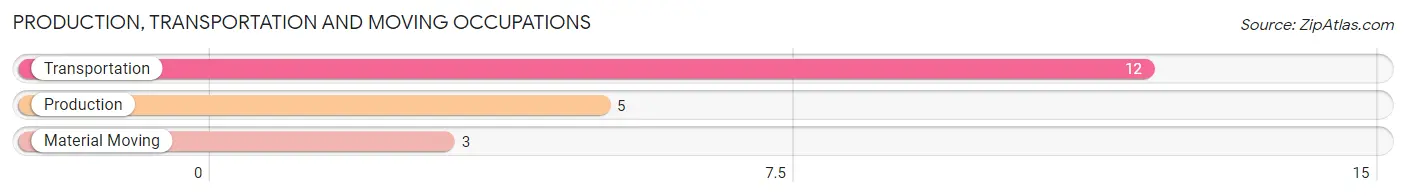
Production, Transportation and Moving Occupations by Sex
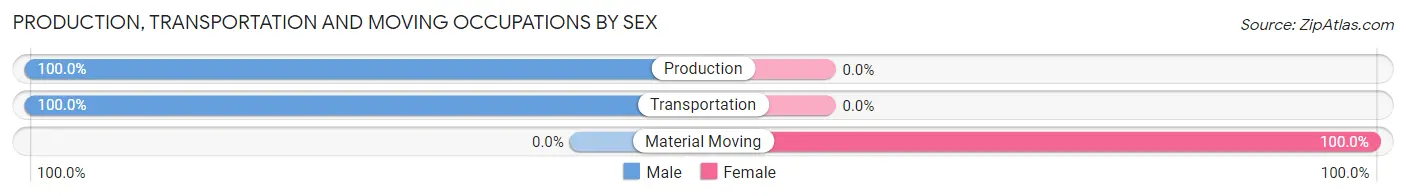
| Occupation | Male | Female |
| Production | 5 (100.0%) | 0 (0.0%) |
| Transportation | 12 (100.0%) | 0 (0.0%) |
| Material Moving | 0 (0.0%) | 3 (100.0%) |
| Total (Category) | 17 (85.0%) | 3 (15.0%) |
| Total (Overall) | 53 (50.5%) | 52 (49.5%) |
Employment Industries by Sex in Elco borough
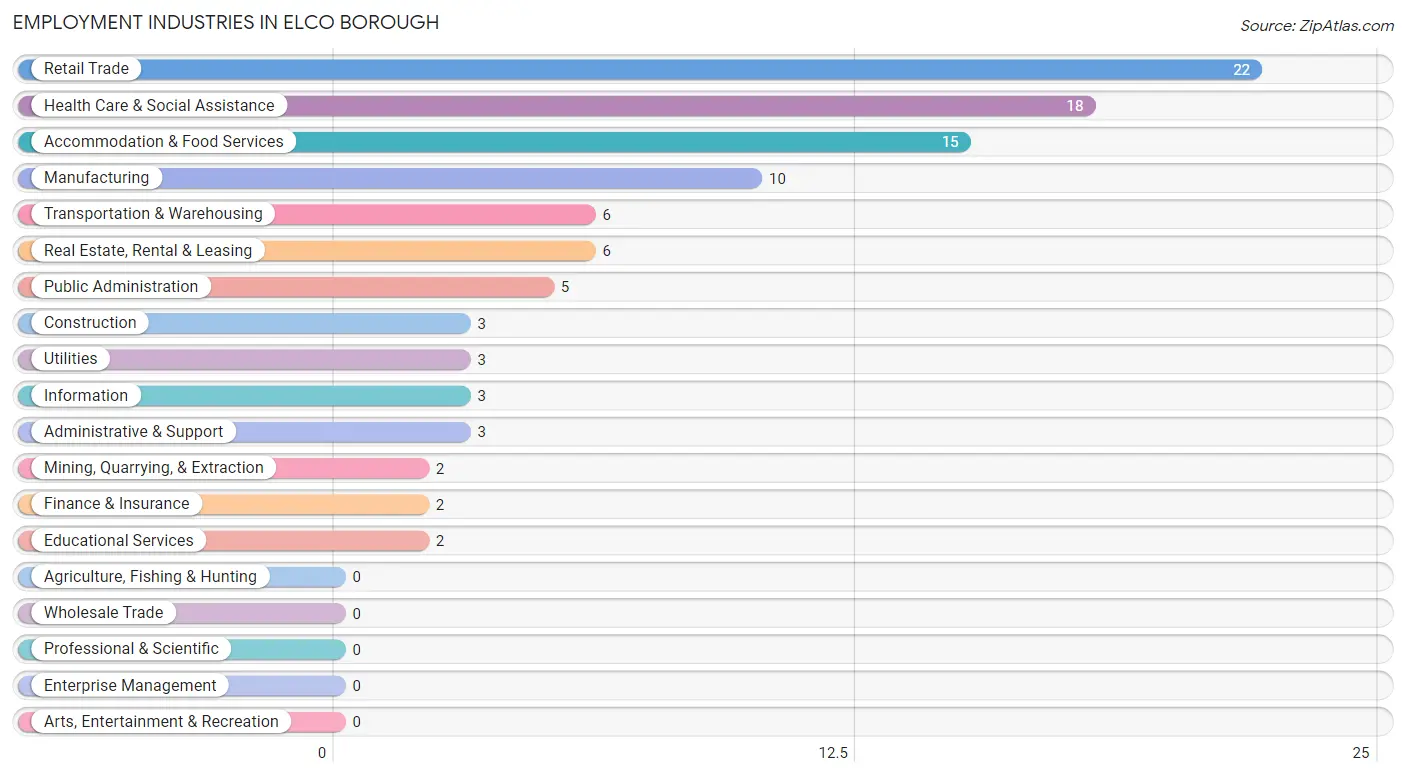
Employment Industries in Elco borough
The major employment industries in Elco borough include Retail Trade (22 | 20.9%), Health Care & Social Assistance (18 | 17.1%), Accommodation & Food Services (15 | 14.3%), Manufacturing (10 | 9.5%), and Transportation & Warehousing (6 | 5.7%).
Employment Industries by Sex in Elco borough
The Elco borough industries that see more men than women are Mining, Quarrying, & Extraction (100.0%), Construction (100.0%), and Transportation & Warehousing (100.0%), whereas the industries that tend to have a higher number of women are Finance & Insurance (100.0%), Administrative & Support (100.0%), and Educational Services (100.0%).
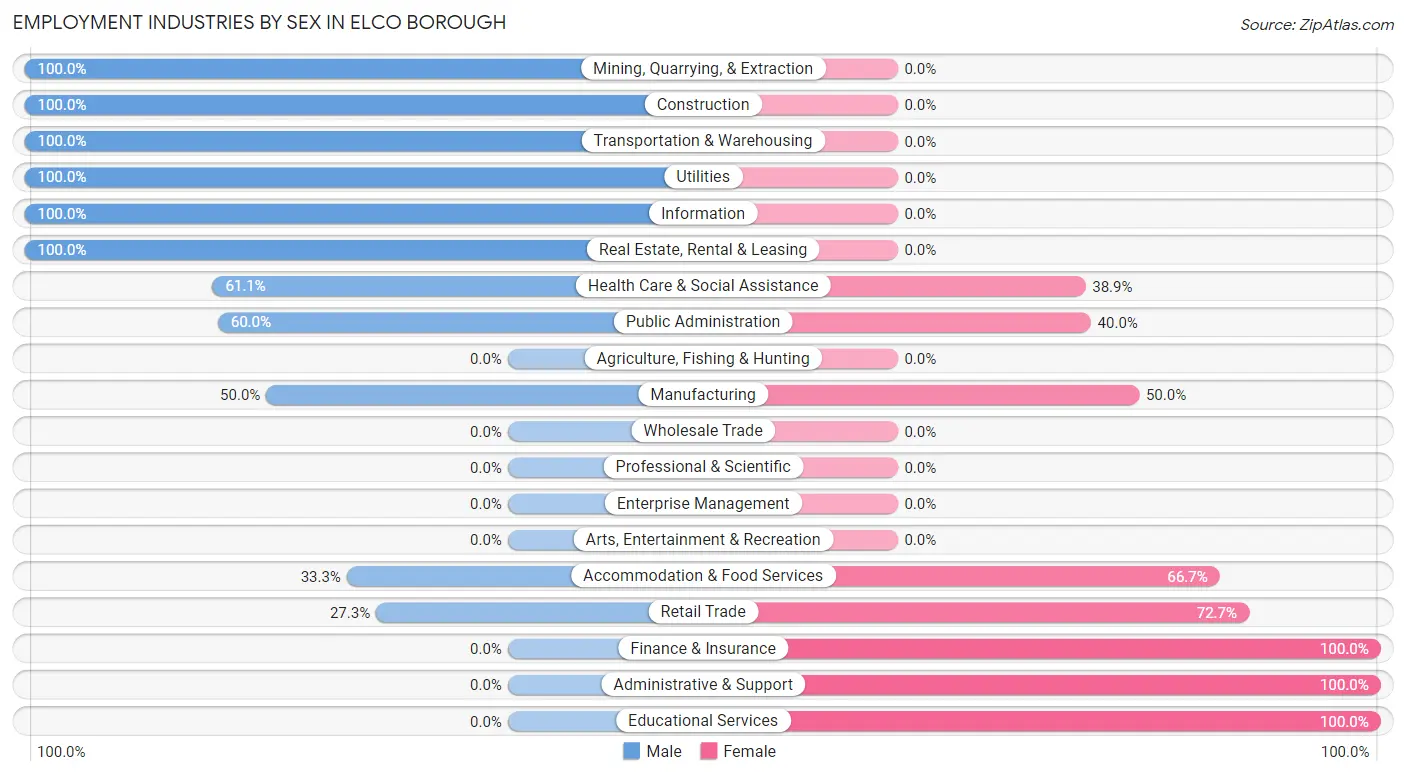
| Industry | Male | Female |
| Agriculture, Fishing & Hunting | 0 (0.0%) | 0 (0.0%) |
| Mining, Quarrying, & Extraction | 2 (100.0%) | 0 (0.0%) |
| Construction | 3 (100.0%) | 0 (0.0%) |
| Manufacturing | 5 (50.0%) | 5 (50.0%) |
| Wholesale Trade | 0 (0.0%) | 0 (0.0%) |
| Retail Trade | 6 (27.3%) | 16 (72.7%) |
| Transportation & Warehousing | 6 (100.0%) | 0 (0.0%) |
| Utilities | 3 (100.0%) | 0 (0.0%) |
| Information | 3 (100.0%) | 0 (0.0%) |
| Finance & Insurance | 0 (0.0%) | 2 (100.0%) |
| Real Estate, Rental & Leasing | 6 (100.0%) | 0 (0.0%) |
| Professional & Scientific | 0 (0.0%) | 0 (0.0%) |
| Enterprise Management | 0 (0.0%) | 0 (0.0%) |
| Administrative & Support | 0 (0.0%) | 3 (100.0%) |
| Educational Services | 0 (0.0%) | 2 (100.0%) |
| Health Care & Social Assistance | 11 (61.1%) | 7 (38.9%) |
| Arts, Entertainment & Recreation | 0 (0.0%) | 0 (0.0%) |
| Accommodation & Food Services | 5 (33.3%) | 10 (66.7%) |
| Public Administration | 3 (60.0%) | 2 (40.0%) |
| Total | 53 (50.5%) | 52 (49.5%) |
Education in Elco borough
School Enrollment in Elco borough
The most common levels of schooling among the 49 students in Elco borough are high school (22 | 44.9%), college / undergraduate (10 | 20.4%), and elementary school (9 | 18.4%).
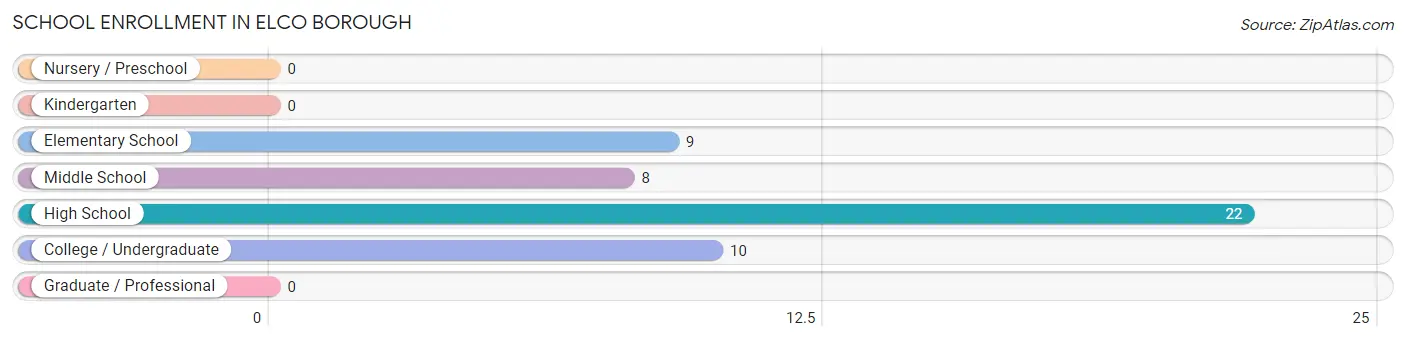
| School Level | # Students | % Students |
| Nursery / Preschool | 0 | 0.0% |
| Kindergarten | 0 | 0.0% |
| Elementary School | 9 | 18.4% |
| Middle School | 8 | 16.3% |
| High School | 22 | 44.9% |
| College / Undergraduate | 10 | 20.4% |
| Graduate / Professional | 0 | 0.0% |
| Total | 49 | 100.0% |
School Enrollment by Age by Funding Source in Elco borough
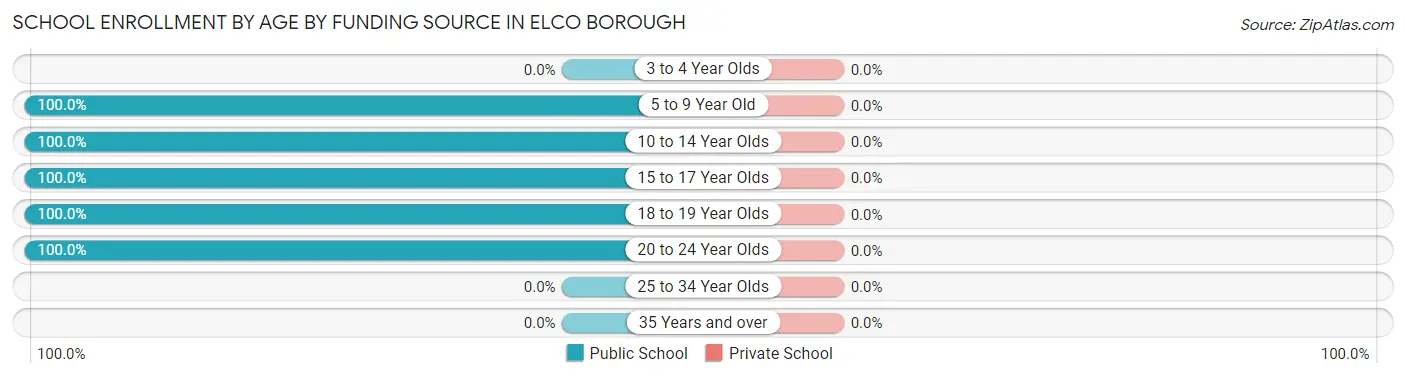
| Age Bracket | Public School | Private School |
| 3 to 4 Year Olds | 0 (0.0%) | 0 (0.0%) |
| 5 to 9 Year Old | 9 (100.0%) | 0 (0.0%) |
| 10 to 14 Year Olds | 2 (100.0%) | 0 (0.0%) |
| 15 to 17 Year Olds | 25 (100.0%) | 0 (0.0%) |
| 18 to 19 Year Olds | 6 (100.0%) | 0 (0.0%) |
| 20 to 24 Year Olds | 7 (100.0%) | 0 (0.0%) |
| 25 to 34 Year Olds | 0 (0.0%) | 0 (0.0%) |
| 35 Years and over | 0 (0.0%) | 0 (0.0%) |
| Total | 49 (100.0%) | 0 (0.0%) |
Educational Attainment by Field of Study in Elco borough
Bio, nature & agricultural (16 | 37.2%), physical & health sciences (14 | 32.6%), science & technology (11 | 25.6%), and education (2 | 4.6%) are the most common fields of study among 43 individuals in Elco borough who have obtained a bachelor's degree or higher.
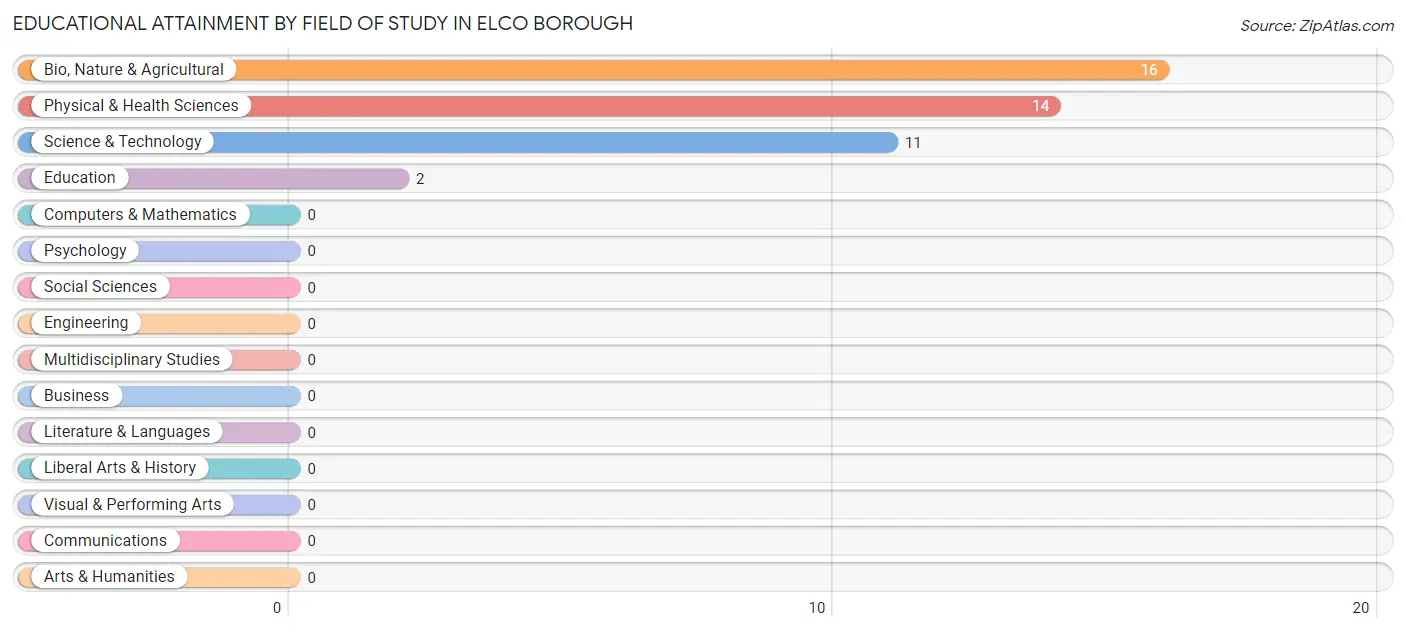
| Field of Study | # Graduates | % Graduates |
| Computers & Mathematics | 0 | 0.0% |
| Bio, Nature & Agricultural | 16 | 37.2% |
| Physical & Health Sciences | 14 | 32.6% |
| Psychology | 0 | 0.0% |
| Social Sciences | 0 | 0.0% |
| Engineering | 0 | 0.0% |
| Multidisciplinary Studies | 0 | 0.0% |
| Science & Technology | 11 | 25.6% |
| Business | 0 | 0.0% |
| Education | 2 | 4.6% |
| Literature & Languages | 0 | 0.0% |
| Liberal Arts & History | 0 | 0.0% |
| Visual & Performing Arts | 0 | 0.0% |
| Communications | 0 | 0.0% |
| Arts & Humanities | 0 | 0.0% |
| Total | 43 | 100.0% |
Transportation & Commute in Elco borough
Vehicle Availability by Sex in Elco borough
The most prevalent vehicle ownership categories in Elco borough are males with 2 vehicles (30, accounting for 56.6%) and females with 2 vehicles (17, making up 57.7%).
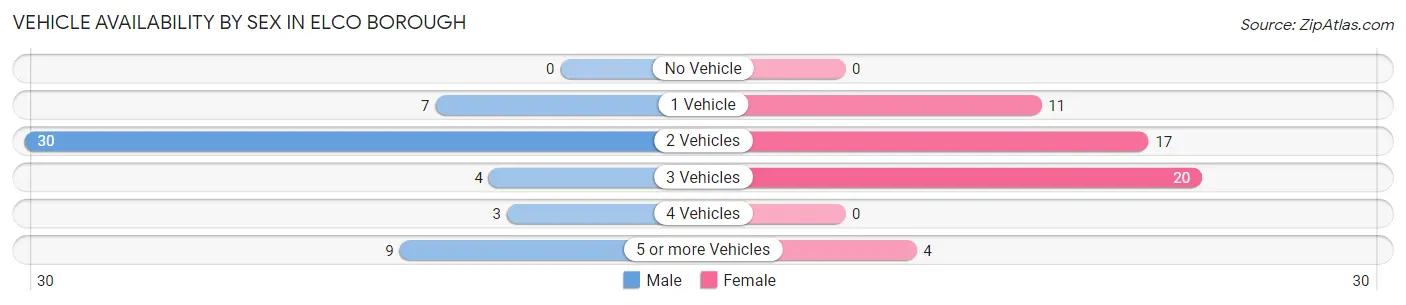
| Vehicles Available | Male | Female |
| No Vehicle | 0 (0.0%) | 0 (0.0%) |
| 1 Vehicle | 7 (13.2%) | 11 (21.1%) |
| 2 Vehicles | 30 (56.6%) | 17 (32.7%) |
| 3 Vehicles | 4 (7.5%) | 20 (38.5%) |
| 4 Vehicles | 3 (5.7%) | 0 (0.0%) |
| 5 or more Vehicles | 9 (17.0%) | 4 (7.7%) |
| Total | 53 (100.0%) | 52 (100.0%) |
Commute Time in Elco borough
The most frequently occuring commute durations in Elco borough are 25 to 29 minutes (16 commuters, 16.5%), 20 to 24 minutes (15 commuters, 15.5%), and 10 to 14 minutes (13 commuters, 13.4%).
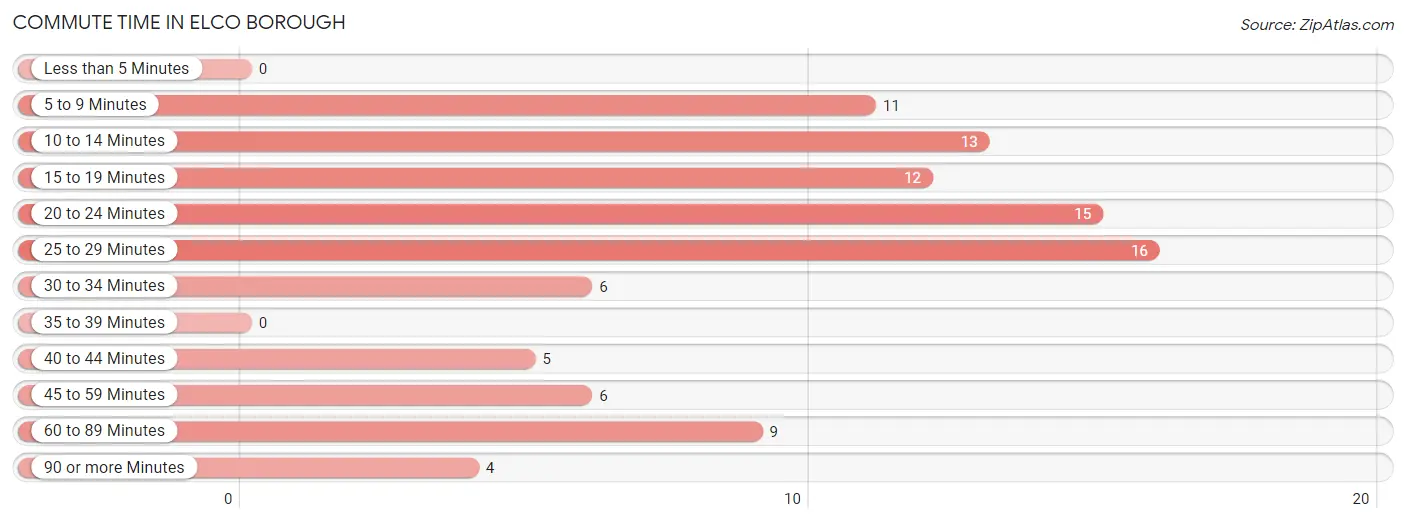
| Commute Time | # Commuters | % Commuters |
| Less than 5 Minutes | 0 | 0.0% |
| 5 to 9 Minutes | 11 | 11.3% |
| 10 to 14 Minutes | 13 | 13.4% |
| 15 to 19 Minutes | 12 | 12.4% |
| 20 to 24 Minutes | 15 | 15.5% |
| 25 to 29 Minutes | 16 | 16.5% |
| 30 to 34 Minutes | 6 | 6.2% |
| 35 to 39 Minutes | 0 | 0.0% |
| 40 to 44 Minutes | 5 | 5.1% |
| 45 to 59 Minutes | 6 | 6.2% |
| 60 to 89 Minutes | 9 | 9.3% |
| 90 or more Minutes | 4 | 4.1% |
Commute Time by Sex in Elco borough
The most common commute times in Elco borough are 25 to 29 minutes (13 commuters, 27.7%) for males and 15 to 19 minutes (12 commuters, 24.0%) for females.
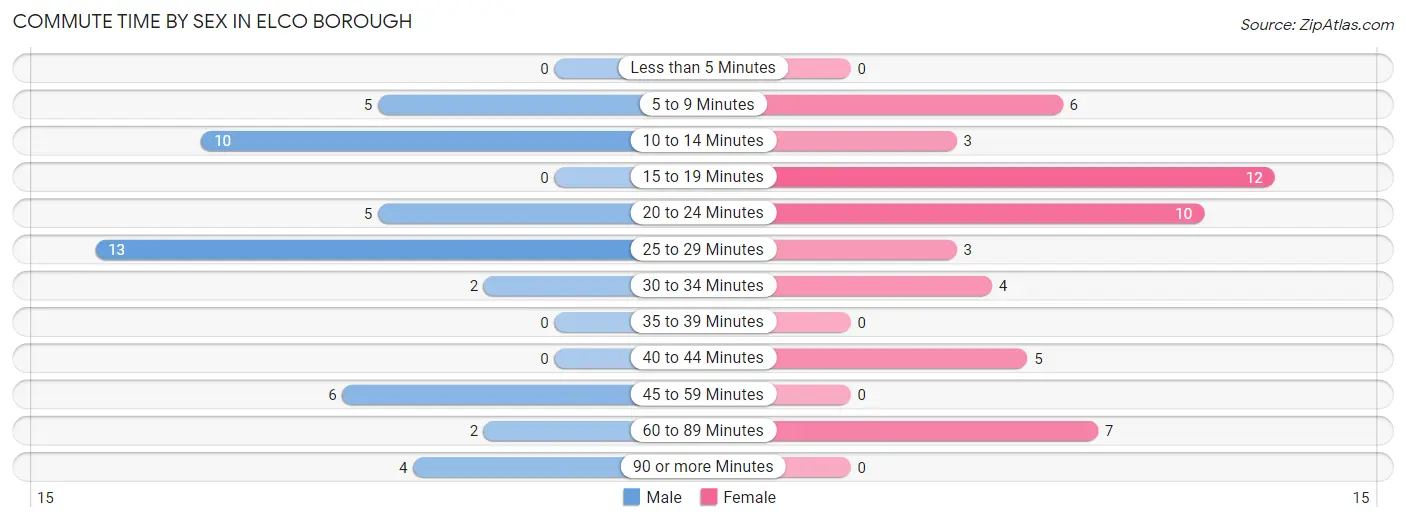
| Commute Time | Male | Female |
| Less than 5 Minutes | 0 (0.0%) | 0 (0.0%) |
| 5 to 9 Minutes | 5 (10.6%) | 6 (12.0%) |
| 10 to 14 Minutes | 10 (21.3%) | 3 (6.0%) |
| 15 to 19 Minutes | 0 (0.0%) | 12 (24.0%) |
| 20 to 24 Minutes | 5 (10.6%) | 10 (20.0%) |
| 25 to 29 Minutes | 13 (27.7%) | 3 (6.0%) |
| 30 to 34 Minutes | 2 (4.3%) | 4 (8.0%) |
| 35 to 39 Minutes | 0 (0.0%) | 0 (0.0%) |
| 40 to 44 Minutes | 0 (0.0%) | 5 (10.0%) |
| 45 to 59 Minutes | 6 (12.8%) | 0 (0.0%) |
| 60 to 89 Minutes | 2 (4.3%) | 7 (14.0%) |
| 90 or more Minutes | 4 (8.5%) | 0 (0.0%) |
Time of Departure to Work by Sex in Elco borough
The most frequent times of departure to work in Elco borough are 8:00 AM to 8:29 AM (11, 23.4%) for males and 12:00 PM to 3:59 PM (12, 24.0%) for females.
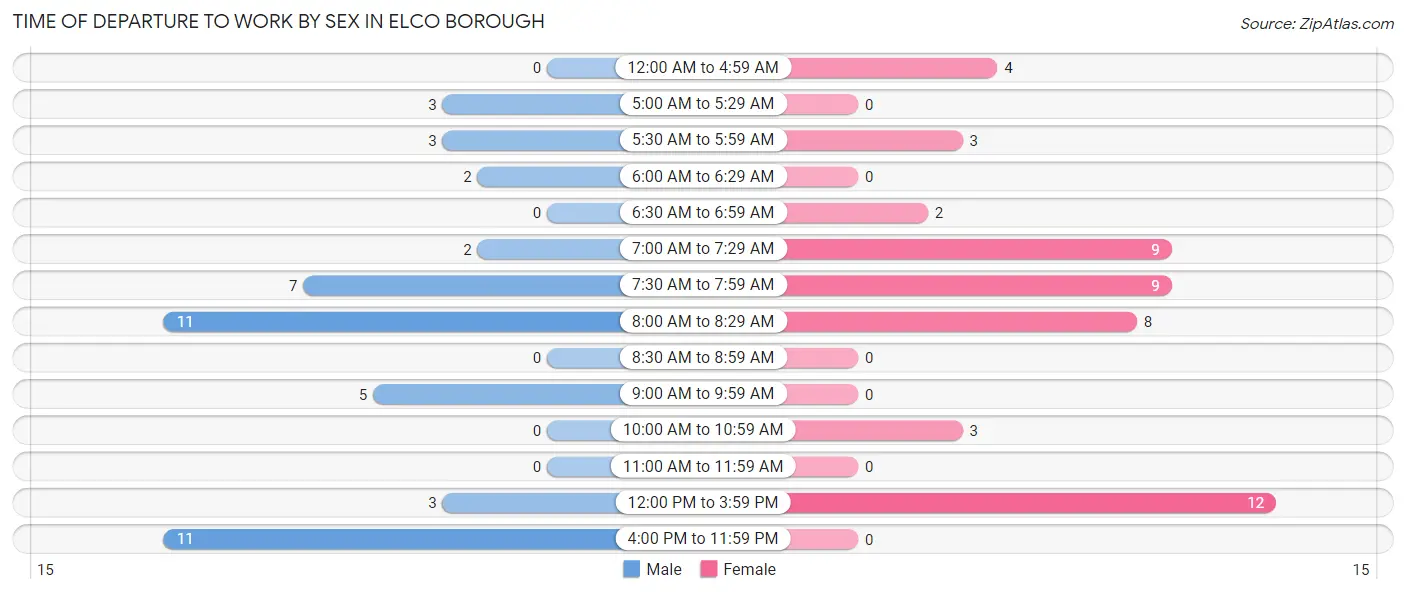
| Time of Departure | Male | Female |
| 12:00 AM to 4:59 AM | 0 (0.0%) | 4 (8.0%) |
| 5:00 AM to 5:29 AM | 3 (6.4%) | 0 (0.0%) |
| 5:30 AM to 5:59 AM | 3 (6.4%) | 3 (6.0%) |
| 6:00 AM to 6:29 AM | 2 (4.3%) | 0 (0.0%) |
| 6:30 AM to 6:59 AM | 0 (0.0%) | 2 (4.0%) |
| 7:00 AM to 7:29 AM | 2 (4.3%) | 9 (18.0%) |
| 7:30 AM to 7:59 AM | 7 (14.9%) | 9 (18.0%) |
| 8:00 AM to 8:29 AM | 11 (23.4%) | 8 (16.0%) |
| 8:30 AM to 8:59 AM | 0 (0.0%) | 0 (0.0%) |
| 9:00 AM to 9:59 AM | 5 (10.6%) | 0 (0.0%) |
| 10:00 AM to 10:59 AM | 0 (0.0%) | 3 (6.0%) |
| 11:00 AM to 11:59 AM | 0 (0.0%) | 0 (0.0%) |
| 12:00 PM to 3:59 PM | 3 (6.4%) | 12 (24.0%) |
| 4:00 PM to 11:59 PM | 11 (23.4%) | 0 (0.0%) |
| Total | 47 (100.0%) | 50 (100.0%) |
Housing Occupancy in Elco borough
Occupancy by Ownership in Elco borough
Of the total 123 dwellings in Elco borough, owner-occupied units account for 89 (72.4%), while renter-occupied units make up 34 (27.6%).
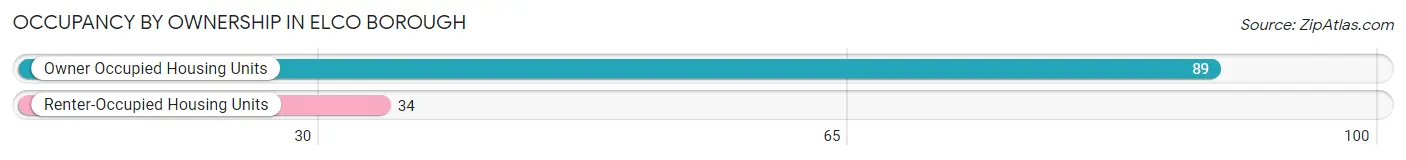
| Occupancy | # Housing Units | % Housing Units |
| Owner Occupied Housing Units | 89 | 72.4% |
| Renter-Occupied Housing Units | 34 | 27.6% |
| Total Occupied Housing Units | 123 | 100.0% |
Occupancy by Household Size in Elco borough
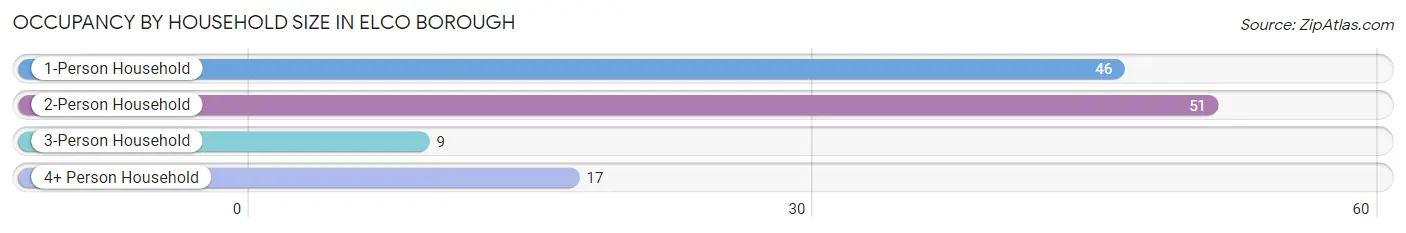
| Household Size | # Housing Units | % Housing Units |
| 1-Person Household | 46 | 37.4% |
| 2-Person Household | 51 | 41.5% |
| 3-Person Household | 9 | 7.3% |
| 4+ Person Household | 17 | 13.8% |
| Total Housing Units | 123 | 100.0% |
Occupancy by Ownership by Household Size in Elco borough
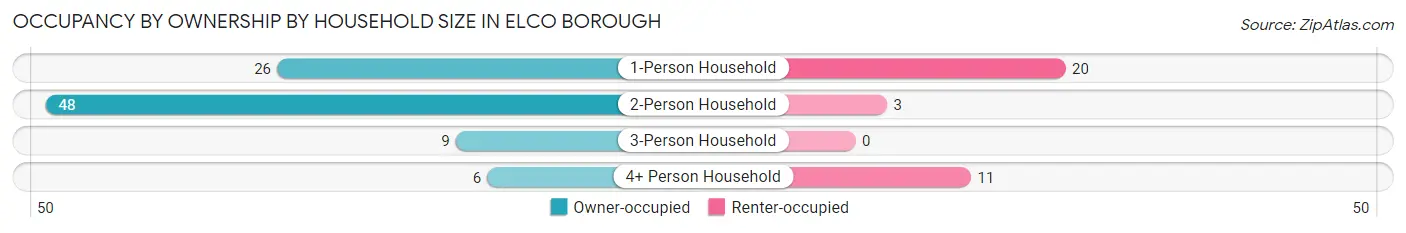
| Household Size | Owner-occupied | Renter-occupied |
| 1-Person Household | 26 (56.5%) | 20 (43.5%) |
| 2-Person Household | 48 (94.1%) | 3 (5.9%) |
| 3-Person Household | 9 (100.0%) | 0 (0.0%) |
| 4+ Person Household | 6 (35.3%) | 11 (64.7%) |
| Total Housing Units | 89 (72.4%) | 34 (27.6%) |
Occupancy by Educational Attainment in Elco borough
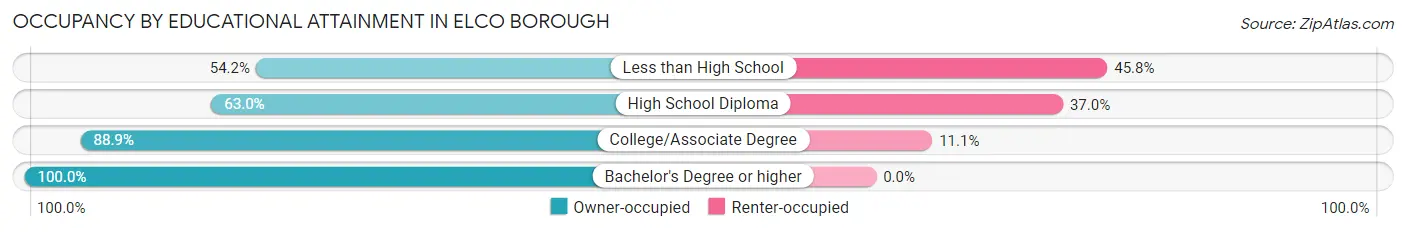
| Household Size | Owner-occupied | Renter-occupied |
| Less than High School | 13 (54.2%) | 11 (45.8%) |
| High School Diploma | 34 (63.0%) | 20 (37.0%) |
| College/Associate Degree | 24 (88.9%) | 3 (11.1%) |
| Bachelor's Degree or higher | 18 (100.0%) | 0 (0.0%) |
Occupancy by Age of Householder in Elco borough
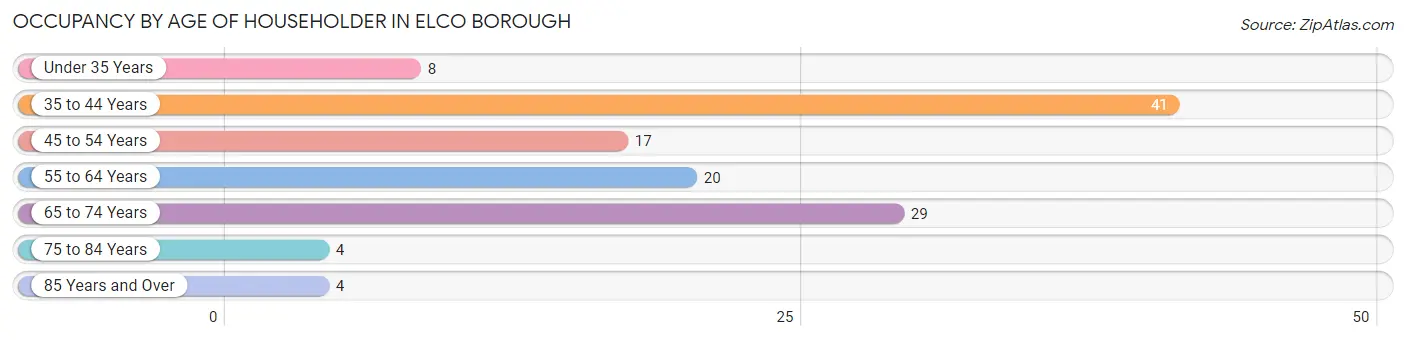
| Age Bracket | # Households | % Households |
| Under 35 Years | 8 | 6.5% |
| 35 to 44 Years | 41 | 33.3% |
| 45 to 54 Years | 17 | 13.8% |
| 55 to 64 Years | 20 | 16.3% |
| 65 to 74 Years | 29 | 23.6% |
| 75 to 84 Years | 4 | 3.3% |
| 85 Years and Over | 4 | 3.3% |
| Total | 123 | 100.0% |
Housing Finances in Elco borough
Median Income by Occupancy in Elco borough
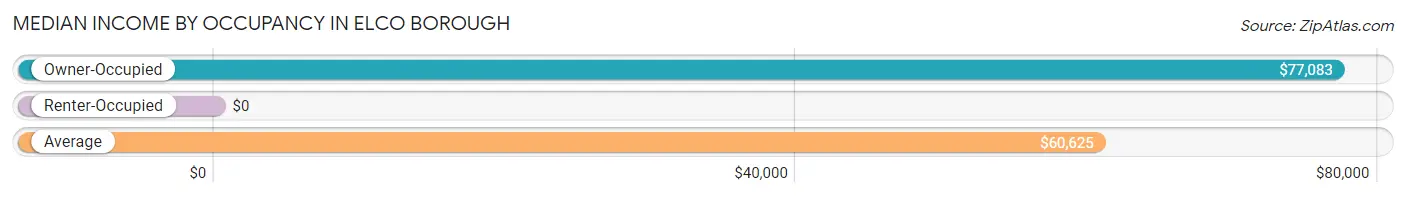
| Occupancy Type | # Households | Median Income |
| Owner-Occupied | 89 (72.4%) | $77,083 |
| Renter-Occupied | 34 (27.6%) | $0 |
| Average | 123 (100.0%) | $60,625 |
Occupancy by Householder Income Bracket in Elco borough
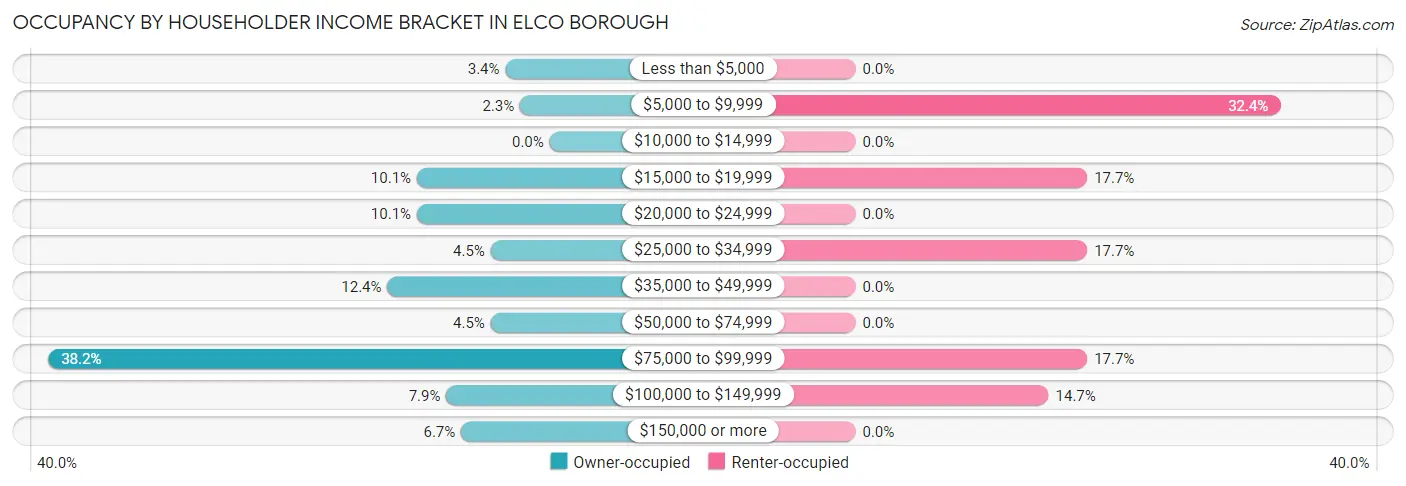
| Income Bracket | Owner-occupied | Renter-occupied |
| Less than $5,000 | 3 (3.4%) | 0 (0.0%) |
| $5,000 to $9,999 | 2 (2.2%) | 11 (32.4%) |
| $10,000 to $14,999 | 0 (0.0%) | 0 (0.0%) |
| $15,000 to $19,999 | 9 (10.1%) | 6 (17.6%) |
| $20,000 to $24,999 | 9 (10.1%) | 0 (0.0%) |
| $25,000 to $34,999 | 4 (4.5%) | 6 (17.6%) |
| $35,000 to $49,999 | 11 (12.4%) | 0 (0.0%) |
| $50,000 to $74,999 | 4 (4.5%) | 0 (0.0%) |
| $75,000 to $99,999 | 34 (38.2%) | 6 (17.6%) |
| $100,000 to $149,999 | 7 (7.9%) | 5 (14.7%) |
| $150,000 or more | 6 (6.7%) | 0 (0.0%) |
| Total | 89 (100.0%) | 34 (100.0%) |
Monthly Housing Cost Tiers in Elco borough
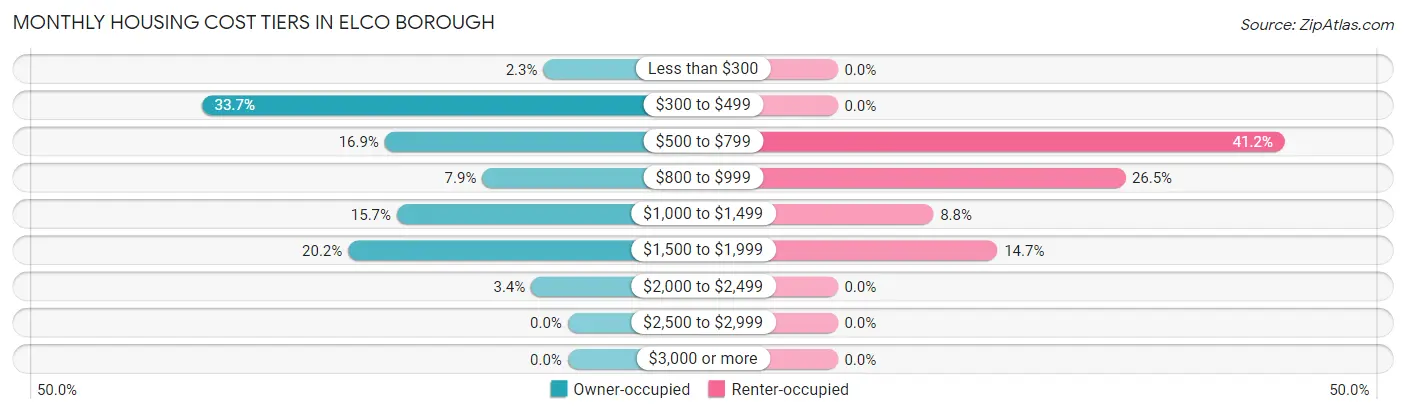
| Monthly Cost | Owner-occupied | Renter-occupied |
| Less than $300 | 2 (2.2%) | 0 (0.0%) |
| $300 to $499 | 30 (33.7%) | 0 (0.0%) |
| $500 to $799 | 15 (16.9%) | 14 (41.2%) |
| $800 to $999 | 7 (7.9%) | 9 (26.5%) |
| $1,000 to $1,499 | 14 (15.7%) | 3 (8.8%) |
| $1,500 to $1,999 | 18 (20.2%) | 5 (14.7%) |
| $2,000 to $2,499 | 3 (3.4%) | 0 (0.0%) |
| $2,500 to $2,999 | 0 (0.0%) | 0 (0.0%) |
| $3,000 or more | 0 (0.0%) | 0 (0.0%) |
| Total | 89 (100.0%) | 34 (100.0%) |
Physical Housing Characteristics in Elco borough
Housing Structures in Elco borough
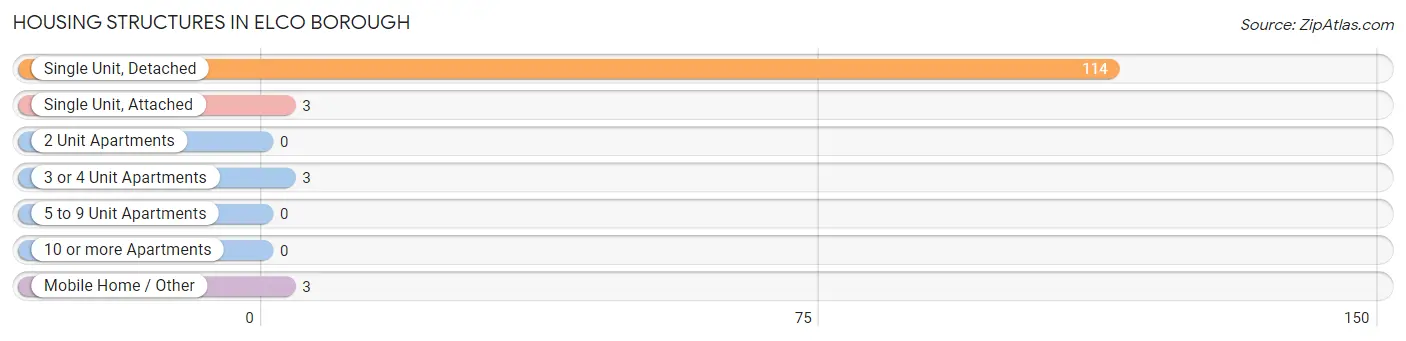
| Structure Type | # Housing Units | % Housing Units |
| Single Unit, Detached | 114 | 92.7% |
| Single Unit, Attached | 3 | 2.4% |
| 2 Unit Apartments | 0 | 0.0% |
| 3 or 4 Unit Apartments | 3 | 2.4% |
| 5 to 9 Unit Apartments | 0 | 0.0% |
| 10 or more Apartments | 0 | 0.0% |
| Mobile Home / Other | 3 | 2.4% |
| Total | 123 | 100.0% |
Housing Structures by Occupancy in Elco borough
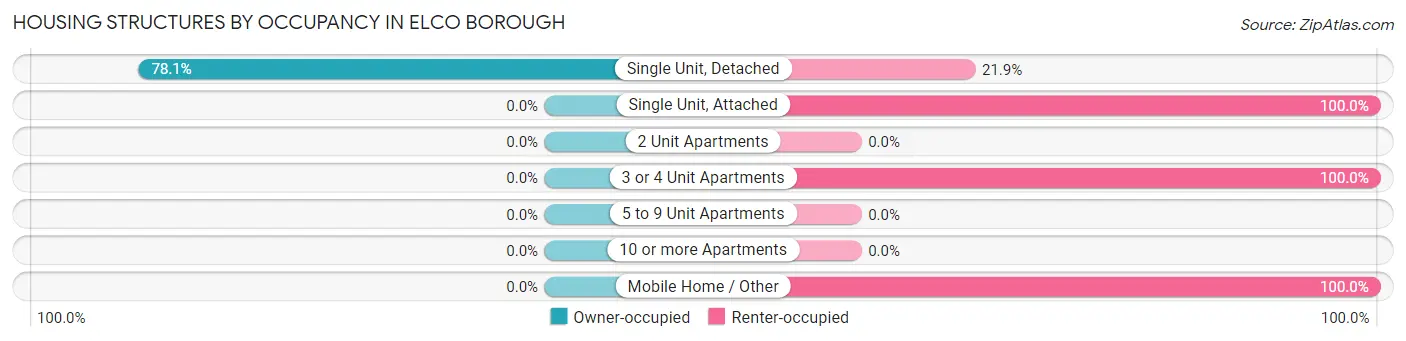
| Structure Type | Owner-occupied | Renter-occupied |
| Single Unit, Detached | 89 (78.1%) | 25 (21.9%) |
| Single Unit, Attached | 0 (0.0%) | 3 (100.0%) |
| 2 Unit Apartments | 0 (0.0%) | 0 (0.0%) |
| 3 or 4 Unit Apartments | 0 (0.0%) | 3 (100.0%) |
| 5 to 9 Unit Apartments | 0 (0.0%) | 0 (0.0%) |
| 10 or more Apartments | 0 (0.0%) | 0 (0.0%) |
| Mobile Home / Other | 0 (0.0%) | 3 (100.0%) |
| Total | 89 (72.4%) | 34 (27.6%) |
Housing Structures by Number of Rooms in Elco borough
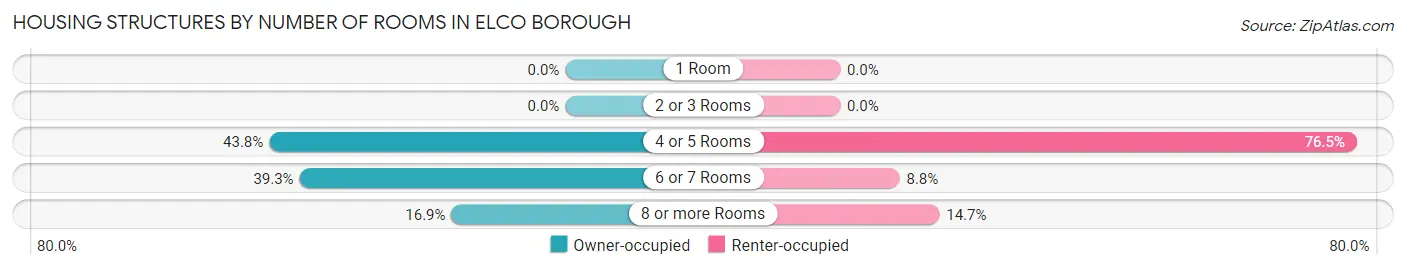
| Number of Rooms | Owner-occupied | Renter-occupied |
| 1 Room | 0 (0.0%) | 0 (0.0%) |
| 2 or 3 Rooms | 0 (0.0%) | 0 (0.0%) |
| 4 or 5 Rooms | 39 (43.8%) | 26 (76.5%) |
| 6 or 7 Rooms | 35 (39.3%) | 3 (8.8%) |
| 8 or more Rooms | 15 (16.9%) | 5 (14.7%) |
| Total | 89 (100.0%) | 34 (100.0%) |
Housing Structure by Heating Type in Elco borough
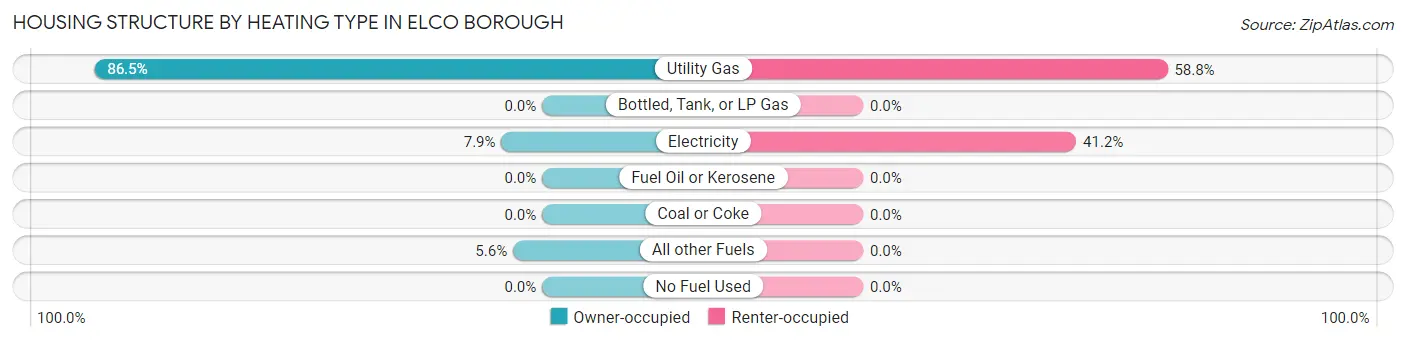
| Heating Type | Owner-occupied | Renter-occupied |
| Utility Gas | 77 (86.5%) | 20 (58.8%) |
| Bottled, Tank, or LP Gas | 0 (0.0%) | 0 (0.0%) |
| Electricity | 7 (7.9%) | 14 (41.2%) |
| Fuel Oil or Kerosene | 0 (0.0%) | 0 (0.0%) |
| Coal or Coke | 0 (0.0%) | 0 (0.0%) |
| All other Fuels | 5 (5.6%) | 0 (0.0%) |
| No Fuel Used | 0 (0.0%) | 0 (0.0%) |
| Total | 89 (100.0%) | 34 (100.0%) |
Household Vehicle Usage in Elco borough
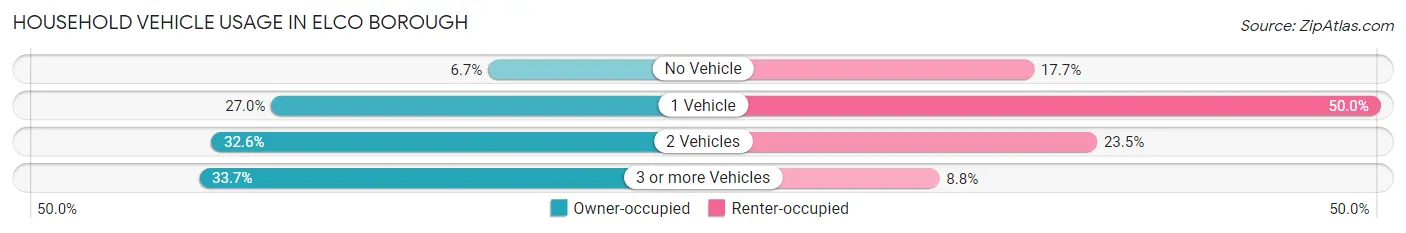
| Vehicles per Household | Owner-occupied | Renter-occupied |
| No Vehicle | 6 (6.7%) | 6 (17.6%) |
| 1 Vehicle | 24 (27.0%) | 17 (50.0%) |
| 2 Vehicles | 29 (32.6%) | 8 (23.5%) |
| 3 or more Vehicles | 30 (33.7%) | 3 (8.8%) |
| Total | 89 (100.0%) | 34 (100.0%) |
Real Estate & Mortgages in Elco borough
Real Estate and Mortgage Overview in Elco borough
| Characteristic | Without Mortgage | With Mortgage |
| Housing Units | 48 | 41 |
| Median Property Value | $90,000 | $312,500 |
| Median Household Income | - | - |
| Monthly Housing Costs | $471 | $0 |
| Real Estate Taxes | $933 | $0 |
Property Value by Mortgage Status in Elco borough
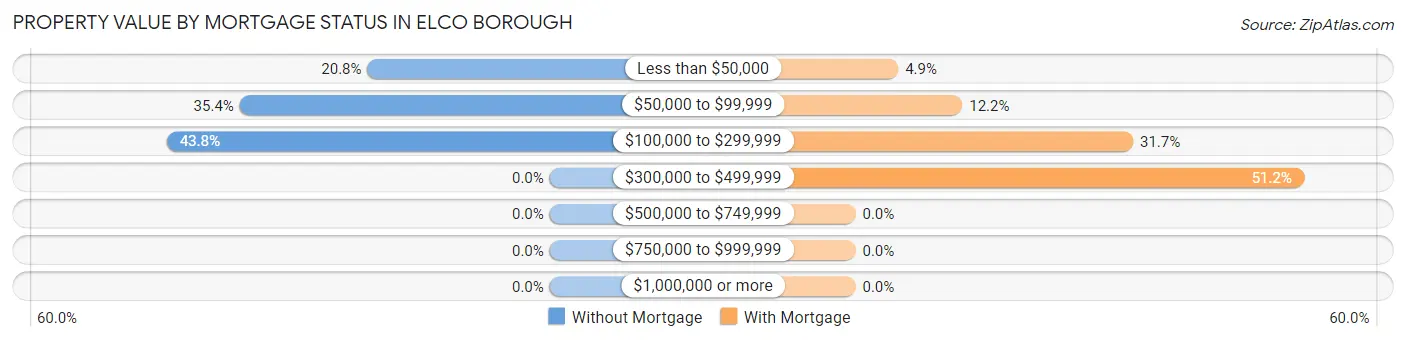
| Property Value | Without Mortgage | With Mortgage |
| Less than $50,000 | 10 (20.8%) | 2 (4.9%) |
| $50,000 to $99,999 | 17 (35.4%) | 5 (12.2%) |
| $100,000 to $299,999 | 21 (43.8%) | 13 (31.7%) |
| $300,000 to $499,999 | 0 (0.0%) | 21 (51.2%) |
| $500,000 to $749,999 | 0 (0.0%) | 0 (0.0%) |
| $750,000 to $999,999 | 0 (0.0%) | 0 (0.0%) |
| $1,000,000 or more | 0 (0.0%) | 0 (0.0%) |
| Total | 48 (100.0%) | 41 (100.0%) |
Household Income by Mortgage Status in Elco borough
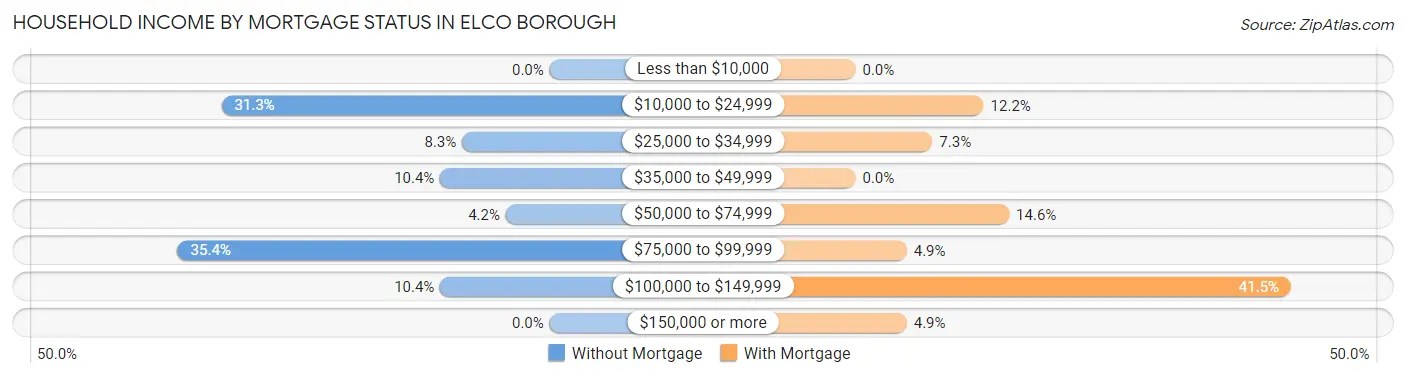
| Household Income | Without Mortgage | With Mortgage |
| Less than $10,000 | 0 (0.0%) | 0 (0.0%) |
| $10,000 to $24,999 | 15 (31.2%) | 5 (12.2%) |
| $25,000 to $34,999 | 4 (8.3%) | 3 (7.3%) |
| $35,000 to $49,999 | 5 (10.4%) | 0 (0.0%) |
| $50,000 to $74,999 | 2 (4.2%) | 6 (14.6%) |
| $75,000 to $99,999 | 17 (35.4%) | 2 (4.9%) |
| $100,000 to $149,999 | 5 (10.4%) | 17 (41.5%) |
| $150,000 or more | 0 (0.0%) | 2 (4.9%) |
| Total | 48 (100.0%) | 41 (100.0%) |
Property Value to Household Income Ratio in Elco borough
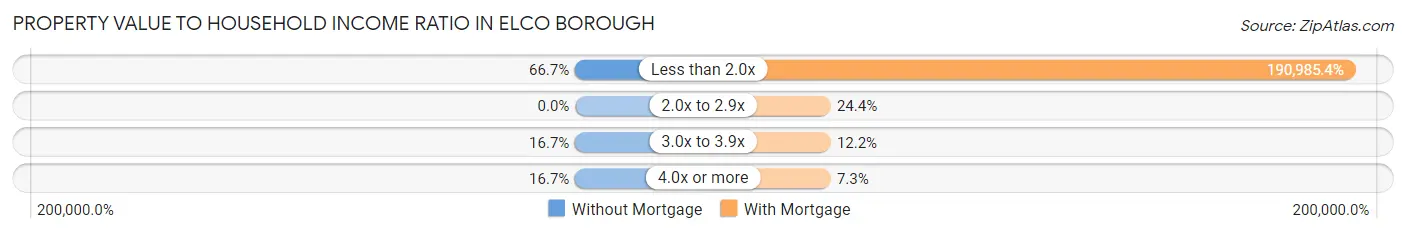
| Value-to-Income Ratio | Without Mortgage | With Mortgage |
| Less than 2.0x | 32 (66.7%) | 78,304 (190,985.4%) |
| 2.0x to 2.9x | 0 (0.0%) | 10 (24.4%) |
| 3.0x to 3.9x | 8 (16.7%) | 5 (12.2%) |
| 4.0x or more | 8 (16.7%) | 3 (7.3%) |
| Total | 48 (100.0%) | 41 (100.0%) |
Real Estate Taxes by Mortgage Status in Elco borough
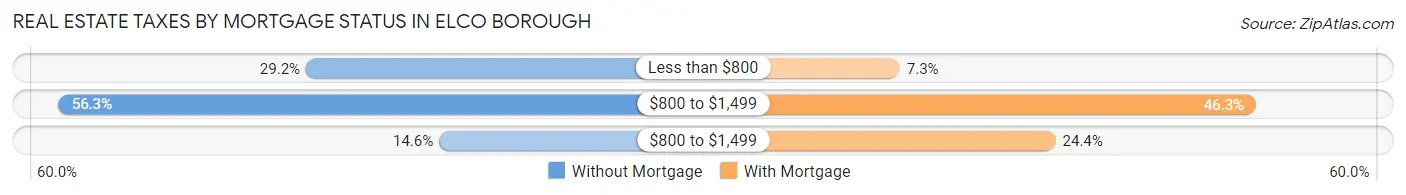
| Property Taxes | Without Mortgage | With Mortgage |
| Less than $800 | 14 (29.2%) | 3 (7.3%) |
| $800 to $1,499 | 27 (56.2%) | 19 (46.3%) |
| $800 to $1,499 | 7 (14.6%) | 10 (24.4%) |
| Total | 48 (100.0%) | 41 (100.0%) |
Health & Disability in Elco borough
Health Insurance Coverage by Age in Elco borough
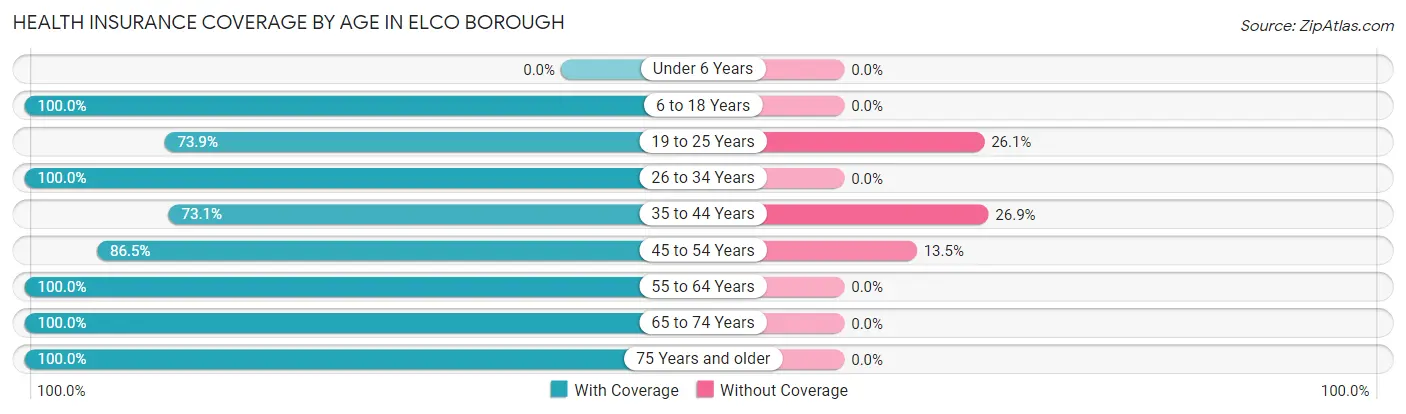
| Age Bracket | With Coverage | Without Coverage |
| Under 6 Years | 0 (0.0%) | 0 (0.0%) |
| 6 to 18 Years | 39 (100.0%) | 0 (0.0%) |
| 19 to 25 Years | 17 (73.9%) | 6 (26.1%) |
| 26 to 34 Years | 5 (100.0%) | 0 (0.0%) |
| 35 to 44 Years | 49 (73.1%) | 18 (26.9%) |
| 45 to 54 Years | 32 (86.5%) | 5 (13.5%) |
| 55 to 64 Years | 42 (100.0%) | 0 (0.0%) |
| 65 to 74 Years | 36 (100.0%) | 0 (0.0%) |
| 75 Years and older | 23 (100.0%) | 0 (0.0%) |
| Total | 243 (89.3%) | 29 (10.7%) |
Health Insurance Coverage by Citizenship Status in Elco borough
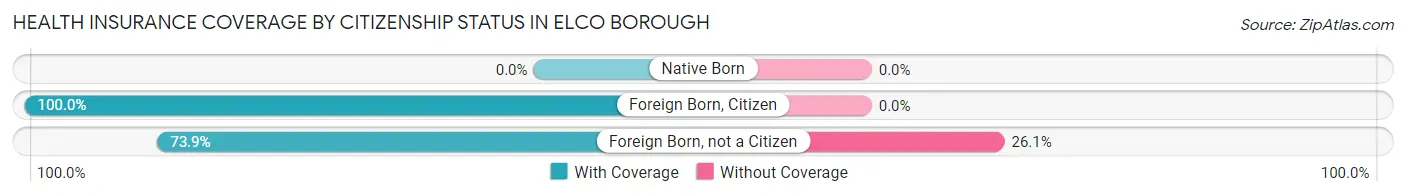
| Citizenship Status | With Coverage | Without Coverage |
| Native Born | 0 (0.0%) | 0 (0.0%) |
| Foreign Born, Citizen | 39 (100.0%) | 0 (0.0%) |
| Foreign Born, not a Citizen | 17 (73.9%) | 6 (26.1%) |
Health Insurance Coverage by Household Income in Elco borough
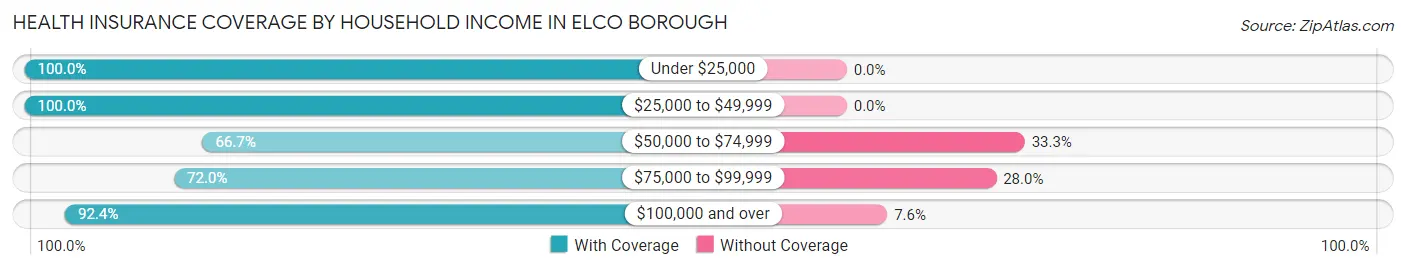
| Household Income | With Coverage | Without Coverage |
| Under $25,000 | 50 (100.0%) | 0 (0.0%) |
| $25,000 to $49,999 | 51 (100.0%) | 0 (0.0%) |
| $50,000 to $74,999 | 6 (66.7%) | 3 (33.3%) |
| $75,000 to $99,999 | 54 (72.0%) | 21 (28.0%) |
| $100,000 and over | 61 (92.4%) | 5 (7.6%) |
Public vs Private Health Insurance Coverage by Age in Elco borough
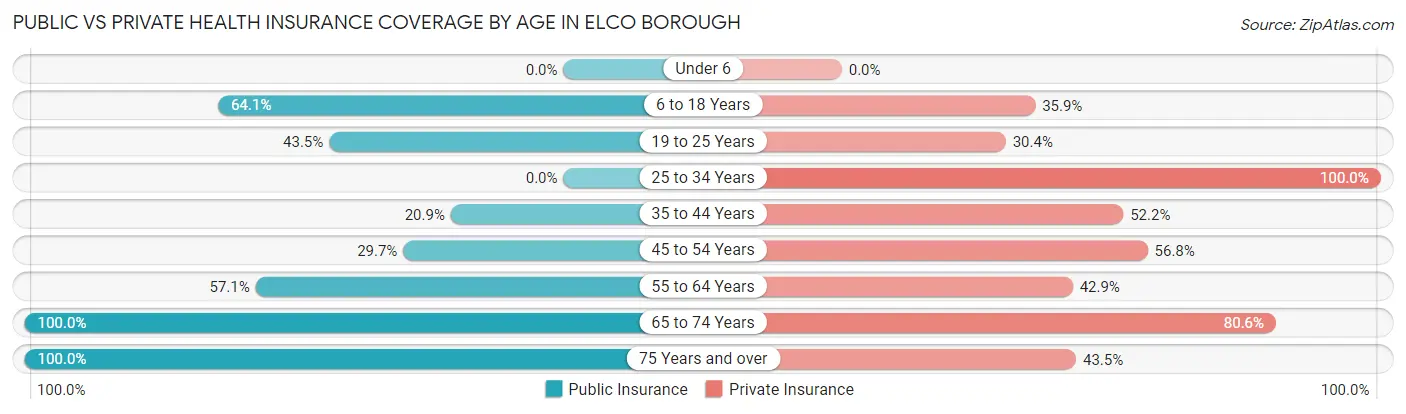
| Age Bracket | Public Insurance | Private Insurance |
| Under 6 | 0 (0.0%) | 0 (0.0%) |
| 6 to 18 Years | 25 (64.1%) | 14 (35.9%) |
| 19 to 25 Years | 10 (43.5%) | 7 (30.4%) |
| 25 to 34 Years | 0 (0.0%) | 5 (100.0%) |
| 35 to 44 Years | 14 (20.9%) | 35 (52.2%) |
| 45 to 54 Years | 11 (29.7%) | 21 (56.8%) |
| 55 to 64 Years | 24 (57.1%) | 18 (42.9%) |
| 65 to 74 Years | 36 (100.0%) | 29 (80.6%) |
| 75 Years and over | 23 (100.0%) | 10 (43.5%) |
| Total | 143 (52.6%) | 139 (51.1%) |
Disability Status by Sex by Age in Elco borough
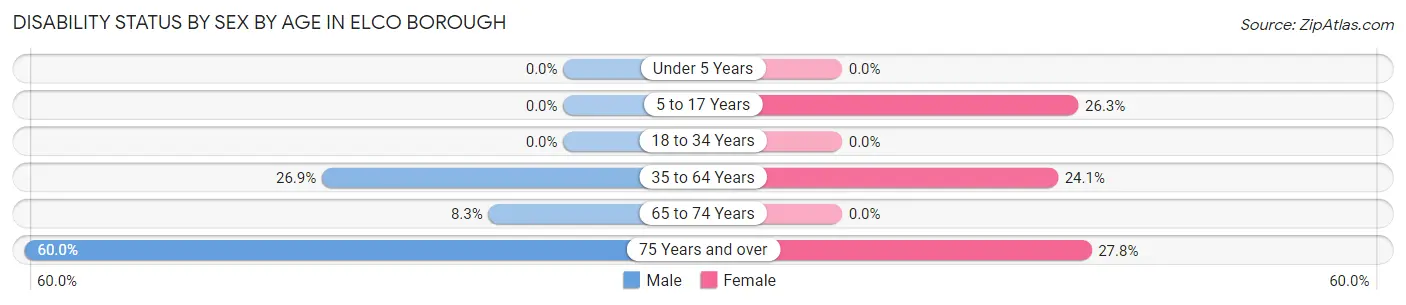
| Age Bracket | Male | Female |
| Under 5 Years | 0 (0.0%) | 0 (0.0%) |
| 5 to 17 Years | 0 (0.0%) | 5 (26.3%) |
| 18 to 34 Years | 0 (0.0%) | 0 (0.0%) |
| 35 to 64 Years | 18 (26.9%) | 19 (24.0%) |
| 65 to 74 Years | 2 (8.3%) | 0 (0.0%) |
| 75 Years and over | 3 (60.0%) | 5 (27.8%) |
Disability Class by Sex by Age in Elco borough
Disability Class: Hearing Difficulty
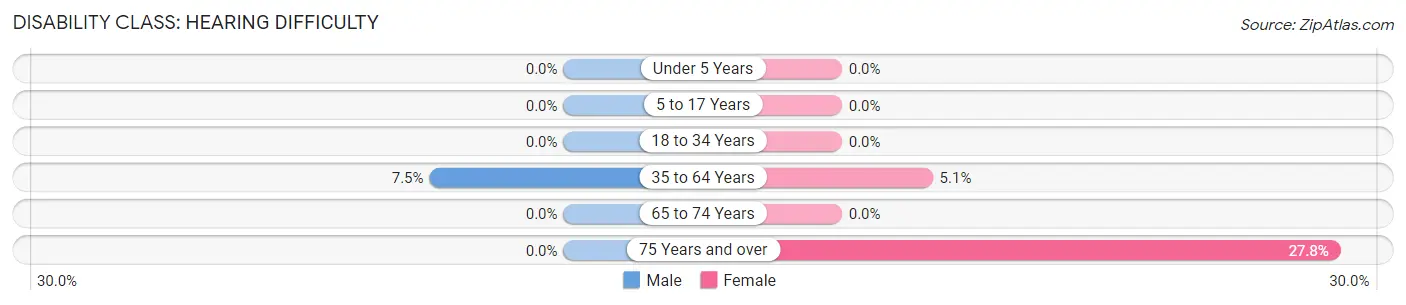
| Age Bracket | Male | Female |
| Under 5 Years | 0 (0.0%) | 0 (0.0%) |
| 5 to 17 Years | 0 (0.0%) | 0 (0.0%) |
| 18 to 34 Years | 0 (0.0%) | 0 (0.0%) |
| 35 to 64 Years | 5 (7.5%) | 4 (5.1%) |
| 65 to 74 Years | 0 (0.0%) | 0 (0.0%) |
| 75 Years and over | 0 (0.0%) | 5 (27.8%) |
Disability Class: Vision Difficulty
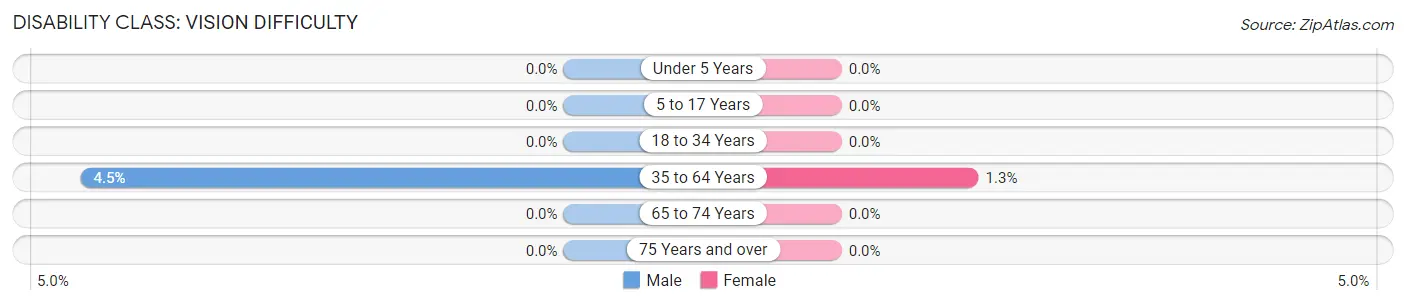
| Age Bracket | Male | Female |
| Under 5 Years | 0 (0.0%) | 0 (0.0%) |
| 5 to 17 Years | 0 (0.0%) | 0 (0.0%) |
| 18 to 34 Years | 0 (0.0%) | 0 (0.0%) |
| 35 to 64 Years | 3 (4.5%) | 1 (1.3%) |
| 65 to 74 Years | 0 (0.0%) | 0 (0.0%) |
| 75 Years and over | 0 (0.0%) | 0 (0.0%) |
Disability Class: Cognitive Difficulty
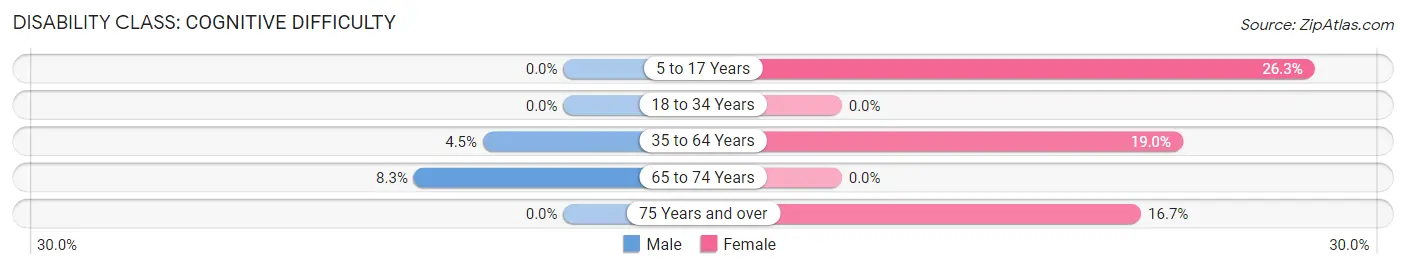
| Age Bracket | Male | Female |
| 5 to 17 Years | 0 (0.0%) | 5 (26.3%) |
| 18 to 34 Years | 0 (0.0%) | 0 (0.0%) |
| 35 to 64 Years | 3 (4.5%) | 15 (19.0%) |
| 65 to 74 Years | 2 (8.3%) | 0 (0.0%) |
| 75 Years and over | 0 (0.0%) | 3 (16.7%) |
Disability Class: Ambulatory Difficulty
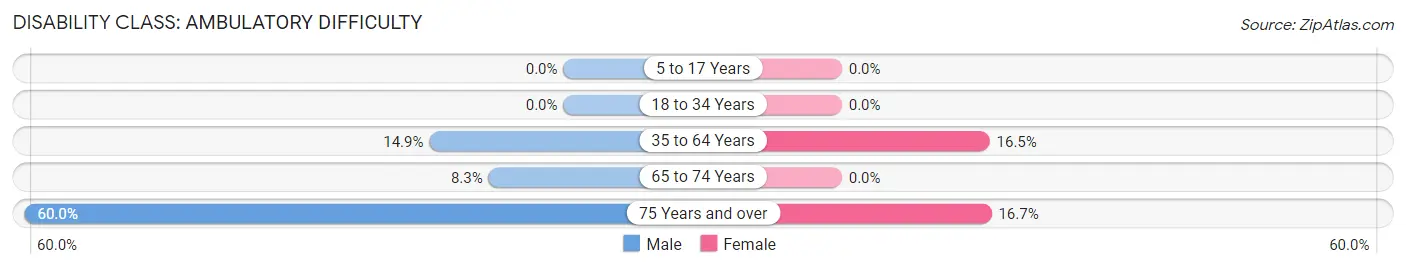
| Age Bracket | Male | Female |
| 5 to 17 Years | 0 (0.0%) | 0 (0.0%) |
| 18 to 34 Years | 0 (0.0%) | 0 (0.0%) |
| 35 to 64 Years | 10 (14.9%) | 13 (16.5%) |
| 65 to 74 Years | 2 (8.3%) | 0 (0.0%) |
| 75 Years and over | 3 (60.0%) | 3 (16.7%) |
Disability Class: Self-Care Difficulty
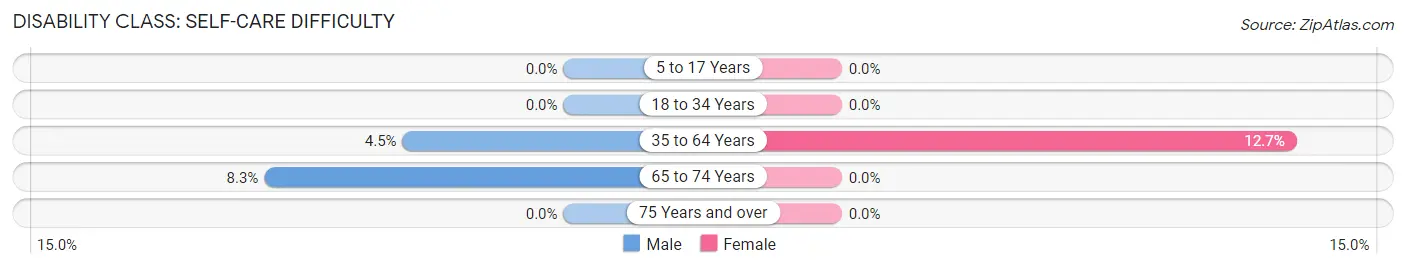
| Age Bracket | Male | Female |
| 5 to 17 Years | 0 (0.0%) | 0 (0.0%) |
| 18 to 34 Years | 0 (0.0%) | 0 (0.0%) |
| 35 to 64 Years | 3 (4.5%) | 10 (12.7%) |
| 65 to 74 Years | 2 (8.3%) | 0 (0.0%) |
| 75 Years and over | 0 (0.0%) | 0 (0.0%) |
Technology Access in Elco borough
Computing Device Access in Elco borough
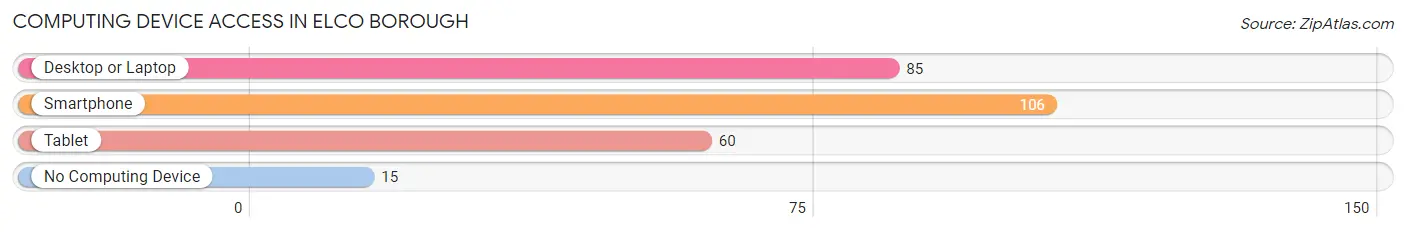
| Device Type | # Households | % Households |
| Desktop or Laptop | 85 | 69.1% |
| Smartphone | 106 | 86.2% |
| Tablet | 60 | 48.8% |
| No Computing Device | 15 | 12.2% |
| Total | 123 | 100.0% |
Internet Access in Elco borough
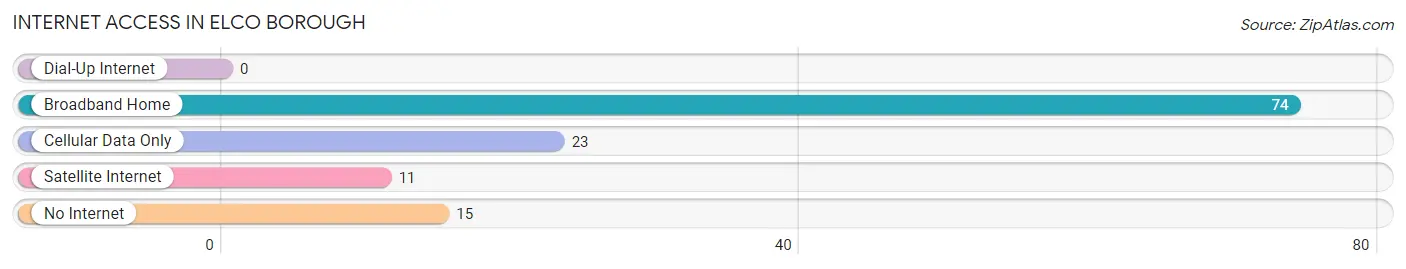
| Internet Type | # Households | % Households |
| Dial-Up Internet | 0 | 0.0% |
| Broadband Home | 74 | 60.2% |
| Cellular Data Only | 23 | 18.7% |
| Satellite Internet | 11 | 8.9% |
| No Internet | 15 | 12.2% |
| Total | 123 | 100.0% |
Elco borough Summary
Elco Borough is a small borough located in Lebanon County, Pennsylvania. It is situated in the southeastern part of the state, approximately 20 miles northeast of Harrisburg. The borough is bordered by East Hanover Township to the north, North Annville Township to the east, South Annville Township to the south, and West Hanover Township to the west. As of the 2010 census, the population of Elco Borough was 1,845.
History
Elco Borough was founded in 1845 by a group of settlers from the nearby town of Annville. The settlers named the borough after the Elco Iron Works, which was located in the area. The iron works was established in 1837 and was the first of its kind in the region. The iron works was a major employer in the area and provided jobs for many of the settlers.
In 1851, the borough was officially incorporated and the first mayor was elected. The first mayor was John W. Miller, who served until 1854. During this time, the borough was primarily an agricultural community, with most of the residents working on farms.
In the late 19th century, the borough began to experience a period of growth and development. The Elco Iron Works was expanded and new businesses began to open in the area. The borough also saw an influx of new residents, many of whom were immigrants from Europe.
By the early 20th century, Elco Borough had become a thriving community. The borough was home to a variety of businesses, including a bank, a hotel, a movie theater, and several stores. The borough also had its own school system and a volunteer fire department.
Geography
Elco Borough is located in southeastern Pennsylvania, approximately 20 miles northeast of Harrisburg. The borough is situated in the Lebanon Valley, which is part of the Ridge and Valley physiographic province. The borough is bordered by East Hanover Township to the north, North Annville Township to the east, South Annville Township to the south, and West Hanover Township to the west.
The borough covers an area of 1.2 square miles and is located at an elevation of 545 feet above sea level. The borough is located in the humid continental climate zone and has four distinct seasons. The average annual temperature is 52 degrees Fahrenheit and the average annual precipitation is 41 inches.
Economy
The economy of Elco Borough is primarily based on agriculture and manufacturing. The borough is home to several farms, which produce a variety of crops, including corn, soybeans, and hay. The borough is also home to several manufacturing companies, which produce a variety of products, including furniture, clothing, and electronics.
The borough also has a thriving retail sector, with several stores and restaurants located in the downtown area. The borough is also home to several banks and financial institutions, which provide banking services to the local community.
Demographics
As of the 2010 census, the population of Elco Borough was 1,845. The population is primarily white (94.3%) and the median age is 43.7 years. The median household income is $50,972 and the median home value is $164,400.
The borough is home to a variety of religious denominations, including Catholic (44.3%), Lutheran (17.2%), and Methodist (14.2%). The borough is also home to a variety of ethnicities, including German (25.2%), Irish (17.2%), and Italian (14.2%).
Conclusion
Elco Borough is a small borough located in Lebanon County, Pennsylvania. It is situated in the southeastern part of the state, approximately 20 miles northeast of Harrisburg. The borough was founded in 1845 and was primarily an agricultural community until the late 19th century. The borough is now home to a variety of businesses, including farms, manufacturing companies, banks, and stores. As of the 2010 census, the population of Elco Borough was 1,845. The population is primarily white and the median age is 43.7 years. The median household income is $50,972 and the median home value is $164,400.
Common Questions
What is Per Capita Income in Elco borough?
Per Capita income in Elco borough is $28,019.
What is the Median Family Income in Elco borough?
Median Family Income in Elco borough is $77,589.
What is the Median Household income in Elco borough?
Median Household Income in Elco borough is $60,625.
What is Income or Wage Gap in Elco borough?
Income or Wage Gap in Elco borough is 50.0%.
Women in Elco borough earn 50.0 cents for every dollar earned by a man.
What is Inequality or Gini Index in Elco borough?
Inequality or Gini Index in Elco borough is 0.40.
What is the Total Population of Elco borough?
Total Population of Elco borough is 272.
What is the Total Male Population of Elco borough?
Total Male Population of Elco borough is 128.
What is the Total Female Population of Elco borough?
Total Female Population of Elco borough is 144.
What is the Ratio of Males per 100 Females in Elco borough?
There are 88.89 Males per 100 Females in Elco borough.
What is the Ratio of Females per 100 Males in Elco borough?
There are 112.50 Females per 100 Males in Elco borough.
What is the Median Population Age in Elco borough?
Median Population Age in Elco borough is 45.4 Years.
What is the Average Family Size in Elco borough
Average Family Size in Elco borough is 2.6 People.
What is the Average Household Size in Elco borough
Average Household Size in Elco borough is 2.0 People.
How Large is the Labor Force in Elco borough?
There are 113 People in the Labor Forcein in Elco borough.
What is the Percentage of People in the Labor Force in Elco borough?
45.7% of People are in the Labor Force in Elco borough.
What is the Unemployment Rate in Elco borough?
Unemployment Rate in Elco borough is 7.1%.