Conashaugh Lakes, PA Map & Demographics
Conashaugh Lakes Map
Conashaugh Lakes Overview
$46,443
PER CAPITA INCOME
$150,568
AVG FAMILY INCOME
0.46
INEQUALITY / GINI INDEX
1,550
TOTAL POPULATION
970
MALE POPULATION
580
FEMALE POPULATION
167.24
MALES / 100 FEMALES
59.79
FEMALES / 100 MALES
48.7
MEDIAN AGE
3.1
AVG FAMILY SIZE
2.4
AVG HOUSEHOLD SIZE
853
LABOR FORCE [ PEOPLE ]
64.4%
PERCENT IN LABOR FORCE
17.7%
UNEMPLOYMENT RATE
Income in Conashaugh Lakes
Income Overview in Conashaugh Lakes
| Characteristic | Number | Measure |
| Per Capita Income | 1,550 | $46,443 |
| Median Family Income | 388 | $150,568 |
| Mean Family Income | 388 | $148,946 |
| Median Household Income | 650 | $0 |
| Mean Household Income | 650 | $113,661 |
| Income Deficit | 388 | $0 |
| Wage / Income Gap (%) | 1,550 | 0.00% |
| Wage / Income Gap ($) | 1,550 | 100.00¢ per $1 |
| Gini / Inequality Index | 1,550 | 0.46 |
Earnings by Sex in Conashaugh Lakes
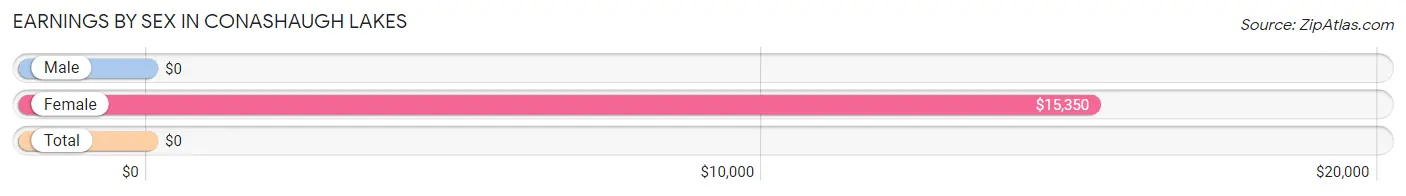
| Sex | Number | Average Earnings |
| Male | 379 (47.1%) | $0 |
| Female | 426 (52.9%) | $15,350 |
| Total | 805 (100.0%) | $0 |
Earnings by Sex by Income Bracket in Conashaugh Lakes
The most common earnings brackets in Conashaugh Lakes are $100,000+ for men (168 | 44.3%) and $7,500 to $9,999 for women (101 | 23.7%).
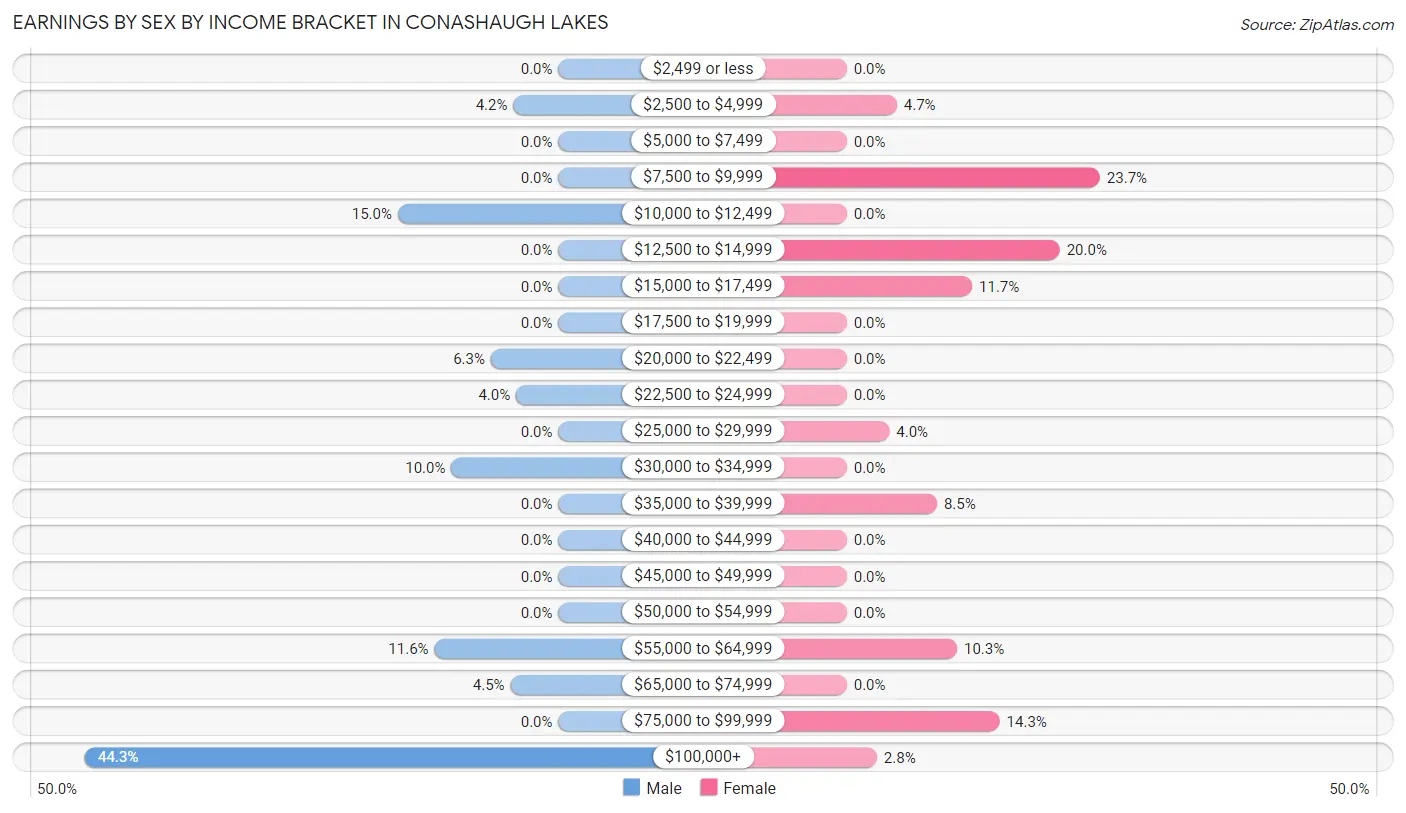
| Income | Male | Female |
| $2,499 or less | 0 (0.0%) | 0 (0.0%) |
| $2,500 to $4,999 | 16 (4.2%) | 20 (4.7%) |
| $5,000 to $7,499 | 0 (0.0%) | 0 (0.0%) |
| $7,500 to $9,999 | 0 (0.0%) | 101 (23.7%) |
| $10,000 to $12,499 | 57 (15.0%) | 0 (0.0%) |
| $12,500 to $14,999 | 0 (0.0%) | 85 (20.0%) |
| $15,000 to $17,499 | 0 (0.0%) | 50 (11.7%) |
| $17,500 to $19,999 | 0 (0.0%) | 0 (0.0%) |
| $20,000 to $22,499 | 24 (6.3%) | 0 (0.0%) |
| $22,500 to $24,999 | 15 (4.0%) | 0 (0.0%) |
| $25,000 to $29,999 | 0 (0.0%) | 17 (4.0%) |
| $30,000 to $34,999 | 38 (10.0%) | 0 (0.0%) |
| $35,000 to $39,999 | 0 (0.0%) | 36 (8.5%) |
| $40,000 to $44,999 | 0 (0.0%) | 0 (0.0%) |
| $45,000 to $49,999 | 0 (0.0%) | 0 (0.0%) |
| $50,000 to $54,999 | 0 (0.0%) | 0 (0.0%) |
| $55,000 to $64,999 | 44 (11.6%) | 44 (10.3%) |
| $65,000 to $74,999 | 17 (4.5%) | 0 (0.0%) |
| $75,000 to $99,999 | 0 (0.0%) | 61 (14.3%) |
| $100,000+ | 168 (44.3%) | 12 (2.8%) |
| Total | 379 (100.0%) | 426 (100.0%) |
Earnings by Sex by Educational Attainment in Conashaugh Lakes
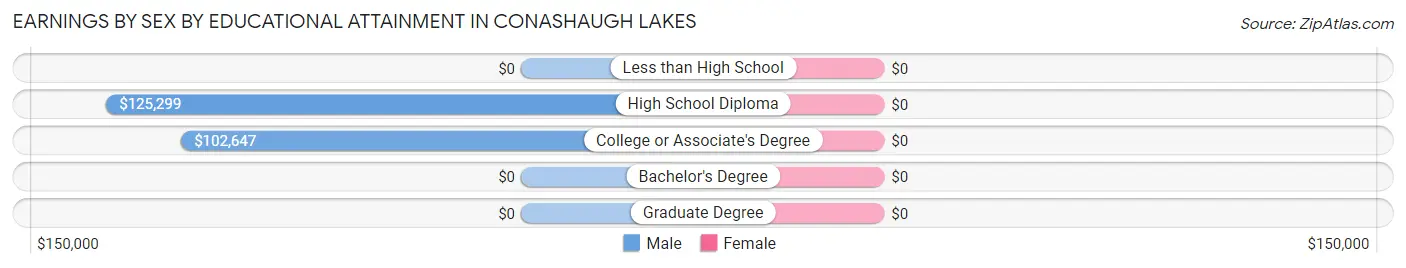
| Educational Attainment | Male Income | Female Income |
| Less than High School | - | - |
| High School Diploma | $125,299 | $0 |
| College or Associate's Degree | $102,647 | $0 |
| Bachelor's Degree | - | - |
| Graduate Degree | - | - |
| Total | - | - |
Family Income in Conashaugh Lakes
Family Income Brackets in Conashaugh Lakes
According to the Conashaugh Lakes family income data, there are 115 families falling into the $200,000+ income range, which is the most common income bracket and makes up 29.6% of all families.
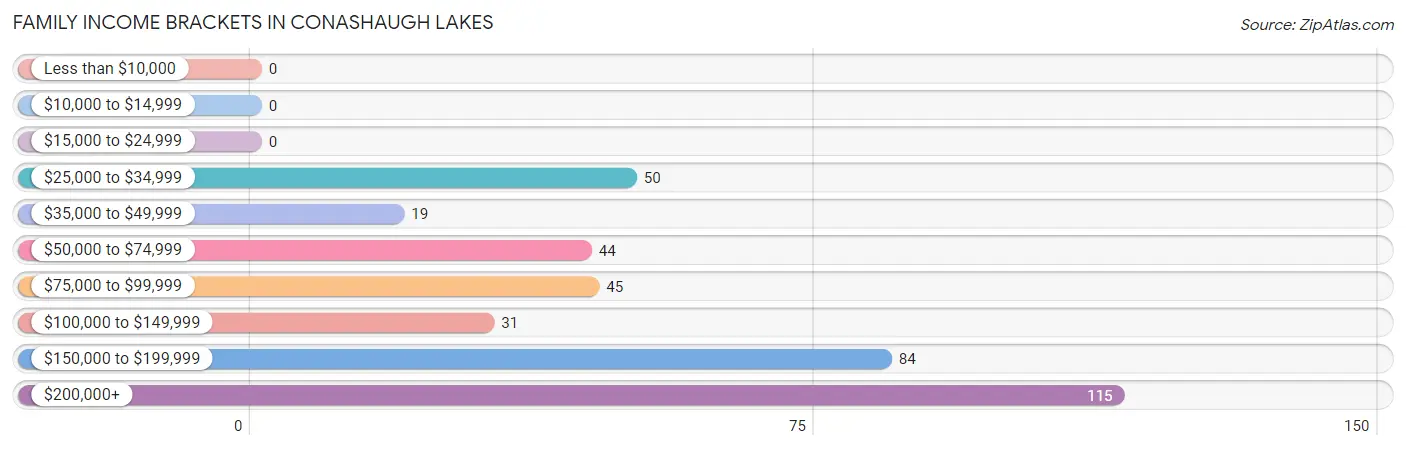
| Income Bracket | # Families | % Families |
| Less than $10,000 | 0 | 0.0% |
| $10,000 to $14,999 | 0 | 0.0% |
| $15,000 to $24,999 | 0 | 0.0% |
| $25,000 to $34,999 | 50 | 12.9% |
| $35,000 to $49,999 | 19 | 4.9% |
| $50,000 to $74,999 | 44 | 11.3% |
| $75,000 to $99,999 | 45 | 11.6% |
| $100,000 to $149,999 | 31 | 8.0% |
| $150,000 to $199,999 | 84 | 21.6% |
| $200,000+ | 115 | 29.6% |
Family Income by Famaliy Size in Conashaugh Lakes
4-person families (114 | 29.4%) account for the highest median family income in Conashaugh Lakes with $250,001 per family, while 4-person families (114 | 29.4%) have the highest median income of $62,500 per family member.
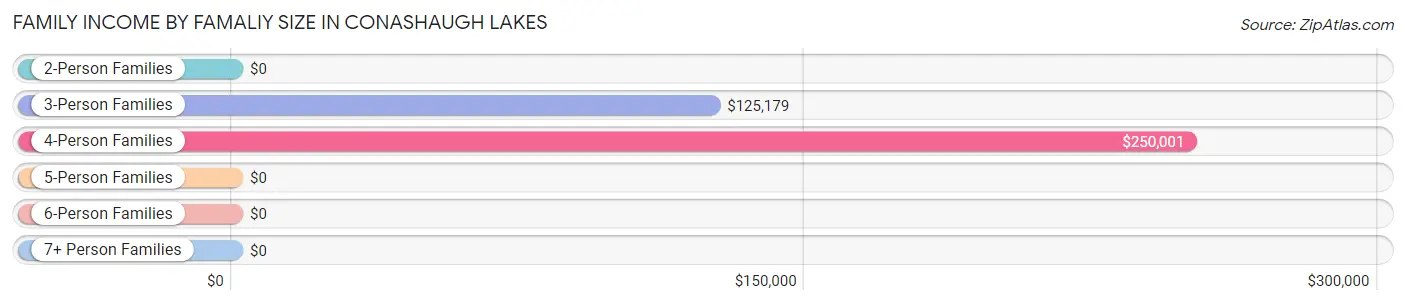
| Income Bracket | # Families | Median Income |
| 2-Person Families | 180 (46.4%) | $0 |
| 3-Person Families | 60 (15.5%) | $125,179 |
| 4-Person Families | 114 (29.4%) | $250,001 |
| 5-Person Families | 19 (4.9%) | $0 |
| 6-Person Families | 0 (0.0%) | $0 |
| 7+ Person Families | 15 (3.9%) | $0 |
| Total | 388 (100.0%) | $150,568 |
Family Income by Number of Earners in Conashaugh Lakes
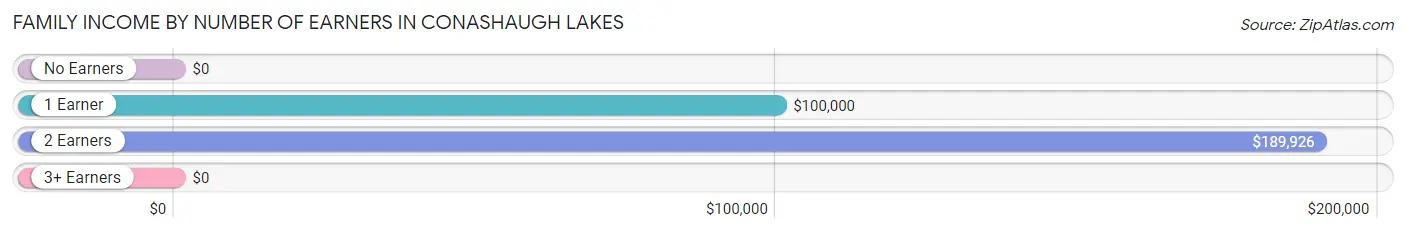
| Number of Earners | # Families | Median Income |
| No Earners | 20 (5.1%) | $0 |
| 1 Earner | 218 (56.2%) | $100,000 |
| 2 Earners | 121 (31.2%) | $189,926 |
| 3+ Earners | 29 (7.5%) | $0 |
| Total | 388 (100.0%) | $150,568 |
Household Income in Conashaugh Lakes
Household Income Brackets in Conashaugh Lakes
With 155 households falling in the category, the $150,000 to $199,999 income range is the most frequent in Conashaugh Lakes, accounting for 23.8% of all households.
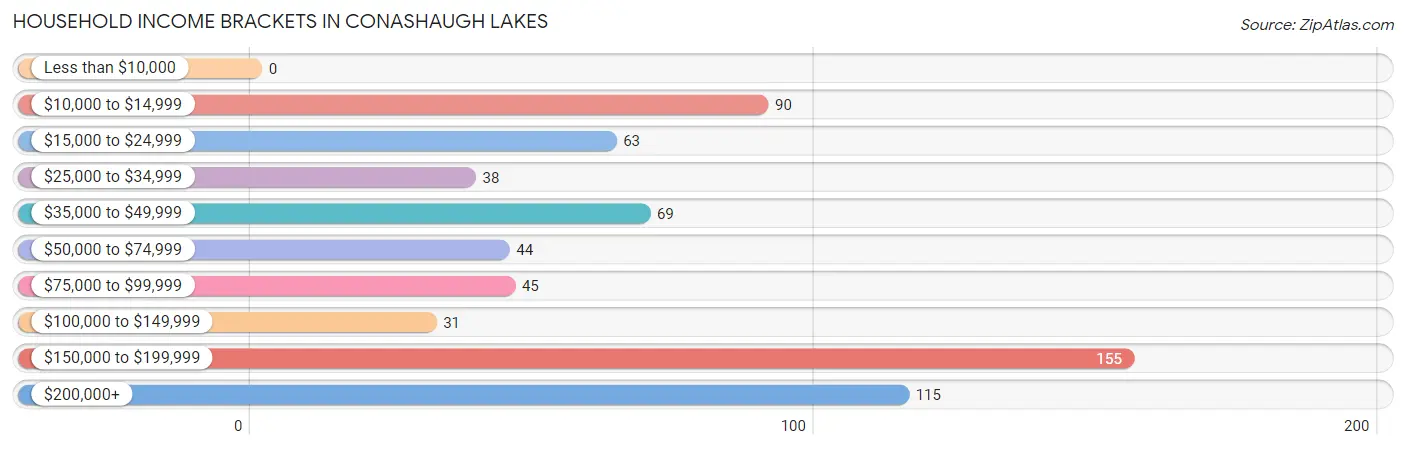
| Income Bracket | # Households | % Households |
| Less than $10,000 | 0 | 0.0% |
| $10,000 to $14,999 | 90 | 13.8% |
| $15,000 to $24,999 | 63 | 9.7% |
| $25,000 to $34,999 | 38 | 5.8% |
| $35,000 to $49,999 | 69 | 10.6% |
| $50,000 to $74,999 | 44 | 6.8% |
| $75,000 to $99,999 | 45 | 6.9% |
| $100,000 to $149,999 | 31 | 4.8% |
| $150,000 to $199,999 | 155 | 23.8% |
| $200,000+ | 115 | 17.7% |
Household Income by Householder Age in Conashaugh Lakes
The median household income in Conashaugh Lakes is $0, with the highest median household income of $180,000 found in the 45 to 64 years age bracket for the primary householder. A total of 290 households (44.6%) fall into this category.
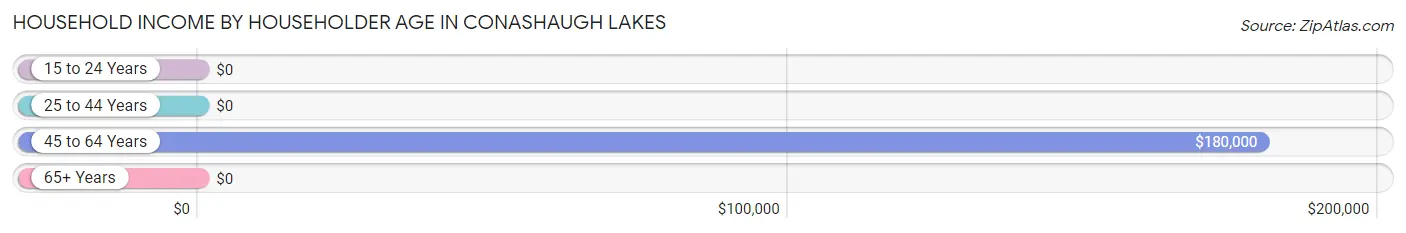
| Income Bracket | # Households | Median Income |
| 15 to 24 Years | 0 (0.0%) | $0 |
| 25 to 44 Years | 124 (19.1%) | $0 |
| 45 to 64 Years | 290 (44.6%) | $180,000 |
| 65+ Years | 236 (36.3%) | $0 |
| Total | 650 (100.0%) | $0 |
Poverty in Conashaugh Lakes
Income Below Poverty by Sex and Age in Conashaugh Lakes
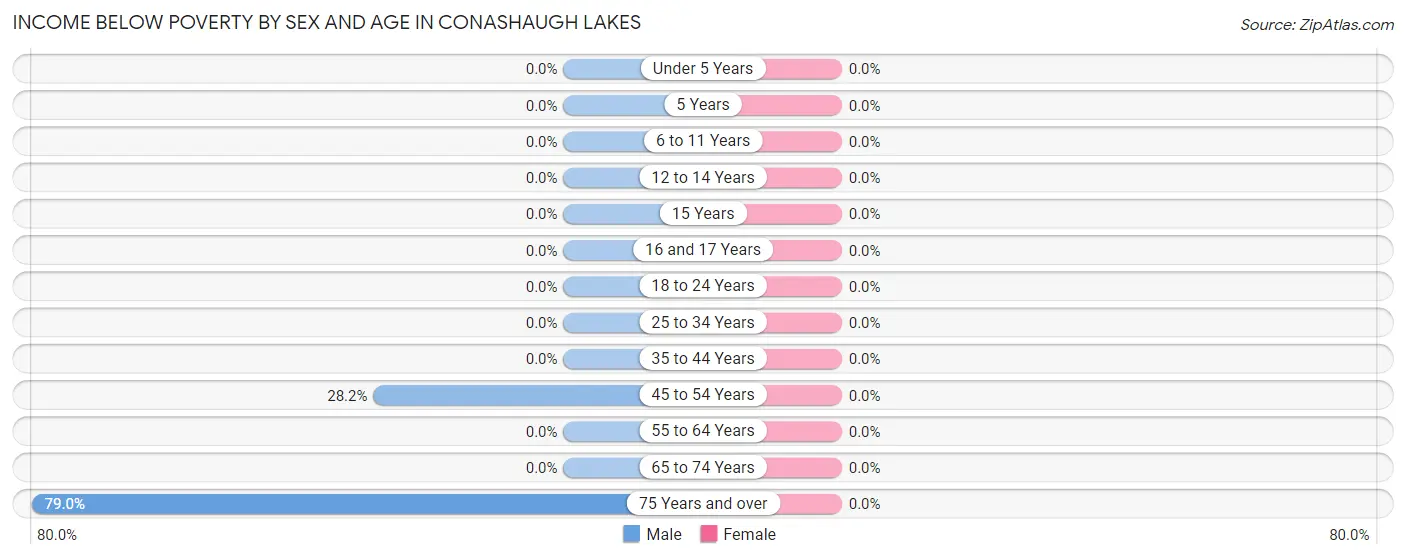
| Age Bracket | Male | Female |
| Under 5 Years | 0 (0.0%) | 0 (0.0%) |
| 5 Years | 0 (0.0%) | 0 (0.0%) |
| 6 to 11 Years | 0 (0.0%) | 0 (0.0%) |
| 12 to 14 Years | 0 (0.0%) | 0 (0.0%) |
| 15 Years | 0 (0.0%) | 0 (0.0%) |
| 16 and 17 Years | 0 (0.0%) | 0 (0.0%) |
| 18 to 24 Years | 0 (0.0%) | 0 (0.0%) |
| 25 to 34 Years | 0 (0.0%) | 0 (0.0%) |
| 35 to 44 Years | 0 (0.0%) | 0 (0.0%) |
| 45 to 54 Years | 57 (28.2%) | 0 (0.0%) |
| 55 to 64 Years | 0 (0.0%) | 0 (0.0%) |
| 65 to 74 Years | 0 (0.0%) | 0 (0.0%) |
| 75 Years and over | 90 (78.9%) | 0 (0.0%) |
| Total | 147 (15.1%) | 0 (0.0%) |
Income Above Poverty by Sex and Age in Conashaugh Lakes
According to the poverty statistics in Conashaugh Lakes, males aged under 5 years and females aged 6 to 11 years are the age groups that are most secure financially, with 100.0% of males and 100.0% of females in these age groups living above the poverty line.
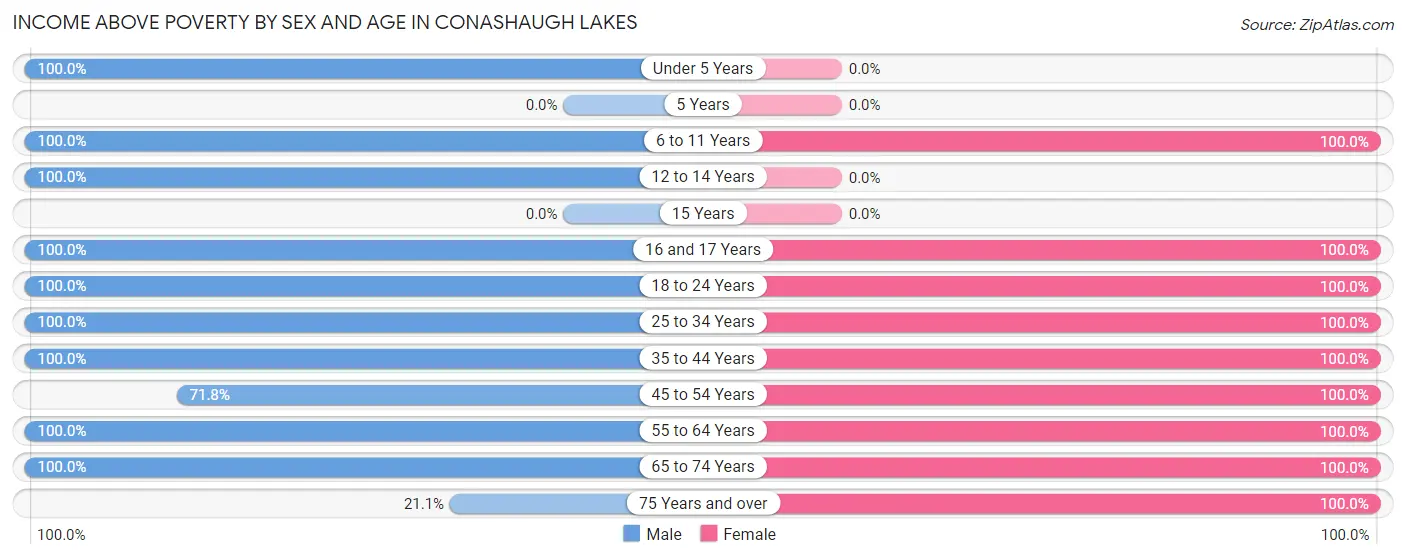
| Age Bracket | Male | Female |
| Under 5 Years | 40 (100.0%) | 0 (0.0%) |
| 5 Years | 0 (0.0%) | 0 (0.0%) |
| 6 to 11 Years | 124 (100.0%) | 43 (100.0%) |
| 12 to 14 Years | 18 (100.0%) | 0 (0.0%) |
| 15 Years | 0 (0.0%) | 0 (0.0%) |
| 16 and 17 Years | 52 (100.0%) | 20 (100.0%) |
| 18 to 24 Years | 83 (100.0%) | 18 (100.0%) |
| 25 to 34 Years | 30 (100.0%) | 18 (100.0%) |
| 35 to 44 Years | 124 (100.0%) | 55 (100.0%) |
| 45 to 54 Years | 145 (71.8%) | 157 (100.0%) |
| 55 to 64 Years | 95 (100.0%) | 145 (100.0%) |
| 65 to 74 Years | 88 (100.0%) | 102 (100.0%) |
| 75 Years and over | 24 (21.0%) | 22 (100.0%) |
| Total | 823 (84.9%) | 580 (100.0%) |
Income Below Poverty Among Married-Couple Families in Conashaugh Lakes
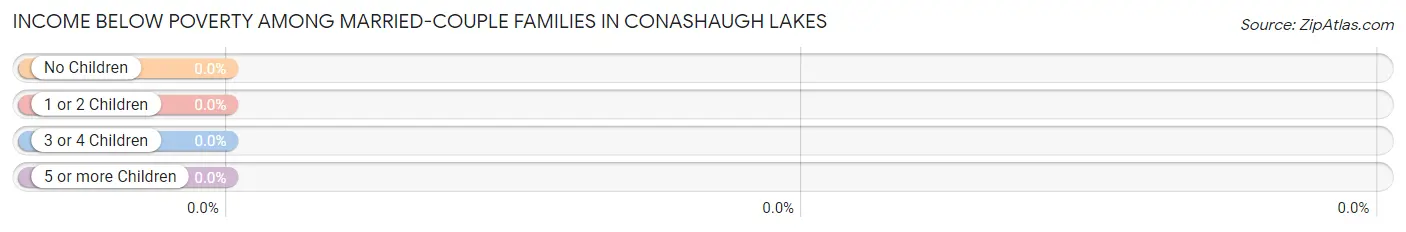
| Children | Above Poverty | Below Poverty |
| No Children | 184 (100.0%) | 0 (0.0%) |
| 1 or 2 Children | 123 (100.0%) | 0 (0.0%) |
| 3 or 4 Children | 0 (0.0%) | 0 (0.0%) |
| 5 or more Children | 15 (100.0%) | 0 (0.0%) |
| Total | 322 (100.0%) | 0 (0.0%) |
Income Below Poverty Among Single-Parent Households in Conashaugh Lakes
| Children | Single Father | Single Mother |
| No Children | 0 (0.0%) | 0 (0.0%) |
| 1 or 2 Children | 0 (0.0%) | 0 (0.0%) |
| 3 or 4 Children | 0 (0.0%) | 0 (0.0%) |
| 5 or more Children | 0 (0.0%) | 0 (0.0%) |
| Total | 0 (0.0%) | 0 (0.0%) |
Income Below Poverty Among Married-Couple vs Single-Parent Households in Conashaugh Lakes
| Children | Married-Couple Families | Single-Parent Households |
| No Children | 0 (0.0%) | 0 (0.0%) |
| 1 or 2 Children | 0 (0.0%) | 0 (0.0%) |
| 3 or 4 Children | 0 (0.0%) | 0 (0.0%) |
| 5 or more Children | 0 (0.0%) | 0 (0.0%) |
| Total | 0 (0.0%) | 0 (0.0%) |
Race in Conashaugh Lakes
The most populous races in Conashaugh Lakes are White / Caucasian (1,364 | 88.0%), Black / African American (140 | 9.0%), and Hispanic or Latino (64 | 4.1%).
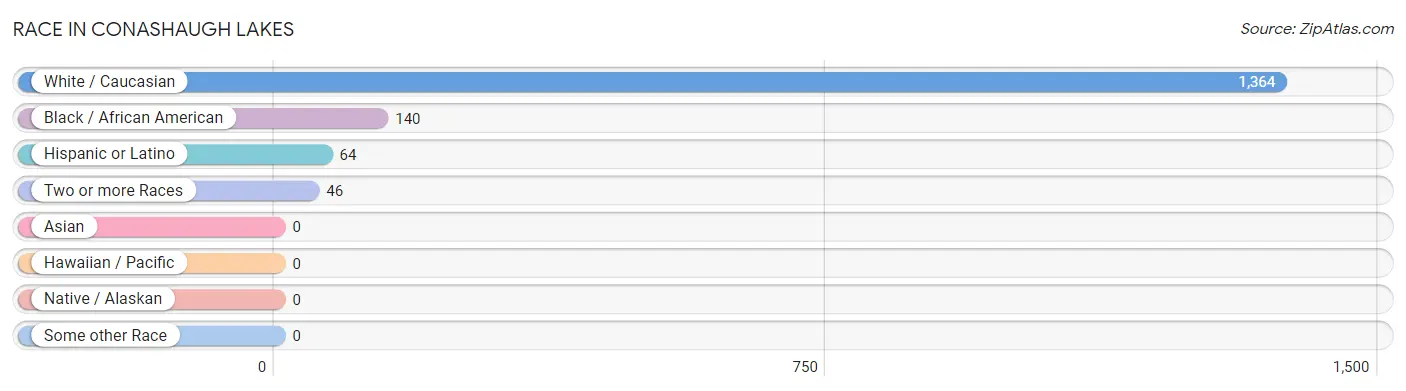
| Race | # Population | % Population |
| Asian | 0 | 0.0% |
| Black / African American | 140 | 9.0% |
| Hawaiian / Pacific | 0 | 0.0% |
| Hispanic or Latino | 64 | 4.1% |
| Native / Alaskan | 0 | 0.0% |
| White / Caucasian | 1,364 | 88.0% |
| Two or more Races | 46 | 3.0% |
| Some other Race | 0 | 0.0% |
| Total | 1,550 | 100.0% |
Ancestry in Conashaugh Lakes
The most populous ancestries reported in Conashaugh Lakes are German (378 | 24.4%), Italian (227 | 14.6%), Russian (219 | 14.1%), Irish (178 | 11.5%), and Scotch-Irish (71 | 4.6%), together accounting for 69.2% of all Conashaugh Lakes residents.
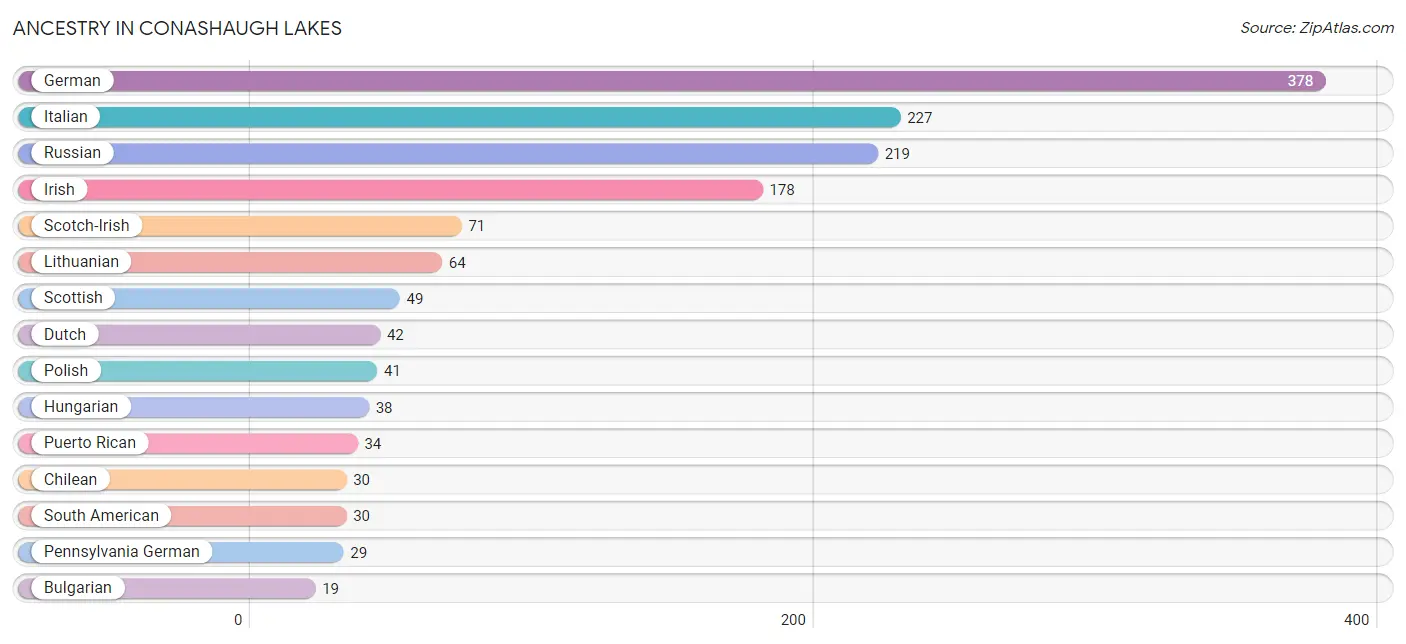
| Ancestry | # Population | % Population |
| British | 18 | 1.2% |
| Bulgarian | 19 | 1.2% |
| Chilean | 30 | 1.9% |
| Dutch | 42 | 2.7% |
| German | 378 | 24.4% |
| Hungarian | 38 | 2.5% |
| Irish | 178 | 11.5% |
| Italian | 227 | 14.6% |
| Lithuanian | 64 | 4.1% |
| Pennsylvania German | 29 | 1.9% |
| Polish | 41 | 2.6% |
| Puerto Rican | 34 | 2.2% |
| Russian | 219 | 14.1% |
| Scotch-Irish | 71 | 4.6% |
| Scottish | 49 | 3.2% |
| South American | 30 | 1.9% | View All 16 Rows |
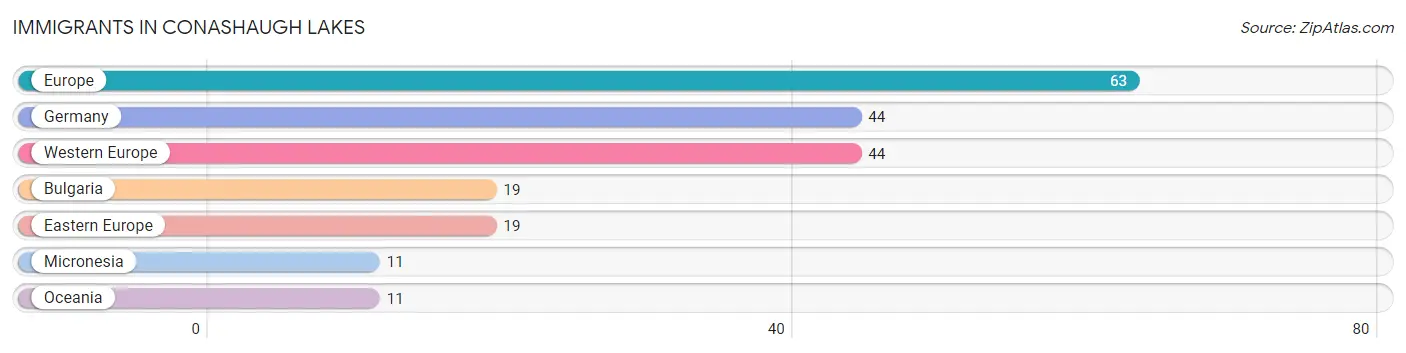
Immigrants in Conashaugh Lakes
The most numerous immigrant groups reported in Conashaugh Lakes came from Europe (63 | 4.1%), Germany (44 | 2.8%), Western Europe (44 | 2.8%), Bulgaria (19 | 1.2%), and Eastern Europe (19 | 1.2%), together accounting for 12.2% of all Conashaugh Lakes residents.
| Immigration Origin | # Population | % Population |
| Bulgaria | 19 | 1.2% |
| Eastern Europe | 19 | 1.2% |
| Europe | 63 | 4.1% |
| Germany | 44 | 2.8% |
| Micronesia | 11 | 0.7% |
| Oceania | 11 | 0.7% |
| Western Europe | 44 | 2.8% | View All 7 Rows |
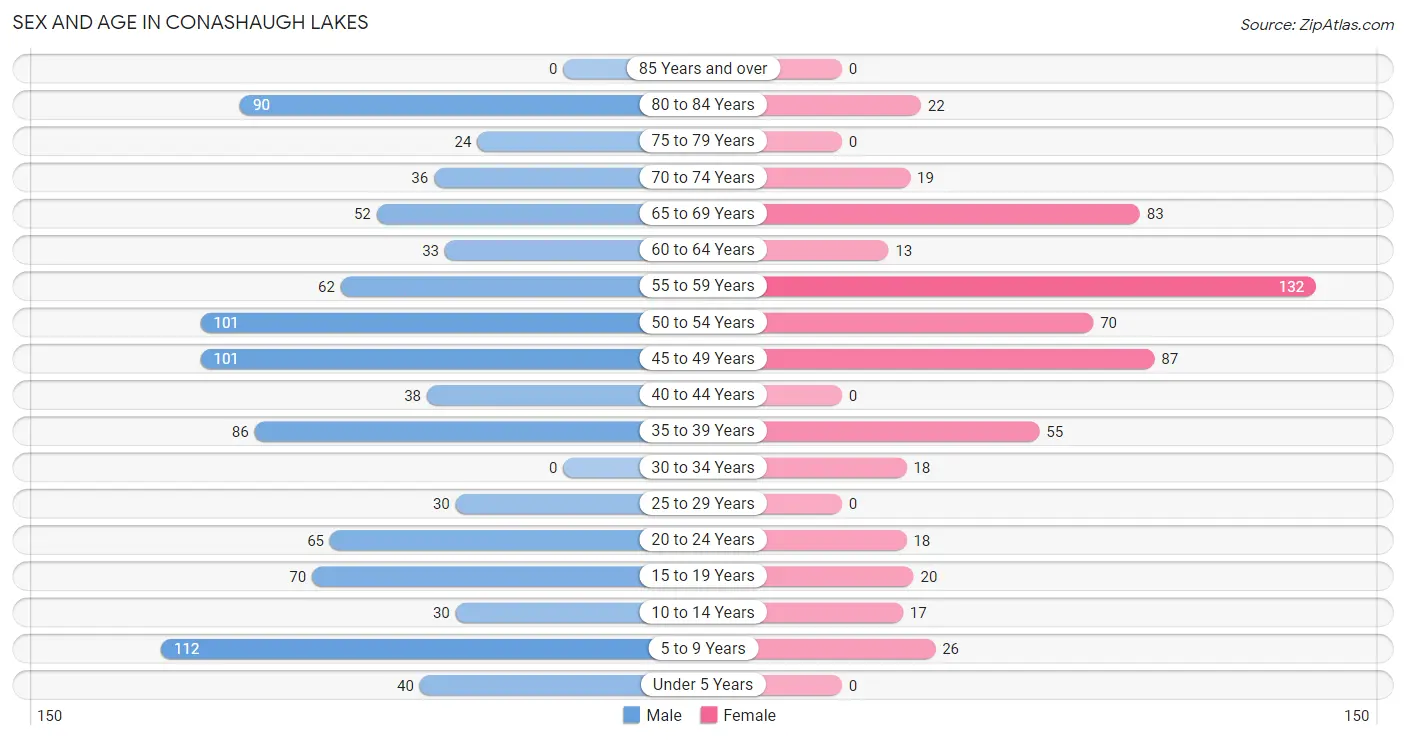
Sex and Age in Conashaugh Lakes
Sex and Age in Conashaugh Lakes
The most populous age groups in Conashaugh Lakes are 5 to 9 Years (112 | 11.6%) for men and 55 to 59 Years (132 | 22.8%) for women.
| Age Bracket | Male | Female |
| Under 5 Years | 40 (4.1%) | 0 (0.0%) |
| 5 to 9 Years | 112 (11.6%) | 26 (4.5%) |
| 10 to 14 Years | 30 (3.1%) | 17 (2.9%) |
| 15 to 19 Years | 70 (7.2%) | 20 (3.5%) |
| 20 to 24 Years | 65 (6.7%) | 18 (3.1%) |
| 25 to 29 Years | 30 (3.1%) | 0 (0.0%) |
| 30 to 34 Years | 0 (0.0%) | 18 (3.1%) |
| 35 to 39 Years | 86 (8.9%) | 55 (9.5%) |
| 40 to 44 Years | 38 (3.9%) | 0 (0.0%) |
| 45 to 49 Years | 101 (10.4%) | 87 (15.0%) |
| 50 to 54 Years | 101 (10.4%) | 70 (12.1%) |
| 55 to 59 Years | 62 (6.4%) | 132 (22.8%) |
| 60 to 64 Years | 33 (3.4%) | 13 (2.2%) |
| 65 to 69 Years | 52 (5.4%) | 83 (14.3%) |
| 70 to 74 Years | 36 (3.7%) | 19 (3.3%) |
| 75 to 79 Years | 24 (2.5%) | 0 (0.0%) |
| 80 to 84 Years | 90 (9.3%) | 22 (3.8%) |
| 85 Years and over | 0 (0.0%) | 0 (0.0%) |
| Total | 970 (100.0%) | 580 (100.0%) |
Families and Households in Conashaugh Lakes
Median Family Size in Conashaugh Lakes
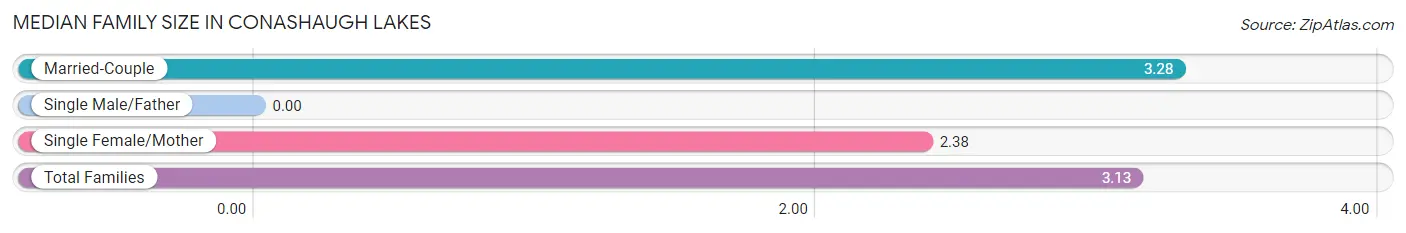
| Family Type | # Families | Family Size |
| Married-Couple | 322 (83.0%) | 3.28 |
| Single Male/Father | 0 (0.0%) | - |
| Single Female/Mother | 66 (17.0%) | 2.38 |
| Total Families | 388 (100.0%) | 3.13 |
Median Household Size in Conashaugh Lakes
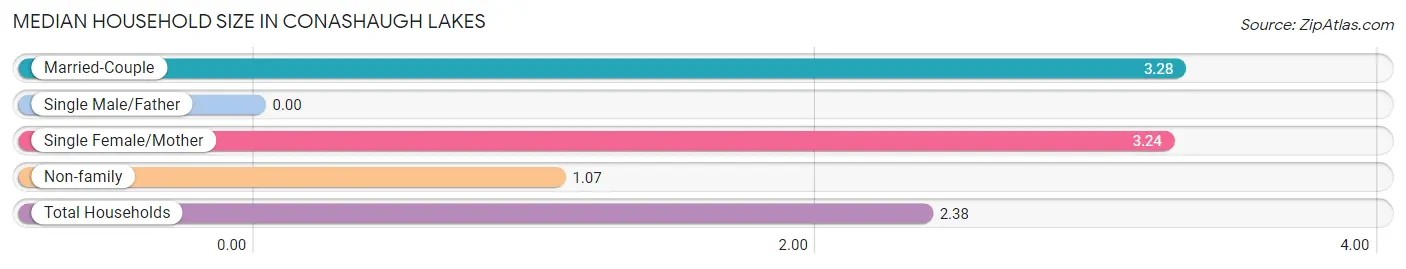
| Household Type | # Households | Household Size |
| Married-Couple | 322 (49.5%) | 3.28 |
| Single Male/Father | 0 (0.0%) | - |
| Single Female/Mother | 66 (10.2%) | 3.24 |
| Non-family | 262 (40.3%) | 1.07 |
| Total Households | 650 (100.0%) | 2.38 |
Household Size by Marriage Status in Conashaugh Lakes
Out of a total of 650 households in Conashaugh Lakes, 388 (59.7%) are family households, while 262 (40.3%) are nonfamily households. The most numerous type of family households are 2-person households, comprising 130, and the most common type of nonfamily households are 1-person households, comprising 191.
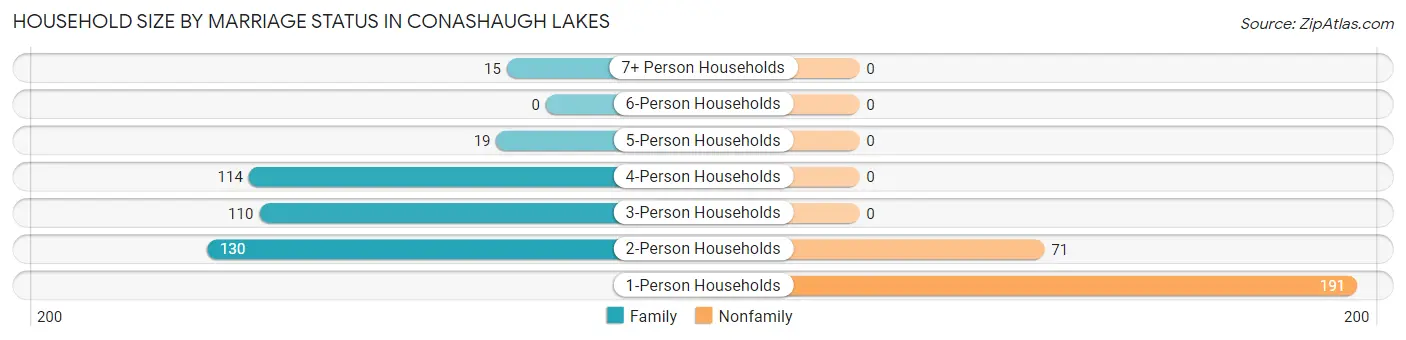
| Household Size | Family Households | Nonfamily Households |
| 1-Person Households | - | 191 (29.4%) |
| 2-Person Households | 130 (20.0%) | 71 (10.9%) |
| 3-Person Households | 110 (16.9%) | 0 (0.0%) |
| 4-Person Households | 114 (17.5%) | 0 (0.0%) |
| 5-Person Households | 19 (2.9%) | 0 (0.0%) |
| 6-Person Households | 0 (0.0%) | 0 (0.0%) |
| 7+ Person Households | 15 (2.3%) | 0 (0.0%) |
| Total | 388 (59.7%) | 262 (40.3%) |
Female Fertility in Conashaugh Lakes
Fertility by Age in Conashaugh Lakes
| Age Bracket | Women with Births | Births / 1,000 Women |
| 15 to 19 years | 0 (0.0%) | 0.0 |
| 20 to 34 years | 0 (0.0%) | 0.0 |
| 35 to 50 years | 0 (0.0%) | 0.0 |
| Total | 0 (0.0%) | 0.0 |
Fertility by Age by Marriage Status in Conashaugh Lakes
| Age Bracket | Married | Unmarried |
| 15 to 19 years | 0 (0.0%) | 0 (0.0%) |
| 20 to 34 years | 0 (0.0%) | 0 (0.0%) |
| 35 to 50 years | 0 (0.0%) | 0 (0.0%) |
| Total | 0 (0.0%) | 0 (0.0%) |
Fertility by Education in Conashaugh Lakes
| Educational Attainment | Women with Births | Births / 1,000 Women |
| Less than High School | 0 (0.0%) | 0.0 |
| High School Diploma | 0 (0.0%) | 0.0 |
| College or Associate's Degree | 0 (0.0%) | 0.0 |
| Bachelor's Degree | 0 (0.0%) | 0.0 |
| Graduate Degree | 0 (0.0%) | 0.0 |
| Total | 0 (0.0%) | 0.0 |
Fertility by Education by Marriage Status in Conashaugh Lakes
| Educational Attainment | Married | Unmarried |
| Less than High School | 0 (0.0%) | 0 (0.0%) |
| High School Diploma | 0 (0.0%) | 0 (0.0%) |
| College or Associate's Degree | 0 (0.0%) | 0 (0.0%) |
| Bachelor's Degree | 0 (0.0%) | 0 (0.0%) |
| Graduate Degree | 0 (0.0%) | 0 (0.0%) |
| Total | 0 (0.0%) | 0 (0.0%) |
Employment Characteristics in Conashaugh Lakes
Employment by Class of Employer in Conashaugh Lakes
Among the 673 employed individuals in Conashaugh Lakes, private company employees (436 | 64.8%), not-for-profit organizations (71 | 10.5%), and local government employees (55 | 8.2%) make up the most common classes of employment.
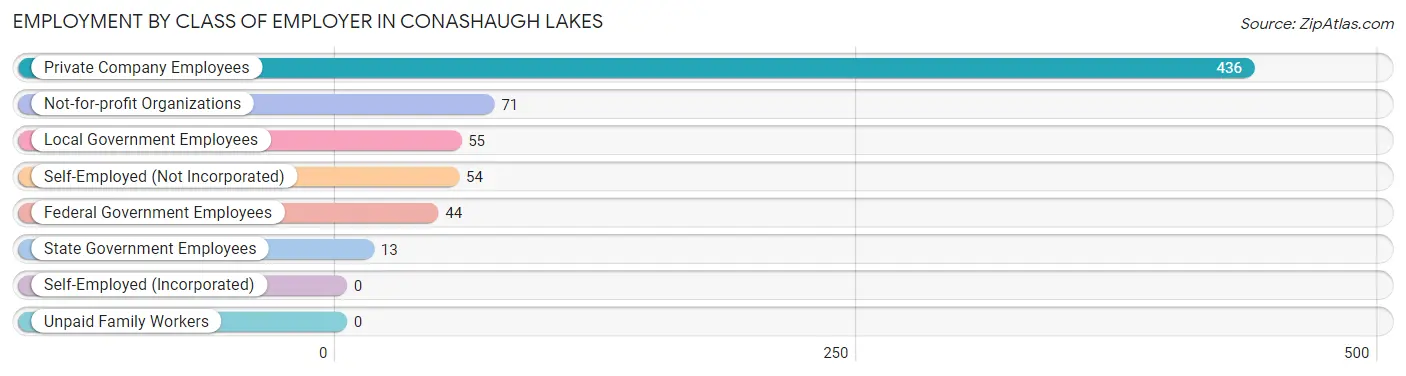
| Employer Class | # Employees | % Employees |
| Private Company Employees | 436 | 64.8% |
| Self-Employed (Incorporated) | 0 | 0.0% |
| Self-Employed (Not Incorporated) | 54 | 8.0% |
| Not-for-profit Organizations | 71 | 10.5% |
| Local Government Employees | 55 | 8.2% |
| State Government Employees | 13 | 1.9% |
| Federal Government Employees | 44 | 6.5% |
| Unpaid Family Workers | 0 | 0.0% |
| Total | 673 | 100.0% |
Employment Status by Age in Conashaugh Lakes
According to the labor force statistics for Conashaugh Lakes, out of the total population over 16 years of age (1,325), 64.4% or 853 individuals are in the labor force, with 17.7% or 151 of them unemployed. The age group with the highest labor force participation rate is 30 to 34 years, with 100.0% or 18 individuals in the labor force. Within the labor force, the 75 years and over age range has the highest percentage of unemployed individuals, with 100.0% or 24 of them being unemployed.
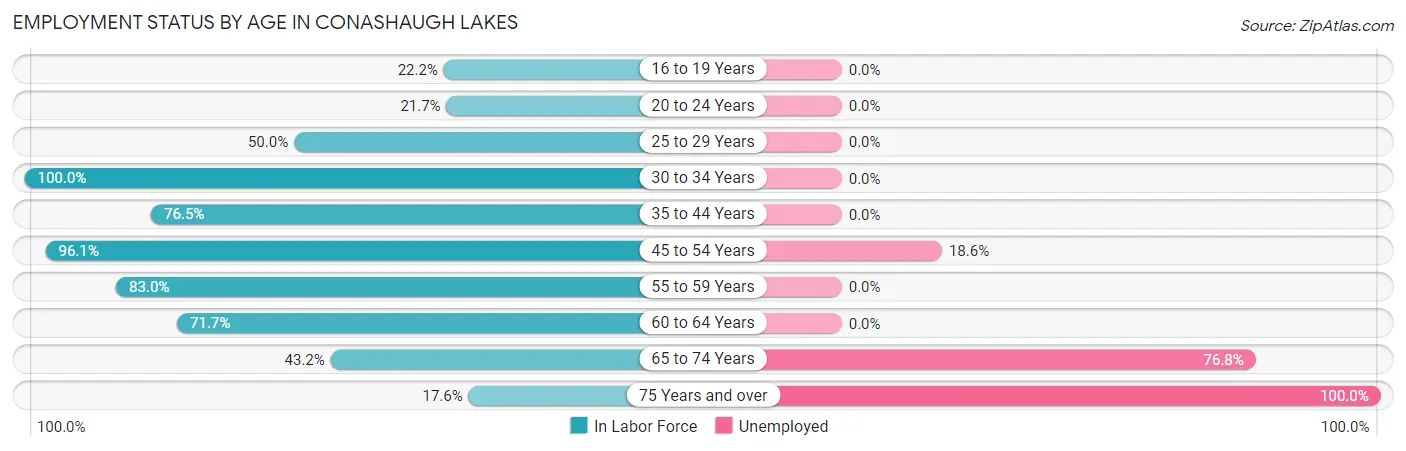
| Age Bracket | In Labor Force | Unemployed |
| 16 to 19 Years | 20 (22.2%) | 0 (0.0%) |
| 20 to 24 Years | 18 (21.7%) | 0 (0.0%) |
| 25 to 29 Years | 15 (50.0%) | 0 (0.0%) |
| 30 to 34 Years | 18 (100.0%) | 0 (0.0%) |
| 35 to 44 Years | 137 (76.5%) | 0 (0.0%) |
| 45 to 54 Years | 345 (96.1%) | 64 (18.6%) |
| 55 to 59 Years | 161 (83.0%) | 0 (0.0%) |
| 60 to 64 Years | 33 (71.7%) | 0 (0.0%) |
| 65 to 74 Years | 82 (43.2%) | 63 (76.8%) |
| 75 Years and over | 24 (17.6%) | 24 (100.0%) |
| Total | 853 (64.4%) | 151 (17.7%) |
Employment Status by Educational Attainment in Conashaugh Lakes
According to labor force statistics for Conashaugh Lakes, 85.8% of individuals (709) out of the total population between 25 and 64 years of age (826) are in the labor force, with 9.0% or 64 of them being unemployed. The group with the highest labor force participation rate are those with the educational attainment of less than high school, with 100.0% or 15 individuals in the labor force. Within the labor force, individuals with bachelor's degree or higher education have the highest percentage of unemployment, with 27.0% or 64 of them being unemployed.
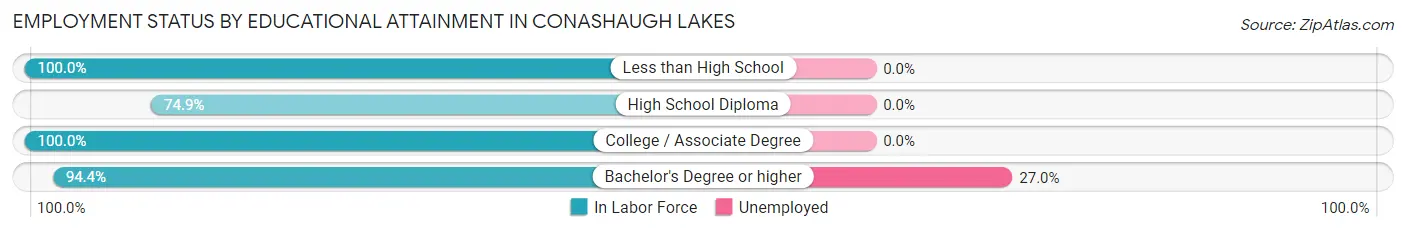
| Educational Attainment | In Labor Force | Unemployed |
| Less than High School | 15 (100.0%) | 0 (0.0%) |
| High School Diploma | 308 (74.9%) | 0 (0.0%) |
| College / Associate Degree | 149 (100.0%) | 0 (0.0%) |
| Bachelor's Degree or higher | 237 (94.4%) | 68 (27.0%) |
| Total | 709 (85.8%) | 74 (9.0%) |
Employment Occupations by Sex in Conashaugh Lakes
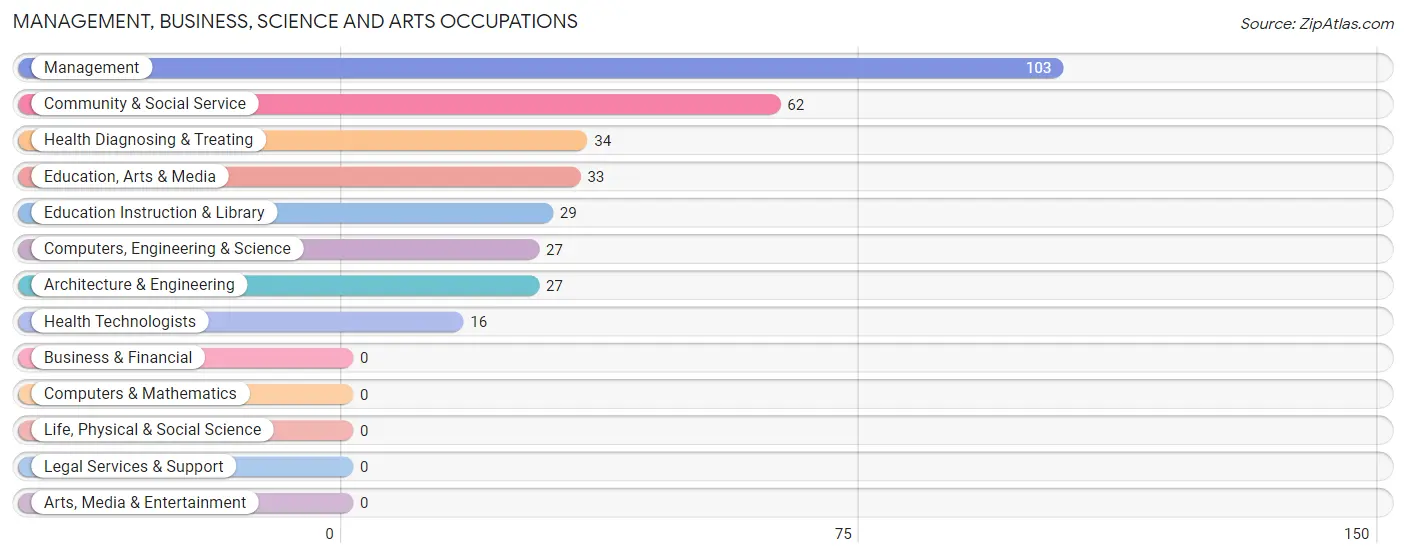
Management, Business, Science and Arts Occupations
The most common Management, Business, Science and Arts occupations in Conashaugh Lakes are Management (103 | 14.7%), Community & Social Service (62 | 8.8%), Health Diagnosing & Treating (34 | 4.8%), Education, Arts & Media (33 | 4.7%), and Education Instruction & Library (29 | 4.1%).
Management, Business, Science and Arts Occupations by Sex
Within the Management, Business, Science and Arts occupations in Conashaugh Lakes, the most male-oriented occupations are Computers, Engineering & Science (100.0%), Architecture & Engineering (100.0%), and Education, Arts & Media (51.5%), while the most female-oriented occupations are Education Instruction & Library (100.0%), Health Diagnosing & Treating (100.0%), and Health Technologists (100.0%).
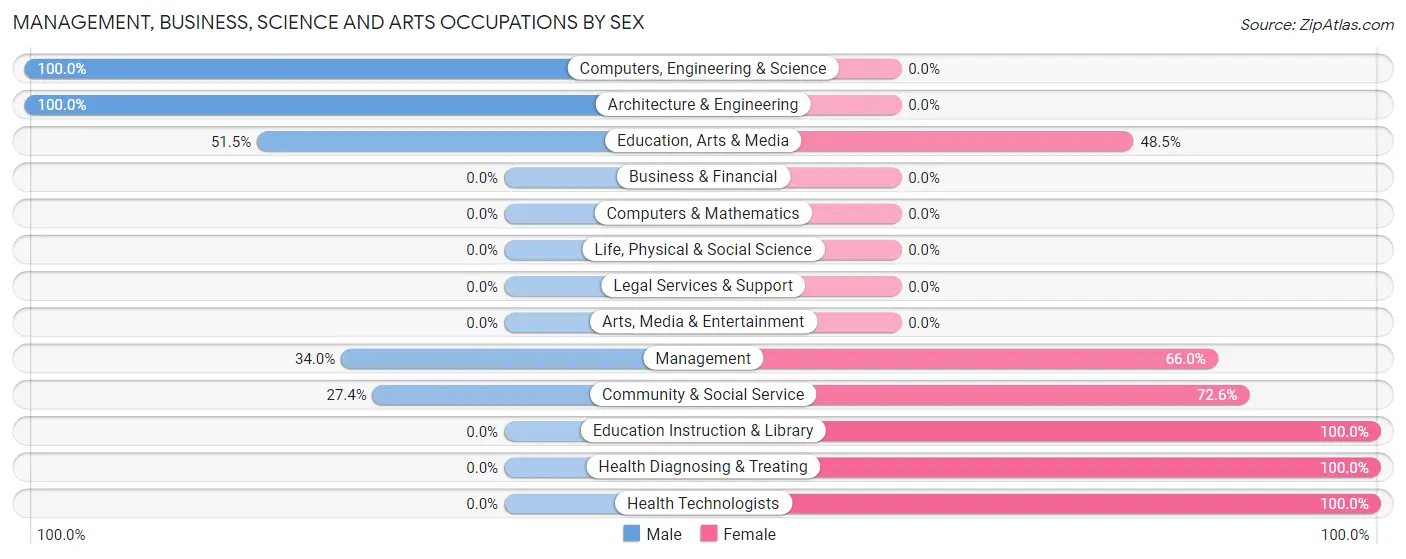
| Occupation | Male | Female |
| Management | 35 (34.0%) | 68 (66.0%) |
| Business & Financial | 0 (0.0%) | 0 (0.0%) |
| Computers, Engineering & Science | 27 (100.0%) | 0 (0.0%) |
| Computers & Mathematics | 0 (0.0%) | 0 (0.0%) |
| Architecture & Engineering | 27 (100.0%) | 0 (0.0%) |
| Life, Physical & Social Science | 0 (0.0%) | 0 (0.0%) |
| Community & Social Service | 17 (27.4%) | 45 (72.6%) |
| Education, Arts & Media | 17 (51.5%) | 16 (48.5%) |
| Legal Services & Support | 0 (0.0%) | 0 (0.0%) |
| Education Instruction & Library | 0 (0.0%) | 29 (100.0%) |
| Arts, Media & Entertainment | 0 (0.0%) | 0 (0.0%) |
| Health Diagnosing & Treating | 0 (0.0%) | 34 (100.0%) |
| Health Technologists | 0 (0.0%) | 16 (100.0%) |
| Total (Category) | 79 (35.0%) | 147 (65.0%) |
| Total (Overall) | 339 (48.3%) | 363 (51.7%) |
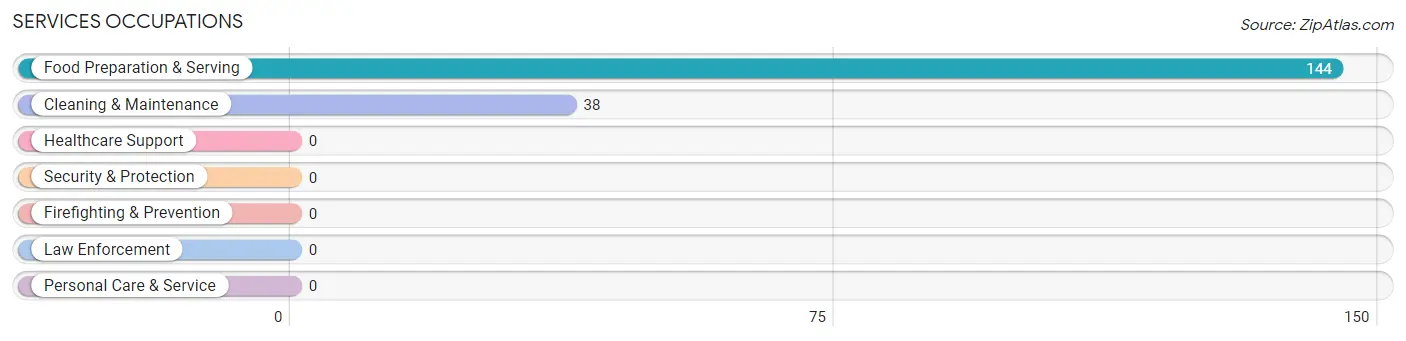
Services Occupations
The most common Services occupations in Conashaugh Lakes are Food Preparation & Serving (144 | 20.5%), and Cleaning & Maintenance (38 | 5.4%).
Services Occupations by Sex
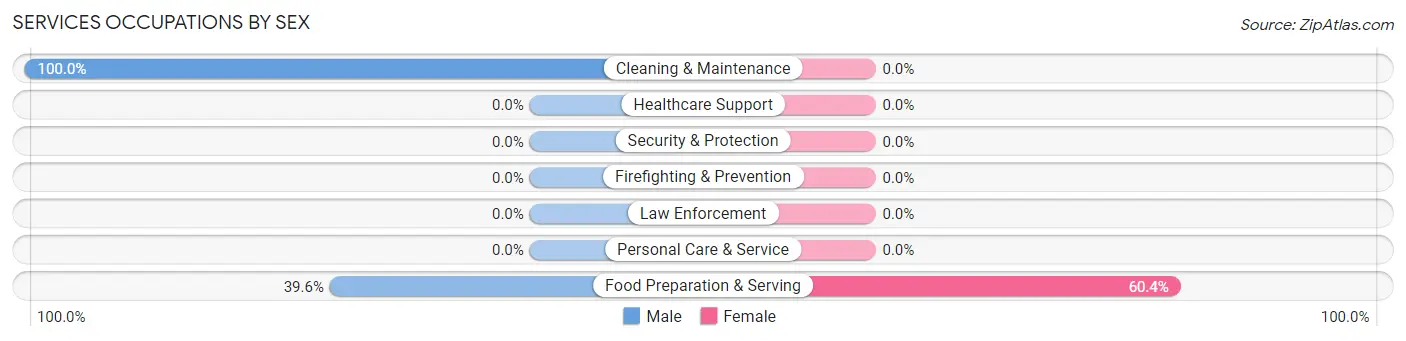
| Occupation | Male | Female |
| Healthcare Support | 0 (0.0%) | 0 (0.0%) |
| Security & Protection | 0 (0.0%) | 0 (0.0%) |
| Firefighting & Prevention | 0 (0.0%) | 0 (0.0%) |
| Law Enforcement | 0 (0.0%) | 0 (0.0%) |
| Food Preparation & Serving | 57 (39.6%) | 87 (60.4%) |
| Cleaning & Maintenance | 38 (100.0%) | 0 (0.0%) |
| Personal Care & Service | 0 (0.0%) | 0 (0.0%) |
| Total (Category) | 95 (52.2%) | 87 (47.8%) |
| Total (Overall) | 339 (48.3%) | 363 (51.7%) |
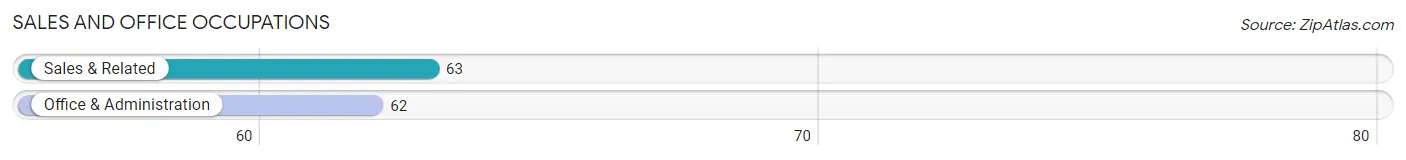
Sales and Office Occupations
The most common Sales and Office occupations in Conashaugh Lakes are Sales & Related (63 | 9.0%), and Office & Administration (62 | 8.8%).
Sales and Office Occupations by Sex
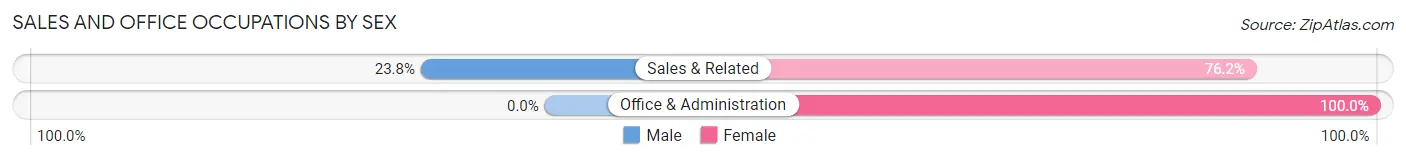
| Occupation | Male | Female |
| Sales & Related | 15 (23.8%) | 48 (76.2%) |
| Office & Administration | 0 (0.0%) | 62 (100.0%) |
| Total (Category) | 15 (12.0%) | 110 (88.0%) |
| Total (Overall) | 339 (48.3%) | 363 (51.7%) |
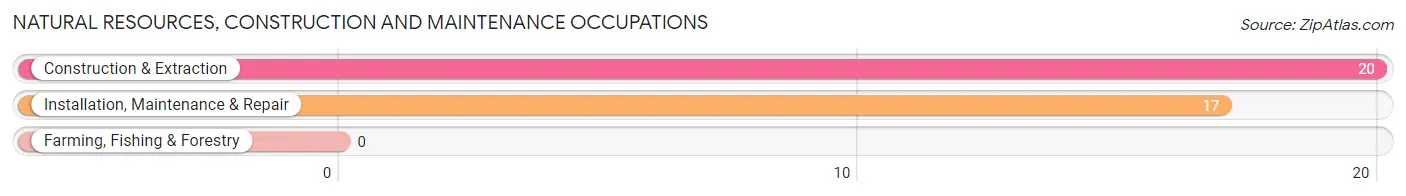
Natural Resources, Construction and Maintenance Occupations
The most common Natural Resources, Construction and Maintenance occupations in Conashaugh Lakes are Construction & Extraction (20 | 2.9%), and Installation, Maintenance & Repair (17 | 2.4%).
Natural Resources, Construction and Maintenance Occupations by Sex
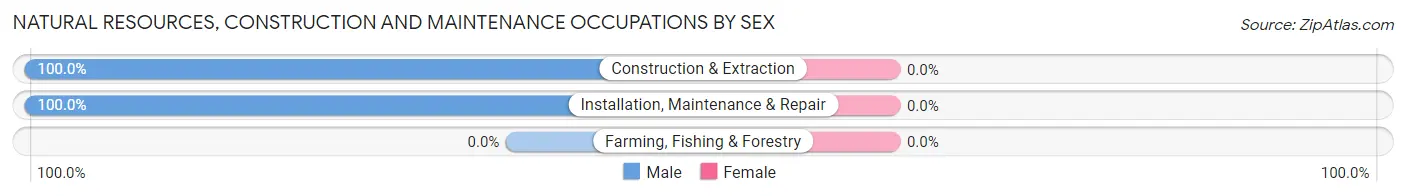
| Occupation | Male | Female |
| Farming, Fishing & Forestry | 0 (0.0%) | 0 (0.0%) |
| Construction & Extraction | 20 (100.0%) | 0 (0.0%) |
| Installation, Maintenance & Repair | 17 (100.0%) | 0 (0.0%) |
| Total (Category) | 37 (100.0%) | 0 (0.0%) |
| Total (Overall) | 339 (48.3%) | 363 (51.7%) |
Production, Transportation and Moving Occupations
The most common Production, Transportation and Moving occupations in Conashaugh Lakes are , and Transportation (132 | 18.8%).
Production, Transportation and Moving Occupations by Sex
| Occupation | Male | Female |
| Production | 0 (0.0%) | 0 (0.0%) |
| Transportation | 113 (85.6%) | 19 (14.4%) |
| Material Moving | 0 (0.0%) | 0 (0.0%) |
| Total (Category) | 113 (85.6%) | 19 (14.4%) |
| Total (Overall) | 339 (48.3%) | 363 (51.7%) |
Employment Industries by Sex in Conashaugh Lakes
Employment Industries in Conashaugh Lakes
The major employment industries in Conashaugh Lakes include Health Care & Social Assistance (117 | 16.7%), Administrative & Support (109 | 15.5%), Accommodation & Food Services (104 | 14.8%), Public Administration (62 | 8.8%), and Transportation & Warehousing (61 | 8.7%).
Employment Industries by Sex in Conashaugh Lakes
The Conashaugh Lakes industries that see more men than women are Construction (100.0%), Administrative & Support (100.0%), and Public Administration (71.0%), whereas the industries that tend to have a higher number of women are Manufacturing (100.0%), Educational Services (100.0%), and Health Care & Social Assistance (100.0%).
| Industry | Male | Female |
| Agriculture, Fishing & Hunting | 0 (0.0%) | 0 (0.0%) |
| Mining, Quarrying, & Extraction | 0 (0.0%) | 0 (0.0%) |
| Construction | 20 (100.0%) | 0 (0.0%) |
| Manufacturing | 0 (0.0%) | 16 (100.0%) |
| Wholesale Trade | 0 (0.0%) | 0 (0.0%) |
| Retail Trade | 15 (25.0%) | 45 (75.0%) |
| Transportation & Warehousing | 42 (68.9%) | 19 (31.1%) |
| Utilities | 0 (0.0%) | 0 (0.0%) |
| Information | 0 (0.0%) | 0 (0.0%) |
| Finance & Insurance | 20 (60.6%) | 13 (39.4%) |
| Real Estate, Rental & Leasing | 0 (0.0%) | 0 (0.0%) |
| Professional & Scientific | 0 (0.0%) | 0 (0.0%) |
| Enterprise Management | 0 (0.0%) | 0 (0.0%) |
| Administrative & Support | 109 (100.0%) | 0 (0.0%) |
| Educational Services | 0 (0.0%) | 29 (100.0%) |
| Health Care & Social Assistance | 0 (0.0%) | 117 (100.0%) |
| Arts, Entertainment & Recreation | 0 (0.0%) | 0 (0.0%) |
| Accommodation & Food Services | 72 (69.2%) | 32 (30.8%) |
| Public Administration | 44 (71.0%) | 18 (29.0%) |
| Total | 339 (48.3%) | 363 (51.7%) |
Education in Conashaugh Lakes
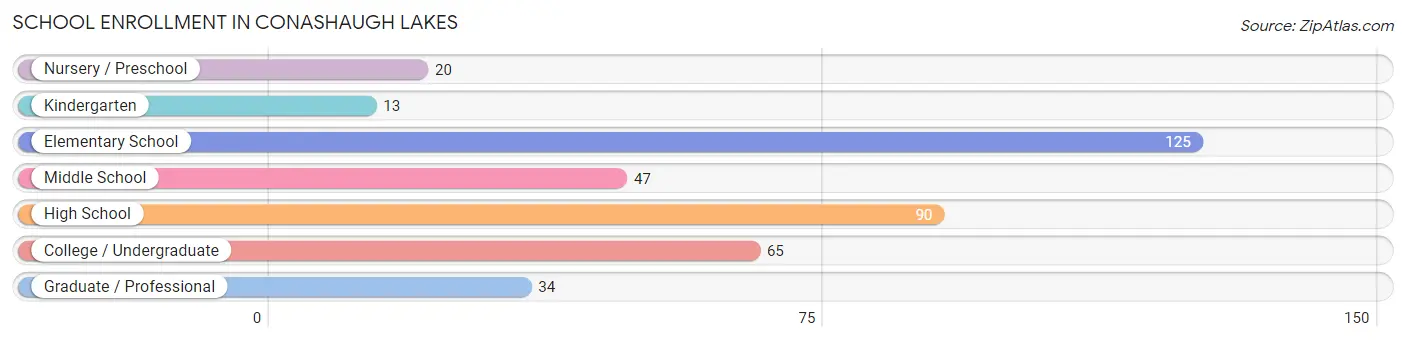
School Enrollment in Conashaugh Lakes
The most common levels of schooling among the 394 students in Conashaugh Lakes are elementary school (125 | 31.7%), high school (90 | 22.8%), and college / undergraduate (65 | 16.5%).
| School Level | # Students | % Students |
| Nursery / Preschool | 20 | 5.1% |
| Kindergarten | 13 | 3.3% |
| Elementary School | 125 | 31.7% |
| Middle School | 47 | 11.9% |
| High School | 90 | 22.8% |
| College / Undergraduate | 65 | 16.5% |
| Graduate / Professional | 34 | 8.6% |
| Total | 394 | 100.0% |
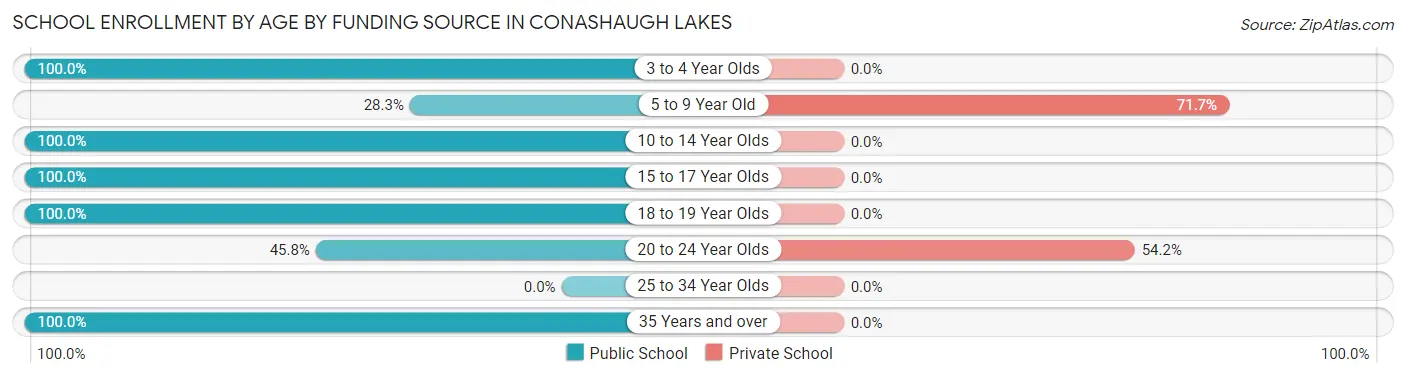
School Enrollment by Age by Funding Source in Conashaugh Lakes
Out of a total of 394 students who are enrolled in schools in Conashaugh Lakes, 144 (36.5%) attend a private institution, while the remaining 250 (63.5%) are enrolled in public schools. The age group of 5 to 9 year old has the highest likelihood of being enrolled in private schools, with 99 (71.7% in the age bracket) enrolled. Conversely, the age group of 3 to 4 year olds has the lowest likelihood of being enrolled in a private school, with 20 (100.0% in the age bracket) attending a public institution.
| Age Bracket | Public School | Private School |
| 3 to 4 Year Olds | 20 (100.0%) | 0 (0.0%) |
| 5 to 9 Year Old | 39 (28.3%) | 99 (71.7%) |
| 10 to 14 Year Olds | 47 (100.0%) | 0 (0.0%) |
| 15 to 17 Year Olds | 72 (100.0%) | 0 (0.0%) |
| 18 to 19 Year Olds | 18 (100.0%) | 0 (0.0%) |
| 20 to 24 Year Olds | 38 (45.8%) | 45 (54.2%) |
| 25 to 34 Year Olds | 0 (0.0%) | 0 (0.0%) |
| 35 Years and over | 16 (100.0%) | 0 (0.0%) |
| Total | 250 (63.5%) | 144 (36.5%) |
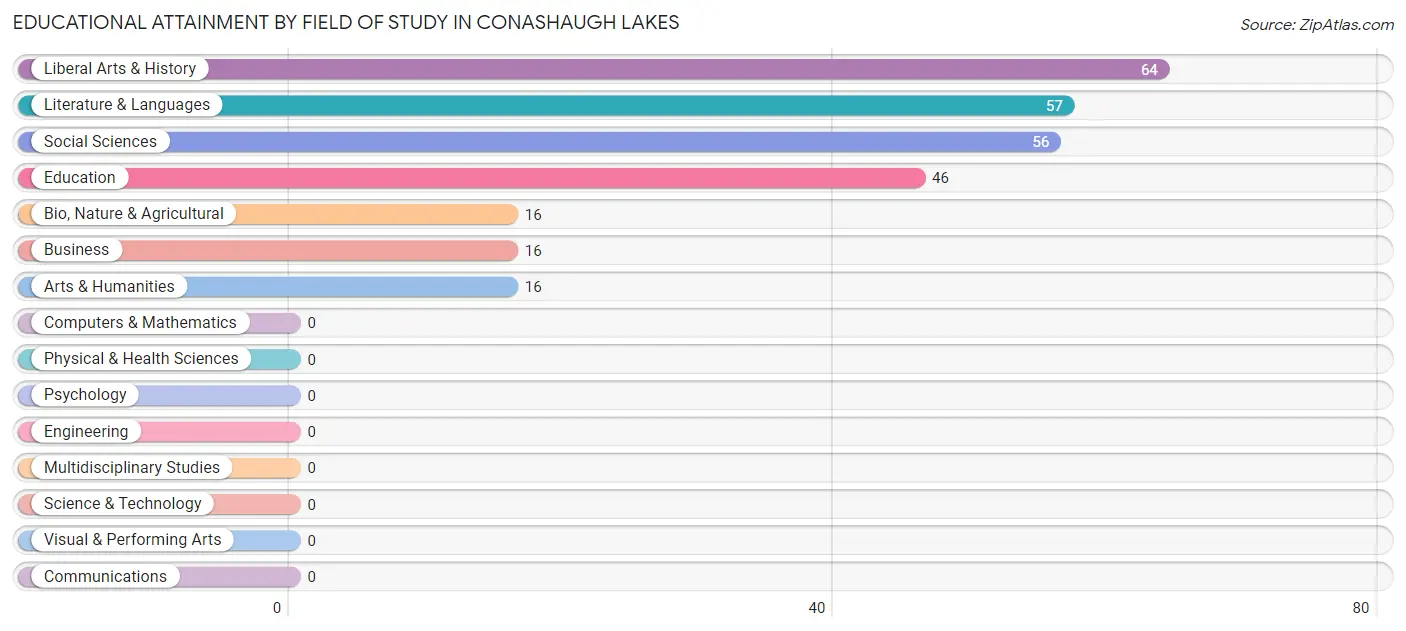
Educational Attainment by Field of Study in Conashaugh Lakes
Liberal arts & history (64 | 23.6%), literature & languages (57 | 21.0%), social sciences (56 | 20.7%), education (46 | 17.0%), and bio, nature & agricultural (16 | 5.9%) are the most common fields of study among 271 individuals in Conashaugh Lakes who have obtained a bachelor's degree or higher.
| Field of Study | # Graduates | % Graduates |
| Computers & Mathematics | 0 | 0.0% |
| Bio, Nature & Agricultural | 16 | 5.9% |
| Physical & Health Sciences | 0 | 0.0% |
| Psychology | 0 | 0.0% |
| Social Sciences | 56 | 20.7% |
| Engineering | 0 | 0.0% |
| Multidisciplinary Studies | 0 | 0.0% |
| Science & Technology | 0 | 0.0% |
| Business | 16 | 5.9% |
| Education | 46 | 17.0% |
| Literature & Languages | 57 | 21.0% |
| Liberal Arts & History | 64 | 23.6% |
| Visual & Performing Arts | 0 | 0.0% |
| Communications | 0 | 0.0% |
| Arts & Humanities | 16 | 5.9% |
| Total | 271 | 100.0% |
Transportation & Commute in Conashaugh Lakes
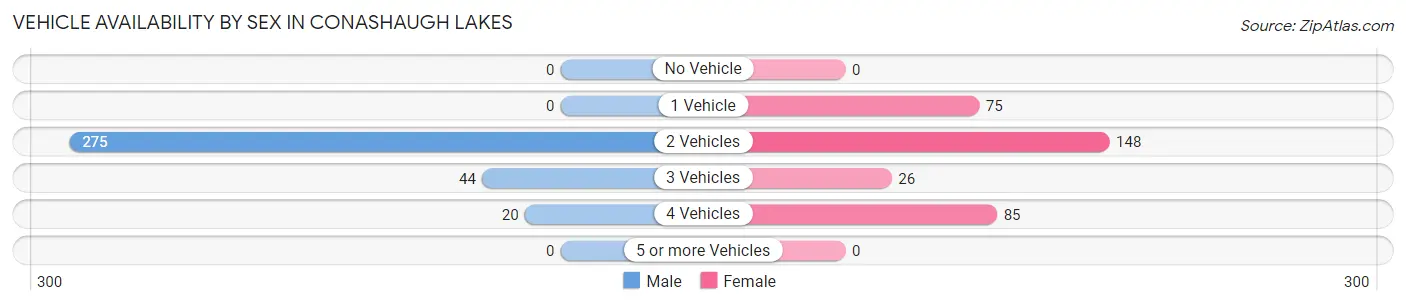
Vehicle Availability by Sex in Conashaugh Lakes
The most prevalent vehicle ownership categories in Conashaugh Lakes are males with 2 vehicles (275, accounting for 81.1%) and females with 2 vehicles (148, making up 82.3%).
| Vehicles Available | Male | Female |
| No Vehicle | 0 (0.0%) | 0 (0.0%) |
| 1 Vehicle | 0 (0.0%) | 75 (22.5%) |
| 2 Vehicles | 275 (81.1%) | 148 (44.3%) |
| 3 Vehicles | 44 (13.0%) | 26 (7.8%) |
| 4 Vehicles | 20 (5.9%) | 85 (25.5%) |
| 5 or more Vehicles | 0 (0.0%) | 0 (0.0%) |
| Total | 339 (100.0%) | 334 (100.0%) |
Commute Time in Conashaugh Lakes
The most frequently occuring commute durations in Conashaugh Lakes are 30 to 34 minutes (161 commuters, 24.4%), 90 or more minutes (146 commuters, 22.1%), and 45 to 59 minutes (124 commuters, 18.8%).
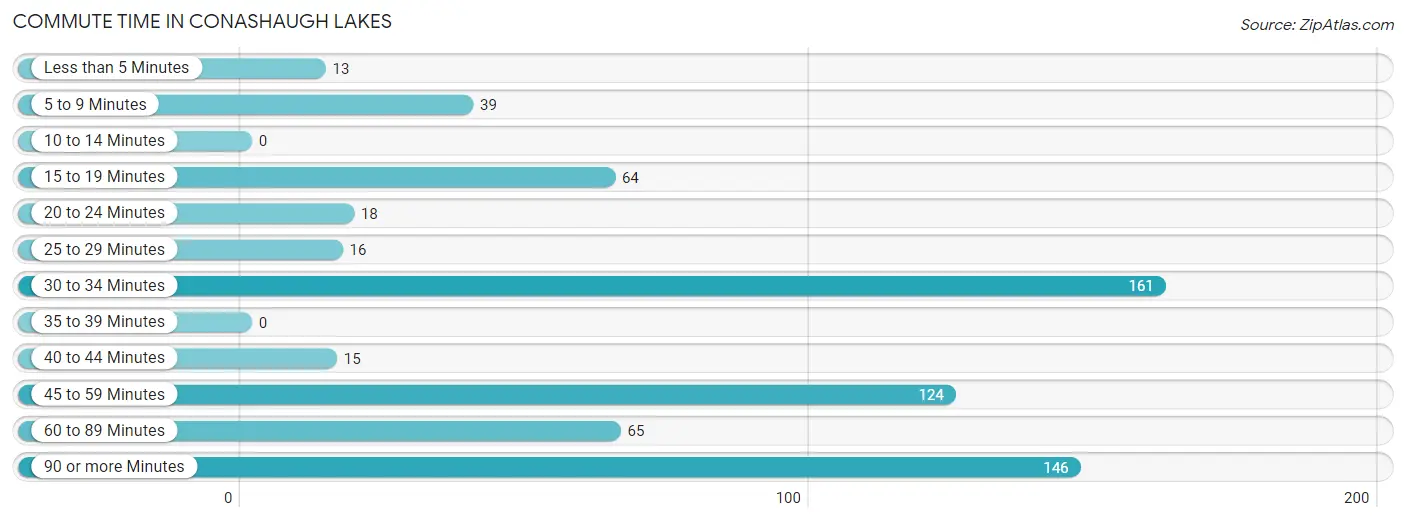
| Commute Time | # Commuters | % Commuters |
| Less than 5 Minutes | 13 | 2.0% |
| 5 to 9 Minutes | 39 | 5.9% |
| 10 to 14 Minutes | 0 | 0.0% |
| 15 to 19 Minutes | 64 | 9.7% |
| 20 to 24 Minutes | 18 | 2.7% |
| 25 to 29 Minutes | 16 | 2.4% |
| 30 to 34 Minutes | 161 | 24.4% |
| 35 to 39 Minutes | 0 | 0.0% |
| 40 to 44 Minutes | 15 | 2.3% |
| 45 to 59 Minutes | 124 | 18.8% |
| 60 to 89 Minutes | 65 | 9.8% |
| 90 or more Minutes | 146 | 22.1% |
Commute Time by Sex in Conashaugh Lakes
The most common commute times in Conashaugh Lakes are 45 to 59 minutes (98 commuters, 28.9%) for males and 90 or more minutes (74 commuters, 23.0%) for females.
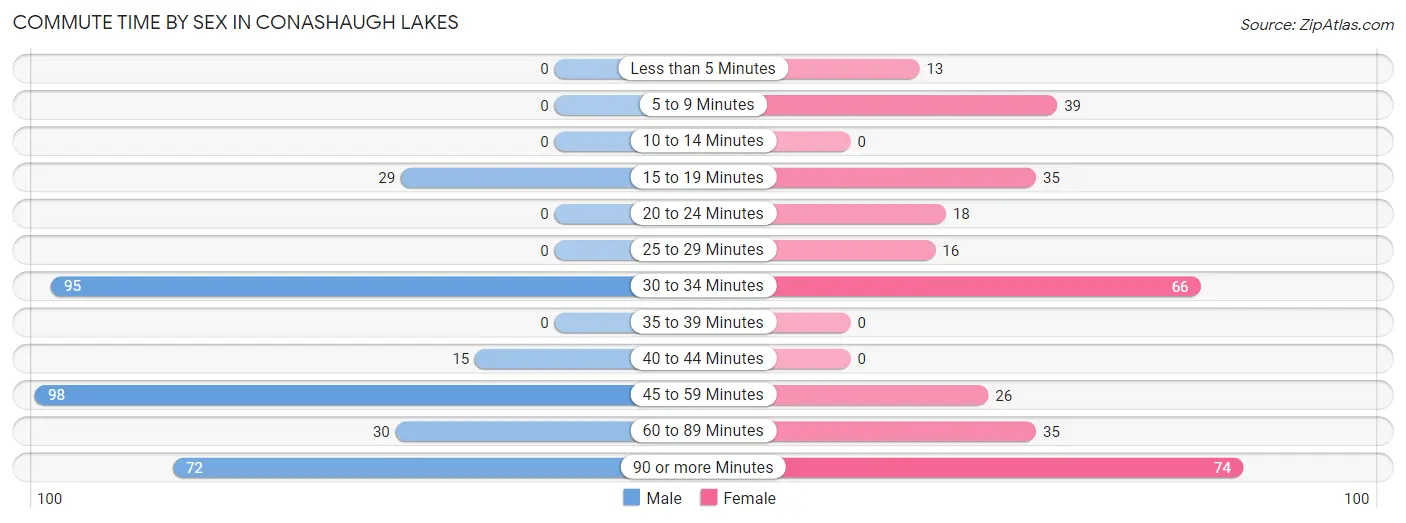
| Commute Time | Male | Female |
| Less than 5 Minutes | 0 (0.0%) | 13 (4.0%) |
| 5 to 9 Minutes | 0 (0.0%) | 39 (12.1%) |
| 10 to 14 Minutes | 0 (0.0%) | 0 (0.0%) |
| 15 to 19 Minutes | 29 (8.6%) | 35 (10.9%) |
| 20 to 24 Minutes | 0 (0.0%) | 18 (5.6%) |
| 25 to 29 Minutes | 0 (0.0%) | 16 (5.0%) |
| 30 to 34 Minutes | 95 (28.0%) | 66 (20.5%) |
| 35 to 39 Minutes | 0 (0.0%) | 0 (0.0%) |
| 40 to 44 Minutes | 15 (4.4%) | 0 (0.0%) |
| 45 to 59 Minutes | 98 (28.9%) | 26 (8.1%) |
| 60 to 89 Minutes | 30 (8.8%) | 35 (10.9%) |
| 90 or more Minutes | 72 (21.2%) | 74 (23.0%) |
Time of Departure to Work by Sex in Conashaugh Lakes
The most frequent times of departure to work in Conashaugh Lakes are 7:30 AM to 7:59 AM (86, 25.4%) for males and 12:00 AM to 4:59 AM (93, 28.9%) for females.
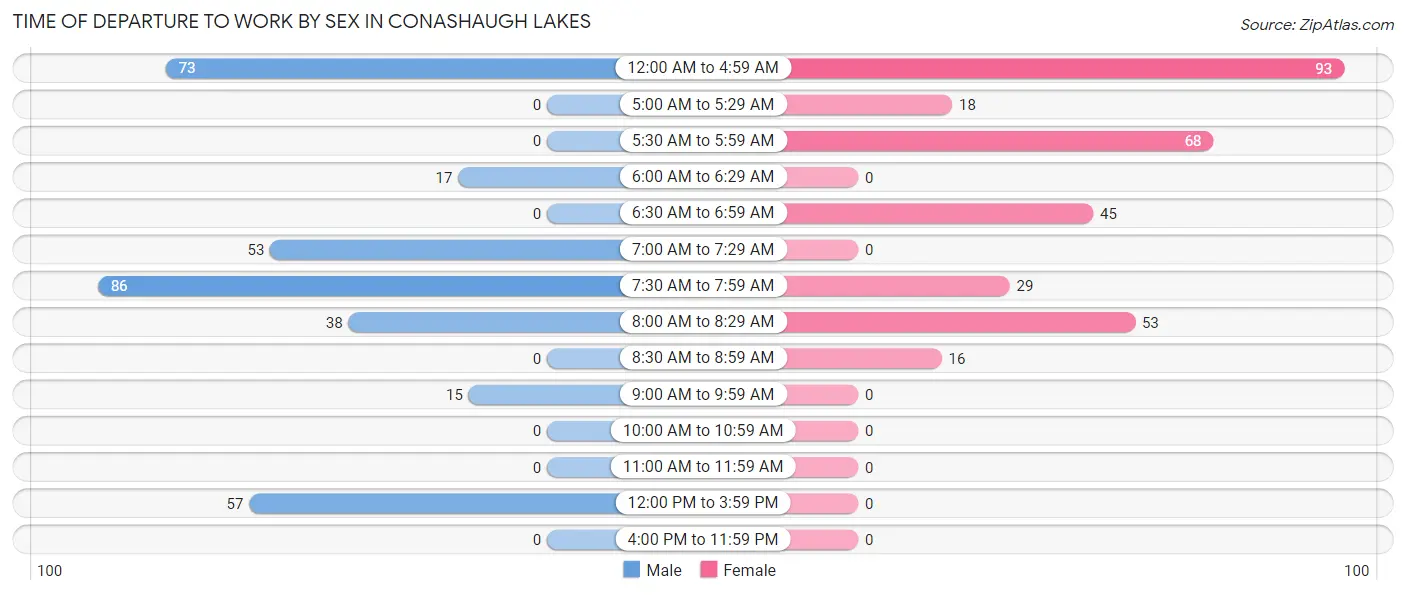
| Time of Departure | Male | Female |
| 12:00 AM to 4:59 AM | 73 (21.5%) | 93 (28.9%) |
| 5:00 AM to 5:29 AM | 0 (0.0%) | 18 (5.6%) |
| 5:30 AM to 5:59 AM | 0 (0.0%) | 68 (21.1%) |
| 6:00 AM to 6:29 AM | 17 (5.0%) | 0 (0.0%) |
| 6:30 AM to 6:59 AM | 0 (0.0%) | 45 (14.0%) |
| 7:00 AM to 7:29 AM | 53 (15.6%) | 0 (0.0%) |
| 7:30 AM to 7:59 AM | 86 (25.4%) | 29 (9.0%) |
| 8:00 AM to 8:29 AM | 38 (11.2%) | 53 (16.5%) |
| 8:30 AM to 8:59 AM | 0 (0.0%) | 16 (5.0%) |
| 9:00 AM to 9:59 AM | 15 (4.4%) | 0 (0.0%) |
| 10:00 AM to 10:59 AM | 0 (0.0%) | 0 (0.0%) |
| 11:00 AM to 11:59 AM | 0 (0.0%) | 0 (0.0%) |
| 12:00 PM to 3:59 PM | 57 (16.8%) | 0 (0.0%) |
| 4:00 PM to 11:59 PM | 0 (0.0%) | 0 (0.0%) |
| Total | 339 (100.0%) | 322 (100.0%) |
Housing Occupancy in Conashaugh Lakes
Occupancy by Ownership in Conashaugh Lakes
Of the total 650 dwellings in Conashaugh Lakes, owner-occupied units account for 650 (100.0%), while renter-occupied units make up 0 (0.0%).
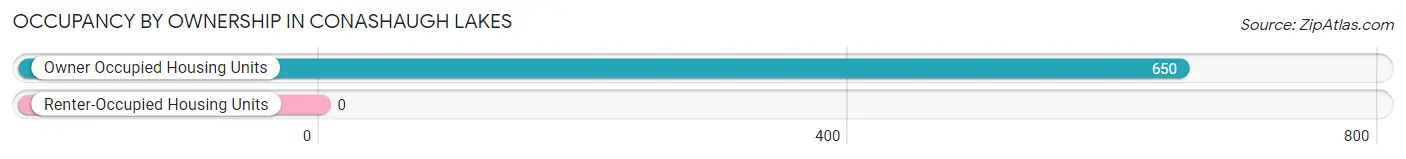
| Occupancy | # Housing Units | % Housing Units |
| Owner Occupied Housing Units | 650 | 100.0% |
| Renter-Occupied Housing Units | 0 | 0.0% |
| Total Occupied Housing Units | 650 | 100.0% |
Occupancy by Household Size in Conashaugh Lakes
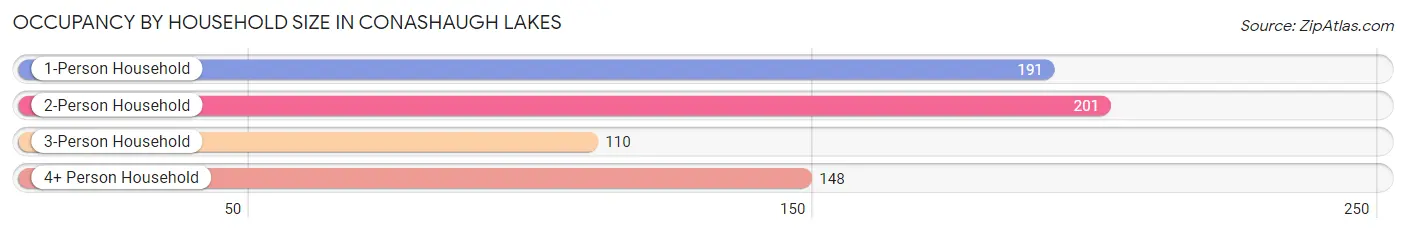
| Household Size | # Housing Units | % Housing Units |
| 1-Person Household | 191 | 29.4% |
| 2-Person Household | 201 | 30.9% |
| 3-Person Household | 110 | 16.9% |
| 4+ Person Household | 148 | 22.8% |
| Total Housing Units | 650 | 100.0% |
Occupancy by Ownership by Household Size in Conashaugh Lakes
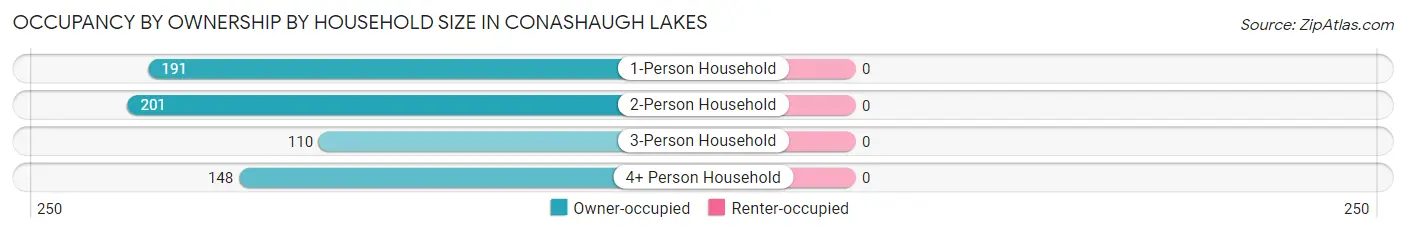
| Household Size | Owner-occupied | Renter-occupied |
| 1-Person Household | 191 (100.0%) | 0 (0.0%) |
| 2-Person Household | 201 (100.0%) | 0 (0.0%) |
| 3-Person Household | 110 (100.0%) | 0 (0.0%) |
| 4+ Person Household | 148 (100.0%) | 0 (0.0%) |
| Total Housing Units | 650 (100.0%) | 0 (0.0%) |
Occupancy by Educational Attainment in Conashaugh Lakes
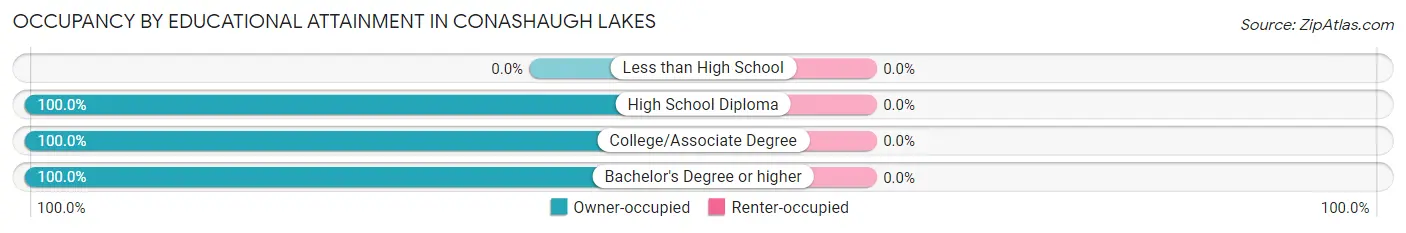
| Household Size | Owner-occupied | Renter-occupied |
| Less than High School | 0 (0.0%) | 0 (0.0%) |
| High School Diploma | 263 (100.0%) | 0 (0.0%) |
| College/Associate Degree | 269 (100.0%) | 0 (0.0%) |
| Bachelor's Degree or higher | 118 (100.0%) | 0 (0.0%) |
Occupancy by Age of Householder in Conashaugh Lakes
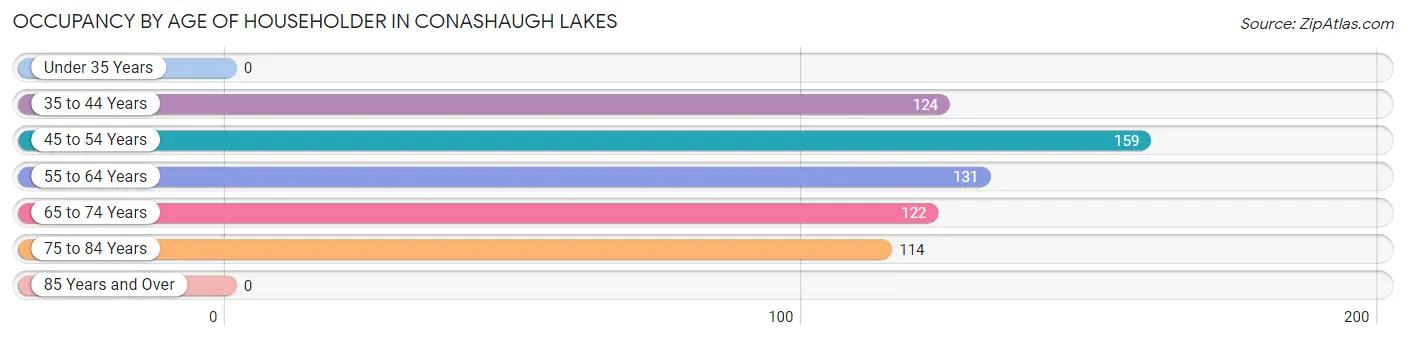
| Age Bracket | # Households | % Households |
| Under 35 Years | 0 | 0.0% |
| 35 to 44 Years | 124 | 19.1% |
| 45 to 54 Years | 159 | 24.5% |
| 55 to 64 Years | 131 | 20.2% |
| 65 to 74 Years | 122 | 18.8% |
| 75 to 84 Years | 114 | 17.5% |
| 85 Years and Over | 0 | 0.0% |
| Total | 650 | 100.0% |
Housing Finances in Conashaugh Lakes
Median Income by Occupancy in Conashaugh Lakes
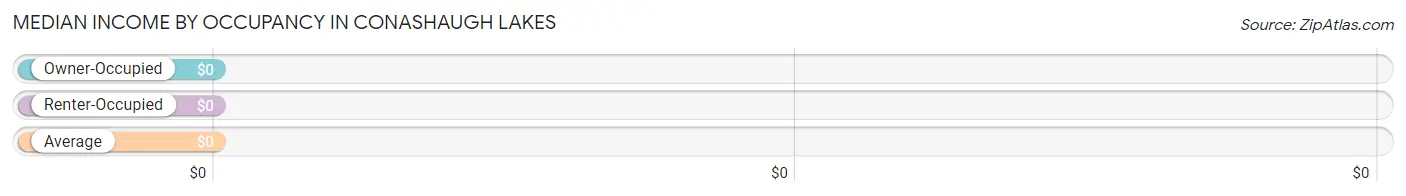
| Occupancy Type | # Households | Median Income |
| Owner-Occupied | 650 (100.0%) | $0 |
| Renter-Occupied | 0 (0.0%) | $0 |
| Average | 650 (100.0%) | $0 |
Occupancy by Householder Income Bracket in Conashaugh Lakes
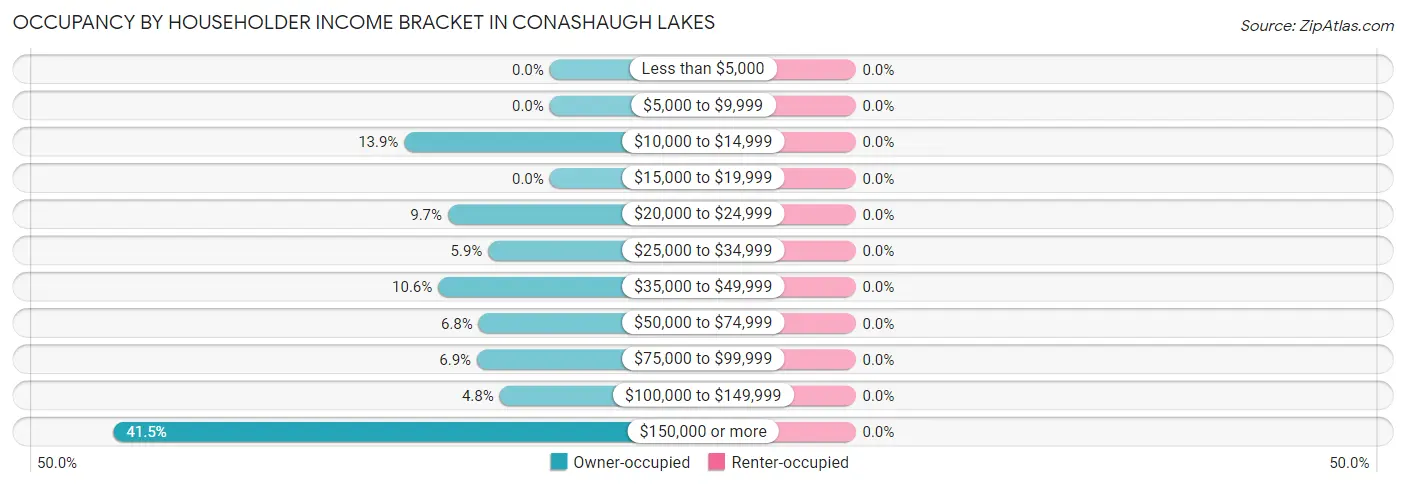
| Income Bracket | Owner-occupied | Renter-occupied |
| Less than $5,000 | 0 (0.0%) | 0 (0.0%) |
| $5,000 to $9,999 | 0 (0.0%) | 0 (0.0%) |
| $10,000 to $14,999 | 90 (13.9%) | 0 (0.0%) |
| $15,000 to $19,999 | 0 (0.0%) | 0 (0.0%) |
| $20,000 to $24,999 | 63 (9.7%) | 0 (0.0%) |
| $25,000 to $34,999 | 38 (5.9%) | 0 (0.0%) |
| $35,000 to $49,999 | 69 (10.6%) | 0 (0.0%) |
| $50,000 to $74,999 | 44 (6.8%) | 0 (0.0%) |
| $75,000 to $99,999 | 45 (6.9%) | 0 (0.0%) |
| $100,000 to $149,999 | 31 (4.8%) | 0 (0.0%) |
| $150,000 or more | 270 (41.5%) | 0 (0.0%) |
| Total | 650 (100.0%) | 0 (0.0%) |
Monthly Housing Cost Tiers in Conashaugh Lakes
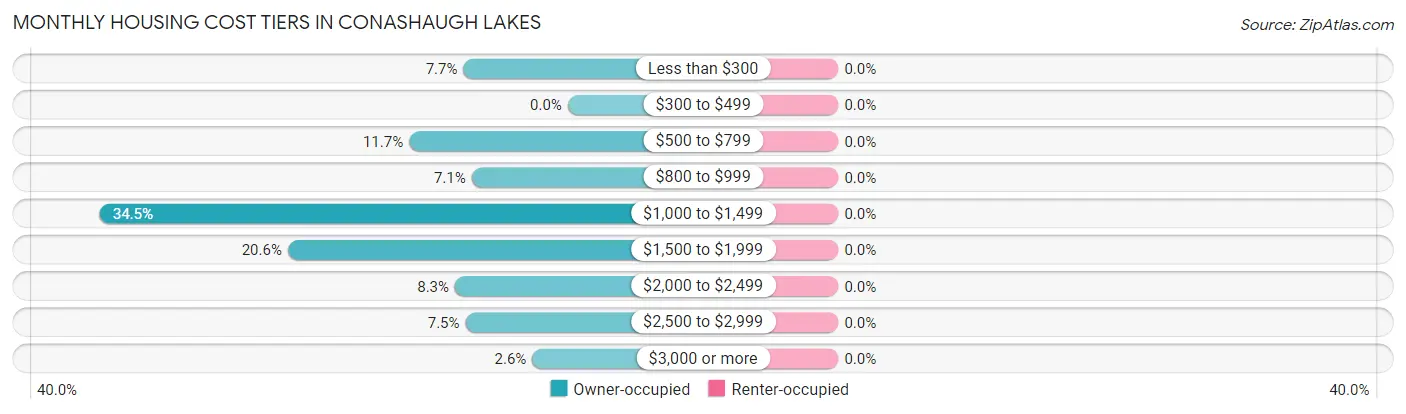
| Monthly Cost | Owner-occupied | Renter-occupied |
| Less than $300 | 50 (7.7%) | 0 (0.0%) |
| $300 to $499 | 0 (0.0%) | 0 (0.0%) |
| $500 to $799 | 76 (11.7%) | 0 (0.0%) |
| $800 to $999 | 46 (7.1%) | 0 (0.0%) |
| $1,000 to $1,499 | 224 (34.5%) | 0 (0.0%) |
| $1,500 to $1,999 | 134 (20.6%) | 0 (0.0%) |
| $2,000 to $2,499 | 54 (8.3%) | 0 (0.0%) |
| $2,500 to $2,999 | 49 (7.5%) | 0 (0.0%) |
| $3,000 or more | 17 (2.6%) | 0 (0.0%) |
| Total | 650 (100.0%) | 0 (0.0%) |
Physical Housing Characteristics in Conashaugh Lakes
Housing Structures in Conashaugh Lakes
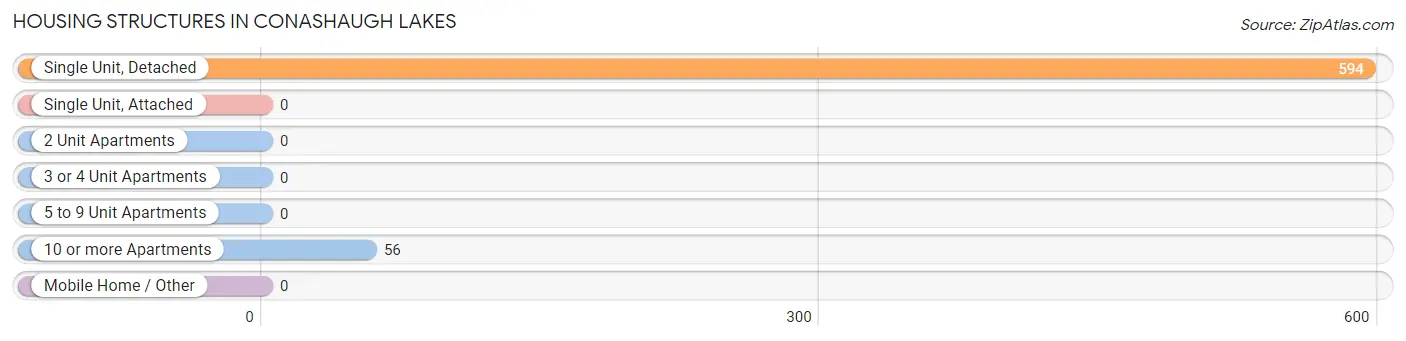
| Structure Type | # Housing Units | % Housing Units |
| Single Unit, Detached | 594 | 91.4% |
| Single Unit, Attached | 0 | 0.0% |
| 2 Unit Apartments | 0 | 0.0% |
| 3 or 4 Unit Apartments | 0 | 0.0% |
| 5 to 9 Unit Apartments | 0 | 0.0% |
| 10 or more Apartments | 56 | 8.6% |
| Mobile Home / Other | 0 | 0.0% |
| Total | 650 | 100.0% |
Housing Structures by Occupancy in Conashaugh Lakes
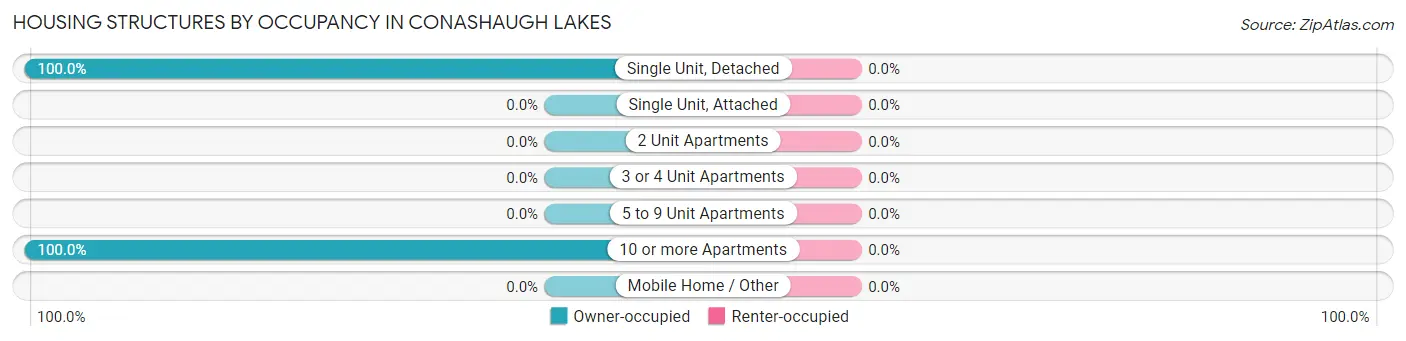
| Structure Type | Owner-occupied | Renter-occupied |
| Single Unit, Detached | 594 (100.0%) | 0 (0.0%) |
| Single Unit, Attached | 0 (0.0%) | 0 (0.0%) |
| 2 Unit Apartments | 0 (0.0%) | 0 (0.0%) |
| 3 or 4 Unit Apartments | 0 (0.0%) | 0 (0.0%) |
| 5 to 9 Unit Apartments | 0 (0.0%) | 0 (0.0%) |
| 10 or more Apartments | 56 (100.0%) | 0 (0.0%) |
| Mobile Home / Other | 0 (0.0%) | 0 (0.0%) |
| Total | 650 (100.0%) | 0 (0.0%) |
Housing Structures by Number of Rooms in Conashaugh Lakes
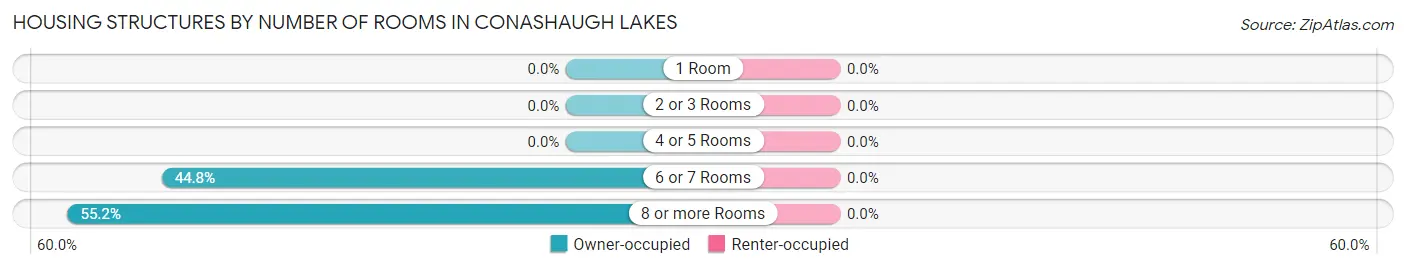
| Number of Rooms | Owner-occupied | Renter-occupied |
| 1 Room | 0 (0.0%) | 0 (0.0%) |
| 2 or 3 Rooms | 0 (0.0%) | 0 (0.0%) |
| 4 or 5 Rooms | 0 (0.0%) | 0 (0.0%) |
| 6 or 7 Rooms | 291 (44.8%) | 0 (0.0%) |
| 8 or more Rooms | 359 (55.2%) | 0 (0.0%) |
| Total | 650 (100.0%) | 0 (0.0%) |
Housing Structure by Heating Type in Conashaugh Lakes
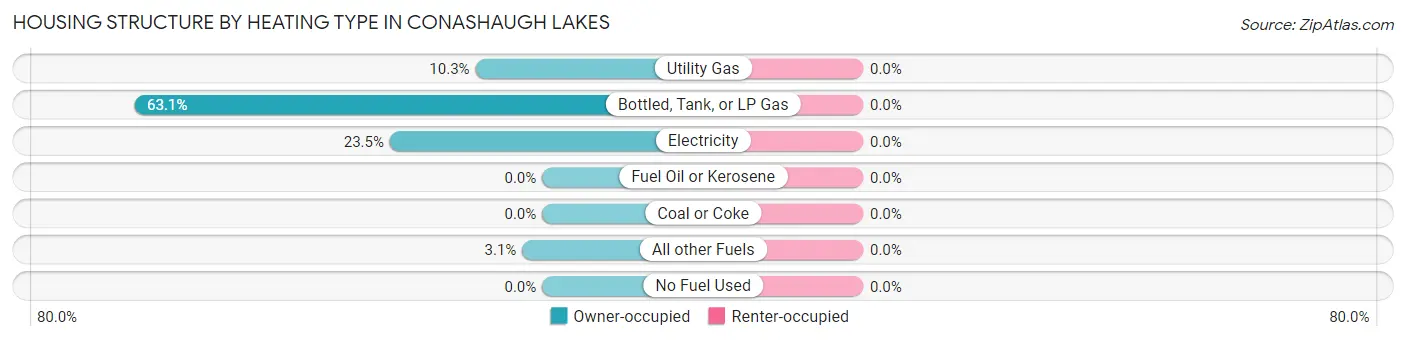
| Heating Type | Owner-occupied | Renter-occupied |
| Utility Gas | 67 (10.3%) | 0 (0.0%) |
| Bottled, Tank, or LP Gas | 410 (63.1%) | 0 (0.0%) |
| Electricity | 153 (23.5%) | 0 (0.0%) |
| Fuel Oil or Kerosene | 0 (0.0%) | 0 (0.0%) |
| Coal or Coke | 0 (0.0%) | 0 (0.0%) |
| All other Fuels | 20 (3.1%) | 0 (0.0%) |
| No Fuel Used | 0 (0.0%) | 0 (0.0%) |
| Total | 650 (100.0%) | 0 (0.0%) |
Household Vehicle Usage in Conashaugh Lakes
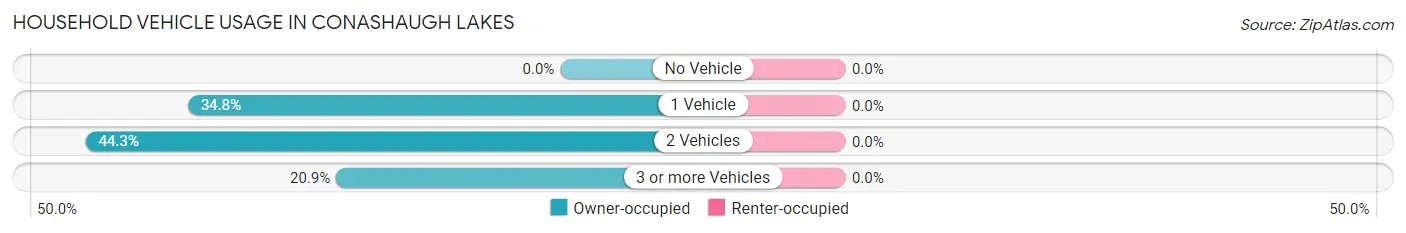
| Vehicles per Household | Owner-occupied | Renter-occupied |
| No Vehicle | 0 (0.0%) | 0 (0.0%) |
| 1 Vehicle | 226 (34.8%) | 0 (0.0%) |
| 2 Vehicles | 288 (44.3%) | 0 (0.0%) |
| 3 or more Vehicles | 136 (20.9%) | 0 (0.0%) |
| Total | 650 (100.0%) | 0 (0.0%) |
Real Estate & Mortgages in Conashaugh Lakes
Real Estate and Mortgage Overview in Conashaugh Lakes
| Characteristic | Without Mortgage | With Mortgage |
| Housing Units | 202 | 448 |
| Median Property Value | $263,000 | $295,300 |
| Median Household Income | - | - |
| Monthly Housing Costs | $591 | $17 |
| Real Estate Taxes | $3,554 | $0 |
Property Value by Mortgage Status in Conashaugh Lakes
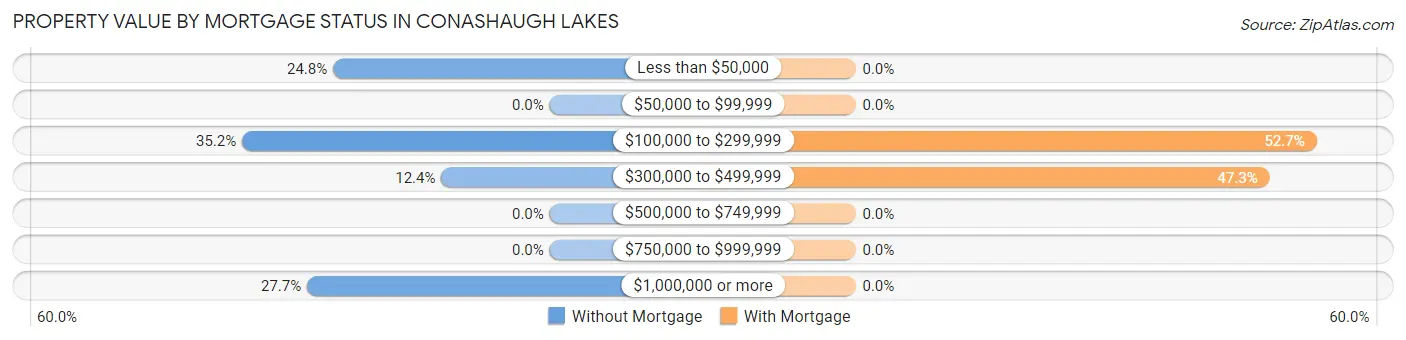
| Property Value | Without Mortgage | With Mortgage |
| Less than $50,000 | 50 (24.7%) | 0 (0.0%) |
| $50,000 to $99,999 | 0 (0.0%) | 0 (0.0%) |
| $100,000 to $299,999 | 71 (35.1%) | 236 (52.7%) |
| $300,000 to $499,999 | 25 (12.4%) | 212 (47.3%) |
| $500,000 to $749,999 | 0 (0.0%) | 0 (0.0%) |
| $750,000 to $999,999 | 0 (0.0%) | 0 (0.0%) |
| $1,000,000 or more | 56 (27.7%) | 0 (0.0%) |
| Total | 202 (100.0%) | 448 (100.0%) |
Household Income by Mortgage Status in Conashaugh Lakes
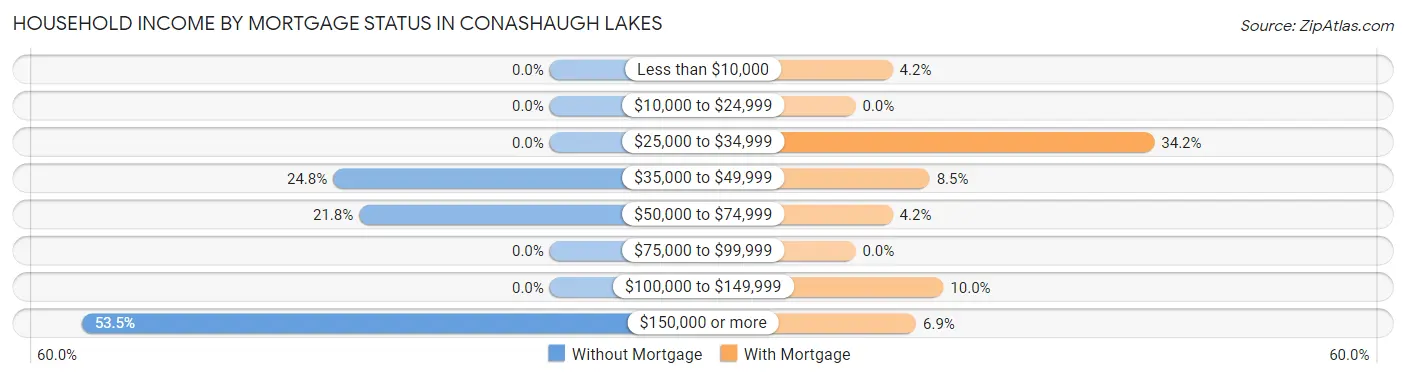
| Household Income | Without Mortgage | With Mortgage |
| Less than $10,000 | 0 (0.0%) | 19 (4.2%) |
| $10,000 to $24,999 | 0 (0.0%) | 0 (0.0%) |
| $25,000 to $34,999 | 0 (0.0%) | 153 (34.2%) |
| $35,000 to $49,999 | 50 (24.7%) | 38 (8.5%) |
| $50,000 to $74,999 | 44 (21.8%) | 19 (4.2%) |
| $75,000 to $99,999 | 0 (0.0%) | 0 (0.0%) |
| $100,000 to $149,999 | 0 (0.0%) | 45 (10.0%) |
| $150,000 or more | 108 (53.5%) | 31 (6.9%) |
| Total | 202 (100.0%) | 448 (100.0%) |
Property Value to Household Income Ratio in Conashaugh Lakes
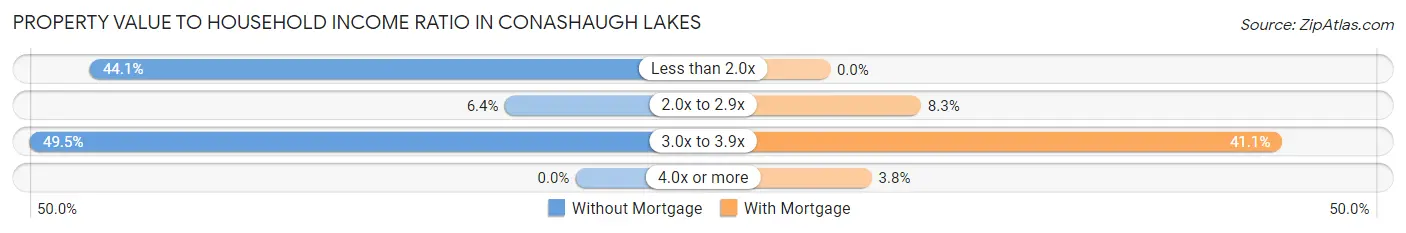
| Value-to-Income Ratio | Without Mortgage | With Mortgage |
| Less than 2.0x | 89 (44.1%) | 0 (0.0%) |
| 2.0x to 2.9x | 13 (6.4%) | 37 (8.3%) |
| 3.0x to 3.9x | 100 (49.5%) | 184 (41.1%) |
| 4.0x or more | 0 (0.0%) | 17 (3.8%) |
| Total | 202 (100.0%) | 448 (100.0%) |
Real Estate Taxes by Mortgage Status in Conashaugh Lakes
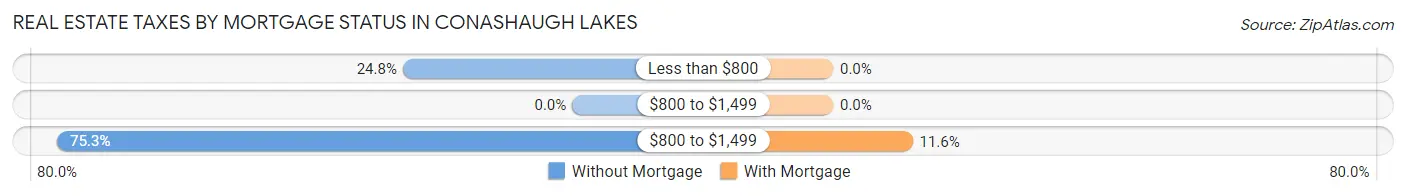
| Property Taxes | Without Mortgage | With Mortgage |
| Less than $800 | 50 (24.7%) | 0 (0.0%) |
| $800 to $1,499 | 0 (0.0%) | 0 (0.0%) |
| $800 to $1,499 | 152 (75.2%) | 52 (11.6%) |
| Total | 202 (100.0%) | 448 (100.0%) |
Health & Disability in Conashaugh Lakes
Health Insurance Coverage by Age in Conashaugh Lakes
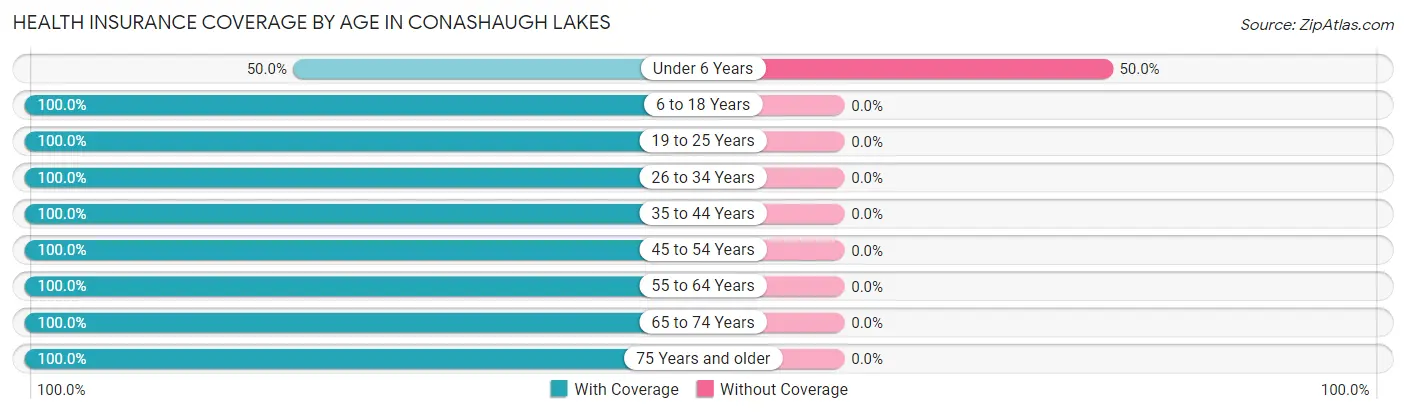
| Age Bracket | With Coverage | Without Coverage |
| Under 6 Years | 20 (50.0%) | 20 (50.0%) |
| 6 to 18 Years | 275 (100.0%) | 0 (0.0%) |
| 19 to 25 Years | 83 (100.0%) | 0 (0.0%) |
| 26 to 34 Years | 48 (100.0%) | 0 (0.0%) |
| 35 to 44 Years | 179 (100.0%) | 0 (0.0%) |
| 45 to 54 Years | 359 (100.0%) | 0 (0.0%) |
| 55 to 64 Years | 240 (100.0%) | 0 (0.0%) |
| 65 to 74 Years | 190 (100.0%) | 0 (0.0%) |
| 75 Years and older | 136 (100.0%) | 0 (0.0%) |
| Total | 1,530 (98.7%) | 20 (1.3%) |
Health Insurance Coverage by Citizenship Status in Conashaugh Lakes
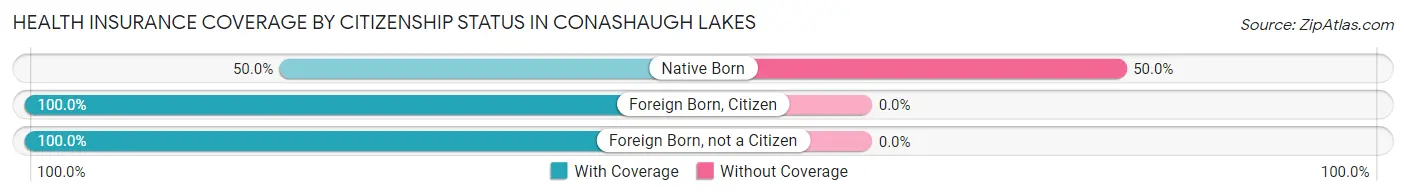
| Citizenship Status | With Coverage | Without Coverage |
| Native Born | 20 (50.0%) | 20 (50.0%) |
| Foreign Born, Citizen | 275 (100.0%) | 0 (0.0%) |
| Foreign Born, not a Citizen | 83 (100.0%) | 0 (0.0%) |
Health Insurance Coverage by Household Income in Conashaugh Lakes
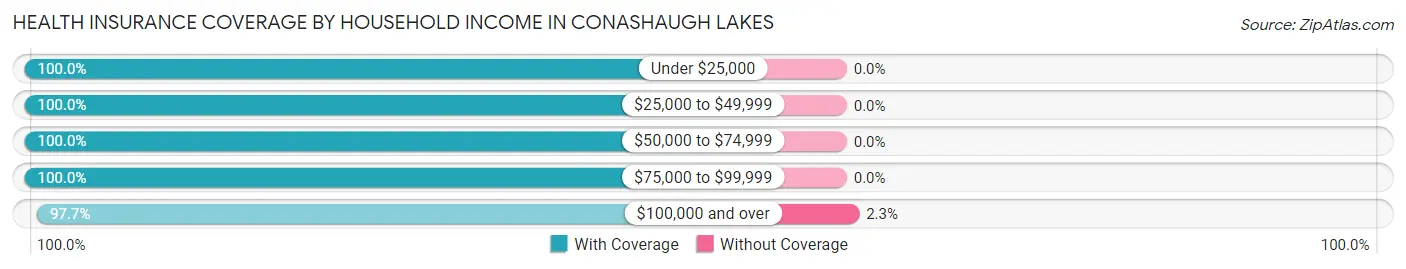
| Household Income | With Coverage | Without Coverage |
| Under $25,000 | 153 (100.0%) | 0 (0.0%) |
| $25,000 to $49,999 | 280 (100.0%) | 0 (0.0%) |
| $50,000 to $74,999 | 85 (100.0%) | 0 (0.0%) |
| $75,000 to $99,999 | 174 (100.0%) | 0 (0.0%) |
| $100,000 and over | 838 (97.7%) | 20 (2.3%) |
Public vs Private Health Insurance Coverage by Age in Conashaugh Lakes
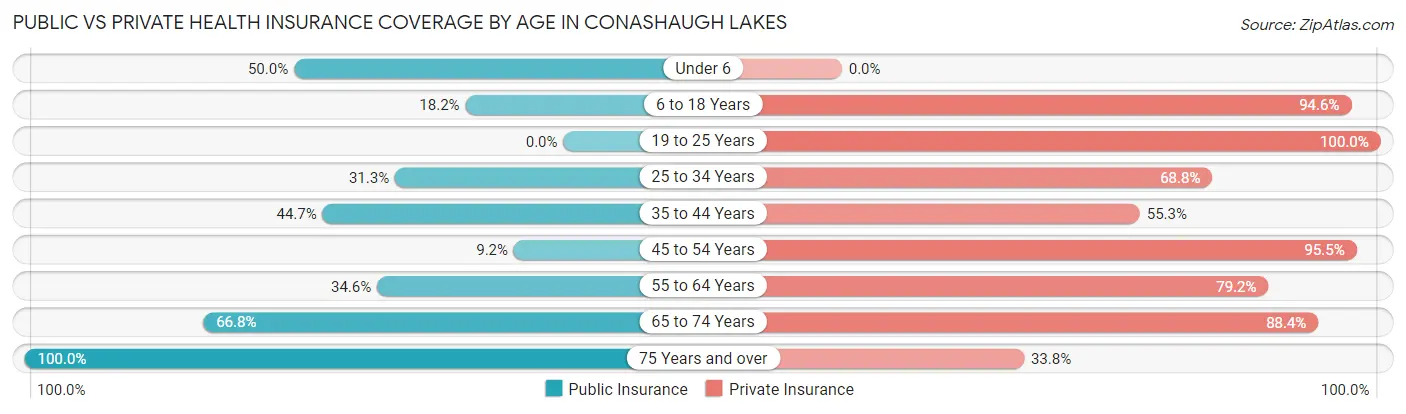
| Age Bracket | Public Insurance | Private Insurance |
| Under 6 | 20 (50.0%) | 0 (0.0%) |
| 6 to 18 Years | 50 (18.2%) | 260 (94.6%) |
| 19 to 25 Years | 0 (0.0%) | 83 (100.0%) |
| 25 to 34 Years | 15 (31.2%) | 33 (68.8%) |
| 35 to 44 Years | 80 (44.7%) | 99 (55.3%) |
| 45 to 54 Years | 33 (9.2%) | 343 (95.5%) |
| 55 to 64 Years | 83 (34.6%) | 190 (79.2%) |
| 65 to 74 Years | 127 (66.8%) | 168 (88.4%) |
| 75 Years and over | 136 (100.0%) | 46 (33.8%) |
| Total | 544 (35.1%) | 1,222 (78.8%) |
Disability Status by Sex by Age in Conashaugh Lakes
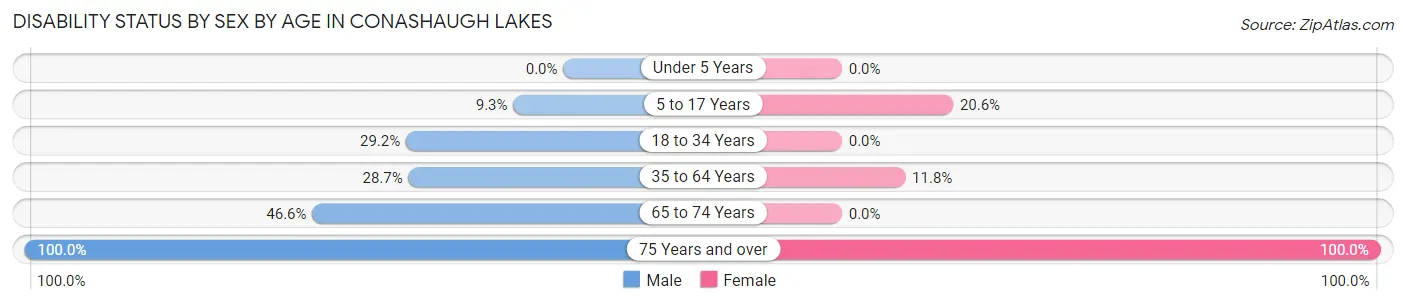
| Age Bracket | Male | Female |
| Under 5 Years | 0 (0.0%) | 0 (0.0%) |
| 5 to 17 Years | 18 (9.3%) | 13 (20.6%) |
| 18 to 34 Years | 33 (29.2%) | 0 (0.0%) |
| 35 to 64 Years | 121 (28.7%) | 42 (11.8%) |
| 65 to 74 Years | 41 (46.6%) | 0 (0.0%) |
| 75 Years and over | 114 (100.0%) | 22 (100.0%) |
Disability Class by Sex by Age in Conashaugh Lakes
Disability Class: Hearing Difficulty
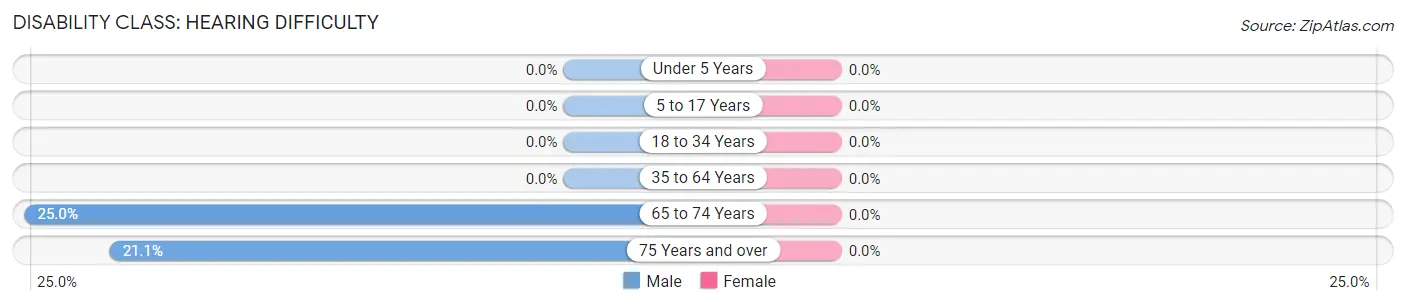
| Age Bracket | Male | Female |
| Under 5 Years | 0 (0.0%) | 0 (0.0%) |
| 5 to 17 Years | 0 (0.0%) | 0 (0.0%) |
| 18 to 34 Years | 0 (0.0%) | 0 (0.0%) |
| 35 to 64 Years | 0 (0.0%) | 0 (0.0%) |
| 65 to 74 Years | 22 (25.0%) | 0 (0.0%) |
| 75 Years and over | 24 (21.0%) | 0 (0.0%) |
Disability Class: Vision Difficulty
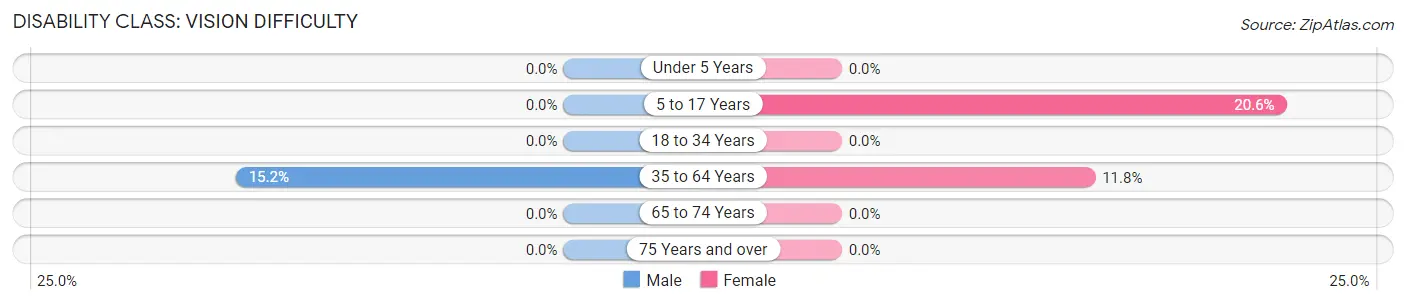
| Age Bracket | Male | Female |
| Under 5 Years | 0 (0.0%) | 0 (0.0%) |
| 5 to 17 Years | 0 (0.0%) | 13 (20.6%) |
| 18 to 34 Years | 0 (0.0%) | 0 (0.0%) |
| 35 to 64 Years | 64 (15.2%) | 42 (11.8%) |
| 65 to 74 Years | 0 (0.0%) | 0 (0.0%) |
| 75 Years and over | 0 (0.0%) | 0 (0.0%) |
Disability Class: Cognitive Difficulty
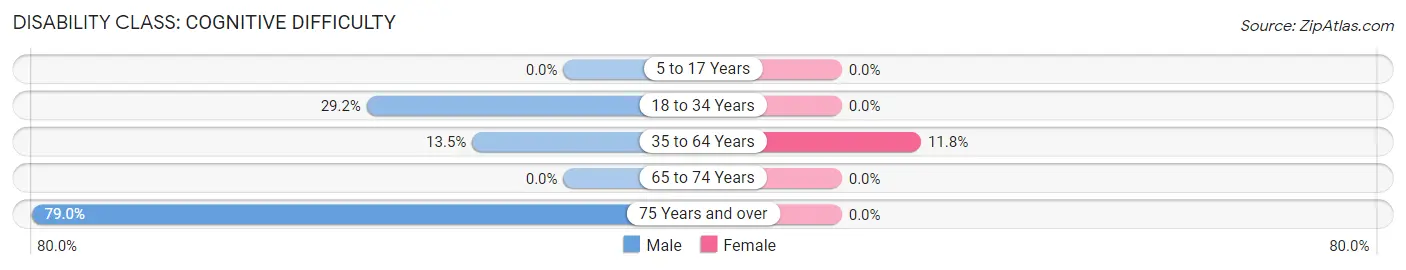
| Age Bracket | Male | Female |
| 5 to 17 Years | 0 (0.0%) | 0 (0.0%) |
| 18 to 34 Years | 33 (29.2%) | 0 (0.0%) |
| 35 to 64 Years | 57 (13.5%) | 42 (11.8%) |
| 65 to 74 Years | 0 (0.0%) | 0 (0.0%) |
| 75 Years and over | 90 (78.9%) | 0 (0.0%) |
Disability Class: Ambulatory Difficulty
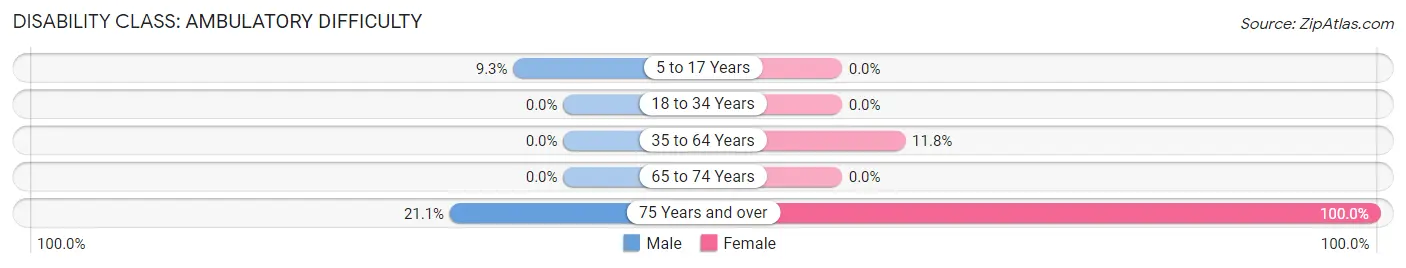
| Age Bracket | Male | Female |
| 5 to 17 Years | 18 (9.3%) | 0 (0.0%) |
| 18 to 34 Years | 0 (0.0%) | 0 (0.0%) |
| 35 to 64 Years | 0 (0.0%) | 42 (11.8%) |
| 65 to 74 Years | 0 (0.0%) | 0 (0.0%) |
| 75 Years and over | 24 (21.0%) | 22 (100.0%) |
Disability Class: Self-Care Difficulty
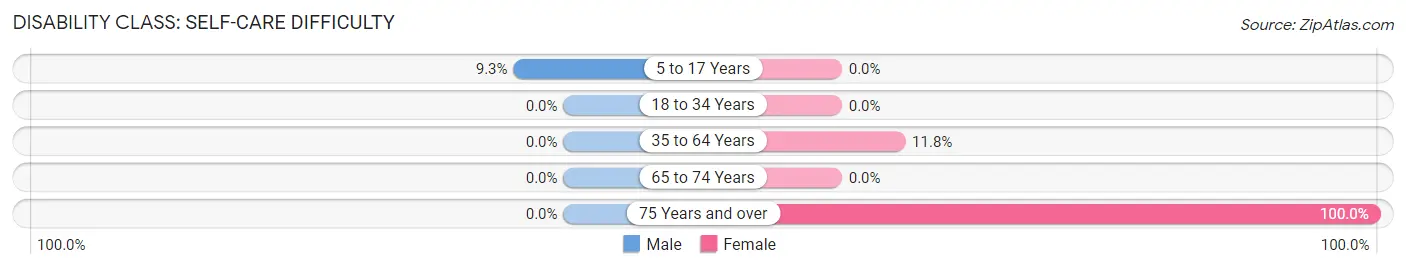
| Age Bracket | Male | Female |
| 5 to 17 Years | 18 (9.3%) | 0 (0.0%) |
| 18 to 34 Years | 0 (0.0%) | 0 (0.0%) |
| 35 to 64 Years | 0 (0.0%) | 42 (11.8%) |
| 65 to 74 Years | 0 (0.0%) | 0 (0.0%) |
| 75 Years and over | 0 (0.0%) | 22 (100.0%) |
Technology Access in Conashaugh Lakes
Computing Device Access in Conashaugh Lakes
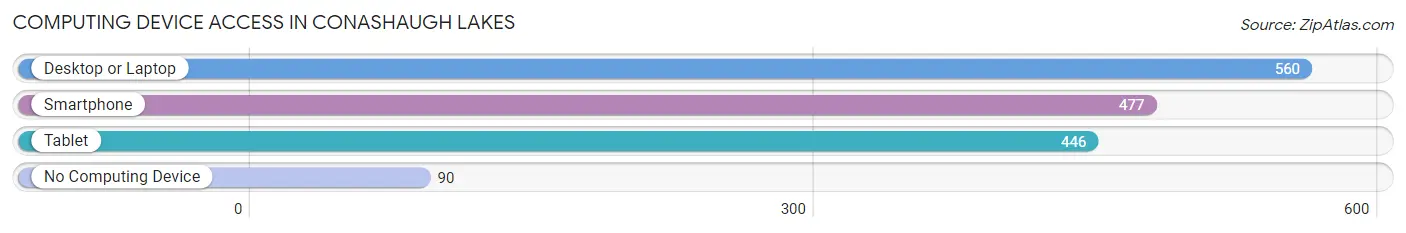
| Device Type | # Households | % Households |
| Desktop or Laptop | 560 | 86.2% |
| Smartphone | 477 | 73.4% |
| Tablet | 446 | 68.6% |
| No Computing Device | 90 | 13.9% |
| Total | 650 | 100.0% |
Internet Access in Conashaugh Lakes
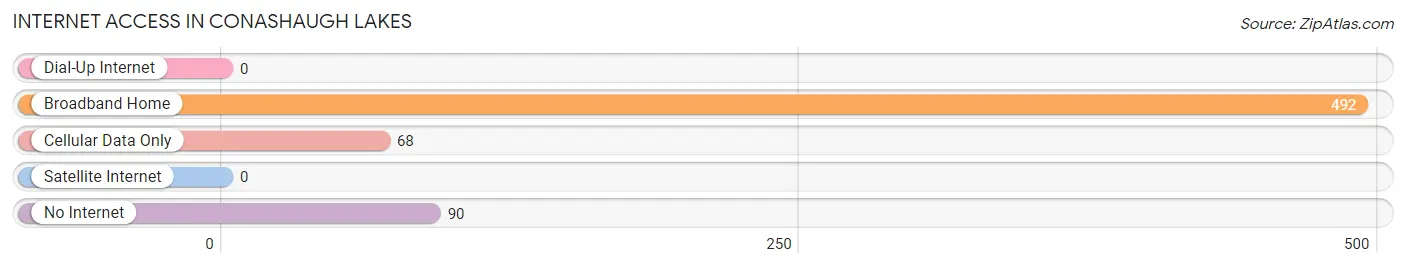
| Internet Type | # Households | % Households |
| Dial-Up Internet | 0 | 0.0% |
| Broadband Home | 492 | 75.7% |
| Cellular Data Only | 68 | 10.5% |
| Satellite Internet | 0 | 0.0% |
| No Internet | 90 | 13.9% |
| Total | 650 | 100.0% |
Conashaugh Lakes Summary
Conashaugh Lakes is a small community located in Wayne County, Pennsylvania. It is situated in the Pocono Mountains, and is surrounded by the Delaware River, the Lackawaxen River, and the Conashaugh Lakes. The community is home to approximately 1,000 people, and is known for its picturesque scenery and outdoor activities.
History
The Conashaugh Lakes area has a long and varied history. The first settlers in the area were the Lenape Indians, who lived in the area for centuries before the arrival of European settlers. The first Europeans to settle in the area were Dutch and German immigrants, who arrived in the late 1700s. The area was originally known as “Conashaugh”, which is derived from the Lenape word for “place of many lakes”.
In the early 1800s, the area was home to a number of small farms and sawmills. The area was also home to a number of small businesses, including a grist mill, a tannery, and a blacksmith shop. The area was also home to a number of churches, including the Conashaugh Presbyterian Church, which was founded in 1820.
In the late 1800s, the area began to attract tourists, who were drawn to the area’s natural beauty and outdoor activities. The area was also home to a number of resorts, including the Conashaugh Lakes Hotel, which was built in 1891.
Geography
Conashaugh Lakes is located in the Pocono Mountains of northeastern Pennsylvania. The area is surrounded by the Delaware River, the Lackawaxen River, and the Conashaugh Lakes. The area is home to a number of small lakes, including Lake Wallenpaupack, Lake Teedyuskung, and Lake Winola. The area is also home to a number of state parks, including Promised Land State Park, which is located just south of the community.
Economy
The economy of Conashaugh Lakes is largely based on tourism. The area is home to a number of resorts, hotels, and restaurants, which attract visitors from all over the region. The area is also home to a number of outdoor activities, including fishing, boating, hiking, and camping. The area is also home to a number of small businesses, including a grocery store, a hardware store, and a gas station.
Demographics
As of the 2010 census, the population of Conashaugh Lakes was 1,000. The population is largely white (94.2%), with a small percentage of African Americans (2.2%) and Hispanics (2.2%). The median household income in the area is $45,000, and the median home value is $150,000. The area is home to a number of churches, including the Conashaugh Presbyterian Church, which was founded in 1820.
Conclusion
Conashaugh Lakes is a small community located in Wayne County, Pennsylvania. It is situated in the Pocono Mountains, and is surrounded by the Delaware River, the Lackawaxen River, and the Conashaugh Lakes. The community is home to approximately 1,000 people, and is known for its picturesque scenery and outdoor activities. The economy of Conashaugh Lakes is largely based on tourism, and the area is home to a number of resorts, hotels, and restaurants. The population of Conashaugh Lakes is largely white, with a small percentage of African Americans and Hispanics. The area is home to a number of churches, including the Conashaugh Presbyterian Church, which was founded in 1820.
Common Questions
What is Per Capita Income in Conashaugh Lakes?
Per Capita income in Conashaugh Lakes is $46,443.
What is the Median Family Income in Conashaugh Lakes?
Median Family Income in Conashaugh Lakes is $150,568.
What is Inequality or Gini Index in Conashaugh Lakes?
Inequality or Gini Index in Conashaugh Lakes is 0.46.
What is the Total Population of Conashaugh Lakes?
Total Population of Conashaugh Lakes is 1,550.
What is the Total Male Population of Conashaugh Lakes?
Total Male Population of Conashaugh Lakes is 970.
What is the Total Female Population of Conashaugh Lakes?
Total Female Population of Conashaugh Lakes is 580.
What is the Ratio of Males per 100 Females in Conashaugh Lakes?
There are 167.24 Males per 100 Females in Conashaugh Lakes.
What is the Ratio of Females per 100 Males in Conashaugh Lakes?
There are 59.79 Females per 100 Males in Conashaugh Lakes.
What is the Median Population Age in Conashaugh Lakes?
Median Population Age in Conashaugh Lakes is 48.7 Years.
What is the Average Family Size in Conashaugh Lakes
Average Family Size in Conashaugh Lakes is 3.1 People.
What is the Average Household Size in Conashaugh Lakes
Average Household Size in Conashaugh Lakes is 2.4 People.
How Large is the Labor Force in Conashaugh Lakes?
There are 853 People in the Labor Forcein in Conashaugh Lakes.
What is the Percentage of People in the Labor Force in Conashaugh Lakes?
64.4% of People are in the Labor Force in Conashaugh Lakes.
What is the Unemployment Rate in Conashaugh Lakes?
Unemployment Rate in Conashaugh Lakes is 17.7%.