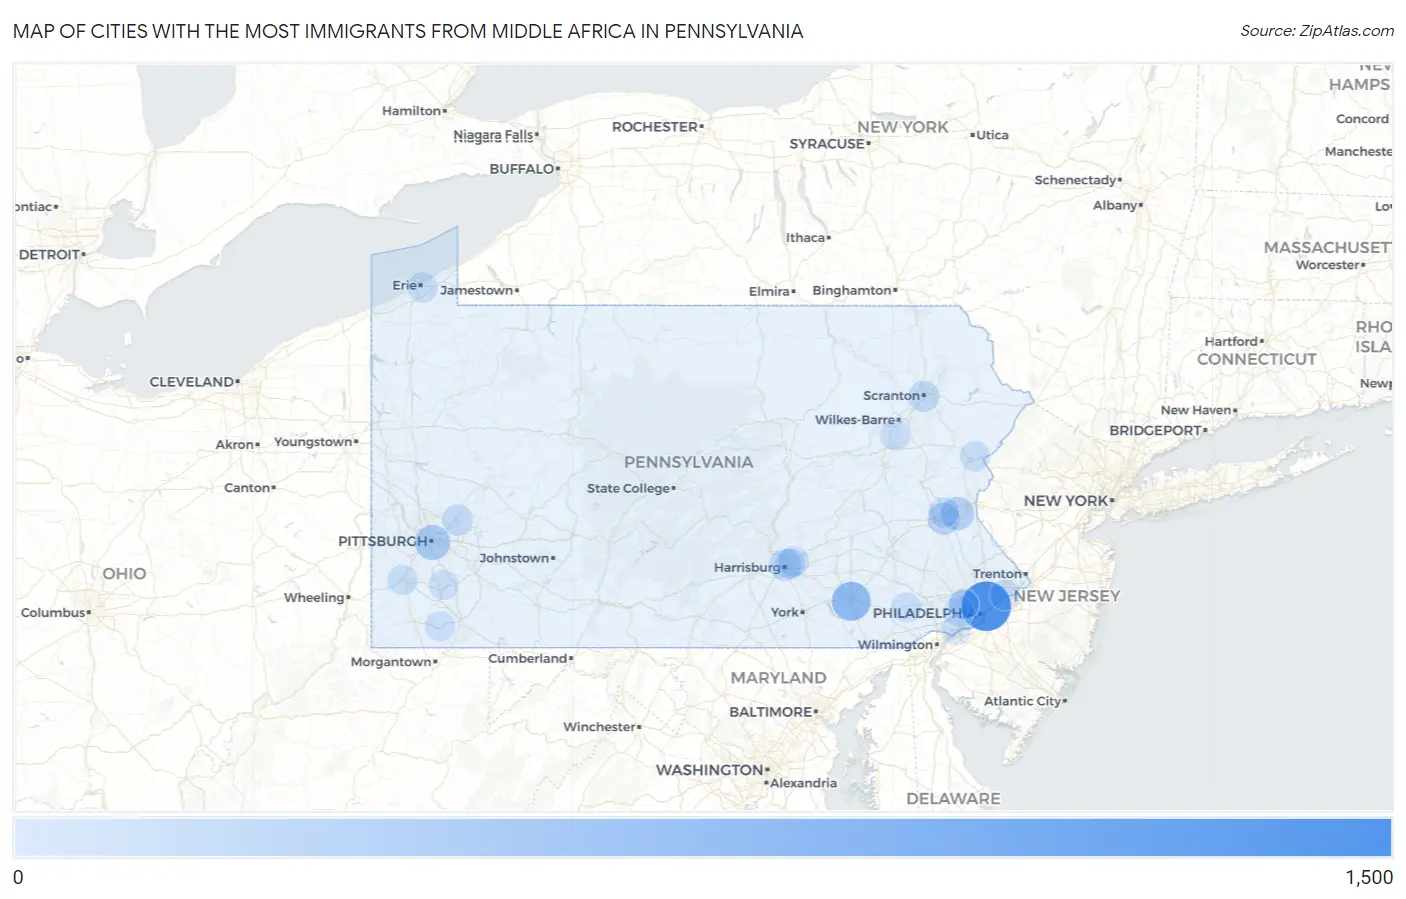
Cities with the Most Immigrants from Middle Africa in Pennsylvania
RELATED REPORTS & OPTIONS
Middle Africa
Pennsylvania
Compare Cities
Map of Cities with the Most Immigrants from Middle Africa in Pennsylvania
0
1,500
Cities with the Most Immigrants from Middle Africa in Pennsylvania
| City | Middle Africa | vs State | vs National | |
| 1. | Philadelphia | 1,470 | 5,179(28.38%)#1 | 193,874(0.76%)#17 |
| 2. | Lancaster | 650 | 5,179(12.55%)#2 | 193,874(0.34%)#52 |
| 3. | Pittsburgh | 366 | 5,179(7.07%)#3 | 193,874(0.19%)#106 |
| 4. | Norristown Borough | 247 | 5,179(4.77%)#4 | 193,874(0.13%)#166 |
| 5. | Bethlehem | 234 | 5,179(4.52%)#5 | 193,874(0.12%)#180 |
| 6. | Allentown | 154 | 5,179(2.97%)#6 | 193,874(0.08%)#249 |
| 7. | Harrisburg | 130 | 5,179(2.51%)#7 | 193,874(0.07%)#284 |
| 8. | Darby Borough | 69 | 5,179(1.33%)#8 | 193,874(0.04%)#464 |
| 9. | Arnold | 67 | 5,179(1.29%)#9 | 193,874(0.03%)#475 |
| 10. | Scranton | 65 | 5,179(1.26%)#10 | 193,874(0.03%)#482 |
| 11. | Whitehall Borough | 63 | 5,179(1.22%)#11 | 193,874(0.03%)#496 |
| 12. | Wilkinsburg Borough | 61 | 5,179(1.18%)#12 | 193,874(0.03%)#507 |
| 13. | Baldwin Borough | 59 | 5,179(1.14%)#13 | 193,874(0.03%)#513 |
| 14. | Quakertown Borough | 51 | 5,179(0.98%)#14 | 193,874(0.03%)#565 |
| 15. | Yeadon Borough | 43 | 5,179(0.83%)#15 | 193,874(0.02%)#624 |
| 16. | Fullerton | 34 | 5,179(0.66%)#16 | 193,874(0.02%)#706 |
| 17. | Waynesburg Borough | 34 | 5,179(0.66%)#17 | 193,874(0.02%)#711 |
| 18. | California Borough | 32 | 5,179(0.62%)#18 | 193,874(0.02%)#732 |
| 19. | Swarthmore Borough | 31 | 5,179(0.60%)#19 | 193,874(0.02%)#740 |
| 20. | Hatfield Borough | 30 | 5,179(0.58%)#20 | 193,874(0.02%)#752 |
| 21. | Cornwells Heights | 30 | 5,179(0.58%)#21 | 193,874(0.02%)#753 |
| 22. | Colonial Park | 26 | 5,179(0.50%)#22 | 193,874(0.01%)#800 |
| 23. | Washington | 26 | 5,179(0.50%)#23 | 193,874(0.01%)#801 |
| 24. | Mountain Top | 24 | 5,179(0.46%)#24 | 193,874(0.01%)#819 |
| 25. | Aspinwall Borough | 23 | 5,179(0.44%)#25 | 193,874(0.01%)#837 |
| 26. | Morgan Hill | 23 | 5,179(0.44%)#26 | 193,874(0.01%)#841 |
| 27. | Brookhaven Borough | 22 | 5,179(0.42%)#27 | 193,874(0.01%)#859 |
| 28. | Progress | 21 | 5,179(0.41%)#28 | 193,874(0.01%)#872 |
| 29. | Arlington Heights | 21 | 5,179(0.41%)#29 | 193,874(0.01%)#874 |
| 30. | Plymouth Borough | 18 | 5,179(0.35%)#30 | 193,874(0.01%)#935 |
| 31. | Broomall | 16 | 5,179(0.31%)#31 | 193,874(0.01%)#971 |
| 32. | Erie | 13 | 5,179(0.25%)#32 | 193,874(0.01%)#1,026 |
| 33. | Souderton Borough | 13 | 5,179(0.25%)#33 | 193,874(0.01%)#1,043 |
| 34. | Braddock Borough | 13 | 5,179(0.25%)#34 | 193,874(0.01%)#1,052 |
| 35. | Ephrata Borough | 12 | 5,179(0.23%)#35 | 193,874(0.01%)#1,076 |
| 36. | Coatesville | 12 | 5,179(0.23%)#36 | 193,874(0.01%)#1,077 |
| 37. | Bryn Mawr | 11 | 5,179(0.21%)#37 | 193,874(0.01%)#1,112 |
| 38. | Economy Borough | 10 | 5,179(0.19%)#38 | 193,874(0.01%)#1,139 |
| 39. | Ronco | 10 | 5,179(0.19%)#39 | 193,874(0.01%)#1,149 |
| 40. | West Homestead Borough | 9 | 5,179(0.17%)#40 | 193,874(0.00%)#1,184 |
| 41. | Hanover Borough | 8 | 5,179(0.15%)#41 | 193,874(0.00%)#1,199 |
| 42. | Hellertown Borough | 8 | 5,179(0.15%)#42 | 193,874(0.00%)#1,203 |
| 43. | Millville Borough | 8 | 5,179(0.15%)#43 | 193,874(0.00%)#1,212 |
| 44. | East Washington Borough | 7 | 5,179(0.14%)#44 | 193,874(0.00%)#1,234 |
| 45. | Sewickley Heights Borough | 7 | 5,179(0.14%)#45 | 193,874(0.00%)#1,236 |
| 46. | Monessen | 6 | 5,179(0.12%)#46 | 193,874(0.00%)#1,254 |
| 47. | Dalton Borough | 6 | 5,179(0.12%)#47 | 193,874(0.00%)#1,261 |
| 48. | Chester | 4 | 5,179(0.08%)#48 | 193,874(0.00%)#1,287 |
| 49. | Haverford College | 4 | 5,179(0.08%)#49 | 193,874(0.00%)#1,297 |
| 50. | Conneautville Borough | 4 | 5,179(0.08%)#50 | 193,874(0.00%)#1,299 |
| 51. | Hallstead Borough | 1 | 5,179(0.02%)#51 | 193,874(0.00%)#1,393 |
Common Questions
What are the Top 10 Cities with the Most Immigrants from Middle Africa in Pennsylvania?
Top 10 Cities with the Most Immigrants from Middle Africa in Pennsylvania are:
#1
1,470
#2
650
#3
366
#4
234
#5
154
#6
130
#7
67
#8
65
#9
34
#10
30
What city has the Most Immigrants from Middle Africa in Pennsylvania?
Philadelphia has the Most Immigrants from Middle Africa in Pennsylvania with 1,470.
What is the Total Immigrants from Middle Africa in the State of Pennsylvania?
Total Immigrants from Middle Africa in Pennsylvania is 5,179.
What is the Total Immigrants from Middle Africa in the United States?
Total Immigrants from Middle Africa in the United States is 193,874.