Etna borough, PA Map & Demographics
Etna borough Overview
$30,318
PER CAPITA INCOME
$69,773
AVG FAMILY INCOME
$46,892
AVG HOUSEHOLD INCOME
34.6%
WAGE / INCOME GAP [ % ]
65.4¢/ $1
WAGE / INCOME GAP [ $ ]
$7,210
FAMILY INCOME DEFICIT
0.44
INEQUALITY / GINI INDEX
3,413
TOTAL POPULATION
1,797
MALE POPULATION
1,616
FEMALE POPULATION
111.20
MALES / 100 FEMALES
89.93
FEMALES / 100 MALES
41.8
MEDIAN AGE
2.7
AVG FAMILY SIZE
2.1
AVG HOUSEHOLD SIZE
1,791
LABOR FORCE [ PEOPLE ]
63.1%
PERCENT IN LABOR FORCE
8.9%
UNEMPLOYMENT RATE
Income in Etna borough
Income Overview in Etna borough
Per Capita Income in Etna borough is $30,318, while median incomes of families and households are $69,773 and $46,892 respectively.
| Characteristic | Number | Measure |
| Per Capita Income | 3,413 | $30,318 |
| Median Family Income | 900 | $69,773 |
| Mean Family Income | 900 | $82,755 |
| Median Household Income | 1,656 | $46,892 |
| Mean Household Income | 1,656 | $62,535 |
| Income Deficit | 900 | $7,210 |
| Wage / Income Gap (%) | 3,413 | 34.62% |
| Wage / Income Gap ($) | 3,413 | 65.38¢ per $1 |
| Gini / Inequality Index | 3,413 | 0.44 |
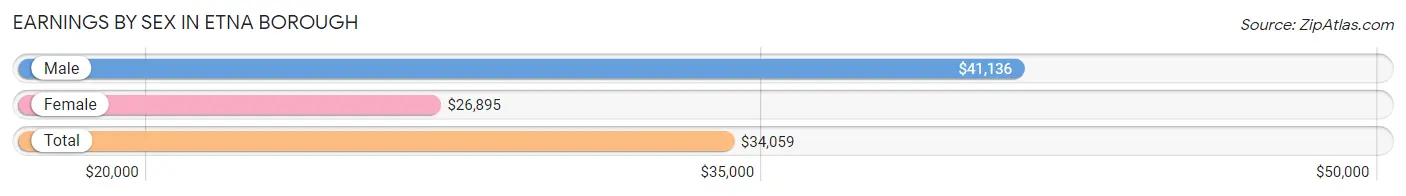
Earnings by Sex in Etna borough
Average Earnings in Etna borough are $34,059, $41,136 for men and $26,895 for women, a difference of 34.6%.
| Sex | Number | Average Earnings |
| Male | 916 (49.0%) | $41,136 |
| Female | 955 (51.0%) | $26,895 |
| Total | 1,871 (100.0%) | $34,059 |
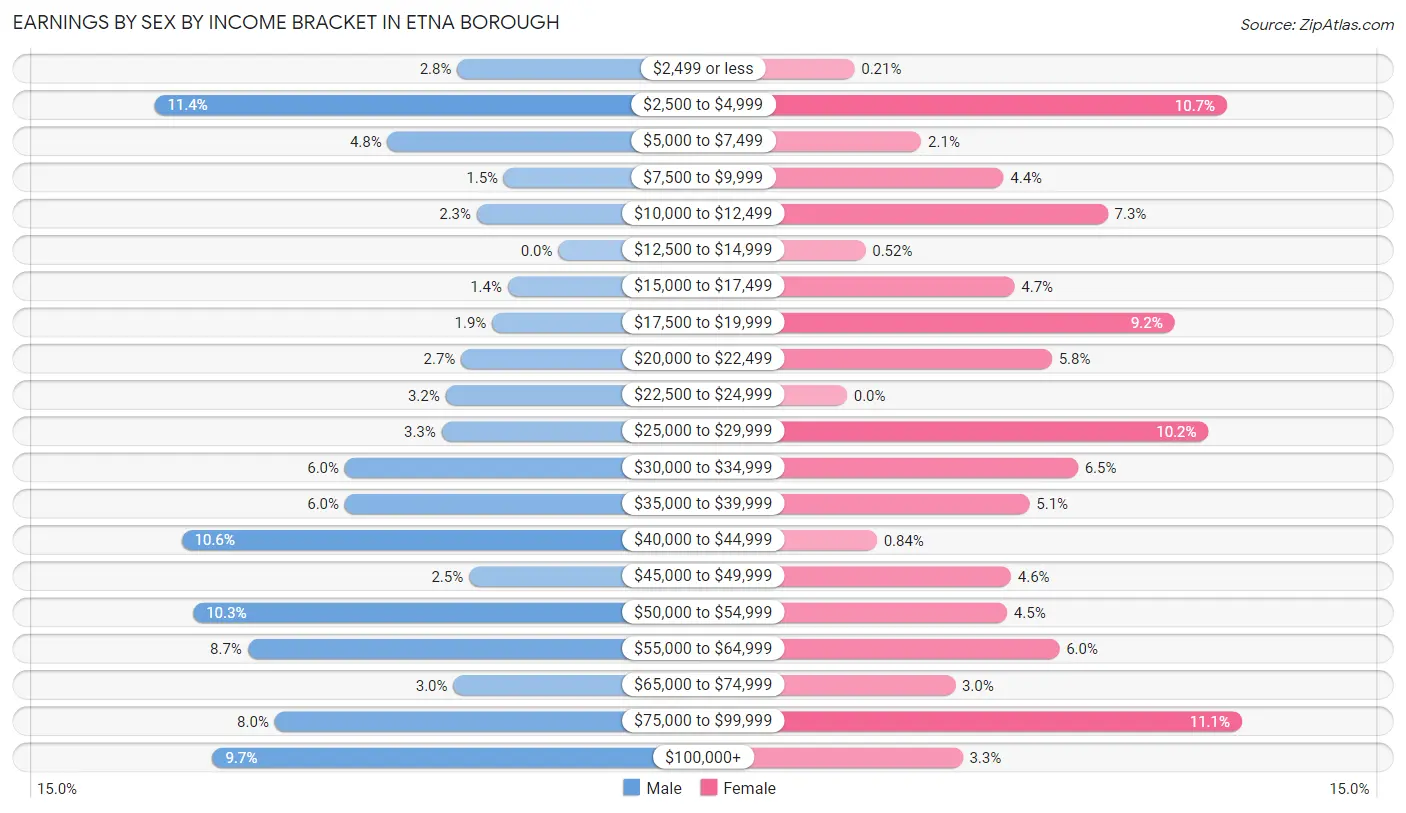
Earnings by Sex by Income Bracket in Etna borough
The most common earnings brackets in Etna borough are $2,500 to $4,999 for men (104 | 11.4%) and $75,000 to $99,999 for women (106 | 11.1%).
| Income | Male | Female |
| $2,499 or less | 26 (2.8%) | 2 (0.2%) |
| $2,500 to $4,999 | 104 (11.4%) | 102 (10.7%) |
| $5,000 to $7,499 | 44 (4.8%) | 20 (2.1%) |
| $7,500 to $9,999 | 14 (1.5%) | 42 (4.4%) |
| $10,000 to $12,499 | 21 (2.3%) | 70 (7.3%) |
| $12,500 to $14,999 | 0 (0.0%) | 5 (0.5%) |
| $15,000 to $17,499 | 13 (1.4%) | 45 (4.7%) |
| $17,500 to $19,999 | 17 (1.9%) | 88 (9.2%) |
| $20,000 to $22,499 | 25 (2.7%) | 55 (5.8%) |
| $22,500 to $24,999 | 29 (3.2%) | 0 (0.0%) |
| $25,000 to $29,999 | 30 (3.3%) | 97 (10.2%) |
| $30,000 to $34,999 | 55 (6.0%) | 62 (6.5%) |
| $35,000 to $39,999 | 55 (6.0%) | 49 (5.1%) |
| $40,000 to $44,999 | 97 (10.6%) | 8 (0.8%) |
| $45,000 to $49,999 | 23 (2.5%) | 44 (4.6%) |
| $50,000 to $54,999 | 94 (10.3%) | 43 (4.5%) |
| $55,000 to $64,999 | 80 (8.7%) | 57 (6.0%) |
| $65,000 to $74,999 | 27 (2.9%) | 29 (3.0%) |
| $75,000 to $99,999 | 73 (8.0%) | 106 (11.1%) |
| $100,000+ | 89 (9.7%) | 31 (3.3%) |
| Total | 916 (100.0%) | 955 (100.0%) |
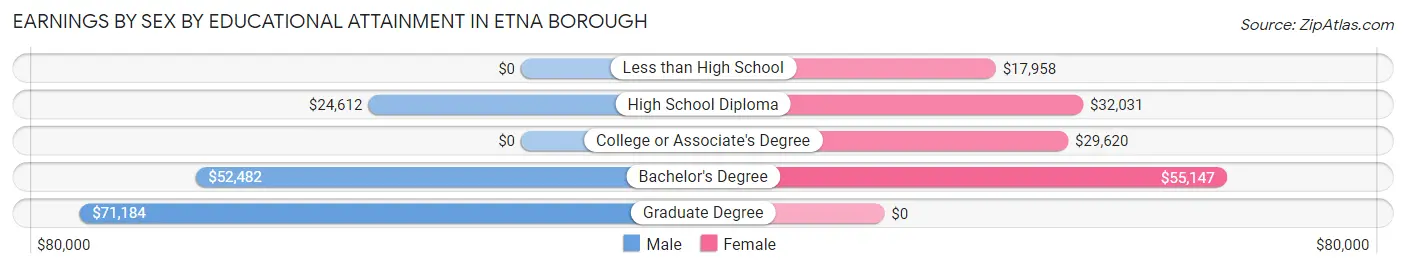
Earnings by Sex by Educational Attainment in Etna borough
Average earnings in Etna borough are $43,214 for men and $29,886 for women, a difference of 30.8%. Men with an educational attainment of graduate degree enjoy the highest average annual earnings of $71,184, while those with high school diploma education earn the least with $24,612. Women with an educational attainment of bachelor's degree earn the most with the average annual earnings of $55,147, while those with less than high school education have the smallest earnings of $17,958.
| Educational Attainment | Male Income | Female Income |
| Less than High School | - | - |
| High School Diploma | $24,612 | $32,031 |
| College or Associate's Degree | - | - |
| Bachelor's Degree | $52,482 | $55,147 |
| Graduate Degree | $71,184 | $0 |
| Total | $43,214 | $29,886 |
Family Income in Etna borough
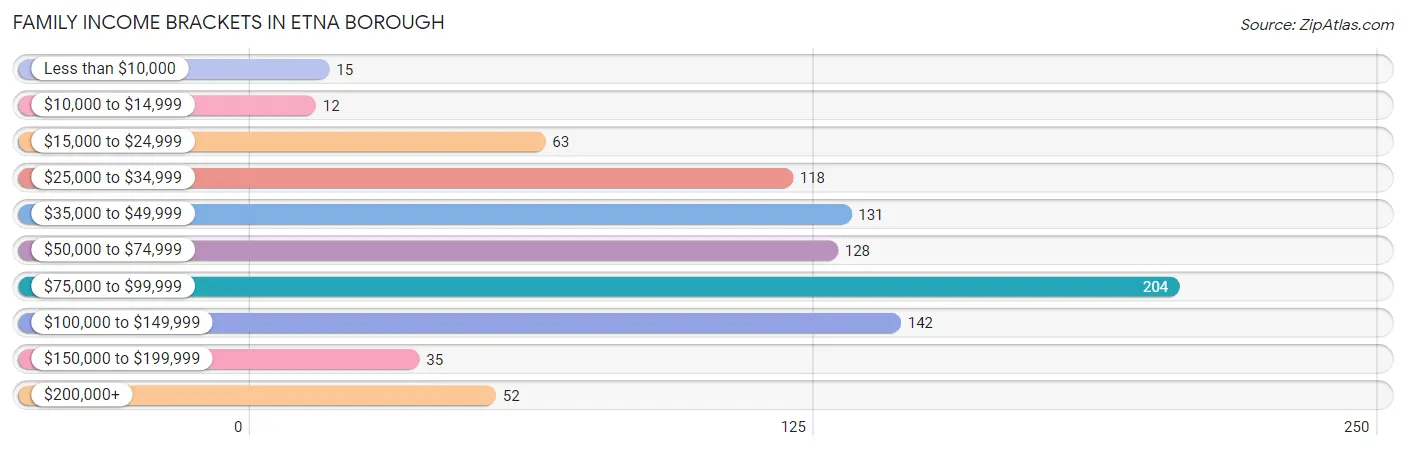
Family Income Brackets in Etna borough
According to the Etna borough family income data, there are 204 families falling into the $75,000 to $99,999 income range, which is the most common income bracket and makes up 22.7% of all families. Conversely, the $10,000 to $14,999 income bracket is the least frequent group with only 12 families (1.3%) belonging to this category.
| Income Bracket | # Families | % Families |
| Less than $10,000 | 15 | 1.7% |
| $10,000 to $14,999 | 12 | 1.3% |
| $15,000 to $24,999 | 63 | 7.0% |
| $25,000 to $34,999 | 118 | 13.1% |
| $35,000 to $49,999 | 131 | 14.6% |
| $50,000 to $74,999 | 128 | 14.2% |
| $75,000 to $99,999 | 204 | 22.7% |
| $100,000 to $149,999 | 142 | 15.8% |
| $150,000 to $199,999 | 35 | 3.9% |
| $200,000+ | 52 | 5.8% |
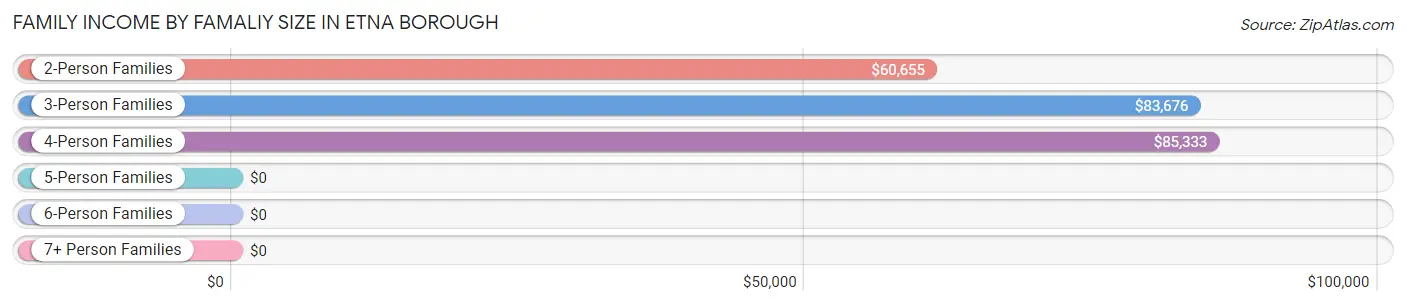
Family Income by Famaliy Size in Etna borough
4-person families (208 | 23.1%) account for the highest median family income in Etna borough with $85,333 per family, while 2-person families (478 | 53.1%) have the highest median income of $30,328 per family member.
| Income Bracket | # Families | Median Income |
| 2-Person Families | 478 (53.1%) | $60,655 |
| 3-Person Families | 214 (23.8%) | $83,676 |
| 4-Person Families | 208 (23.1%) | $85,333 |
| 5-Person Families | 0 (0.0%) | $0 |
| 6-Person Families | 0 (0.0%) | $0 |
| 7+ Person Families | 0 (0.0%) | $0 |
| Total | 900 (100.0%) | $69,773 |
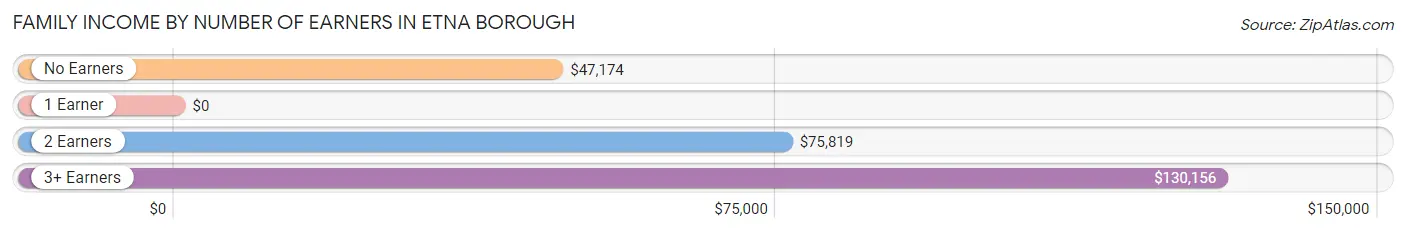
Family Income by Number of Earners in Etna borough
| Number of Earners | # Families | Median Income |
| No Earners | 144 (16.0%) | $47,174 |
| 1 Earner | 262 (29.1%) | $0 |
| 2 Earners | 457 (50.8%) | $75,819 |
| 3+ Earners | 37 (4.1%) | $130,156 |
| Total | 900 (100.0%) | $69,773 |
Household Income in Etna borough
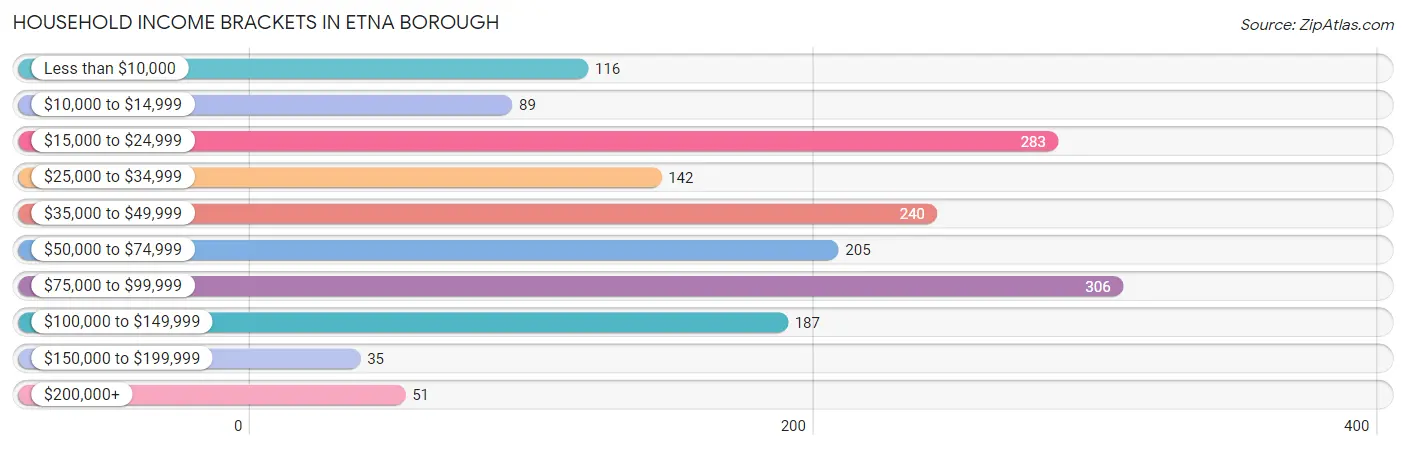
Household Income Brackets in Etna borough
With 306 households falling in the category, the $75,000 to $99,999 income range is the most frequent in Etna borough, accounting for 18.5% of all households. In contrast, only 35 households (2.1%) fall into the $150,000 to $199,999 income bracket, making it the least populous group.
| Income Bracket | # Households | % Households |
| Less than $10,000 | 116 | 7.0% |
| $10,000 to $14,999 | 89 | 5.4% |
| $15,000 to $24,999 | 283 | 17.1% |
| $25,000 to $34,999 | 142 | 8.6% |
| $35,000 to $49,999 | 240 | 14.5% |
| $50,000 to $74,999 | 205 | 12.4% |
| $75,000 to $99,999 | 306 | 18.5% |
| $100,000 to $149,999 | 187 | 11.3% |
| $150,000 to $199,999 | 35 | 2.1% |
| $200,000+ | 51 | 3.1% |
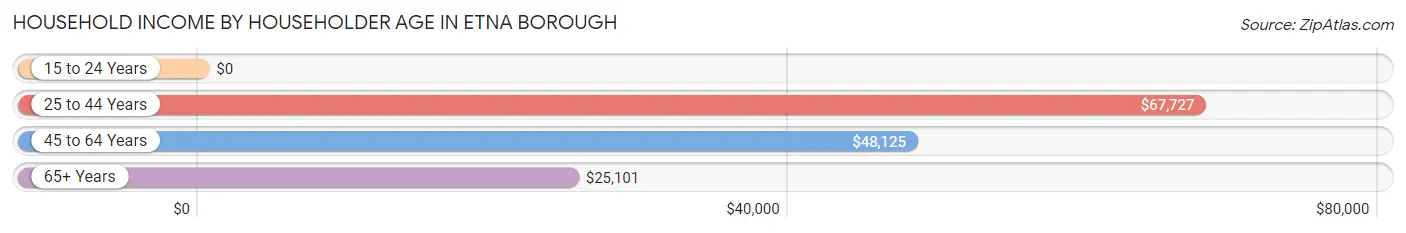
Household Income by Householder Age in Etna borough
The median household income in Etna borough is $46,892, with the highest median household income of $67,727 found in the 25 to 44 years age bracket for the primary householder. A total of 560 households (33.8%) fall into this category.
| Income Bracket | # Households | Median Income |
| 15 to 24 Years | 0 (0.0%) | $0 |
| 25 to 44 Years | 560 (33.8%) | $67,727 |
| 45 to 64 Years | 641 (38.7%) | $48,125 |
| 65+ Years | 455 (27.5%) | $25,101 |
| Total | 1,656 (100.0%) | $46,892 |
Poverty in Etna borough
Income Below Poverty by Sex and Age in Etna borough
With 12.3% poverty level for males and 18.6% for females among the residents of Etna borough, 15 year old males and 18 to 24 year old females are the most vulnerable to poverty, with 30 males (100.0%) and 42 females (44.7%) in their respective age groups living below the poverty level.
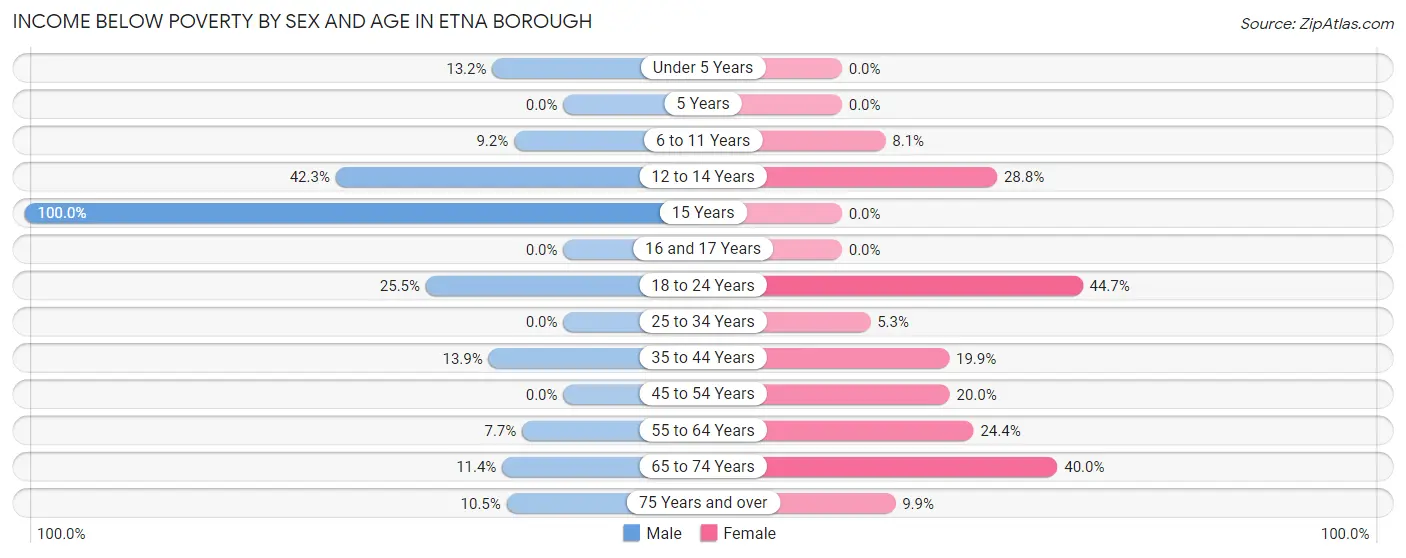
| Age Bracket | Male | Female |
| Under 5 Years | 12 (13.2%) | 0 (0.0%) |
| 5 Years | 0 (0.0%) | 0 (0.0%) |
| 6 to 11 Years | 14 (9.1%) | 8 (8.1%) |
| 12 to 14 Years | 30 (42.2%) | 17 (28.8%) |
| 15 Years | 30 (100.0%) | 0 (0.0%) |
| 16 and 17 Years | 0 (0.0%) | 0 (0.0%) |
| 18 to 24 Years | 37 (25.5%) | 42 (44.7%) |
| 25 to 34 Years | 0 (0.0%) | 15 (5.3%) |
| 35 to 44 Years | 39 (13.9%) | 38 (19.9%) |
| 45 to 54 Years | 0 (0.0%) | 37 (20.0%) |
| 55 to 64 Years | 25 (7.6%) | 66 (24.4%) |
| 65 to 74 Years | 26 (11.4%) | 56 (40.0%) |
| 75 Years and over | 8 (10.5%) | 21 (9.9%) |
| Total | 221 (12.3%) | 300 (18.6%) |
Income Above Poverty by Sex and Age in Etna borough
According to the poverty statistics in Etna borough, males aged 5 years and females aged under 5 years are the age groups that are most secure financially, with 100.0% of males and 100.0% of females in these age groups living above the poverty line.
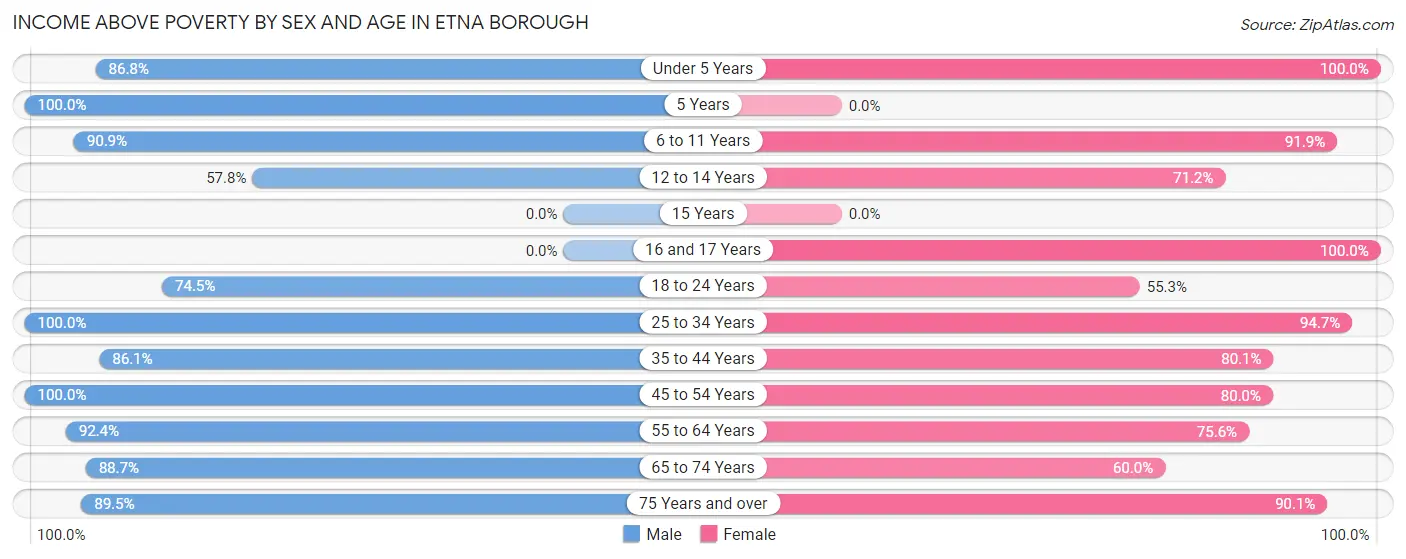
| Age Bracket | Male | Female |
| Under 5 Years | 79 (86.8%) | 66 (100.0%) |
| 5 Years | 5 (100.0%) | 0 (0.0%) |
| 6 to 11 Years | 139 (90.8%) | 91 (91.9%) |
| 12 to 14 Years | 41 (57.8%) | 42 (71.2%) |
| 15 Years | 0 (0.0%) | 0 (0.0%) |
| 16 and 17 Years | 0 (0.0%) | 16 (100.0%) |
| 18 to 24 Years | 108 (74.5%) | 52 (55.3%) |
| 25 to 34 Years | 246 (100.0%) | 269 (94.7%) |
| 35 to 44 Years | 242 (86.1%) | 153 (80.1%) |
| 45 to 54 Years | 143 (100.0%) | 148 (80.0%) |
| 55 to 64 Years | 302 (92.3%) | 204 (75.6%) |
| 65 to 74 Years | 203 (88.6%) | 84 (60.0%) |
| 75 Years and over | 68 (89.5%) | 191 (90.1%) |
| Total | 1,576 (87.7%) | 1,316 (81.4%) |
Income Below Poverty Among Married-Couple Families in Etna borough
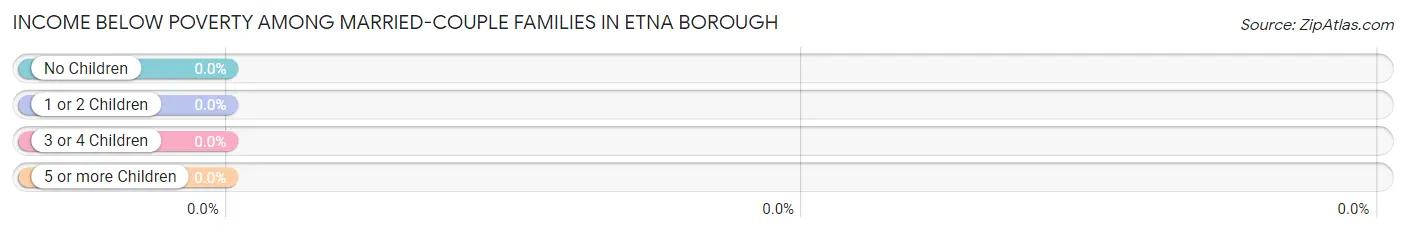
| Children | Above Poverty | Below Poverty |
| No Children | 324 (100.0%) | 0 (0.0%) |
| 1 or 2 Children | 221 (100.0%) | 0 (0.0%) |
| 3 or 4 Children | 0 (0.0%) | 0 (0.0%) |
| 5 or more Children | 0 (0.0%) | 0 (0.0%) |
| Total | 545 (100.0%) | 0 (0.0%) |
Income Below Poverty Among Single-Parent Households in Etna borough
According to the poverty data in Etna borough, 34.3% or 34 single-father households and 17.2% or 44 single-mother households are living below the poverty line. Among single-father households, those with 1 or 2 children have the highest poverty rate, with 24 households (100.0%) experiencing poverty. Likewise, among single-mother households, those with 1 or 2 children have the highest poverty rate, with 32 households (29.6%) falling below the poverty line.
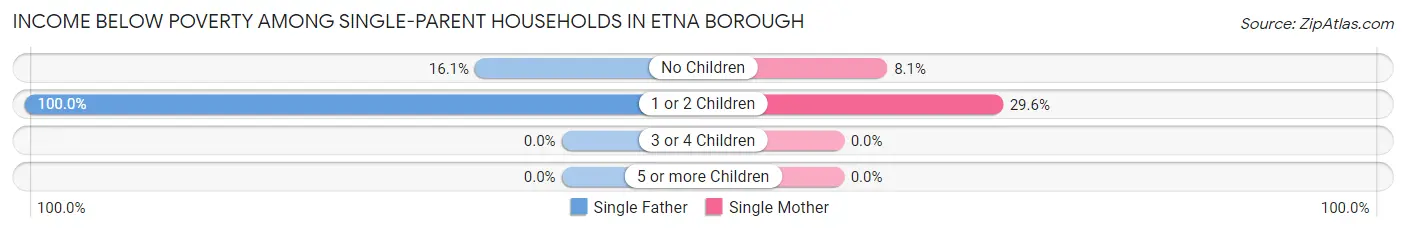
| Children | Single Father | Single Mother |
| No Children | 10 (16.1%) | 12 (8.1%) |
| 1 or 2 Children | 24 (100.0%) | 32 (29.6%) |
| 3 or 4 Children | 0 (0.0%) | 0 (0.0%) |
| 5 or more Children | 0 (0.0%) | 0 (0.0%) |
| Total | 34 (34.3%) | 44 (17.2%) |
Income Below Poverty Among Married-Couple vs Single-Parent Households in Etna borough
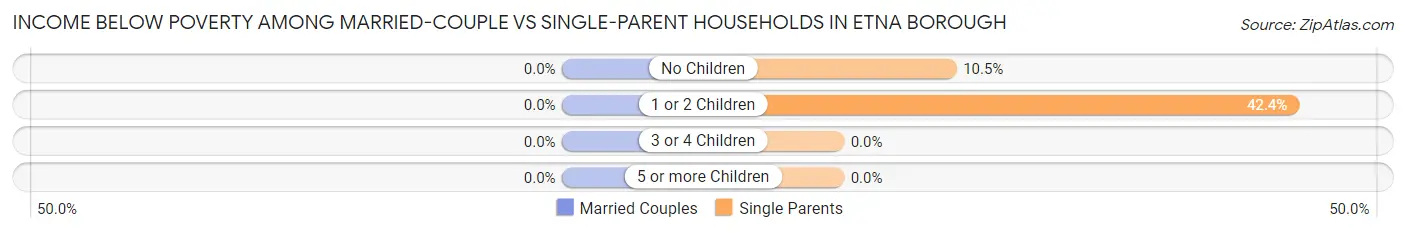
| Children | Married-Couple Families | Single-Parent Households |
| No Children | 0 (0.0%) | 22 (10.5%) |
| 1 or 2 Children | 0 (0.0%) | 56 (42.4%) |
| 3 or 4 Children | 0 (0.0%) | 0 (0.0%) |
| 5 or more Children | 0 (0.0%) | 0 (0.0%) |
| Total | 0 (0.0%) | 78 (22.0%) |
Race in Etna borough
The most populous races in Etna borough are White / Caucasian (3,010 | 88.2%), Two or more Races (191 | 5.6%), and Black / African American (128 | 3.7%).
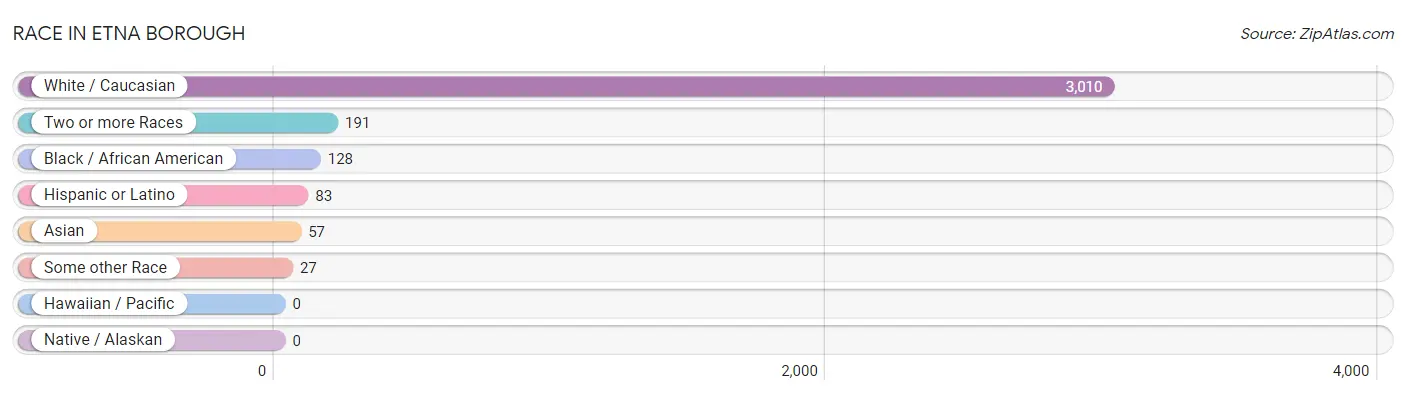
| Race | # Population | % Population |
| Asian | 57 | 1.7% |
| Black / African American | 128 | 3.7% |
| Hawaiian / Pacific | 0 | 0.0% |
| Hispanic or Latino | 83 | 2.4% |
| Native / Alaskan | 0 | 0.0% |
| White / Caucasian | 3,010 | 88.2% |
| Two or more Races | 191 | 5.6% |
| Some other Race | 27 | 0.8% |
| Total | 3,413 | 100.0% |
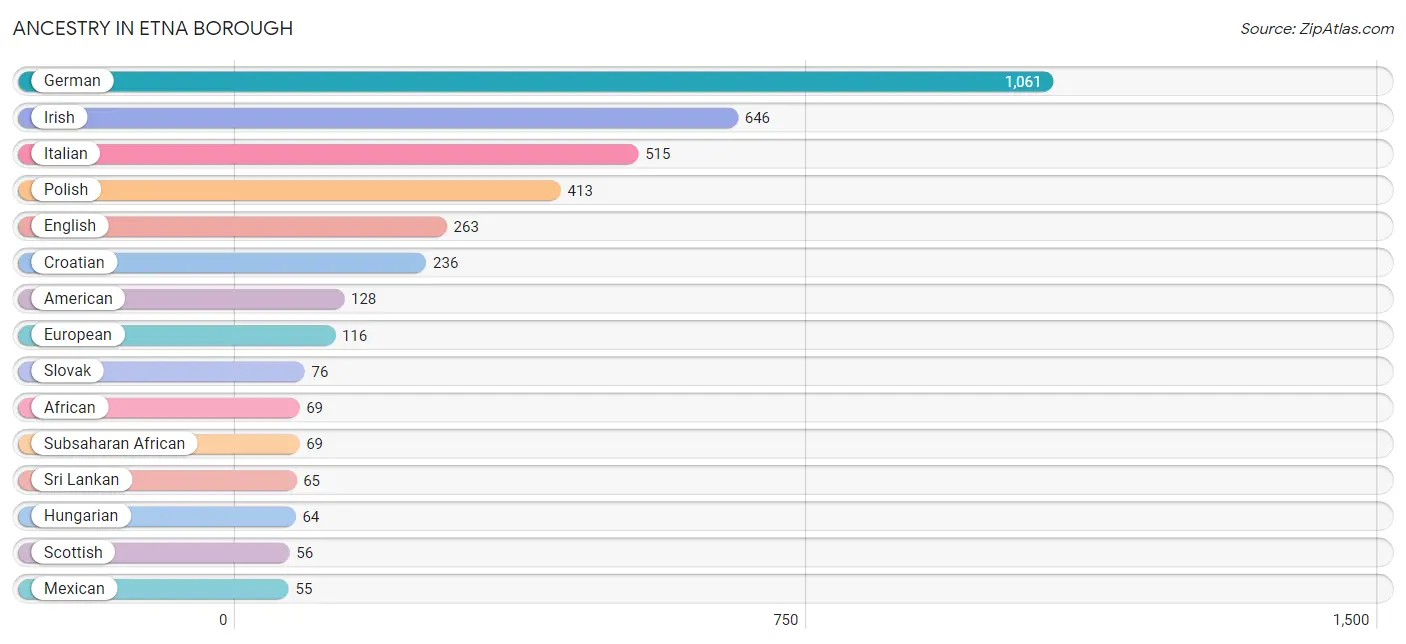
Ancestry in Etna borough
The most populous ancestries reported in Etna borough are German (1,061 | 31.1%), Irish (646 | 18.9%), Italian (515 | 15.1%), Polish (413 | 12.1%), and English (263 | 7.7%), together accounting for 84.9% of all Etna borough residents.
| Ancestry | # Population | % Population |
| African | 69 | 2.0% |
| American | 128 | 3.7% |
| Apache | 14 | 0.4% |
| Austrian | 20 | 0.6% |
| Cherokee | 2 | 0.1% |
| Chippewa | 12 | 0.4% |
| Croatian | 236 | 6.9% |
| Czech | 12 | 0.4% |
| Dutch | 8 | 0.2% |
| English | 263 | 7.7% |
| European | 116 | 3.4% |
| French | 15 | 0.4% |
| German | 1,061 | 31.1% |
| Greek | 9 | 0.3% |
| Hungarian | 64 | 1.9% |
| Indian (Asian) | 39 | 1.1% |
| Iranian | 12 | 0.4% |
| Irish | 646 | 18.9% |
| Italian | 515 | 15.1% |
| Mexican | 55 | 1.6% |
| Polish | 413 | 12.1% |
| Puerto Rican | 28 | 0.8% |
| Russian | 50 | 1.5% |
| Scotch-Irish | 40 | 1.2% |
| Scottish | 56 | 1.6% |
| Slovak | 76 | 2.2% |
| Sri Lankan | 65 | 1.9% |
| Subsaharan African | 69 | 2.0% |
| Swedish | 21 | 0.6% |
| Swiss | 7 | 0.2% |
| Ukrainian | 10 | 0.3% |
| Welsh | 8 | 0.2% | View All 32 Rows |
Immigrants in Etna borough
The most numerous immigrant groups reported in Etna borough came from Asia (37 | 1.1%), Eastern Asia (37 | 1.1%), China (19 | 0.6%), Central America (18 | 0.5%), and Korea (18 | 0.5%), together accounting for 3.8% of all Etna borough residents.
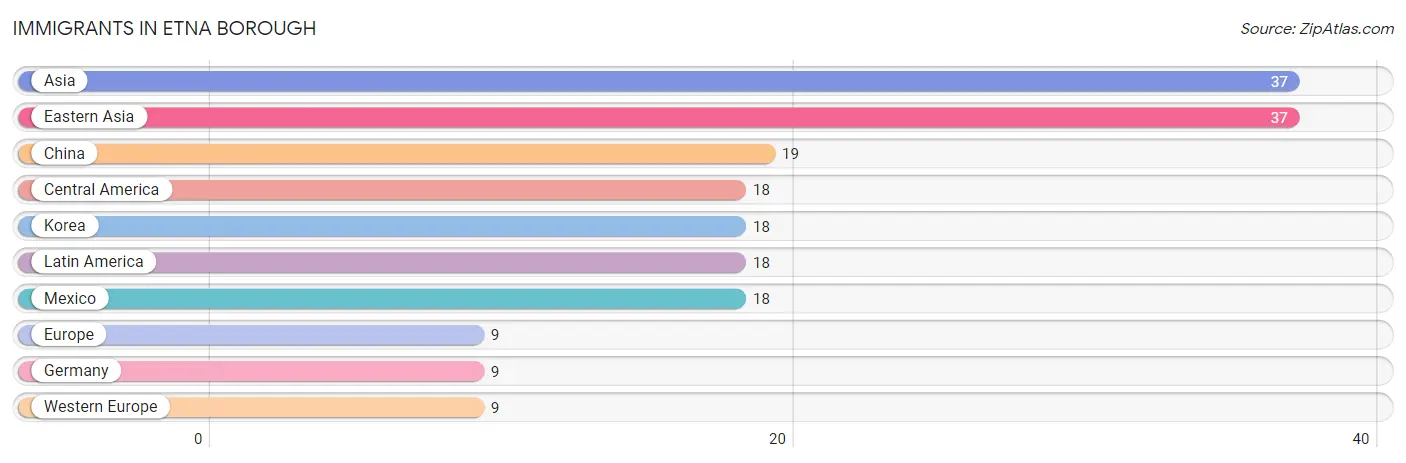
| Immigration Origin | # Population | % Population |
| Asia | 37 | 1.1% |
| Central America | 18 | 0.5% |
| China | 19 | 0.6% |
| Eastern Asia | 37 | 1.1% |
| Europe | 9 | 0.3% |
| Germany | 9 | 0.3% |
| Korea | 18 | 0.5% |
| Latin America | 18 | 0.5% |
| Mexico | 18 | 0.5% |
| Western Europe | 9 | 0.3% | View All 10 Rows |
Sex and Age in Etna borough
Sex and Age in Etna borough
The most populous age groups in Etna borough are 55 to 59 Years (187 | 10.4%) for men and 30 to 34 Years (178 | 11.0%) for women.
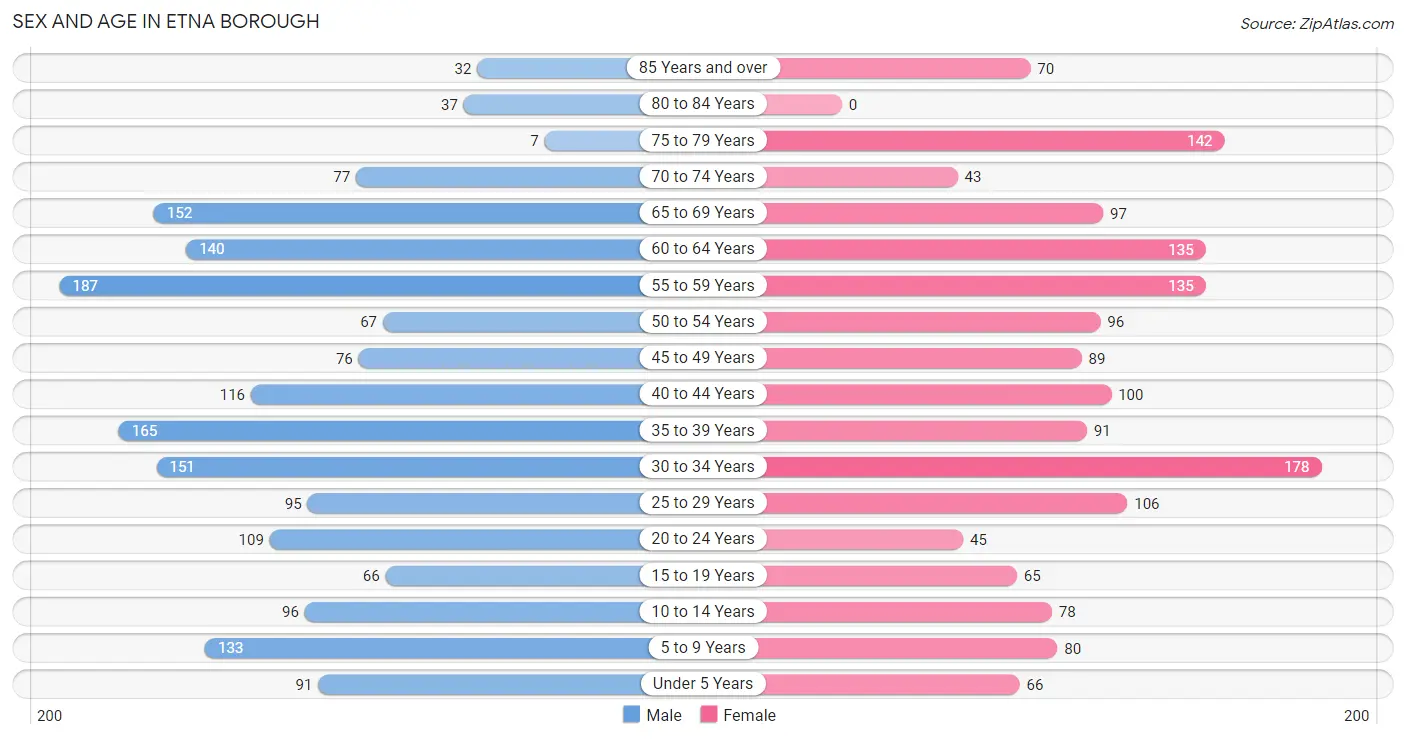
| Age Bracket | Male | Female |
| Under 5 Years | 91 (5.1%) | 66 (4.1%) |
| 5 to 9 Years | 133 (7.4%) | 80 (5.0%) |
| 10 to 14 Years | 96 (5.3%) | 78 (4.8%) |
| 15 to 19 Years | 66 (3.7%) | 65 (4.0%) |
| 20 to 24 Years | 109 (6.1%) | 45 (2.8%) |
| 25 to 29 Years | 95 (5.3%) | 106 (6.6%) |
| 30 to 34 Years | 151 (8.4%) | 178 (11.0%) |
| 35 to 39 Years | 165 (9.2%) | 91 (5.6%) |
| 40 to 44 Years | 116 (6.5%) | 100 (6.2%) |
| 45 to 49 Years | 76 (4.2%) | 89 (5.5%) |
| 50 to 54 Years | 67 (3.7%) | 96 (5.9%) |
| 55 to 59 Years | 187 (10.4%) | 135 (8.4%) |
| 60 to 64 Years | 140 (7.8%) | 135 (8.4%) |
| 65 to 69 Years | 152 (8.5%) | 97 (6.0%) |
| 70 to 74 Years | 77 (4.3%) | 43 (2.7%) |
| 75 to 79 Years | 7 (0.4%) | 142 (8.8%) |
| 80 to 84 Years | 37 (2.1%) | 0 (0.0%) |
| 85 Years and over | 32 (1.8%) | 70 (4.3%) |
| Total | 1,797 (100.0%) | 1,616 (100.0%) |
Families and Households in Etna borough
Median Family Size in Etna borough
The median family size in Etna borough is 2.74 persons per family, with married-couple families (545 | 60.6%) accounting for the largest median family size of 2.78 persons per family. On the other hand, single male/father families (99 | 11.0%) represent the smallest median family size with 2.66 persons per family.
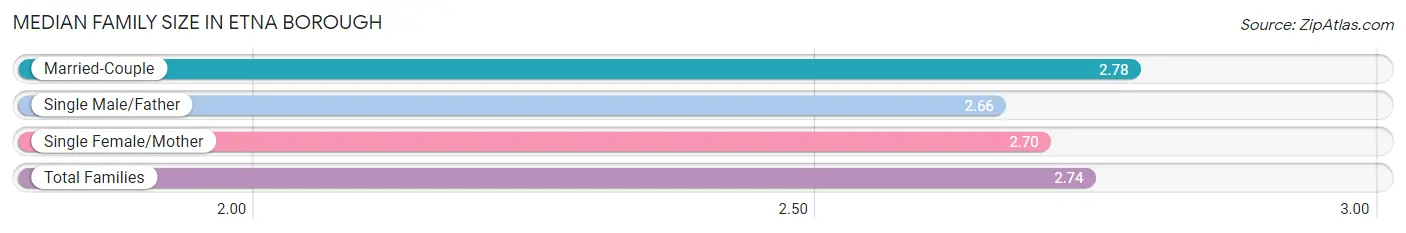
| Family Type | # Families | Family Size |
| Married-Couple | 545 (60.6%) | 2.78 |
| Single Male/Father | 99 (11.0%) | 2.66 |
| Single Female/Mother | 256 (28.4%) | 2.70 |
| Total Families | 900 (100.0%) | 2.74 |
Median Household Size in Etna borough
The median household size in Etna borough is 2.06 persons per household, with single female/mother households (256 | 15.5%) accounting for the largest median household size of 2.93 persons per household. non-family households (756 | 45.7%) represent the smallest median household size with 1.13 persons per household.
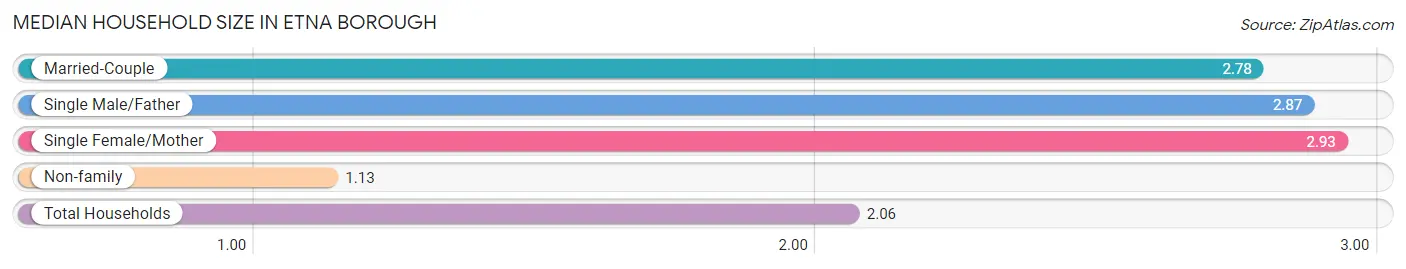
| Household Type | # Households | Household Size |
| Married-Couple | 545 (32.9%) | 2.78 |
| Single Male/Father | 99 (6.0%) | 2.87 |
| Single Female/Mother | 256 (15.5%) | 2.93 |
| Non-family | 756 (45.7%) | 1.13 |
| Total Households | 1,656 (100.0%) | 2.06 |
Household Size by Marriage Status in Etna borough
Out of a total of 1,656 households in Etna borough, 900 (54.3%) are family households, while 756 (45.7%) are nonfamily households. The most numerous type of family households are 2-person households, comprising 428, and the most common type of nonfamily households are 1-person households, comprising 664.
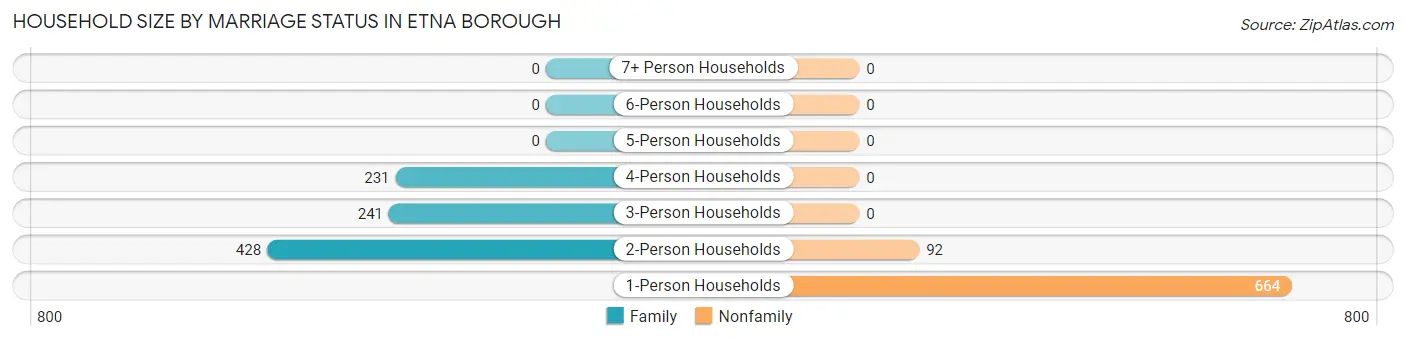
| Household Size | Family Households | Nonfamily Households |
| 1-Person Households | - | 664 (40.1%) |
| 2-Person Households | 428 (25.9%) | 92 (5.6%) |
| 3-Person Households | 241 (14.5%) | 0 (0.0%) |
| 4-Person Households | 231 (14.0%) | 0 (0.0%) |
| 5-Person Households | 0 (0.0%) | 0 (0.0%) |
| 6-Person Households | 0 (0.0%) | 0 (0.0%) |
| 7+ Person Households | 0 (0.0%) | 0 (0.0%) |
| Total | 900 (54.3%) | 756 (45.7%) |
Female Fertility in Etna borough
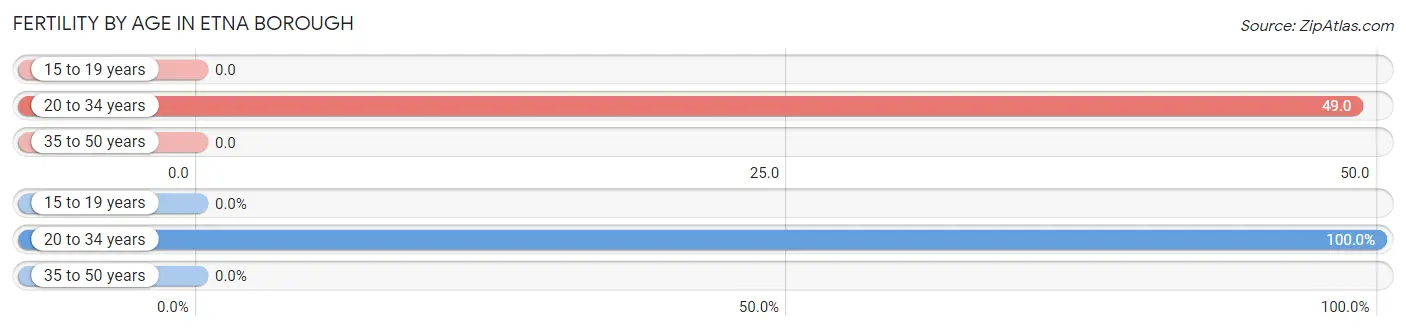
Fertility by Age in Etna borough
Average fertility rate in Etna borough is 23.0 births per 1,000 women. Women in the age bracket of 20 to 34 years have the highest fertility rate with 49.0 births per 1,000 women. Women in the age bracket of 20 to 34 years acount for 100.0% of all women with births.
| Age Bracket | Women with Births | Births / 1,000 Women |
| 15 to 19 years | 0 (0.0%) | 0.0 |
| 20 to 34 years | 16 (100.0%) | 49.0 |
| 35 to 50 years | 0 (0.0%) | 0.0 |
| Total | 16 (100.0%) | 23.0 |
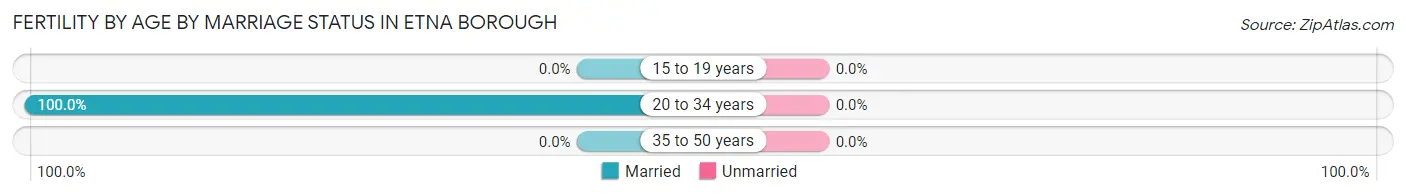
Fertility by Age by Marriage Status in Etna borough
| Age Bracket | Married | Unmarried |
| 15 to 19 years | 0 (0.0%) | 0 (0.0%) |
| 20 to 34 years | 16 (100.0%) | 0 (0.0%) |
| 35 to 50 years | 0 (0.0%) | 0 (0.0%) |
| Total | 16 (100.0%) | 0 (0.0%) |
Fertility by Education in Etna borough
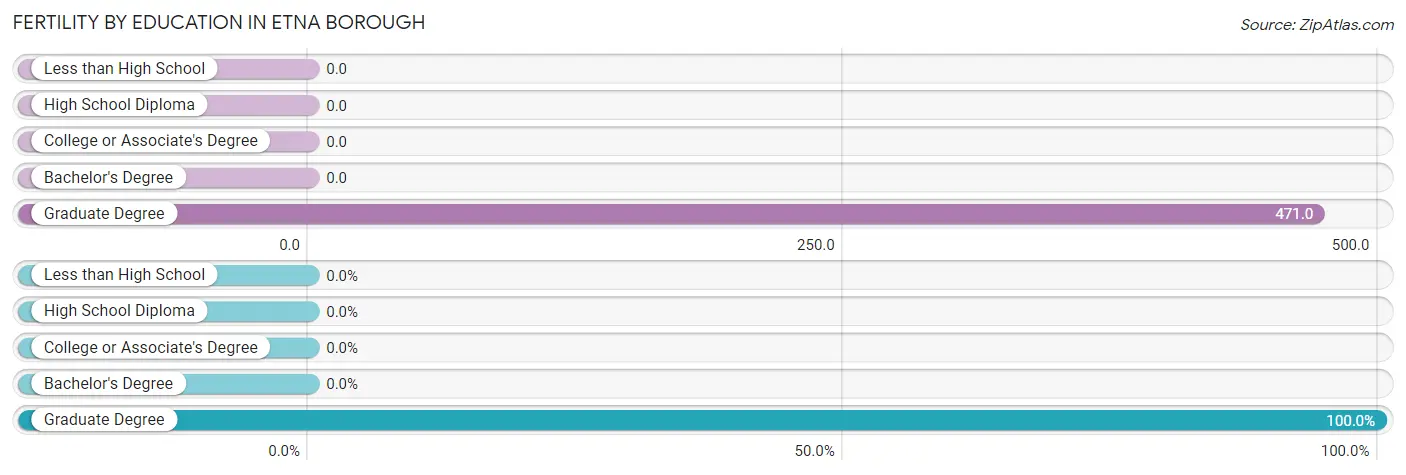
| Educational Attainment | Women with Births | Births / 1,000 Women |
| Less than High School | 0 (0.0%) | 0.0 |
| High School Diploma | 0 (0.0%) | 0.0 |
| College or Associate's Degree | 0 (0.0%) | 0.0 |
| Bachelor's Degree | 0 (0.0%) | 0.0 |
| Graduate Degree | 16 (100.0%) | 471.0 |
| Total | 16 (100.0%) | 23.0 |
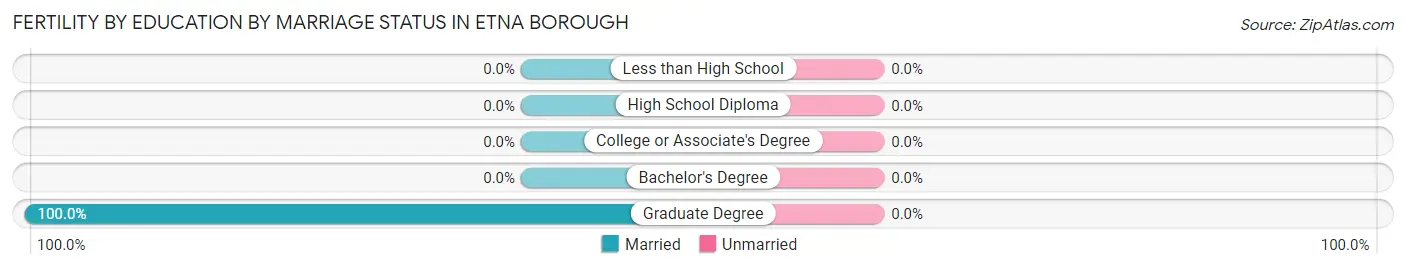
Fertility by Education by Marriage Status in Etna borough
| Educational Attainment | Married | Unmarried |
| Less than High School | 0 (0.0%) | 0 (0.0%) |
| High School Diploma | 0 (0.0%) | 0 (0.0%) |
| College or Associate's Degree | 0 (0.0%) | 0 (0.0%) |
| Bachelor's Degree | 0 (0.0%) | 0 (0.0%) |
| Graduate Degree | 16 (100.0%) | 0 (0.0%) |
| Total | 16 (100.0%) | 0 (0.0%) |
Employment Characteristics in Etna borough
Employment by Class of Employer in Etna borough
Among the 1,580 employed individuals in Etna borough, private company employees (1,243 | 78.7%), not-for-profit organizations (181 | 11.5%), and local government employees (116 | 7.3%) make up the most common classes of employment.
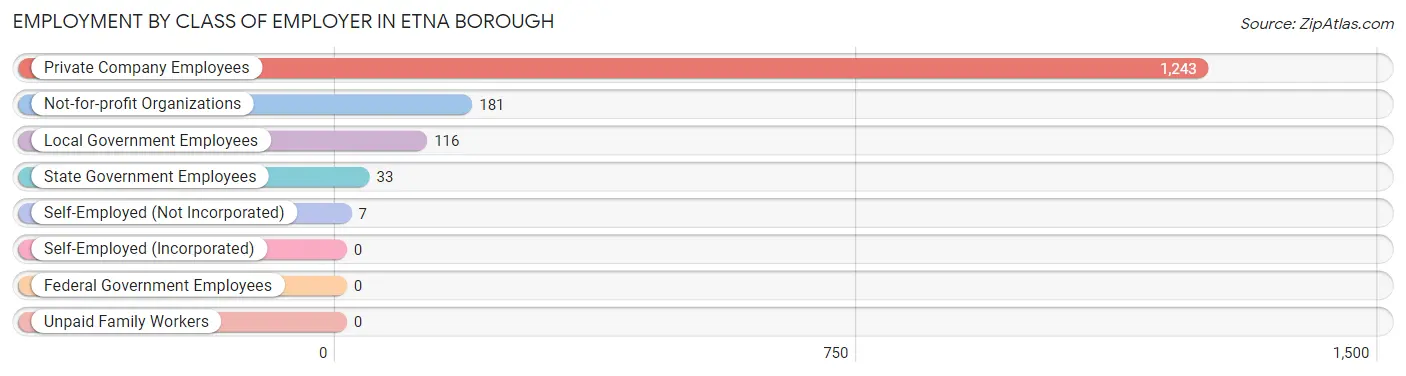
| Employer Class | # Employees | % Employees |
| Private Company Employees | 1,243 | 78.7% |
| Self-Employed (Incorporated) | 0 | 0.0% |
| Self-Employed (Not Incorporated) | 7 | 0.4% |
| Not-for-profit Organizations | 181 | 11.5% |
| Local Government Employees | 116 | 7.3% |
| State Government Employees | 33 | 2.1% |
| Federal Government Employees | 0 | 0.0% |
| Unpaid Family Workers | 0 | 0.0% |
| Total | 1,580 | 100.0% |
Employment Status by Age in Etna borough
According to the labor force statistics for Etna borough, out of the total population over 16 years of age (2,839), 63.1% or 1,791 individuals are in the labor force, with 8.9% or 159 of them unemployed. The age group with the highest labor force participation rate is 30 to 34 years, with 100.0% or 329 individuals in the labor force. Within the labor force, the 35 to 44 years age range has the highest percentage of unemployed individuals, with 14.8% or 69 of them being unemployed.
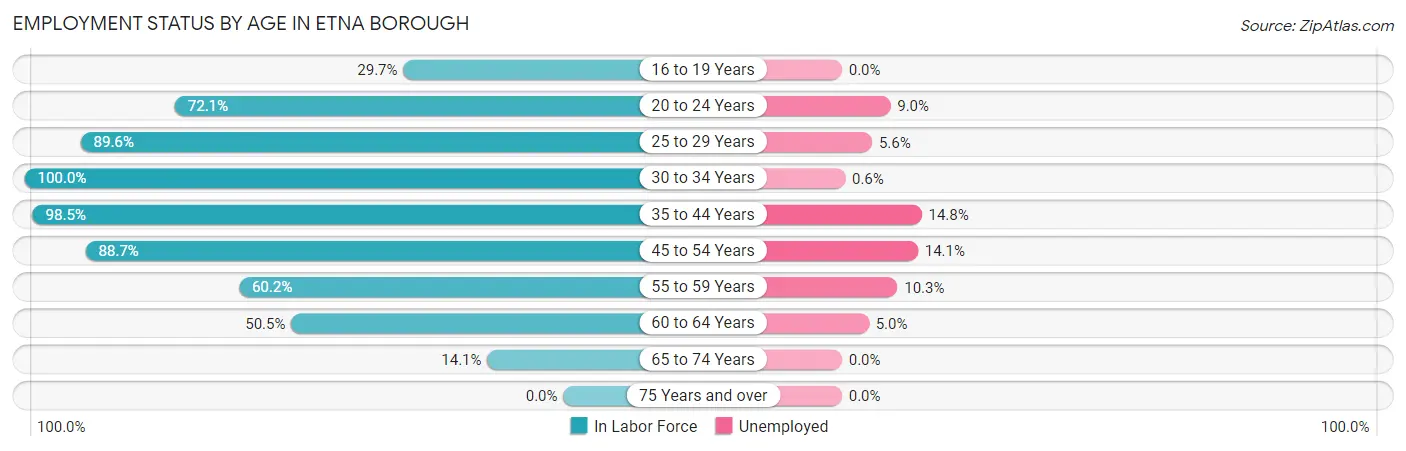
| Age Bracket | In Labor Force | Unemployed |
| 16 to 19 Years | 30 (29.7%) | 0 (0.0%) |
| 20 to 24 Years | 111 (72.1%) | 10 (9.0%) |
| 25 to 29 Years | 180 (89.6%) | 10 (5.6%) |
| 30 to 34 Years | 329 (100.0%) | 2 (0.6%) |
| 35 to 44 Years | 465 (98.5%) | 69 (14.8%) |
| 45 to 54 Years | 291 (88.7%) | 41 (14.1%) |
| 55 to 59 Years | 194 (60.2%) | 20 (10.3%) |
| 60 to 64 Years | 139 (50.5%) | 7 (5.0%) |
| 65 to 74 Years | 52 (14.1%) | 0 (0.0%) |
| 75 Years and over | 0 (0.0%) | 0 (0.0%) |
| Total | 1,791 (63.1%) | 159 (8.9%) |
Employment Status by Educational Attainment in Etna borough
According to labor force statistics for Etna borough, 82.9% of individuals (1,597) out of the total population between 25 and 64 years of age (1,927) are in the labor force, with 9.3% or 149 of them being unemployed. The group with the highest labor force participation rate are those with the educational attainment of less than high school, with 97.9% or 94 individuals in the labor force. Within the labor force, individuals with high school diploma education have the highest percentage of unemployment, with 13.4% or 53 of them being unemployed.
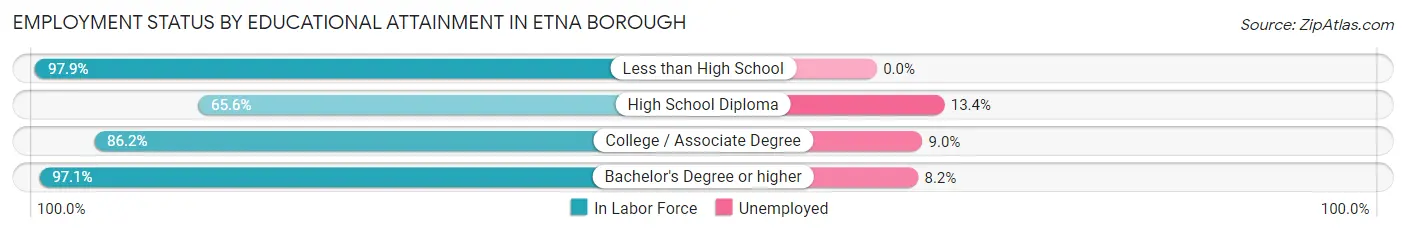
| Educational Attainment | In Labor Force | Unemployed |
| Less than High School | 94 (97.9%) | 0 (0.0%) |
| High School Diploma | 395 (65.6%) | 81 (13.4%) |
| College / Associate Degree | 670 (86.2%) | 70 (9.0%) |
| Bachelor's Degree or higher | 439 (97.1%) | 37 (8.2%) |
| Total | 1,597 (82.9%) | 179 (9.3%) |
Employment Occupations by Sex in Etna borough
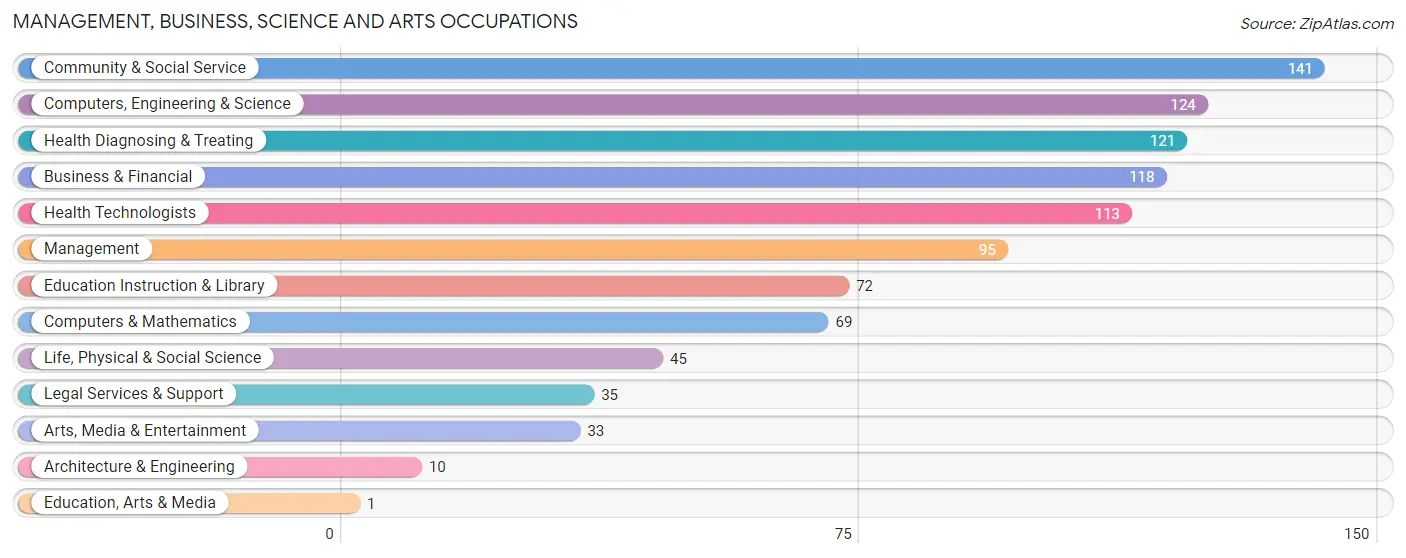
Management, Business, Science and Arts Occupations
The most common Management, Business, Science and Arts occupations in Etna borough are Community & Social Service (141 | 8.6%), Computers, Engineering & Science (124 | 7.6%), Health Diagnosing & Treating (121 | 7.4%), Business & Financial (118 | 7.2%), and Health Technologists (113 | 6.9%).
Management, Business, Science and Arts Occupations by Sex
Within the Management, Business, Science and Arts occupations in Etna borough, the most male-oriented occupations are Computers & Mathematics (100.0%), Architecture & Engineering (100.0%), and Education, Arts & Media (100.0%), while the most female-oriented occupations are Business & Financial (77.1%), Health Diagnosing & Treating (65.3%), and Health Technologists (62.8%).
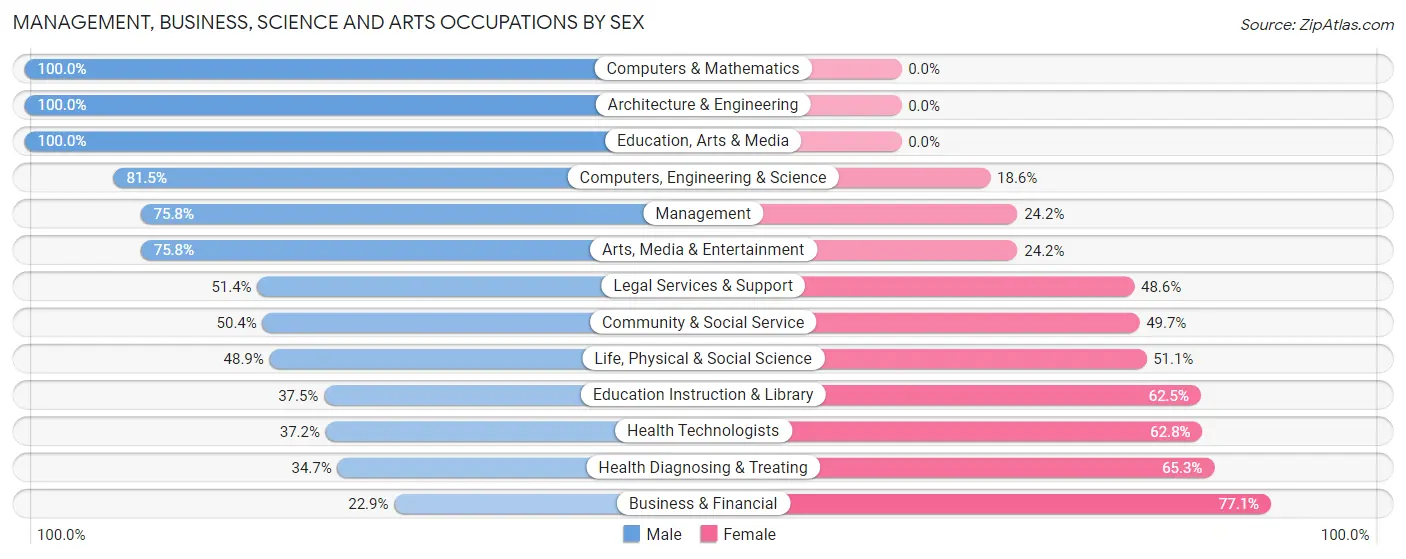
| Occupation | Male | Female |
| Management | 72 (75.8%) | 23 (24.2%) |
| Business & Financial | 27 (22.9%) | 91 (77.1%) |
| Computers, Engineering & Science | 101 (81.5%) | 23 (18.5%) |
| Computers & Mathematics | 69 (100.0%) | 0 (0.0%) |
| Architecture & Engineering | 10 (100.0%) | 0 (0.0%) |
| Life, Physical & Social Science | 22 (48.9%) | 23 (51.1%) |
| Community & Social Service | 71 (50.3%) | 70 (49.6%) |
| Education, Arts & Media | 1 (100.0%) | 0 (0.0%) |
| Legal Services & Support | 18 (51.4%) | 17 (48.6%) |
| Education Instruction & Library | 27 (37.5%) | 45 (62.5%) |
| Arts, Media & Entertainment | 25 (75.8%) | 8 (24.2%) |
| Health Diagnosing & Treating | 42 (34.7%) | 79 (65.3%) |
| Health Technologists | 42 (37.2%) | 71 (62.8%) |
| Total (Category) | 313 (52.2%) | 286 (47.7%) |
| Total (Overall) | 762 (46.7%) | 870 (53.3%) |
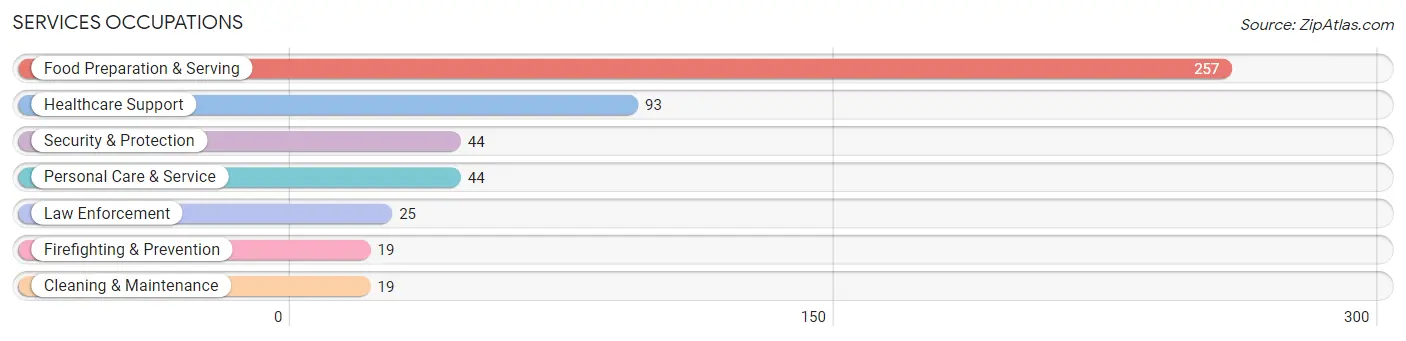
Services Occupations
The most common Services occupations in Etna borough are Food Preparation & Serving (257 | 15.8%), Healthcare Support (93 | 5.7%), Security & Protection (44 | 2.7%), Personal Care & Service (44 | 2.7%), and Law Enforcement (25 | 1.5%).
Services Occupations by Sex
Within the Services occupations in Etna borough, the most male-oriented occupations are Firefighting & Prevention (100.0%), Security & Protection (72.7%), and Cleaning & Maintenance (52.6%), while the most female-oriented occupations are Personal Care & Service (100.0%), Healthcare Support (85.0%), and Food Preparation & Serving (70.8%).
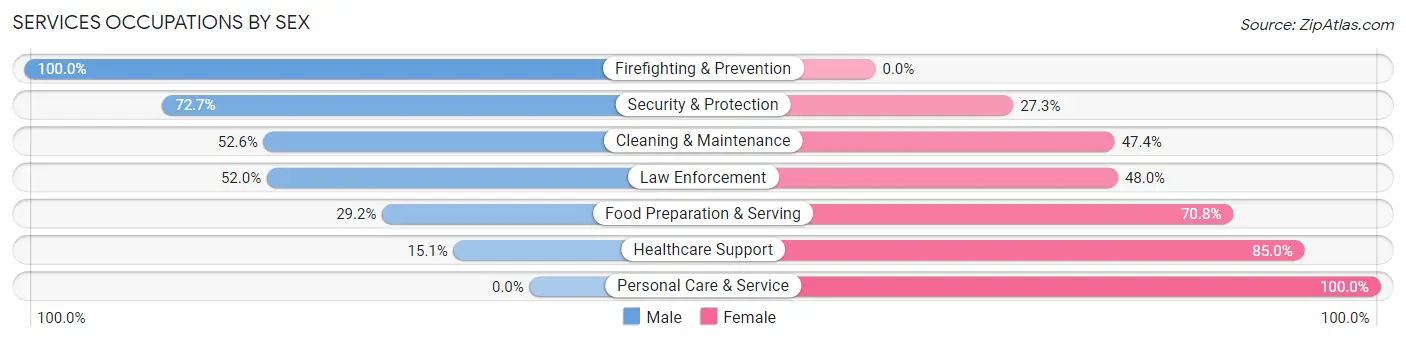
| Occupation | Male | Female |
| Healthcare Support | 14 (15.0%) | 79 (85.0%) |
| Security & Protection | 32 (72.7%) | 12 (27.3%) |
| Firefighting & Prevention | 19 (100.0%) | 0 (0.0%) |
| Law Enforcement | 13 (52.0%) | 12 (48.0%) |
| Food Preparation & Serving | 75 (29.2%) | 182 (70.8%) |
| Cleaning & Maintenance | 10 (52.6%) | 9 (47.4%) |
| Personal Care & Service | 0 (0.0%) | 44 (100.0%) |
| Total (Category) | 131 (28.7%) | 326 (71.3%) |
| Total (Overall) | 762 (46.7%) | 870 (53.3%) |
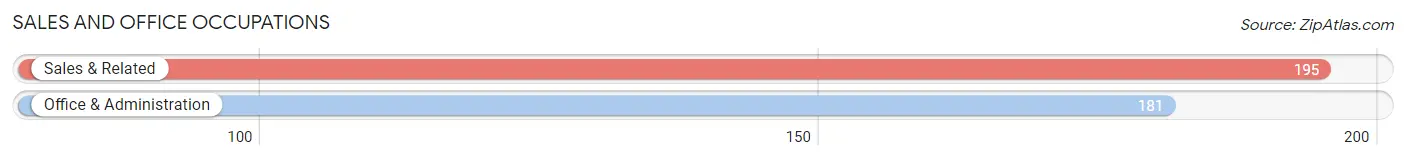
Sales and Office Occupations
The most common Sales and Office occupations in Etna borough are Sales & Related (195 | 11.9%), and Office & Administration (181 | 11.1%).
Sales and Office Occupations by Sex
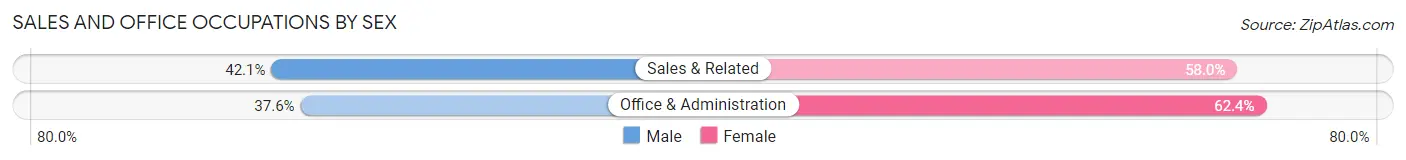
| Occupation | Male | Female |
| Sales & Related | 82 (42.0%) | 113 (58.0%) |
| Office & Administration | 68 (37.6%) | 113 (62.4%) |
| Total (Category) | 150 (39.9%) | 226 (60.1%) |
| Total (Overall) | 762 (46.7%) | 870 (53.3%) |
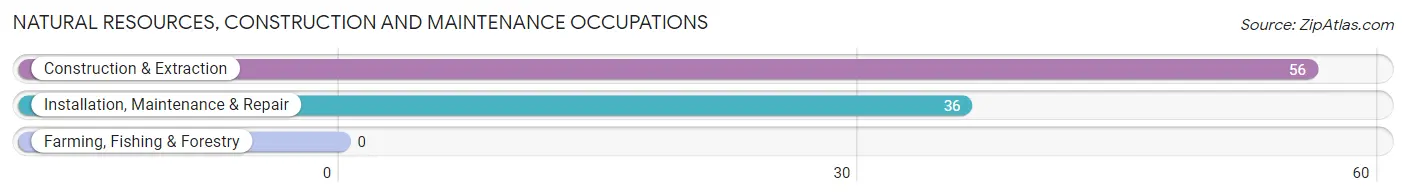
Natural Resources, Construction and Maintenance Occupations
The most common Natural Resources, Construction and Maintenance occupations in Etna borough are Construction & Extraction (56 | 3.4%), and Installation, Maintenance & Repair (36 | 2.2%).
Natural Resources, Construction and Maintenance Occupations by Sex
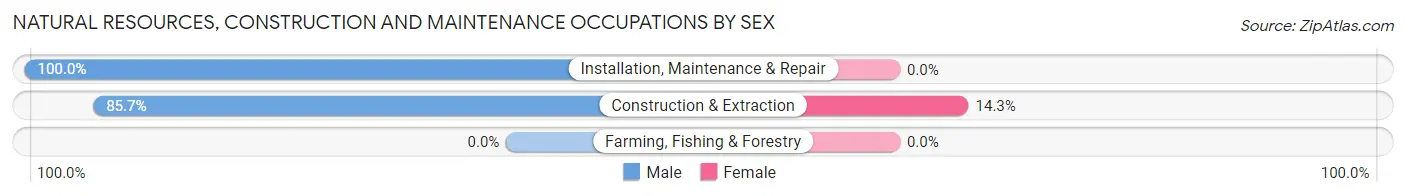
| Occupation | Male | Female |
| Farming, Fishing & Forestry | 0 (0.0%) | 0 (0.0%) |
| Construction & Extraction | 48 (85.7%) | 8 (14.3%) |
| Installation, Maintenance & Repair | 36 (100.0%) | 0 (0.0%) |
| Total (Category) | 84 (91.3%) | 8 (8.7%) |
| Total (Overall) | 762 (46.7%) | 870 (53.3%) |
Production, Transportation and Moving Occupations
The most common Production, Transportation and Moving occupations in Etna borough are Production (58 | 3.5%), Material Moving (30 | 1.8%), and Transportation (20 | 1.2%).
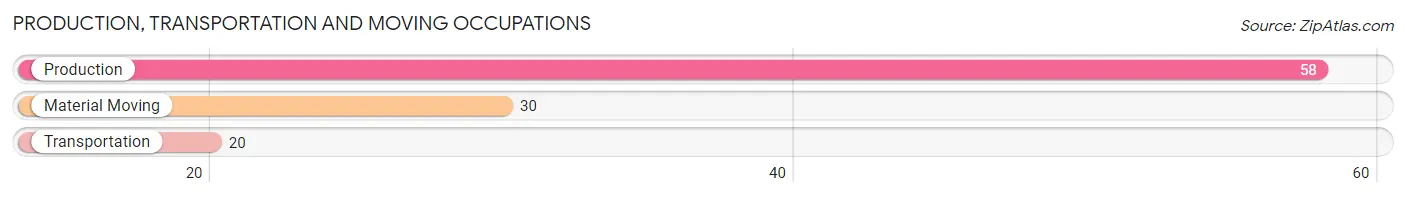
Production, Transportation and Moving Occupations by Sex
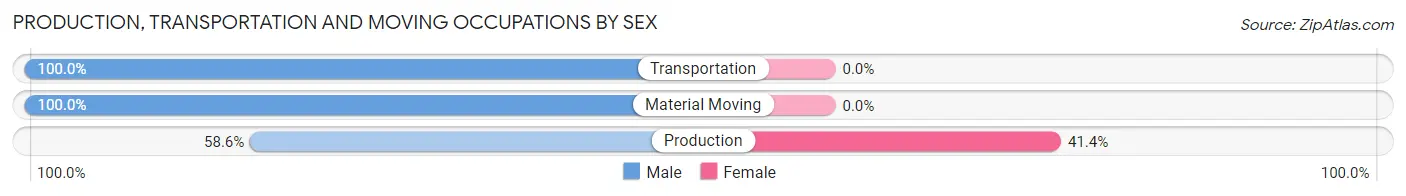
| Occupation | Male | Female |
| Production | 34 (58.6%) | 24 (41.4%) |
| Transportation | 20 (100.0%) | 0 (0.0%) |
| Material Moving | 30 (100.0%) | 0 (0.0%) |
| Total (Category) | 84 (77.8%) | 24 (22.2%) |
| Total (Overall) | 762 (46.7%) | 870 (53.3%) |
Employment Industries by Sex in Etna borough
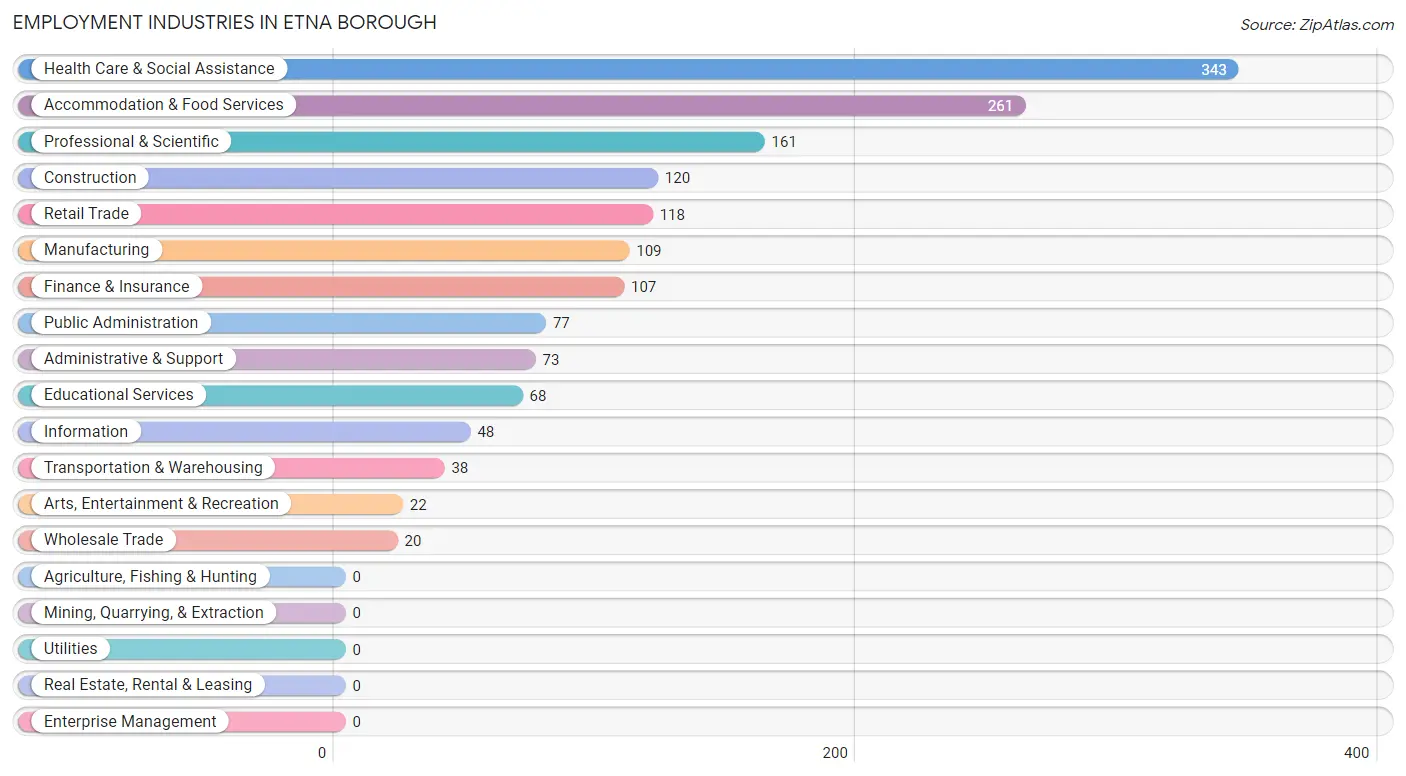
Employment Industries in Etna borough
The major employment industries in Etna borough include Health Care & Social Assistance (343 | 21.0%), Accommodation & Food Services (261 | 16.0%), Professional & Scientific (161 | 9.9%), Construction (120 | 7.3%), and Retail Trade (118 | 7.2%).
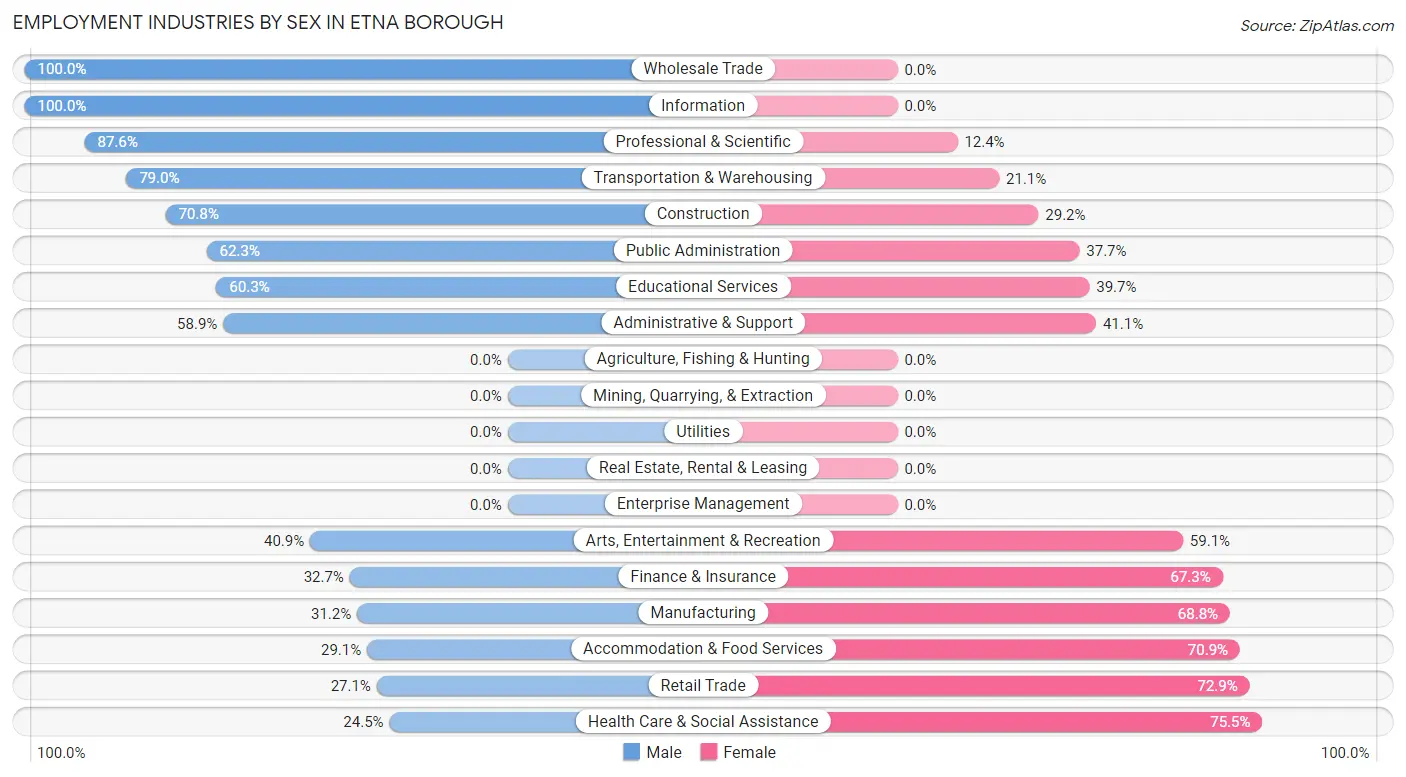
Employment Industries by Sex in Etna borough
The Etna borough industries that see more men than women are Wholesale Trade (100.0%), Information (100.0%), and Professional & Scientific (87.6%), whereas the industries that tend to have a higher number of women are Health Care & Social Assistance (75.5%), Retail Trade (72.9%), and Accommodation & Food Services (70.9%).
| Industry | Male | Female |
| Agriculture, Fishing & Hunting | 0 (0.0%) | 0 (0.0%) |
| Mining, Quarrying, & Extraction | 0 (0.0%) | 0 (0.0%) |
| Construction | 85 (70.8%) | 35 (29.2%) |
| Manufacturing | 34 (31.2%) | 75 (68.8%) |
| Wholesale Trade | 20 (100.0%) | 0 (0.0%) |
| Retail Trade | 32 (27.1%) | 86 (72.9%) |
| Transportation & Warehousing | 30 (78.9%) | 8 (21.0%) |
| Utilities | 0 (0.0%) | 0 (0.0%) |
| Information | 48 (100.0%) | 0 (0.0%) |
| Finance & Insurance | 35 (32.7%) | 72 (67.3%) |
| Real Estate, Rental & Leasing | 0 (0.0%) | 0 (0.0%) |
| Professional & Scientific | 141 (87.6%) | 20 (12.4%) |
| Enterprise Management | 0 (0.0%) | 0 (0.0%) |
| Administrative & Support | 43 (58.9%) | 30 (41.1%) |
| Educational Services | 41 (60.3%) | 27 (39.7%) |
| Health Care & Social Assistance | 84 (24.5%) | 259 (75.5%) |
| Arts, Entertainment & Recreation | 9 (40.9%) | 13 (59.1%) |
| Accommodation & Food Services | 76 (29.1%) | 185 (70.9%) |
| Public Administration | 48 (62.3%) | 29 (37.7%) |
| Total | 762 (46.7%) | 870 (53.3%) |
Education in Etna borough
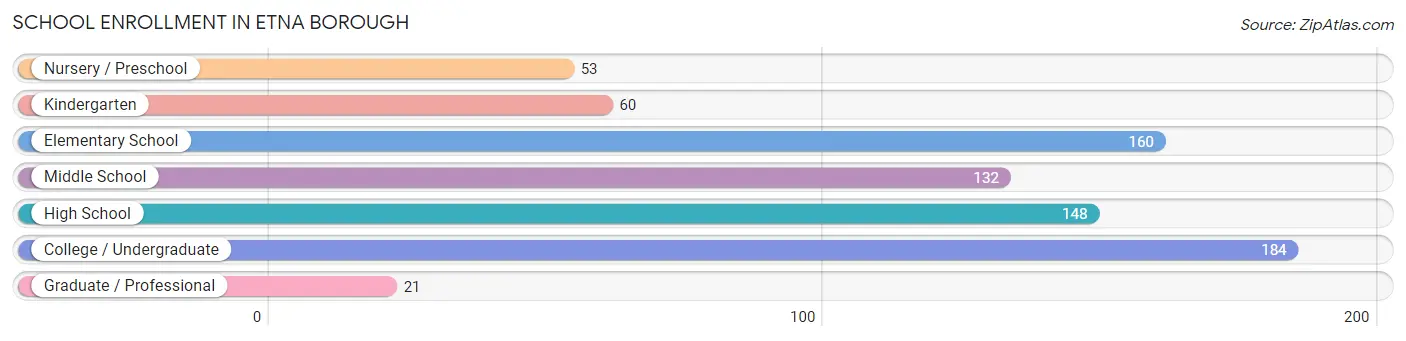
School Enrollment in Etna borough
The most common levels of schooling among the 758 students in Etna borough are college / undergraduate (184 | 24.3%), elementary school (160 | 21.1%), and high school (148 | 19.5%).
| School Level | # Students | % Students |
| Nursery / Preschool | 53 | 7.0% |
| Kindergarten | 60 | 7.9% |
| Elementary School | 160 | 21.1% |
| Middle School | 132 | 17.4% |
| High School | 148 | 19.5% |
| College / Undergraduate | 184 | 24.3% |
| Graduate / Professional | 21 | 2.8% |
| Total | 758 | 100.0% |
School Enrollment by Age by Funding Source in Etna borough
Out of a total of 758 students who are enrolled in schools in Etna borough, 97 (12.8%) attend a private institution, while the remaining 661 (87.2%) are enrolled in public schools. The age group of 3 to 4 year olds has the highest likelihood of being enrolled in private schools, with 41 (77.4% in the age bracket) enrolled. Conversely, the age group of 5 to 9 year old has the lowest likelihood of being enrolled in a private school, with 195 (100.0% in the age bracket) attending a public institution.
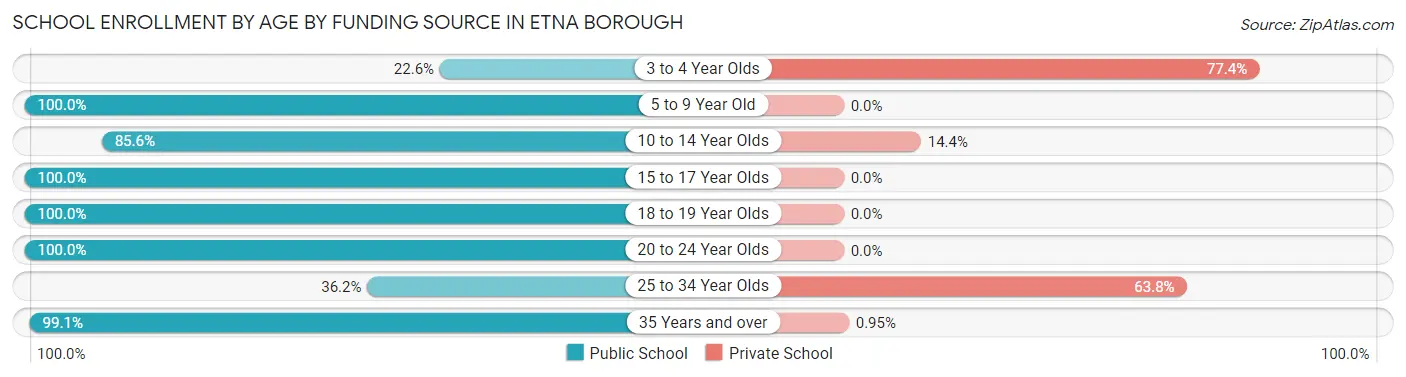
| Age Bracket | Public School | Private School |
| 3 to 4 Year Olds | 12 (22.6%) | 41 (77.4%) |
| 5 to 9 Year Old | 195 (100.0%) | 0 (0.0%) |
| 10 to 14 Year Olds | 149 (85.6%) | 25 (14.4%) |
| 15 to 17 Year Olds | 46 (100.0%) | 0 (0.0%) |
| 18 to 19 Year Olds | 85 (100.0%) | 0 (0.0%) |
| 20 to 24 Year Olds | 53 (100.0%) | 0 (0.0%) |
| 25 to 34 Year Olds | 17 (36.2%) | 30 (63.8%) |
| 35 Years and over | 104 (99.1%) | 1 (0.9%) |
| Total | 661 (87.2%) | 97 (12.8%) |
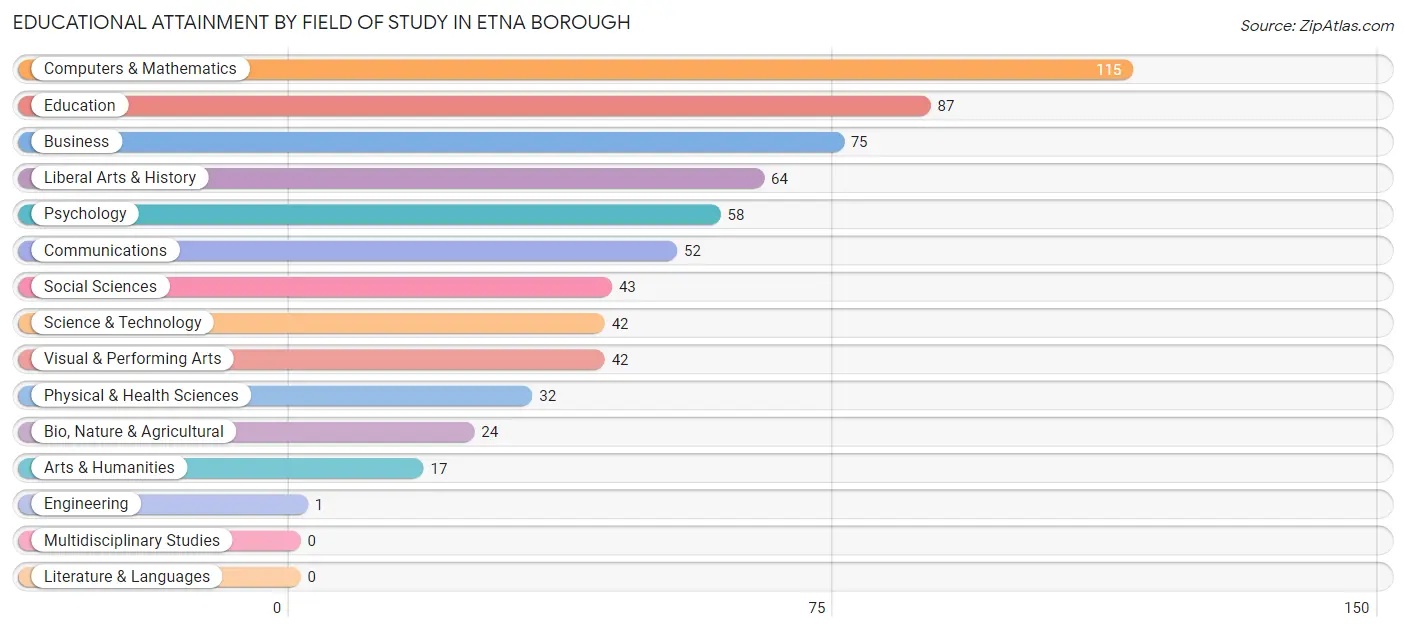
Educational Attainment by Field of Study in Etna borough
Computers & mathematics (115 | 17.6%), education (87 | 13.3%), business (75 | 11.5%), liberal arts & history (64 | 9.8%), and psychology (58 | 8.9%) are the most common fields of study among 652 individuals in Etna borough who have obtained a bachelor's degree or higher.
| Field of Study | # Graduates | % Graduates |
| Computers & Mathematics | 115 | 17.6% |
| Bio, Nature & Agricultural | 24 | 3.7% |
| Physical & Health Sciences | 32 | 4.9% |
| Psychology | 58 | 8.9% |
| Social Sciences | 43 | 6.6% |
| Engineering | 1 | 0.2% |
| Multidisciplinary Studies | 0 | 0.0% |
| Science & Technology | 42 | 6.4% |
| Business | 75 | 11.5% |
| Education | 87 | 13.3% |
| Literature & Languages | 0 | 0.0% |
| Liberal Arts & History | 64 | 9.8% |
| Visual & Performing Arts | 42 | 6.4% |
| Communications | 52 | 8.0% |
| Arts & Humanities | 17 | 2.6% |
| Total | 652 | 100.0% |
Transportation & Commute in Etna borough
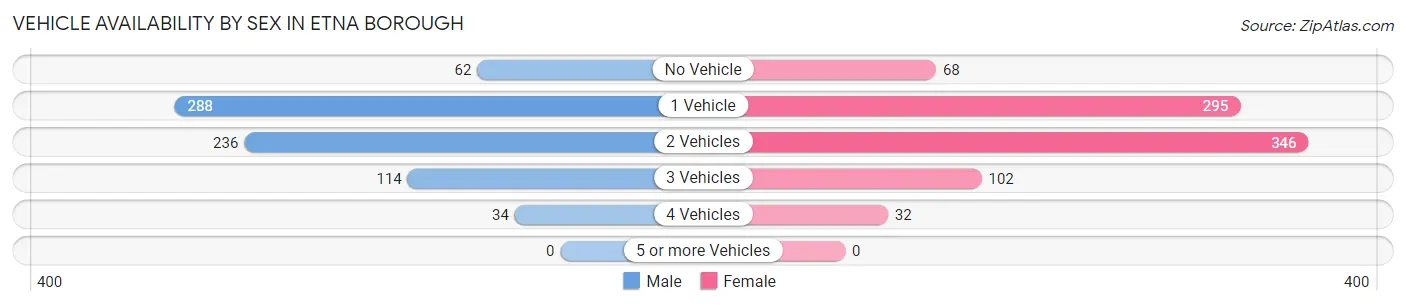
Vehicle Availability by Sex in Etna borough
The most prevalent vehicle ownership categories in Etna borough are males with 1 vehicle (288, accounting for 39.2%) and females with 1 vehicle (295, making up 34.2%).
| Vehicles Available | Male | Female |
| No Vehicle | 62 (8.5%) | 68 (8.1%) |
| 1 Vehicle | 288 (39.2%) | 295 (35.0%) |
| 2 Vehicles | 236 (32.2%) | 346 (41.0%) |
| 3 Vehicles | 114 (15.5%) | 102 (12.1%) |
| 4 Vehicles | 34 (4.6%) | 32 (3.8%) |
| 5 or more Vehicles | 0 (0.0%) | 0 (0.0%) |
| Total | 734 (100.0%) | 843 (100.0%) |
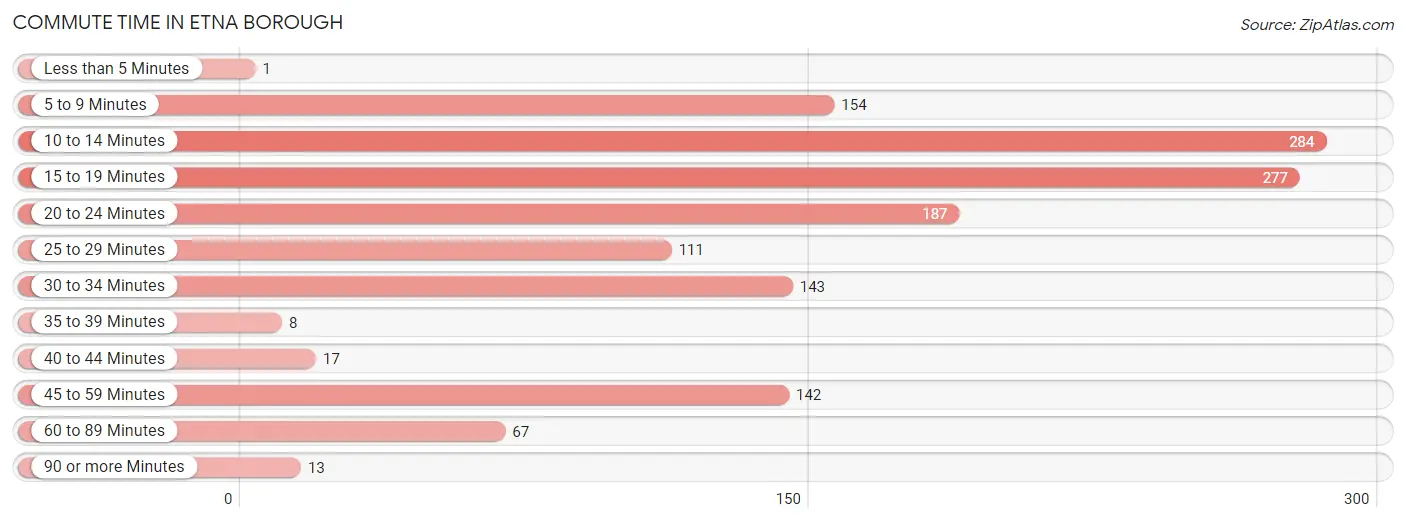
Commute Time in Etna borough
The most frequently occuring commute durations in Etna borough are 10 to 14 minutes (284 commuters, 20.2%), 15 to 19 minutes (277 commuters, 19.7%), and 20 to 24 minutes (187 commuters, 13.3%).
| Commute Time | # Commuters | % Commuters |
| Less than 5 Minutes | 1 | 0.1% |
| 5 to 9 Minutes | 154 | 11.0% |
| 10 to 14 Minutes | 284 | 20.2% |
| 15 to 19 Minutes | 277 | 19.7% |
| 20 to 24 Minutes | 187 | 13.3% |
| 25 to 29 Minutes | 111 | 7.9% |
| 30 to 34 Minutes | 143 | 10.2% |
| 35 to 39 Minutes | 8 | 0.6% |
| 40 to 44 Minutes | 17 | 1.2% |
| 45 to 59 Minutes | 142 | 10.1% |
| 60 to 89 Minutes | 67 | 4.8% |
| 90 or more Minutes | 13 | 0.9% |
Commute Time by Sex in Etna borough
The most common commute times in Etna borough are 15 to 19 minutes (121 commuters, 19.2%) for males and 10 to 14 minutes (167 commuters, 21.5%) for females.
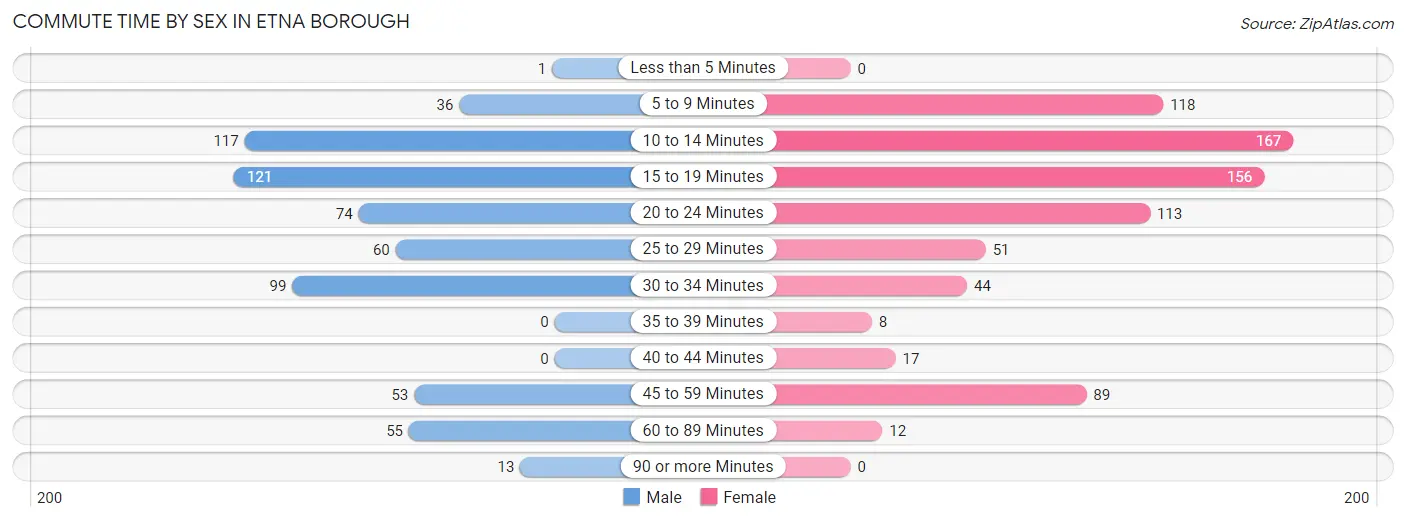
| Commute Time | Male | Female |
| Less than 5 Minutes | 1 (0.2%) | 0 (0.0%) |
| 5 to 9 Minutes | 36 (5.7%) | 118 (15.2%) |
| 10 to 14 Minutes | 117 (18.6%) | 167 (21.5%) |
| 15 to 19 Minutes | 121 (19.2%) | 156 (20.1%) |
| 20 to 24 Minutes | 74 (11.8%) | 113 (14.6%) |
| 25 to 29 Minutes | 60 (9.5%) | 51 (6.6%) |
| 30 to 34 Minutes | 99 (15.7%) | 44 (5.7%) |
| 35 to 39 Minutes | 0 (0.0%) | 8 (1.0%) |
| 40 to 44 Minutes | 0 (0.0%) | 17 (2.2%) |
| 45 to 59 Minutes | 53 (8.4%) | 89 (11.5%) |
| 60 to 89 Minutes | 55 (8.7%) | 12 (1.5%) |
| 90 or more Minutes | 13 (2.1%) | 0 (0.0%) |
Time of Departure to Work by Sex in Etna borough
The most frequent times of departure to work in Etna borough are 7:00 AM to 7:29 AM (172, 27.3%) for males and 7:00 AM to 7:29 AM (146, 18.8%) for females.
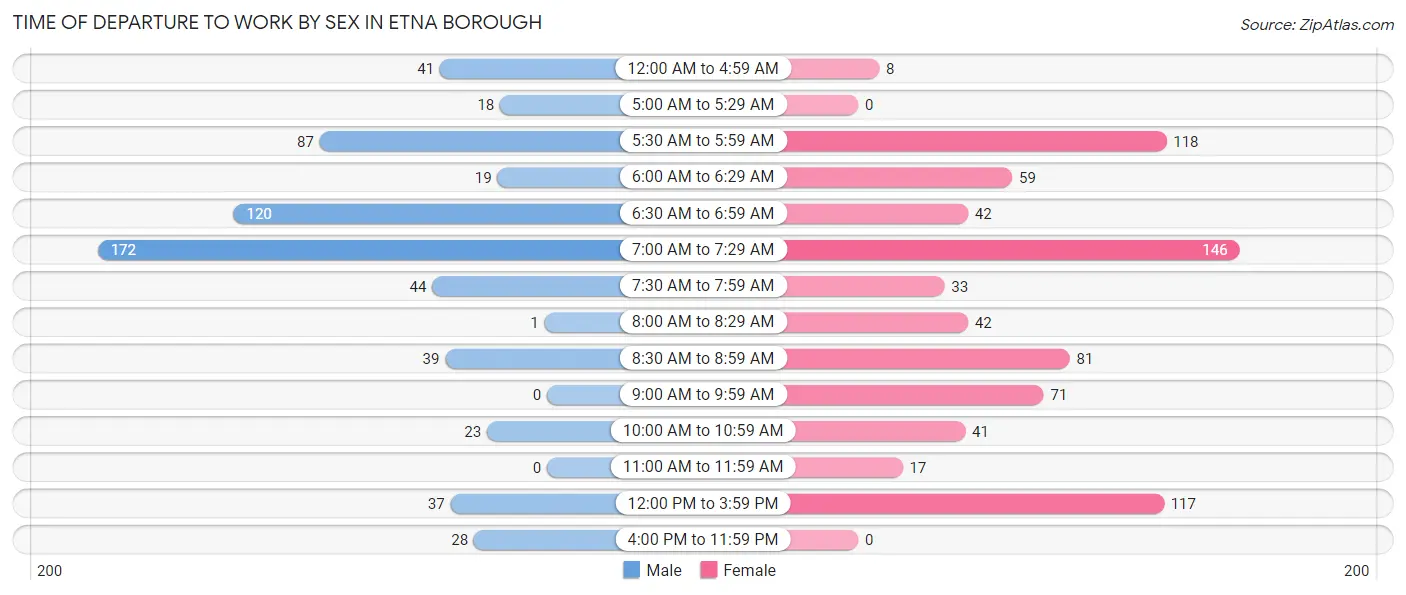
| Time of Departure | Male | Female |
| 12:00 AM to 4:59 AM | 41 (6.5%) | 8 (1.0%) |
| 5:00 AM to 5:29 AM | 18 (2.9%) | 0 (0.0%) |
| 5:30 AM to 5:59 AM | 87 (13.8%) | 118 (15.2%) |
| 6:00 AM to 6:29 AM | 19 (3.0%) | 59 (7.6%) |
| 6:30 AM to 6:59 AM | 120 (19.1%) | 42 (5.4%) |
| 7:00 AM to 7:29 AM | 172 (27.3%) | 146 (18.8%) |
| 7:30 AM to 7:59 AM | 44 (7.0%) | 33 (4.3%) |
| 8:00 AM to 8:29 AM | 1 (0.2%) | 42 (5.4%) |
| 8:30 AM to 8:59 AM | 39 (6.2%) | 81 (10.4%) |
| 9:00 AM to 9:59 AM | 0 (0.0%) | 71 (9.2%) |
| 10:00 AM to 10:59 AM | 23 (3.7%) | 41 (5.3%) |
| 11:00 AM to 11:59 AM | 0 (0.0%) | 17 (2.2%) |
| 12:00 PM to 3:59 PM | 37 (5.9%) | 117 (15.1%) |
| 4:00 PM to 11:59 PM | 28 (4.4%) | 0 (0.0%) |
| Total | 629 (100.0%) | 775 (100.0%) |
Housing Occupancy in Etna borough
Occupancy by Ownership in Etna borough
Of the total 1,656 dwellings in Etna borough, owner-occupied units account for 838 (50.6%), while renter-occupied units make up 818 (49.4%).
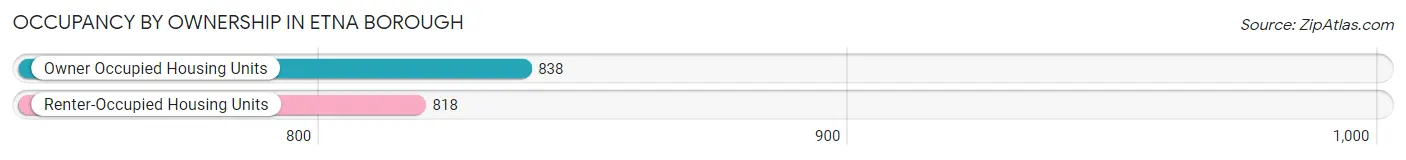
| Occupancy | # Housing Units | % Housing Units |
| Owner Occupied Housing Units | 838 | 50.6% |
| Renter-Occupied Housing Units | 818 | 49.4% |
| Total Occupied Housing Units | 1,656 | 100.0% |
Occupancy by Household Size in Etna borough
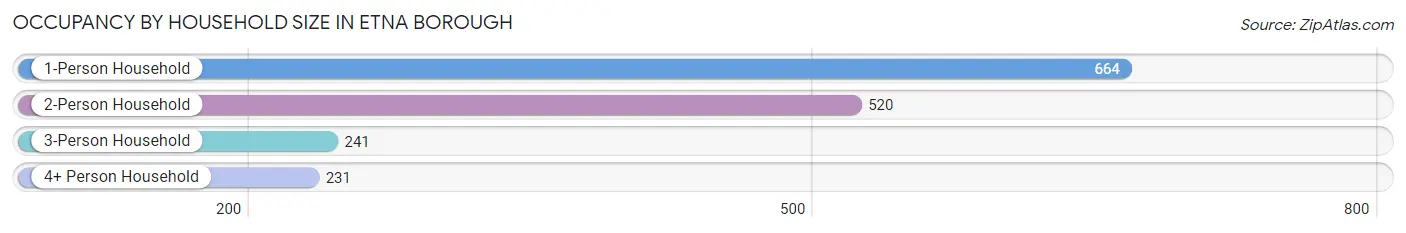
| Household Size | # Housing Units | % Housing Units |
| 1-Person Household | 664 | 40.1% |
| 2-Person Household | 520 | 31.4% |
| 3-Person Household | 241 | 14.5% |
| 4+ Person Household | 231 | 14.0% |
| Total Housing Units | 1,656 | 100.0% |
Occupancy by Ownership by Household Size in Etna borough
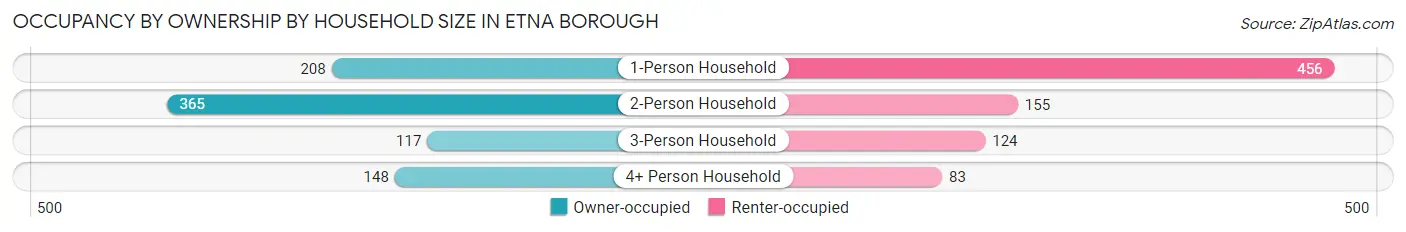
| Household Size | Owner-occupied | Renter-occupied |
| 1-Person Household | 208 (31.3%) | 456 (68.7%) |
| 2-Person Household | 365 (70.2%) | 155 (29.8%) |
| 3-Person Household | 117 (48.5%) | 124 (51.4%) |
| 4+ Person Household | 148 (64.1%) | 83 (35.9%) |
| Total Housing Units | 838 (50.6%) | 818 (49.4%) |
Occupancy by Educational Attainment in Etna borough
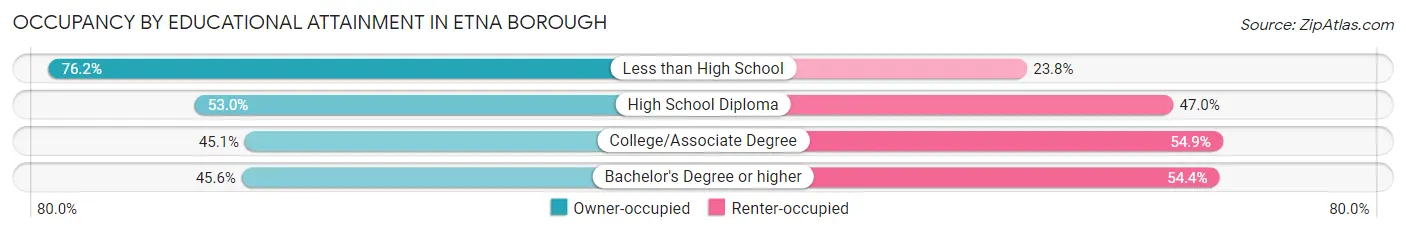
| Household Size | Owner-occupied | Renter-occupied |
| Less than High School | 96 (76.2%) | 30 (23.8%) |
| High School Diploma | 338 (53.0%) | 300 (47.0%) |
| College/Associate Degree | 219 (45.1%) | 267 (54.9%) |
| Bachelor's Degree or higher | 185 (45.6%) | 221 (54.4%) |
Occupancy by Age of Householder in Etna borough
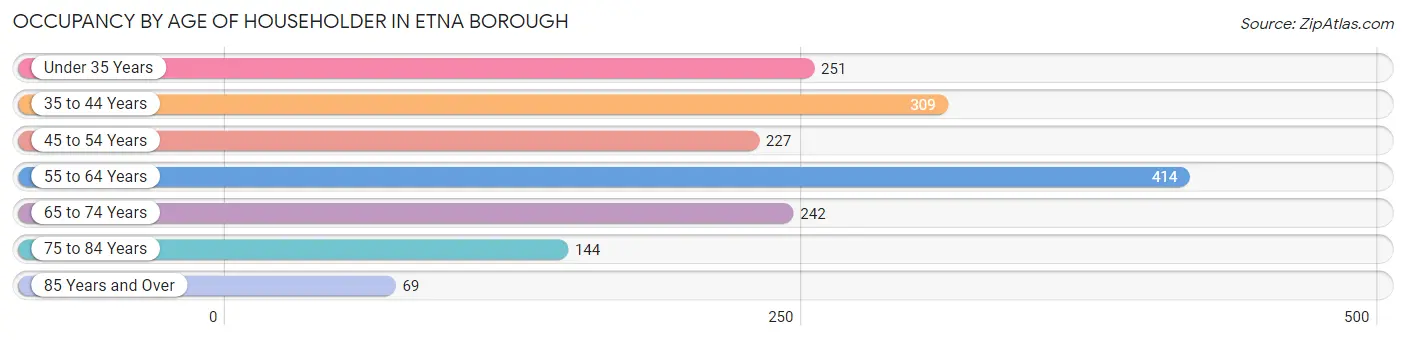
| Age Bracket | # Households | % Households |
| Under 35 Years | 251 | 15.2% |
| 35 to 44 Years | 309 | 18.7% |
| 45 to 54 Years | 227 | 13.7% |
| 55 to 64 Years | 414 | 25.0% |
| 65 to 74 Years | 242 | 14.6% |
| 75 to 84 Years | 144 | 8.7% |
| 85 Years and Over | 69 | 4.2% |
| Total | 1,656 | 100.0% |
Housing Finances in Etna borough
Median Income by Occupancy in Etna borough
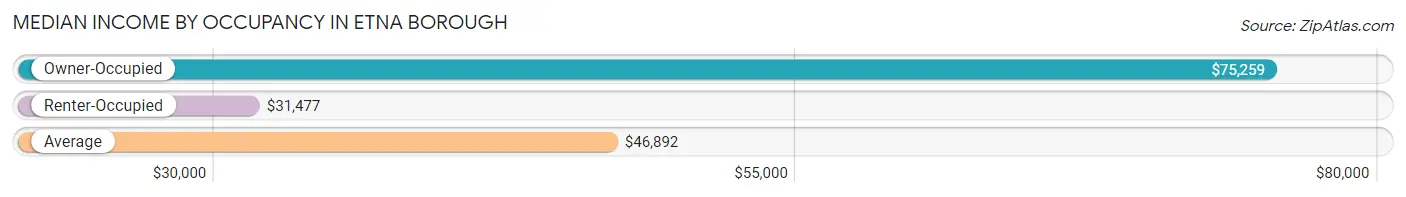
| Occupancy Type | # Households | Median Income |
| Owner-Occupied | 838 (50.6%) | $75,259 |
| Renter-Occupied | 818 (49.4%) | $31,477 |
| Average | 1,656 (100.0%) | $46,892 |
Occupancy by Householder Income Bracket in Etna borough
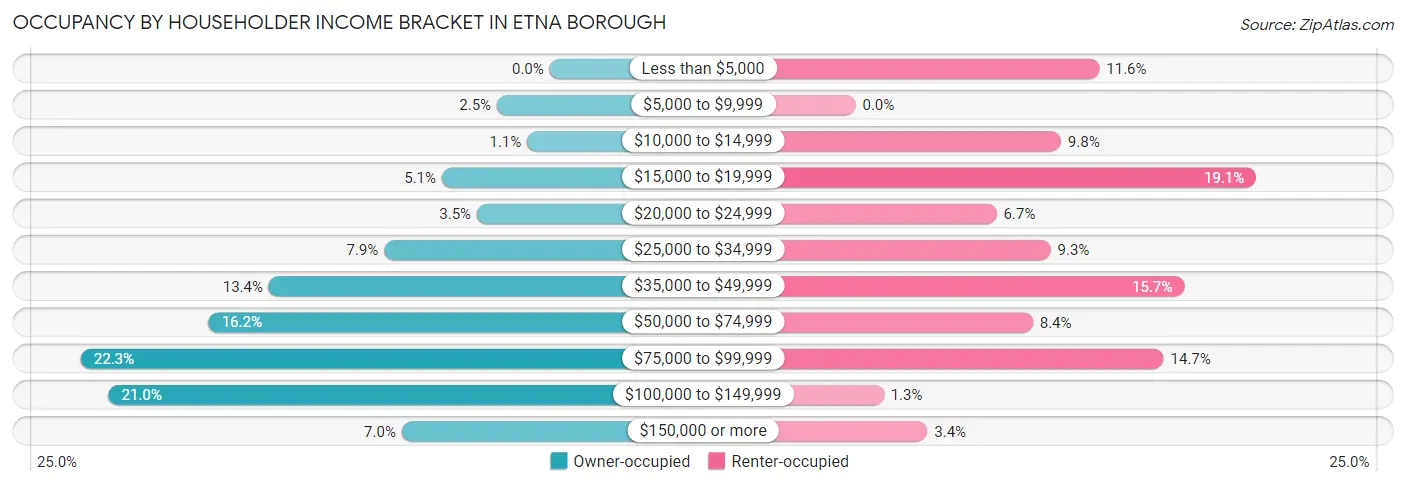
| Income Bracket | Owner-occupied | Renter-occupied |
| Less than $5,000 | 0 (0.0%) | 95 (11.6%) |
| $5,000 to $9,999 | 21 (2.5%) | 0 (0.0%) |
| $10,000 to $14,999 | 9 (1.1%) | 80 (9.8%) |
| $15,000 to $19,999 | 43 (5.1%) | 156 (19.1%) |
| $20,000 to $24,999 | 29 (3.5%) | 55 (6.7%) |
| $25,000 to $34,999 | 66 (7.9%) | 76 (9.3%) |
| $35,000 to $49,999 | 112 (13.4%) | 128 (15.7%) |
| $50,000 to $74,999 | 136 (16.2%) | 69 (8.4%) |
| $75,000 to $99,999 | 187 (22.3%) | 120 (14.7%) |
| $100,000 to $149,999 | 176 (21.0%) | 11 (1.3%) |
| $150,000 or more | 59 (7.0%) | 28 (3.4%) |
| Total | 838 (100.0%) | 818 (100.0%) |
Monthly Housing Cost Tiers in Etna borough
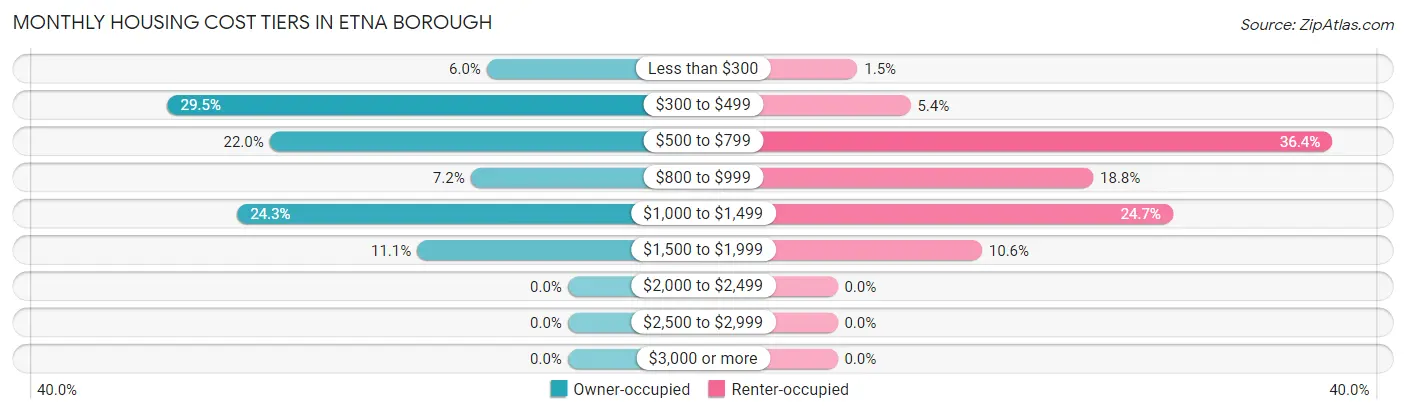
| Monthly Cost | Owner-occupied | Renter-occupied |
| Less than $300 | 50 (6.0%) | 12 (1.5%) |
| $300 to $499 | 247 (29.5%) | 44 (5.4%) |
| $500 to $799 | 184 (22.0%) | 298 (36.4%) |
| $800 to $999 | 60 (7.2%) | 154 (18.8%) |
| $1,000 to $1,499 | 204 (24.3%) | 202 (24.7%) |
| $1,500 to $1,999 | 93 (11.1%) | 87 (10.6%) |
| $2,000 to $2,499 | 0 (0.0%) | 0 (0.0%) |
| $2,500 to $2,999 | 0 (0.0%) | 0 (0.0%) |
| $3,000 or more | 0 (0.0%) | 0 (0.0%) |
| Total | 838 (100.0%) | 818 (100.0%) |
Physical Housing Characteristics in Etna borough
Housing Structures in Etna borough
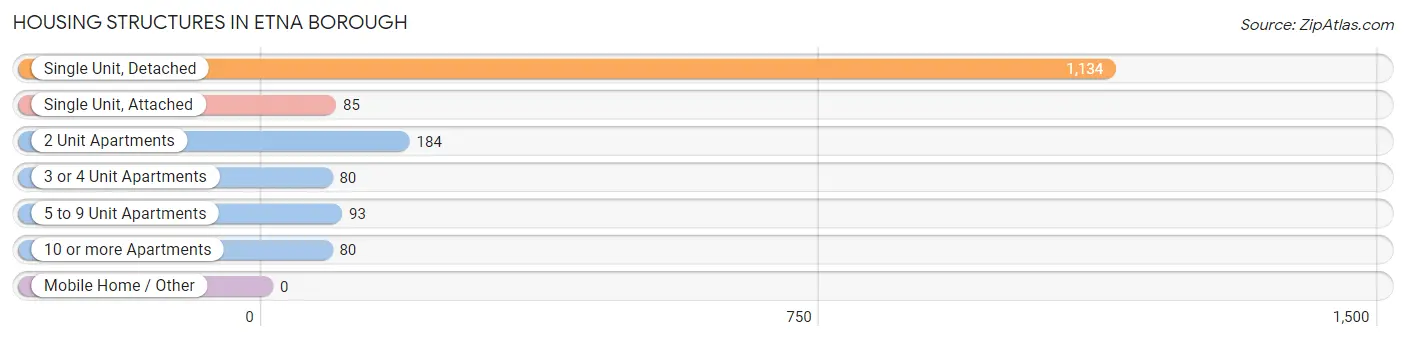
| Structure Type | # Housing Units | % Housing Units |
| Single Unit, Detached | 1,134 | 68.5% |
| Single Unit, Attached | 85 | 5.1% |
| 2 Unit Apartments | 184 | 11.1% |
| 3 or 4 Unit Apartments | 80 | 4.8% |
| 5 to 9 Unit Apartments | 93 | 5.6% |
| 10 or more Apartments | 80 | 4.8% |
| Mobile Home / Other | 0 | 0.0% |
| Total | 1,656 | 100.0% |
Housing Structures by Occupancy in Etna borough
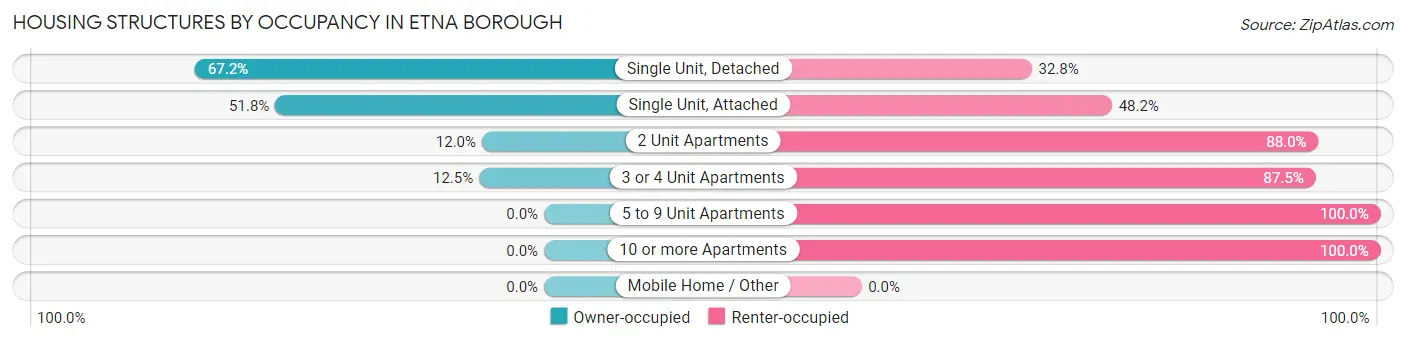
| Structure Type | Owner-occupied | Renter-occupied |
| Single Unit, Detached | 762 (67.2%) | 372 (32.8%) |
| Single Unit, Attached | 44 (51.8%) | 41 (48.2%) |
| 2 Unit Apartments | 22 (12.0%) | 162 (88.0%) |
| 3 or 4 Unit Apartments | 10 (12.5%) | 70 (87.5%) |
| 5 to 9 Unit Apartments | 0 (0.0%) | 93 (100.0%) |
| 10 or more Apartments | 0 (0.0%) | 80 (100.0%) |
| Mobile Home / Other | 0 (0.0%) | 0 (0.0%) |
| Total | 838 (50.6%) | 818 (49.4%) |
Housing Structures by Number of Rooms in Etna borough
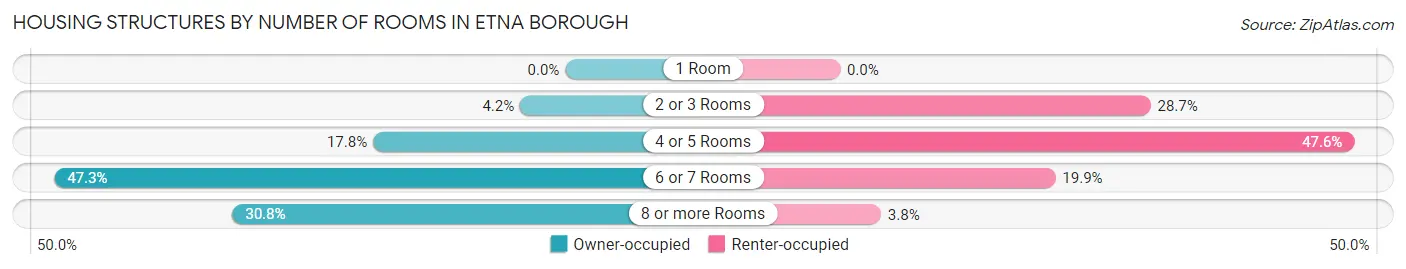
| Number of Rooms | Owner-occupied | Renter-occupied |
| 1 Room | 0 (0.0%) | 0 (0.0%) |
| 2 or 3 Rooms | 35 (4.2%) | 235 (28.7%) |
| 4 or 5 Rooms | 149 (17.8%) | 389 (47.6%) |
| 6 or 7 Rooms | 396 (47.3%) | 163 (19.9%) |
| 8 or more Rooms | 258 (30.8%) | 31 (3.8%) |
| Total | 838 (100.0%) | 818 (100.0%) |
Housing Structure by Heating Type in Etna borough
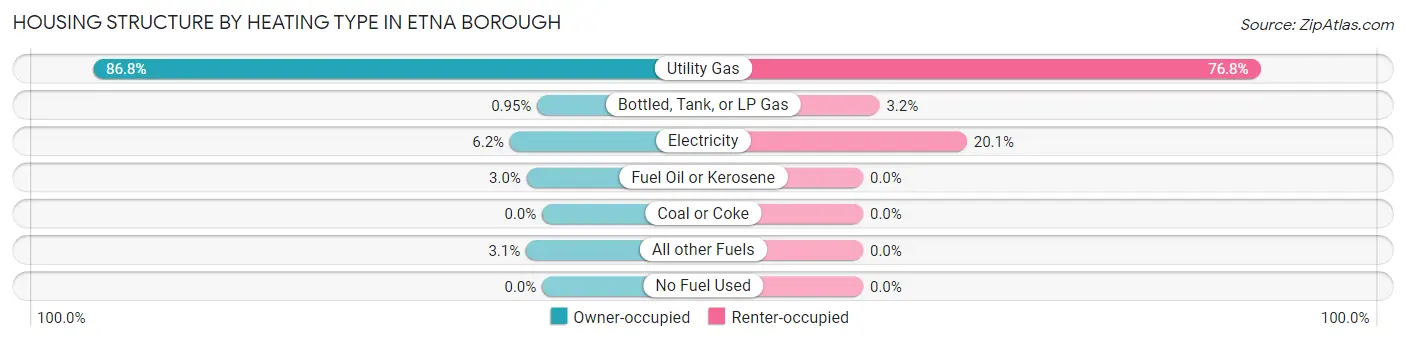
| Heating Type | Owner-occupied | Renter-occupied |
| Utility Gas | 727 (86.8%) | 628 (76.8%) |
| Bottled, Tank, or LP Gas | 8 (0.9%) | 26 (3.2%) |
| Electricity | 52 (6.2%) | 164 (20.1%) |
| Fuel Oil or Kerosene | 25 (3.0%) | 0 (0.0%) |
| Coal or Coke | 0 (0.0%) | 0 (0.0%) |
| All other Fuels | 26 (3.1%) | 0 (0.0%) |
| No Fuel Used | 0 (0.0%) | 0 (0.0%) |
| Total | 838 (100.0%) | 818 (100.0%) |
Household Vehicle Usage in Etna borough
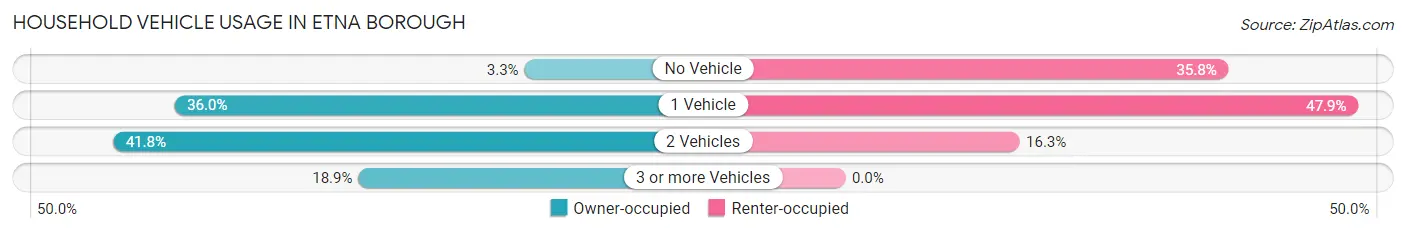
| Vehicles per Household | Owner-occupied | Renter-occupied |
| No Vehicle | 28 (3.3%) | 293 (35.8%) |
| 1 Vehicle | 302 (36.0%) | 392 (47.9%) |
| 2 Vehicles | 350 (41.8%) | 133 (16.3%) |
| 3 or more Vehicles | 158 (18.9%) | 0 (0.0%) |
| Total | 838 (100.0%) | 818 (100.0%) |
Real Estate & Mortgages in Etna borough
Real Estate and Mortgage Overview in Etna borough
| Characteristic | Without Mortgage | With Mortgage |
| Housing Units | 455 | 383 |
| Median Property Value | $99,100 | $124,400 |
| Median Household Income | $51,821 | $42 |
| Monthly Housing Costs | $463 | $0 |
| Real Estate Taxes | $1,217 | $0 |
Property Value by Mortgage Status in Etna borough
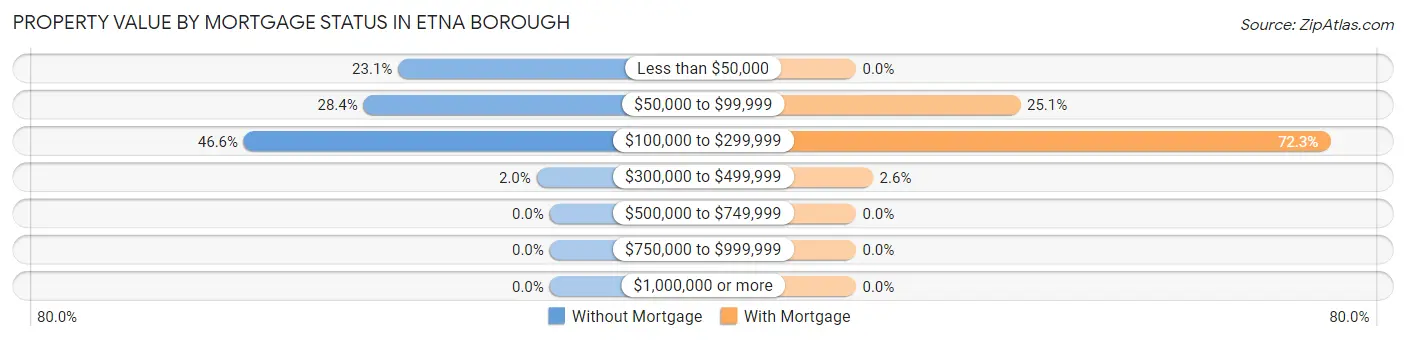
| Property Value | Without Mortgage | With Mortgage |
| Less than $50,000 | 105 (23.1%) | 0 (0.0%) |
| $50,000 to $99,999 | 129 (28.3%) | 96 (25.1%) |
| $100,000 to $299,999 | 212 (46.6%) | 277 (72.3%) |
| $300,000 to $499,999 | 9 (2.0%) | 10 (2.6%) |
| $500,000 to $749,999 | 0 (0.0%) | 0 (0.0%) |
| $750,000 to $999,999 | 0 (0.0%) | 0 (0.0%) |
| $1,000,000 or more | 0 (0.0%) | 0 (0.0%) |
| Total | 455 (100.0%) | 383 (100.0%) |
Household Income by Mortgage Status in Etna borough
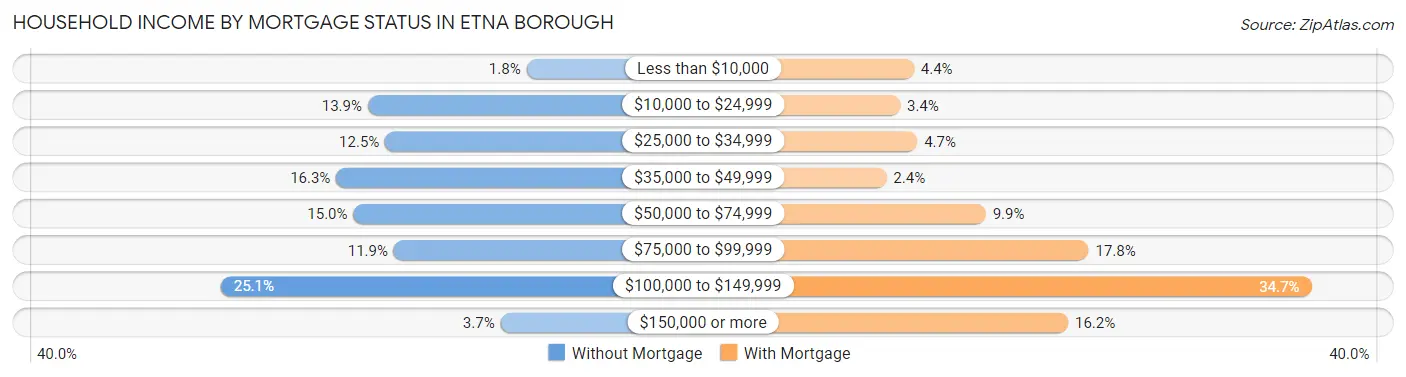
| Household Income | Without Mortgage | With Mortgage |
| Less than $10,000 | 8 (1.8%) | 17 (4.4%) |
| $10,000 to $24,999 | 63 (13.9%) | 13 (3.4%) |
| $25,000 to $34,999 | 57 (12.5%) | 18 (4.7%) |
| $35,000 to $49,999 | 74 (16.3%) | 9 (2.4%) |
| $50,000 to $74,999 | 68 (14.9%) | 38 (9.9%) |
| $75,000 to $99,999 | 54 (11.9%) | 68 (17.7%) |
| $100,000 to $149,999 | 114 (25.1%) | 133 (34.7%) |
| $150,000 or more | 17 (3.7%) | 62 (16.2%) |
| Total | 455 (100.0%) | 383 (100.0%) |
Property Value to Household Income Ratio in Etna borough
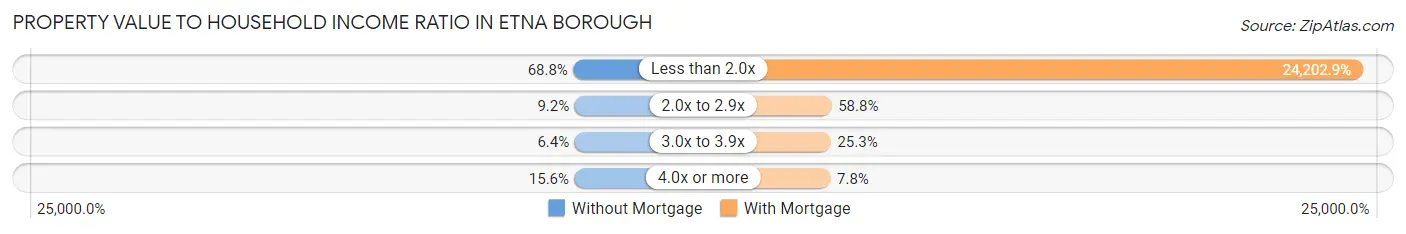
| Value-to-Income Ratio | Without Mortgage | With Mortgage |
| Less than 2.0x | 313 (68.8%) | 92,697 (24,202.9%) |
| 2.0x to 2.9x | 42 (9.2%) | 225 (58.8%) |
| 3.0x to 3.9x | 29 (6.4%) | 97 (25.3%) |
| 4.0x or more | 71 (15.6%) | 30 (7.8%) |
| Total | 455 (100.0%) | 383 (100.0%) |
Real Estate Taxes by Mortgage Status in Etna borough
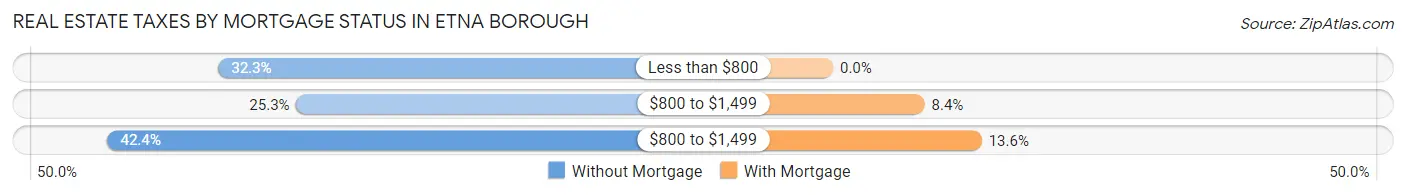
| Property Taxes | Without Mortgage | With Mortgage |
| Less than $800 | 147 (32.3%) | 0 (0.0%) |
| $800 to $1,499 | 115 (25.3%) | 32 (8.4%) |
| $800 to $1,499 | 193 (42.4%) | 52 (13.6%) |
| Total | 455 (100.0%) | 383 (100.0%) |
Health & Disability in Etna borough
Health Insurance Coverage by Age in Etna borough
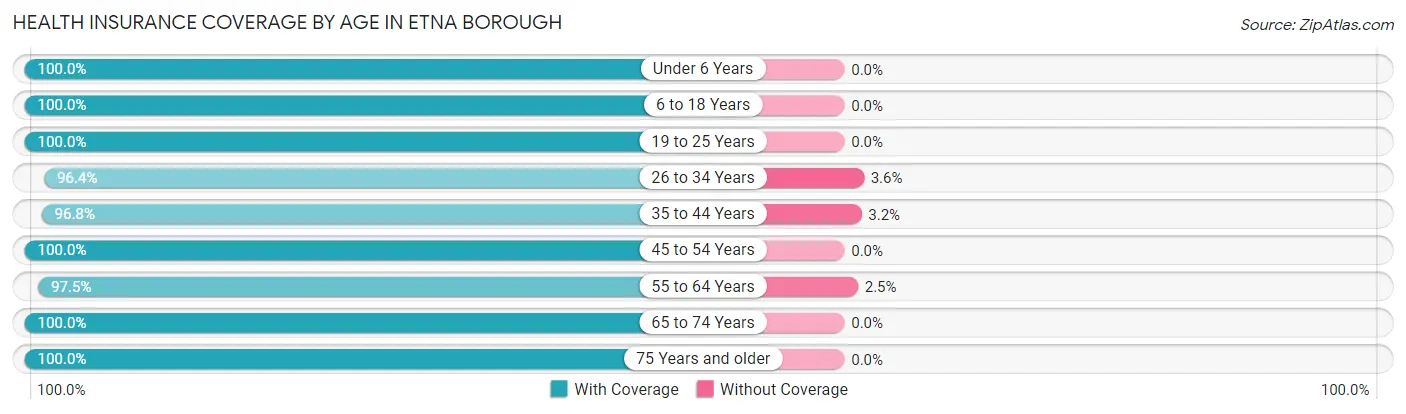
| Age Bracket | With Coverage | Without Coverage |
| Under 6 Years | 162 (100.0%) | 0 (0.0%) |
| 6 to 18 Years | 513 (100.0%) | 0 (0.0%) |
| 19 to 25 Years | 214 (100.0%) | 0 (0.0%) |
| 26 to 34 Years | 453 (96.4%) | 17 (3.6%) |
| 35 to 44 Years | 457 (96.8%) | 15 (3.2%) |
| 45 to 54 Years | 328 (100.0%) | 0 (0.0%) |
| 55 to 64 Years | 582 (97.5%) | 15 (2.5%) |
| 65 to 74 Years | 369 (100.0%) | 0 (0.0%) |
| 75 Years and older | 288 (100.0%) | 0 (0.0%) |
| Total | 3,366 (98.6%) | 47 (1.4%) |
Health Insurance Coverage by Citizenship Status in Etna borough
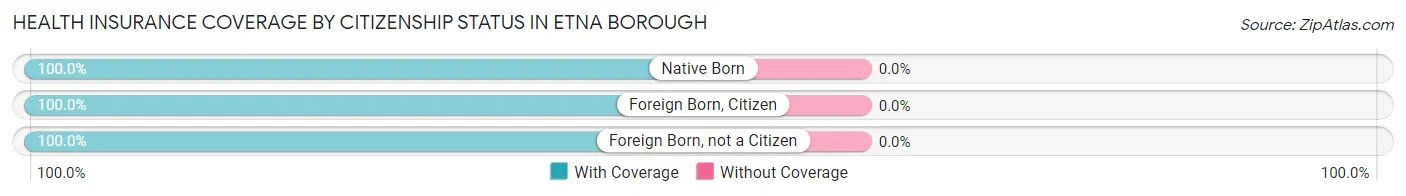
| Citizenship Status | With Coverage | Without Coverage |
| Native Born | 162 (100.0%) | 0 (0.0%) |
| Foreign Born, Citizen | 513 (100.0%) | 0 (0.0%) |
| Foreign Born, not a Citizen | 214 (100.0%) | 0 (0.0%) |
Health Insurance Coverage by Household Income in Etna borough
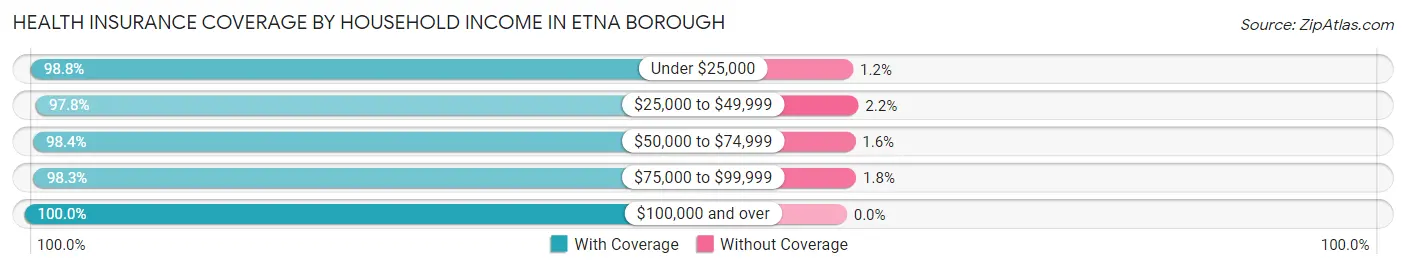
| Household Income | With Coverage | Without Coverage |
| Under $25,000 | 666 (98.8%) | 8 (1.2%) |
| $25,000 to $49,999 | 768 (97.8%) | 17 (2.2%) |
| $50,000 to $74,999 | 427 (98.4%) | 7 (1.6%) |
| $75,000 to $99,999 | 844 (98.3%) | 15 (1.8%) |
| $100,000 and over | 654 (100.0%) | 0 (0.0%) |
Public vs Private Health Insurance Coverage by Age in Etna borough
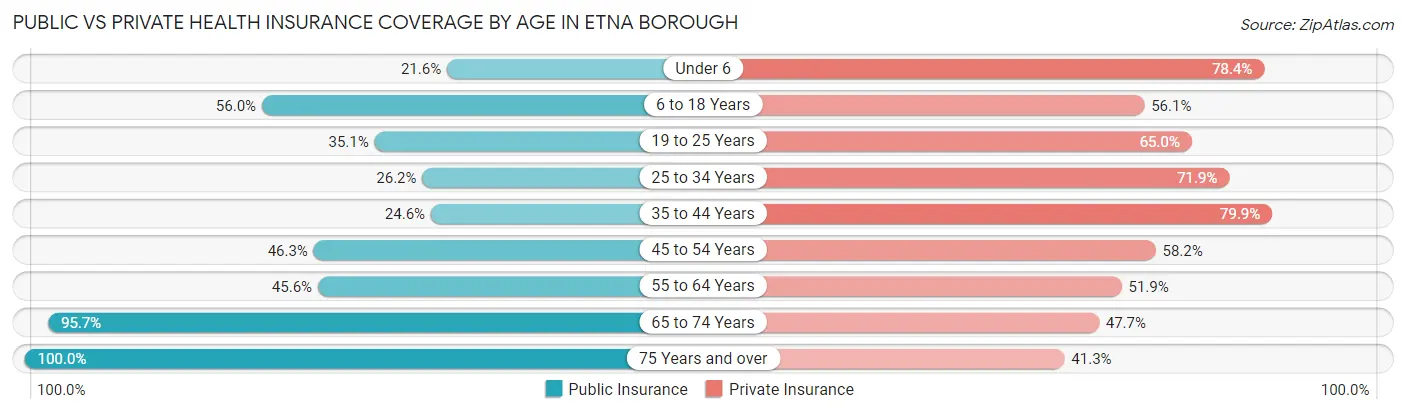
| Age Bracket | Public Insurance | Private Insurance |
| Under 6 | 35 (21.6%) | 127 (78.4%) |
| 6 to 18 Years | 287 (55.9%) | 288 (56.1%) |
| 19 to 25 Years | 75 (35.0%) | 139 (64.9%) |
| 25 to 34 Years | 123 (26.2%) | 338 (71.9%) |
| 35 to 44 Years | 116 (24.6%) | 377 (79.9%) |
| 45 to 54 Years | 152 (46.3%) | 191 (58.2%) |
| 55 to 64 Years | 272 (45.6%) | 310 (51.9%) |
| 65 to 74 Years | 353 (95.7%) | 176 (47.7%) |
| 75 Years and over | 288 (100.0%) | 119 (41.3%) |
| Total | 1,701 (49.8%) | 2,065 (60.5%) |
Disability Status by Sex by Age in Etna borough
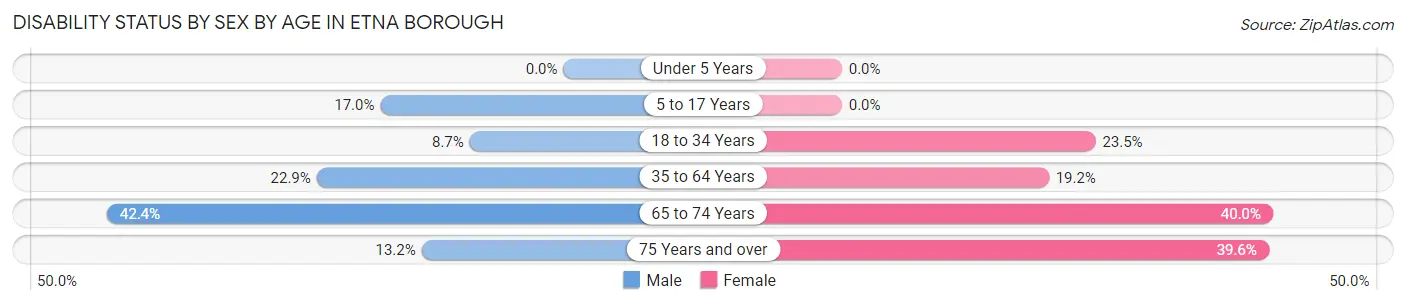
| Age Bracket | Male | Female |
| Under 5 Years | 0 (0.0%) | 0 (0.0%) |
| 5 to 17 Years | 44 (17.0%) | 0 (0.0%) |
| 18 to 34 Years | 34 (8.7%) | 89 (23.5%) |
| 35 to 64 Years | 172 (22.9%) | 124 (19.2%) |
| 65 to 74 Years | 97 (42.4%) | 56 (40.0%) |
| 75 Years and over | 10 (13.2%) | 84 (39.6%) |
Disability Class by Sex by Age in Etna borough
Disability Class: Hearing Difficulty
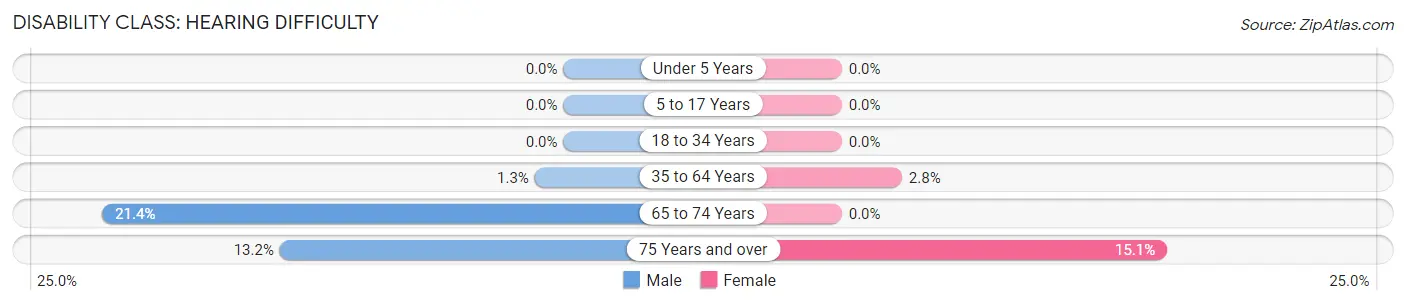
| Age Bracket | Male | Female |
| Under 5 Years | 0 (0.0%) | 0 (0.0%) |
| 5 to 17 Years | 0 (0.0%) | 0 (0.0%) |
| 18 to 34 Years | 0 (0.0%) | 0 (0.0%) |
| 35 to 64 Years | 10 (1.3%) | 18 (2.8%) |
| 65 to 74 Years | 49 (21.4%) | 0 (0.0%) |
| 75 Years and over | 10 (13.2%) | 32 (15.1%) |
Disability Class: Vision Difficulty
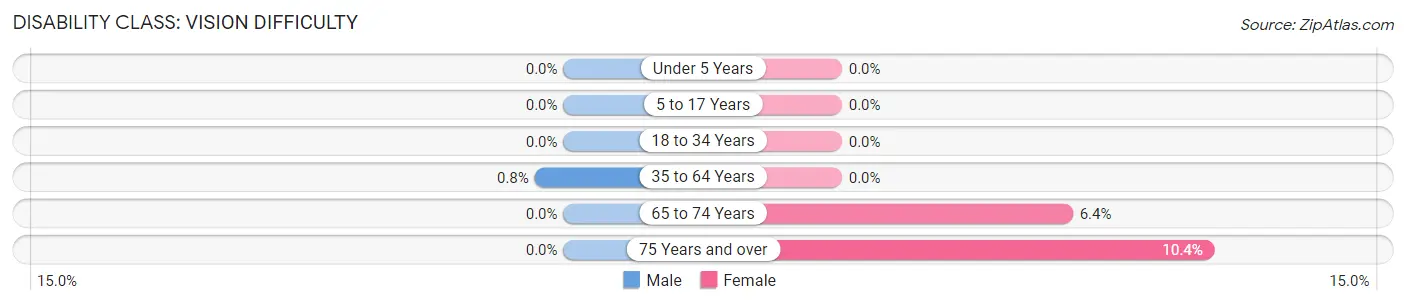
| Age Bracket | Male | Female |
| Under 5 Years | 0 (0.0%) | 0 (0.0%) |
| 5 to 17 Years | 0 (0.0%) | 0 (0.0%) |
| 18 to 34 Years | 0 (0.0%) | 0 (0.0%) |
| 35 to 64 Years | 6 (0.8%) | 0 (0.0%) |
| 65 to 74 Years | 0 (0.0%) | 9 (6.4%) |
| 75 Years and over | 0 (0.0%) | 22 (10.4%) |
Disability Class: Cognitive Difficulty
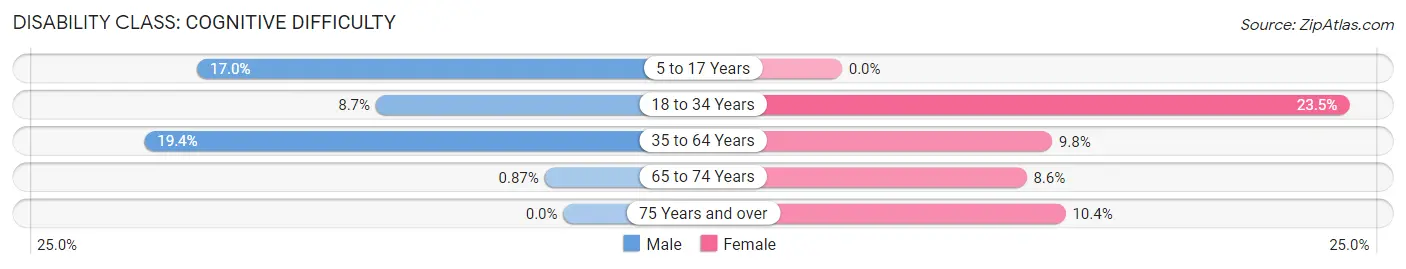
| Age Bracket | Male | Female |
| 5 to 17 Years | 44 (17.0%) | 0 (0.0%) |
| 18 to 34 Years | 34 (8.7%) | 89 (23.5%) |
| 35 to 64 Years | 146 (19.4%) | 63 (9.8%) |
| 65 to 74 Years | 2 (0.9%) | 12 (8.6%) |
| 75 Years and over | 0 (0.0%) | 22 (10.4%) |
Disability Class: Ambulatory Difficulty
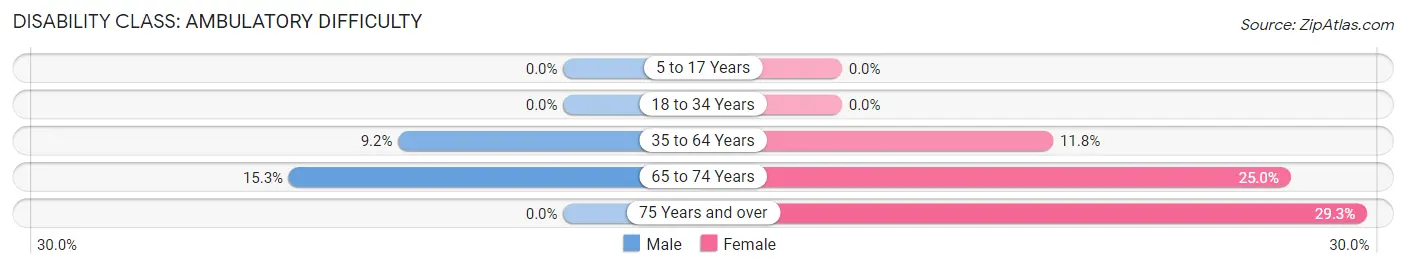
| Age Bracket | Male | Female |
| 5 to 17 Years | 0 (0.0%) | 0 (0.0%) |
| 18 to 34 Years | 0 (0.0%) | 0 (0.0%) |
| 35 to 64 Years | 69 (9.2%) | 76 (11.8%) |
| 65 to 74 Years | 35 (15.3%) | 35 (25.0%) |
| 75 Years and over | 0 (0.0%) | 62 (29.2%) |
Disability Class: Self-Care Difficulty
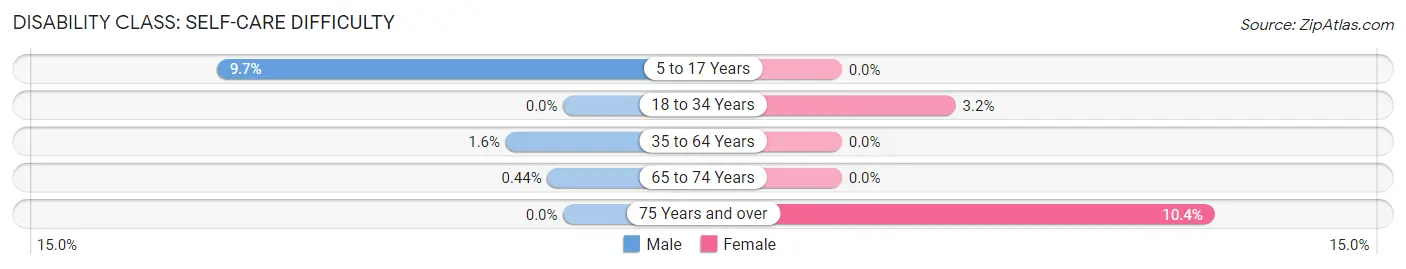
| Age Bracket | Male | Female |
| 5 to 17 Years | 25 (9.7%) | 0 (0.0%) |
| 18 to 34 Years | 0 (0.0%) | 12 (3.2%) |
| 35 to 64 Years | 12 (1.6%) | 0 (0.0%) |
| 65 to 74 Years | 1 (0.4%) | 0 (0.0%) |
| 75 Years and over | 0 (0.0%) | 22 (10.4%) |
Technology Access in Etna borough
Computing Device Access in Etna borough
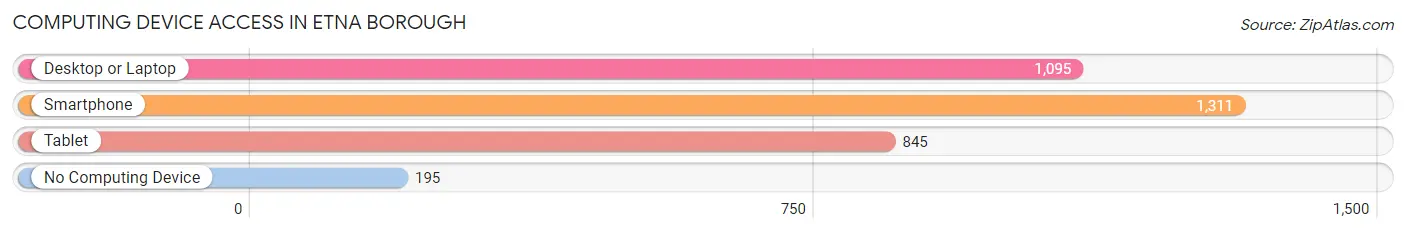
| Device Type | # Households | % Households |
| Desktop or Laptop | 1,095 | 66.1% |
| Smartphone | 1,311 | 79.2% |
| Tablet | 845 | 51.0% |
| No Computing Device | 195 | 11.8% |
| Total | 1,656 | 100.0% |
Internet Access in Etna borough
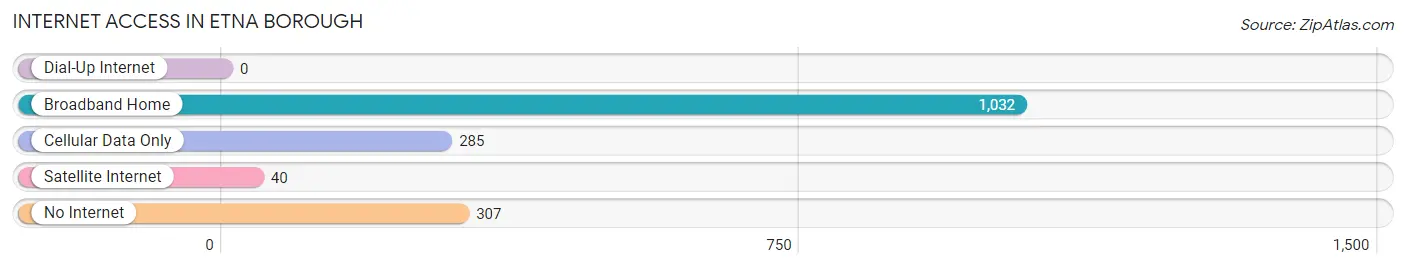
| Internet Type | # Households | % Households |
| Dial-Up Internet | 0 | 0.0% |
| Broadband Home | 1,032 | 62.3% |
| Cellular Data Only | 285 | 17.2% |
| Satellite Internet | 40 | 2.4% |
| No Internet | 307 | 18.5% |
| Total | 1,656 | 100.0% |
Etna borough Summary
Etna Borough is a small borough located in Allegheny County, Pennsylvania. It is situated in the eastern suburbs of Pittsburgh, and is part of the Pittsburgh Metropolitan Statistical Area. The borough has a population of approximately 3,000 people, and is home to a variety of businesses, including a number of small shops and restaurants.
History
Etna Borough was founded in 1868, and was originally known as Etna Station. The name was changed to Etna Borough in 1875. The borough was originally part of Shaler Township, and was incorporated as a separate municipality in 1875.
The borough was originally a farming community, and the first settlers were mostly of German and Irish descent. The borough was also home to a number of coal mines, which provided employment for many of the residents.
Geography
Etna Borough is located in Allegheny County, Pennsylvania. It is situated in the eastern suburbs of Pittsburgh, and is part of the Pittsburgh Metropolitan Statistical Area. The borough is bordered by Shaler Township to the north, Millvale to the east, Reserve Township to the south, and Ross Township to the west.
The borough has a total area of 0.8 square miles, all of which is land. The borough is located in the Allegheny Plateau region of Pennsylvania, and is characterized by rolling hills and valleys. The borough is located along the Allegheny River, and is home to a number of parks and recreational areas.
Economy
Etna Borough has a diverse economy, with a variety of businesses and industries. The borough is home to a number of small shops and restaurants, as well as a number of manufacturing and industrial businesses. The borough is also home to a number of professional services, such as accounting and legal firms.
The borough is also home to a number of educational institutions, including the Etna Borough School District, which serves the borough and surrounding areas. The borough is also home to a number of churches, and is served by the Etna Borough Public Library.
Demographics
As of the 2010 census, the population of Etna Borough was 3,077. The racial makeup of the borough was 94.3% White, 2.2% African American, 0.3% Native American, 0.7% Asian, 0.1% Pacific Islander, 0.7% from other races, and 1.7% from two or more races. Hispanic or Latino of any race were 1.7% of the population.
The median household income in Etna Borough was $41,944, and the median family income was $50,938. The per capita income for the borough was $20,945. About 8.3% of families and 10.2% of the population were below the poverty line, including 14.2% of those under age 18 and 6.2% of those age 65 or over.
Etna Borough is a small borough with a diverse population and economy. The borough is home to a number of businesses, educational institutions, and recreational areas, and is a great place to live and work.
Common Questions
What is Per Capita Income in Etna borough?
Per Capita income in Etna borough is $30,318.
What is the Median Family Income in Etna borough?
Median Family Income in Etna borough is $69,773.
What is the Median Household income in Etna borough?
Median Household Income in Etna borough is $46,892.
What is Income or Wage Gap in Etna borough?
Income or Wage Gap in Etna borough is 34.6%.
Women in Etna borough earn 65.4 cents for every dollar earned by a man.
What is Family Income Deficit in Etna borough?
Family Income Deficit in Etna borough is $7,210.
Families that are below poverty line in Etna borough earn $7,210 less on average than the poverty threshold level.
What is Inequality or Gini Index in Etna borough?
Inequality or Gini Index in Etna borough is 0.44.
What is the Total Population of Etna borough?
Total Population of Etna borough is 3,413.
What is the Total Male Population of Etna borough?
Total Male Population of Etna borough is 1,797.
What is the Total Female Population of Etna borough?
Total Female Population of Etna borough is 1,616.
What is the Ratio of Males per 100 Females in Etna borough?
There are 111.20 Males per 100 Females in Etna borough.
What is the Ratio of Females per 100 Males in Etna borough?
There are 89.93 Females per 100 Males in Etna borough.
What is the Median Population Age in Etna borough?
Median Population Age in Etna borough is 41.8 Years.
What is the Average Family Size in Etna borough
Average Family Size in Etna borough is 2.7 People.
What is the Average Household Size in Etna borough
Average Household Size in Etna borough is 2.1 People.
How Large is the Labor Force in Etna borough?
There are 1,791 People in the Labor Forcein in Etna borough.
What is the Percentage of People in the Labor Force in Etna borough?
63.1% of People are in the Labor Force in Etna borough.
What is the Unemployment Rate in Etna borough?
Unemployment Rate in Etna borough is 8.9%.