Zip Codes with the Highest Percentage of Population Employed in Food Preparation & Serving in New Castle, PA
RELATED REPORTS & OPTIONS
Food Preparation & Serving
New Castle
Compare Zip Codes
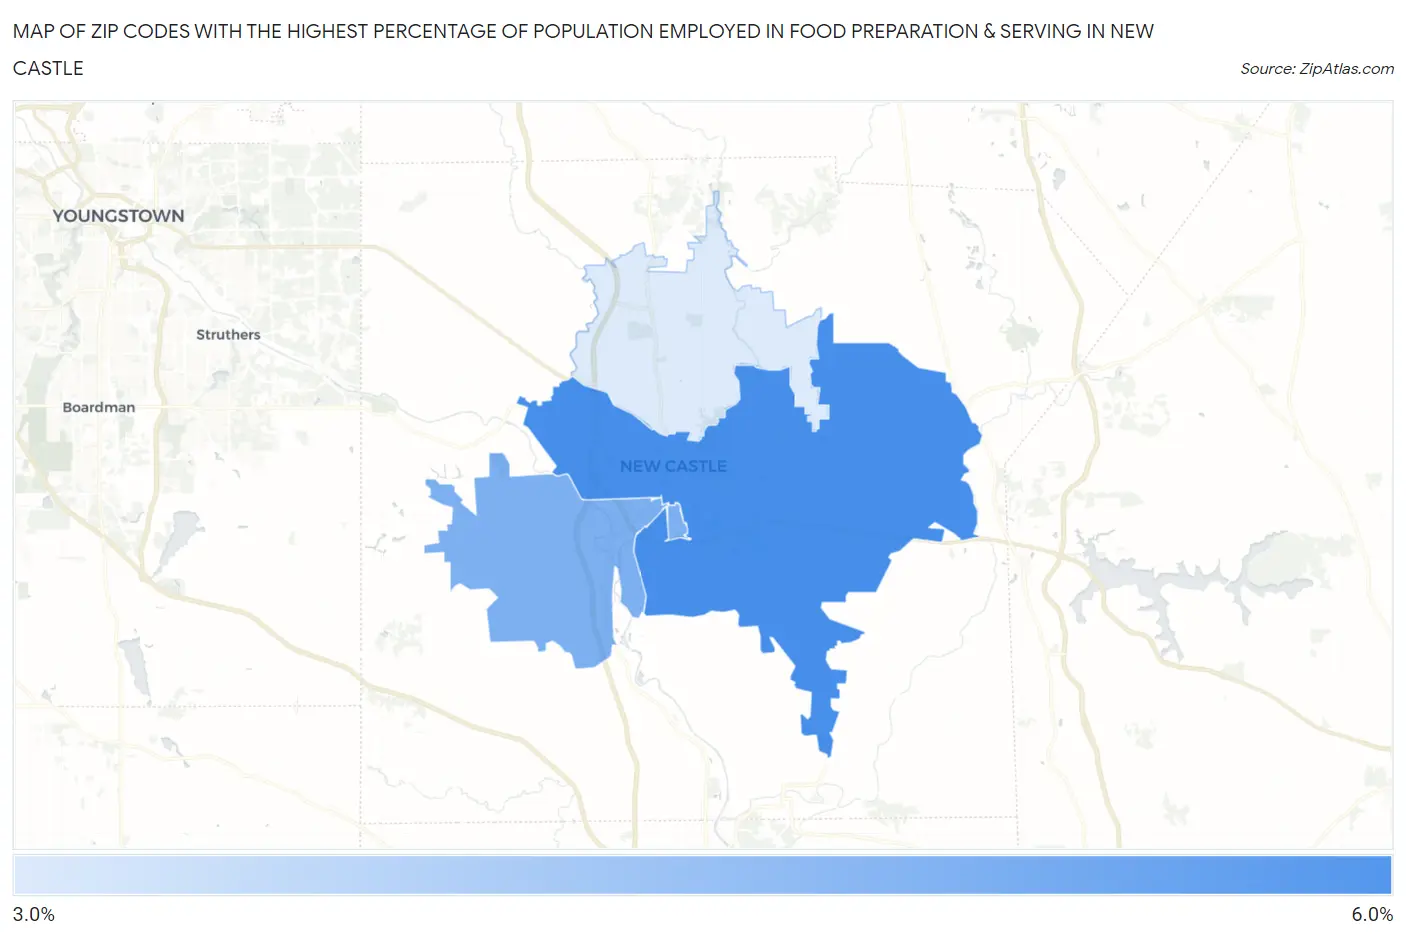
Map of Zip Codes with the Highest Percentage of Population Employed in Food Preparation & Serving in New Castle
3.6%
5.7%
Zip Codes with the Highest Percentage of Population Employed in Food Preparation & Serving in New Castle, PA
| Zip Code | % Employed | vs State | vs National | |
| 1. | 16101 | 5.7% | 5.0%(+0.683)#554 | 5.3%(+0.440)#10,255 |
| 2. | 16102 | 5.0% | 5.0%(-0.050)#737 | 5.3%(-0.293)#12,987 |
| 3. | 16105 | 3.6% | 5.0%(-1.42)#1,084 | 5.3%(-1.66)#18,676 |
1
Common Questions
What are the Top Zip Codes with the Highest Percentage of Population Employed in Food Preparation & Serving in New Castle, PA?
Top Zip Codes with the Highest Percentage of Population Employed in Food Preparation & Serving in New Castle, PA are:
What zip code has the Highest Percentage of Population Employed in Food Preparation & Serving in New Castle, PA?
16101 has the Highest Percentage of Population Employed in Food Preparation & Serving in New Castle, PA with 5.7%.
What is the Percentage of Population Employed in Food Preparation & Serving in New Castle, PA?
Percentage of Population Employed in Food Preparation & Serving in New Castle is 5.4%.
What is the Percentage of Population Employed in Food Preparation & Serving in Pennsylvania?
Percentage of Population Employed in Food Preparation & Serving in Pennsylvania is 5.0%.
What is the Percentage of Population Employed in Food Preparation & Serving in the United States?
Percentage of Population Employed in Food Preparation & Serving in the United States is 5.3%.