Cities with the Highest Percentage of Syrian Population in Pennsylvania
RELATED REPORTS & OPTIONS
Syrian
Pennsylvania
Compare Cities
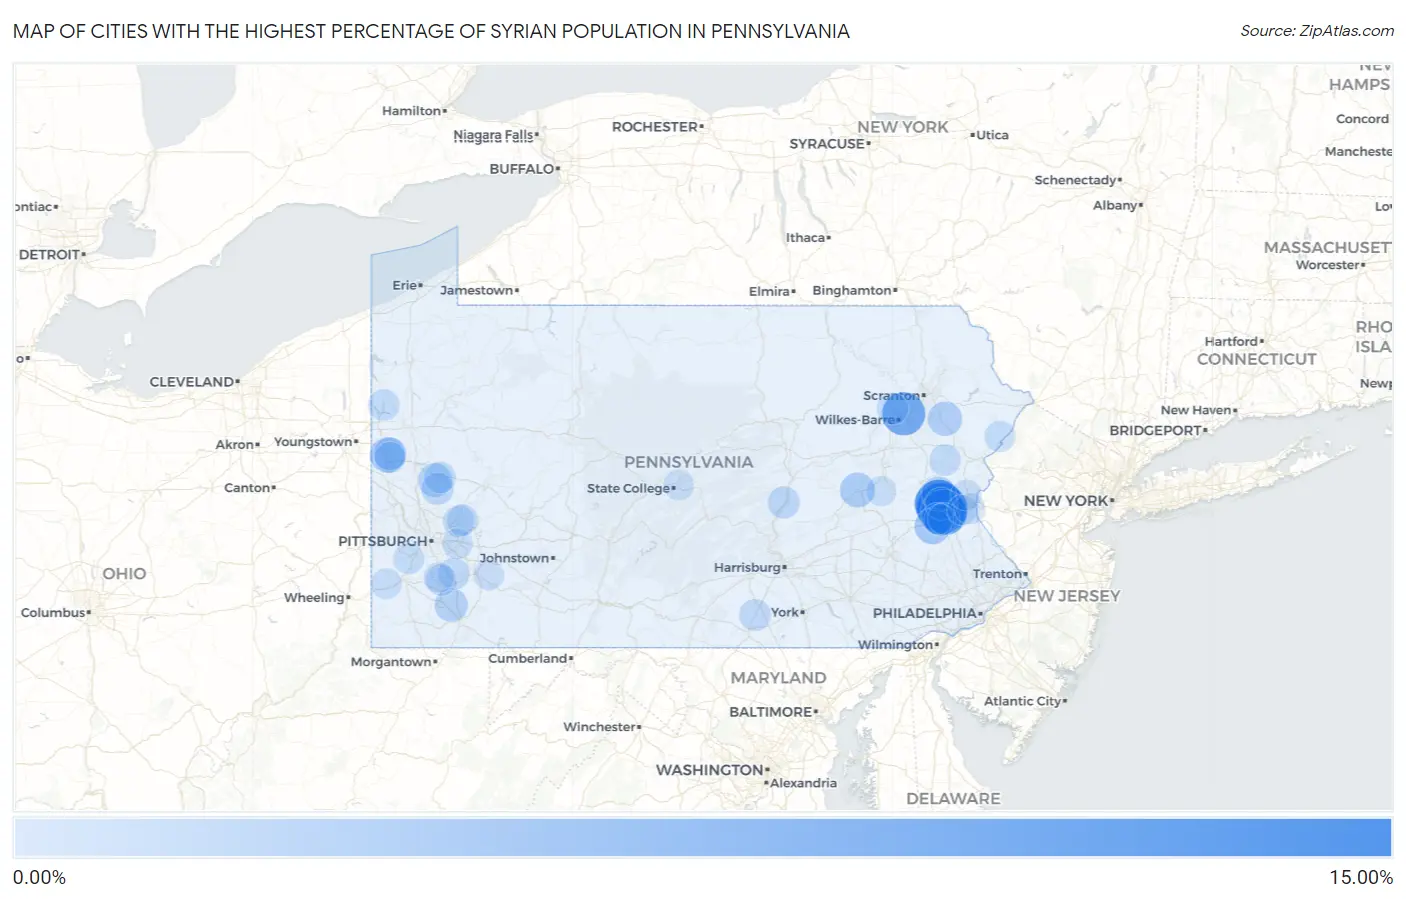
Map of Cities with the Highest Percentage of Syrian Population in Pennsylvania
0.00%
15.00%
Cities with the Highest Percentage of Syrian Population in Pennsylvania
| City | Syrian | vs State | vs National | |
| 1. | Hokendauqua | 11.08% | 0.12%(+11.0)#1 | 0.059%(+11.0)#3 |
| 2. | Stiles | 10.67% | 0.12%(+10.5)#2 | 0.059%(+10.6)#5 |
| 3. | Egypt | 10.14% | 0.12%(+10.0)#3 | 0.059%(+10.1)#7 |
| 4. | Fullerton | 9.08% | 0.12%(+8.96)#4 | 0.059%(+9.02)#8 |
| 5. | Hilldale | 7.51% | 0.12%(+7.39)#5 | 0.059%(+7.45)#13 |
| 6. | Ohiopyle Borough | 5.88% | 0.12%(+5.76)#6 | 0.059%(+5.82)#23 |
| 7. | Ore Hill | 5.80% | 0.12%(+5.68)#7 | 0.059%(+5.74)#24 |
| 8. | Leetsdale Borough | 5.07% | 0.12%(+4.95)#8 | 0.059%(+5.01)#27 |
| 9. | Ancient Oaks | 3.50% | 0.12%(+3.38)#9 | 0.059%(+3.45)#39 |
| 10. | West Easton Borough | 3.14% | 0.12%(+3.02)#10 | 0.059%(+3.08)#50 |
| 11. | Oakwood | 3.11% | 0.12%(+2.99)#11 | 0.059%(+3.05)#51 |
| 12. | Englewood | 2.86% | 0.12%(+2.74)#12 | 0.059%(+2.80)#56 |
| 13. | Big Bass Lake | 2.61% | 0.12%(+2.48)#13 | 0.059%(+2.55)#62 |
| 14. | Cherryville | 2.58% | 0.12%(+2.46)#14 | 0.059%(+2.52)#64 |
| 15. | Conyngham Borough | 2.50% | 0.12%(+2.38)#15 | 0.059%(+2.45)#67 |
| 16. | Meridian | 2.37% | 0.12%(+2.25)#16 | 0.059%(+2.31)#70 |
| 17. | Yatesville Borough | 2.30% | 0.12%(+2.18)#17 | 0.059%(+2.24)#73 |
| 18. | South Heights Borough | 2.10% | 0.12%(+1.98)#18 | 0.059%(+2.04)#81 |
| 19. | Rowes Run | 2.08% | 0.12%(+1.96)#19 | 0.059%(+2.02)#84 |
| 20. | Penbrook Borough | 1.97% | 0.12%(+1.85)#20 | 0.059%(+1.91)#93 |
| 21. | Arona Borough | 1.96% | 0.12%(+1.84)#21 | 0.059%(+1.90)#94 |
| 22. | Forty Fort Borough | 1.79% | 0.12%(+1.67)#22 | 0.059%(+1.73)#101 |
| 23. | New Castle Northwest | 1.74% | 0.12%(+1.62)#23 | 0.059%(+1.68)#104 |
| 24. | Sewickley Borough | 1.63% | 0.12%(+1.51)#24 | 0.059%(+1.57)#114 |
| 25. | Nixon | 1.48% | 0.12%(+1.36)#25 | 0.059%(+1.42)#137 |
| 26. | Cementon | 1.47% | 0.12%(+1.34)#26 | 0.059%(+1.41)#138 |
| 27. | Port Trevorton | 1.43% | 0.12%(+1.31)#27 | 0.059%(+1.37)#140 |
| 28. | Heidlersburg | 1.33% | 0.12%(+1.21)#28 | 0.059%(+1.27)#150 |
| 29. | Towanda Borough | 1.32% | 0.12%(+1.20)#29 | 0.059%(+1.26)#152 |
| 30. | East Vandergrift Borough | 1.28% | 0.12%(+1.16)#30 | 0.059%(+1.22)#155 |
| 31. | Fountain Hill Borough | 1.25% | 0.12%(+1.12)#31 | 0.059%(+1.19)#164 |
| 32. | Collinsburg | 1.22% | 0.12%(+1.10)#32 | 0.059%(+1.16)#167 |
| 33. | Harveys Lake Borough | 1.22% | 0.12%(+1.10)#33 | 0.059%(+1.16)#168 |
| 34. | Dorneyville | 1.18% | 0.12%(+1.06)#34 | 0.059%(+1.12)#172 |
| 35. | Homeacre Lyndora | 1.17% | 0.12%(+1.05)#35 | 0.059%(+1.11)#174 |
| 36. | Reynolds Heights | 1.16% | 0.12%(+1.04)#36 | 0.059%(+1.10)#176 |
| 37. | New Kensington | 1.13% | 0.12%(+1.01)#37 | 0.059%(+1.08)#182 |
| 38. | Sun Valley | 1.13% | 0.12%(+1.01)#38 | 0.059%(+1.07)#184 |
| 39. | Clarks Green Borough | 1.13% | 0.12%(+1.01)#39 | 0.059%(+1.07)#186 |
| 40. | Shavertown | 1.10% | 0.12%(+0.982)#40 | 0.059%(+1.04)#189 |
| 41. | Cetronia | 1.09% | 0.12%(+0.973)#41 | 0.059%(+1.03)#193 |
| 42. | Allentown | 1.09% | 0.12%(+0.972)#42 | 0.059%(+1.03)#195 |
| 43. | Irwin Borough | 1.01% | 0.12%(+0.885)#43 | 0.059%(+0.947)#218 |
| 44. | Wickerham Manor Fisher | 1.00% | 0.12%(+0.881)#44 | 0.059%(+0.942)#221 |
| 45. | North Belle Vernon Borough | 1.00% | 0.12%(+0.881)#45 | 0.059%(+0.942)#222 |
| 46. | Lower Burrell | 1.00% | 0.12%(+0.879)#46 | 0.059%(+0.941)#223 |
| 47. | Alburtis Borough | 0.97% | 0.12%(+0.852)#47 | 0.059%(+0.914)#232 |
| 48. | New Castle | 0.95% | 0.12%(+0.831)#48 | 0.059%(+0.892)#238 |
| 49. | South Greensburg Borough | 0.92% | 0.12%(+0.800)#49 | 0.059%(+0.861)#246 |
| 50. | Carnegie Borough | 0.90% | 0.12%(+0.784)#50 | 0.059%(+0.846)#248 |
| 51. | Pine Ridge | 0.90% | 0.12%(+0.781)#51 | 0.059%(+0.842)#250 |
| 52. | Centerville Borough Washington County | 0.89% | 0.12%(+0.773)#52 | 0.059%(+0.835)#253 |
| 53. | Cecil Bishop | 0.86% | 0.12%(+0.736)#53 | 0.059%(+0.798)#264 |
| 54. | Wallaceton Borough | 0.81% | 0.12%(+0.692)#54 | 0.059%(+0.754)#275 |
| 55. | Jacksonville Cdp Indiana County | 0.80% | 0.12%(+0.684)#55 | 0.059%(+0.746)#279 |
| 56. | Saltsburg Borough | 0.80% | 0.12%(+0.677)#56 | 0.059%(+0.739)#281 |
| 57. | North Charleroi Borough | 0.79% | 0.12%(+0.668)#57 | 0.059%(+0.730)#286 |
| 58. | Avalon Borough | 0.78% | 0.12%(+0.660)#58 | 0.059%(+0.722)#291 |
| 59. | Taylorstown | 0.76% | 0.12%(+0.643)#59 | 0.059%(+0.704)#296 |
| 60. | West Newton Borough | 0.75% | 0.12%(+0.633)#60 | 0.059%(+0.695)#299 |
| 61. | Monroeville | 0.75% | 0.12%(+0.626)#61 | 0.059%(+0.688)#302 |
| 62. | Waynesboro Borough | 0.74% | 0.12%(+0.624)#62 | 0.059%(+0.686)#303 |
| 63. | West Pittston Borough | 0.73% | 0.12%(+0.608)#63 | 0.059%(+0.670)#312 |
| 64. | Baden Borough | 0.72% | 0.12%(+0.599)#64 | 0.059%(+0.661)#314 |
| 65. | Old Orchard | 0.71% | 0.12%(+0.591)#65 | 0.059%(+0.653)#318 |
| 66. | Eastlawn Gardens | 0.71% | 0.12%(+0.586)#66 | 0.059%(+0.648)#320 |
| 67. | Georgetown Cdp Luzerne County | 0.69% | 0.12%(+0.568)#67 | 0.059%(+0.629)#328 |
| 68. | South Coatesville Borough | 0.69% | 0.12%(+0.565)#68 | 0.059%(+0.626)#331 |
| 69. | Schwenksville Borough | 0.66% | 0.12%(+0.538)#69 | 0.059%(+0.600)#342 |
| 70. | Macungie Borough | 0.65% | 0.12%(+0.526)#70 | 0.059%(+0.587)#347 |
| 71. | Midland Borough | 0.64% | 0.12%(+0.519)#71 | 0.059%(+0.581)#355 |
| 72. | Calumet | 0.64% | 0.12%(+0.515)#72 | 0.059%(+0.577)#359 |
| 73. | Riegelsville Borough | 0.63% | 0.12%(+0.511)#73 | 0.059%(+0.572)#362 |
| 74. | Applewold Borough | 0.63% | 0.12%(+0.504)#74 | 0.059%(+0.566)#367 |
| 75. | Lemont | 0.62% | 0.12%(+0.503)#75 | 0.059%(+0.564)#368 |
| 76. | Blakely Borough | 0.62% | 0.12%(+0.496)#76 | 0.059%(+0.558)#373 |
| 77. | Pleasant Hills Borough | 0.61% | 0.12%(+0.494)#77 | 0.059%(+0.556)#375 |
| 78. | Saxton Borough | 0.61% | 0.12%(+0.490)#78 | 0.059%(+0.552)#378 |
| 79. | Houtzdale Borough | 0.60% | 0.12%(+0.480)#79 | 0.059%(+0.541)#386 |
| 80. | Mansfield Borough | 0.60% | 0.12%(+0.475)#80 | 0.059%(+0.536)#393 |
| 81. | Brackenridge Borough | 0.59% | 0.12%(+0.470)#81 | 0.059%(+0.532)#400 |
| 82. | Exeter Borough | 0.58% | 0.12%(+0.460)#82 | 0.059%(+0.522)#407 |
| 83. | Manor Borough | 0.54% | 0.12%(+0.415)#83 | 0.059%(+0.477)#435 |
| 84. | Wampum Borough | 0.53% | 0.12%(+0.413)#84 | 0.059%(+0.475)#437 |
| 85. | Monongahela | 0.53% | 0.12%(+0.410)#85 | 0.059%(+0.471)#439 |
| 86. | Ford City Borough | 0.53% | 0.12%(+0.406)#86 | 0.059%(+0.467)#443 |
| 87. | Somerset Borough | 0.51% | 0.12%(+0.393)#87 | 0.059%(+0.455)#449 |
| 88. | Tuscarora | 0.50% | 0.12%(+0.374)#88 | 0.059%(+0.436)#462 |
| 89. | Bridgeville Borough | 0.48% | 0.12%(+0.361)#89 | 0.059%(+0.422)#477 |
| 90. | Bellwood Borough | 0.48% | 0.12%(+0.355)#90 | 0.059%(+0.417)#481 |
| 91. | Fallston Borough | 0.47% | 0.12%(+0.353)#91 | 0.059%(+0.415)#482 |
| 92. | Laurel Run Borough | 0.45% | 0.12%(+0.325)#92 | 0.059%(+0.386)#512 |
| 93. | West Chester Borough | 0.43% | 0.12%(+0.305)#93 | 0.059%(+0.367)#524 |
| 94. | Whitehall Borough | 0.42% | 0.12%(+0.295)#94 | 0.059%(+0.357)#535 |
| 95. | Middletown | 0.41% | 0.12%(+0.293)#95 | 0.059%(+0.355)#538 |
| 96. | Roslyn | 0.41% | 0.12%(+0.289)#96 | 0.059%(+0.351)#541 |
| 97. | Brookhaven Borough | 0.40% | 0.12%(+0.278)#97 | 0.059%(+0.340)#549 |
| 98. | Catasauqua Borough | 0.38% | 0.12%(+0.263)#98 | 0.059%(+0.325)#566 |
| 99. | Warrior Run Borough | 0.38% | 0.12%(+0.262)#99 | 0.059%(+0.323)#570 |
| 100. | Chester Heights Borough | 0.38% | 0.12%(+0.259)#100 | 0.059%(+0.321)#576 |
Common Questions
What are the Top 10 Cities with the Highest Percentage of Syrian Population in Pennsylvania?
Top 10 Cities with the Highest Percentage of Syrian Population in Pennsylvania are:
#1
11.08%
#2
10.67%
#3
10.14%
#4
9.08%
#5
7.51%
#6
3.50%
#7
3.11%
#8
2.86%
#9
2.61%
#10
2.58%
What city has the Highest Percentage of Syrian Population in Pennsylvania?
Hokendauqua has the Highest Percentage of Syrian Population in Pennsylvania with 11.08%.
What is the Percentage of Syrian Population in the State of Pennsylvania?
Percentage of Syrian Population in Pennsylvania is 0.12%.
What is the Percentage of Syrian Population in the United States?
Percentage of Syrian Population in the United States is 0.059%.