Cities with the Highest Percentage of Population Employed in Utilities in Pennsylvania
RELATED REPORTS & OPTIONS
Utilities
Pennsylvania
Compare Cities
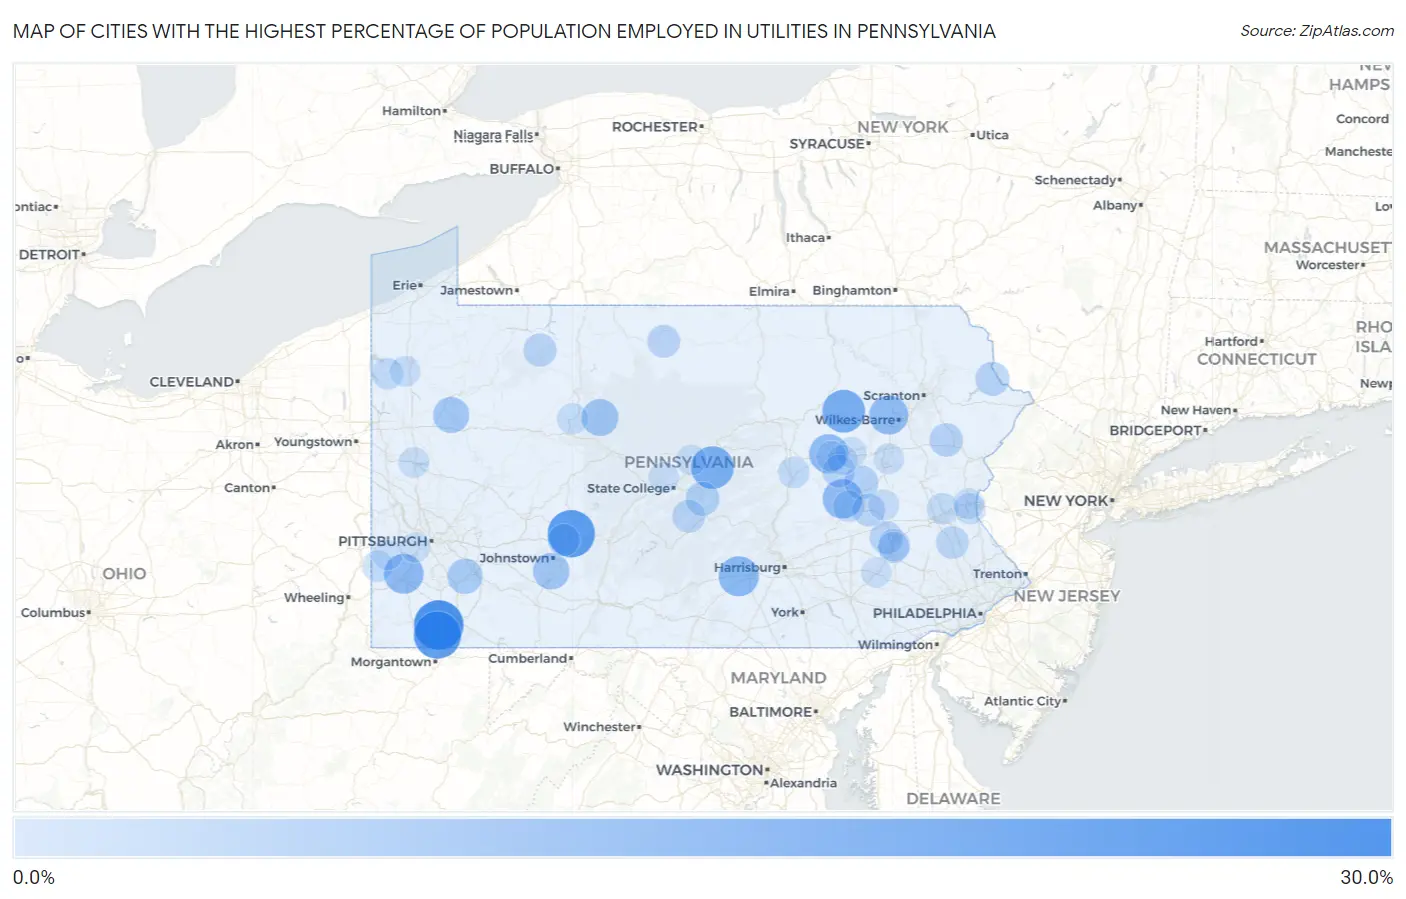
Map of Cities with the Highest Percentage of Population Employed in Utilities in Pennsylvania
0.0%
30.0%
Cities with the Highest Percentage of Population Employed in Utilities in Pennsylvania
| City | % Employed | vs State | vs National | |
| 1. | Nemacolin | 25.2% | 0.91%(+24.3)#1 | 0.84%(+24.3)#113 |
| 2. | Revloc | 22.8% | 0.91%(+21.9)#2 | 0.84%(+21.9)#138 |
| 3. | Mapletown | 22.7% | 0.91%(+21.8)#3 | 0.84%(+21.9)#139 |
| 4. | Addison Borough | 19.2% | 0.91%(+18.3)#4 | 0.84%(+18.4)#184 |
| 5. | Jefferson Borough Greene County | 18.5% | 0.91%(+17.6)#5 | 0.84%(+17.7)#200 |
| 6. | Jamison City | 17.8% | 0.91%(+16.9)#6 | 0.84%(+17.0)#207 |
| 7. | Madisonburg | 17.6% | 0.91%(+16.7)#7 | 0.84%(+16.8)#210 |
| 8. | Dayton Borough | 17.0% | 0.91%(+16.1)#8 | 0.84%(+16.2)#227 |
| 9. | Sproul | 15.5% | 0.91%(+14.6)#9 | 0.84%(+14.7)#267 |
| 10. | Plainfield | 14.9% | 0.91%(+14.0)#10 | 0.84%(+14.1)#287 |
| 11. | Meadowlands | 14.5% | 0.91%(+13.6)#11 | 0.84%(+13.7)#305 |
| 12. | Beurys Lake | 14.3% | 0.91%(+13.4)#12 | 0.84%(+13.4)#314 |
| 13. | Friesville | 14.0% | 0.91%(+13.1)#13 | 0.84%(+13.1)#322 |
| 14. | Buckhorn | 14.0% | 0.91%(+13.0)#14 | 0.84%(+13.1)#326 |
| 15. | Chase | 13.9% | 0.91%(+12.9)#15 | 0.84%(+13.0)#330 |
| 16. | Centerville Borough Crawford County | 13.5% | 0.91%(+12.6)#16 | 0.84%(+12.6)#340 |
| 17. | Kimberton | 12.5% | 0.91%(+11.6)#17 | 0.84%(+11.7)#380 |
| 18. | South Renovo Borough | 12.0% | 0.91%(+11.1)#18 | 0.84%(+11.2)#402 |
| 19. | Force | 11.5% | 0.91%(+10.6)#19 | 0.84%(+10.7)#440 |
| 20. | Davidsville | 11.0% | 0.91%(+10.1)#20 | 0.84%(+10.2)#465 |
| 21. | Kennerdell | 10.6% | 0.91%(+9.73)#21 | 0.84%(+9.80)#483 |
| 22. | Sickles Corner | 10.4% | 0.91%(+9.48)#22 | 0.84%(+9.55)#495 |
| 23. | Towanda Borough | 10.4% | 0.91%(+9.47)#23 | 0.84%(+9.54)#497 |
| 24. | Marklesburg Borough | 10.2% | 0.91%(+9.30)#24 | 0.84%(+9.37)#512 |
| 25. | Renovo Borough | 10.1% | 0.91%(+9.18)#25 | 0.84%(+9.25)#522 |
| 26. | Wyano | 9.8% | 0.91%(+8.93)#26 | 0.84%(+9.00)#540 |
| 27. | Elderton Borough | 9.6% | 0.91%(+8.71)#27 | 0.84%(+8.78)#560 |
| 28. | Elberta | 9.5% | 0.91%(+8.57)#28 | 0.84%(+8.64)#579 |
| 29. | New Alexandria Borough | 8.7% | 0.91%(+7.76)#29 | 0.84%(+7.82)#645 |
| 30. | Shenandoah Heights | 8.5% | 0.91%(+7.57)#30 | 0.84%(+7.64)#670 |
| 31. | Potlicker Flats | 8.4% | 0.91%(+7.51)#31 | 0.84%(+7.57)#680 |
| 32. | Fawn Lake Forest | 8.4% | 0.91%(+7.47)#32 | 0.84%(+7.54)#682 |
| 33. | Delmont Borough | 8.3% | 0.91%(+7.37)#33 | 0.84%(+7.44)#690 |
| 34. | North Bend | 8.1% | 0.91%(+7.20)#34 | 0.84%(+7.27)#709 |
| 35. | New Columbus Borough | 8.0% | 0.91%(+7.06)#35 | 0.84%(+7.13)#735 |
| 36. | Petersburg Borough | 8.0% | 0.91%(+7.05)#36 | 0.84%(+7.12)#736 |
| 37. | Pocono Pines | 7.9% | 0.91%(+7.02)#37 | 0.84%(+7.09)#741 |
| 38. | Sheffield | 7.7% | 0.91%(+6.79)#38 | 0.84%(+6.86)#766 |
| 39. | Stockertown Borough | 7.6% | 0.91%(+6.74)#39 | 0.84%(+6.81)#776 |
| 40. | Frankfort Springs Borough | 7.6% | 0.91%(+6.67)#40 | 0.84%(+6.74)#782 |
| 41. | Dauberville | 7.5% | 0.91%(+6.55)#41 | 0.84%(+6.61)#801 |
| 42. | Belleville | 7.4% | 0.91%(+6.49)#42 | 0.84%(+6.55)#811 |
| 43. | Sweden Valley | 7.3% | 0.91%(+6.39)#43 | 0.84%(+6.45)#822 |
| 44. | Renningers | 7.3% | 0.91%(+6.35)#44 | 0.84%(+6.42)#826 |
| 45. | Slabtown | 7.2% | 0.91%(+6.31)#45 | 0.84%(+6.38)#830 |
| 46. | Milford Square | 7.1% | 0.91%(+6.17)#46 | 0.84%(+6.23)#846 |
| 47. | Pillow Borough | 6.9% | 0.91%(+5.99)#47 | 0.84%(+6.06)#882 |
| 48. | Temple | 6.8% | 0.91%(+5.90)#48 | 0.84%(+5.97)#897 |
| 49. | Creekside Borough | 6.7% | 0.91%(+5.83)#49 | 0.84%(+5.89)#915 |
| 50. | Dalton Borough | 6.7% | 0.91%(+5.75)#50 | 0.84%(+5.82)#944 |
| 51. | Mundys Corner | 6.6% | 0.91%(+5.67)#51 | 0.84%(+5.74)#958 |
| 52. | Enon Valley Borough | 6.6% | 0.91%(+5.66)#52 | 0.84%(+5.73)#961 |
| 53. | Sugar Grove Borough | 6.5% | 0.91%(+5.58)#53 | 0.84%(+5.65)#983 |
| 54. | Delta Borough | 6.4% | 0.91%(+5.52)#54 | 0.84%(+5.58)#998 |
| 55. | Burnside Borough | 6.2% | 0.91%(+5.34)#55 | 0.84%(+5.41)#1,035 |
| 56. | Branchdale | 6.1% | 0.91%(+5.16)#56 | 0.84%(+5.22)#1,087 |
| 57. | Kapp Heights | 5.9% | 0.91%(+4.98)#57 | 0.84%(+5.05)#1,132 |
| 58. | Ernest Borough | 5.9% | 0.91%(+4.98)#58 | 0.84%(+5.05)#1,135 |
| 59. | Hartstown | 5.9% | 0.91%(+4.98)#59 | 0.84%(+5.05)#1,137 |
| 60. | Robeson Extension | 5.9% | 0.91%(+4.98)#60 | 0.84%(+5.05)#1,138 |
| 61. | Edwardsville Borough | 5.8% | 0.91%(+4.93)#61 | 0.84%(+5.00)#1,149 |
| 62. | Hokendauqua | 5.8% | 0.91%(+4.90)#62 | 0.84%(+4.97)#1,158 |
| 63. | Roseto Borough | 5.8% | 0.91%(+4.90)#63 | 0.84%(+4.97)#1,159 |
| 64. | Burlington Borough | 5.8% | 0.91%(+4.89)#64 | 0.84%(+4.96)#1,168 |
| 65. | Long Branch Borough | 5.8% | 0.91%(+4.86)#65 | 0.84%(+4.93)#1,176 |
| 66. | Avella | 5.8% | 0.91%(+4.85)#66 | 0.84%(+4.91)#1,180 |
| 67. | South Temple | 5.7% | 0.91%(+4.82)#67 | 0.84%(+4.89)#1,188 |
| 68. | Barkeyville Borough | 5.6% | 0.91%(+4.74)#68 | 0.84%(+4.81)#1,217 |
| 69. | Old Orchard | 5.6% | 0.91%(+4.71)#69 | 0.84%(+4.78)#1,226 |
| 70. | Crenshaw | 5.6% | 0.91%(+4.69)#70 | 0.84%(+4.76)#1,229 |
| 71. | Vintondale Borough | 5.5% | 0.91%(+4.62)#71 | 0.84%(+4.68)#1,255 |
| 72. | Clintondale | 5.5% | 0.91%(+4.59)#72 | 0.84%(+4.66)#1,258 |
| 73. | Midland Borough | 5.4% | 0.91%(+4.54)#73 | 0.84%(+4.61)#1,274 |
| 74. | Palmer Heights | 5.4% | 0.91%(+4.48)#74 | 0.84%(+4.55)#1,293 |
| 75. | Mckeansburg | 5.3% | 0.91%(+4.43)#75 | 0.84%(+4.50)#1,316 |
| 76. | Eagleville Cdp Centre County | 5.3% | 0.91%(+4.39)#76 | 0.84%(+4.46)#1,330 |
| 77. | Claysville Borough | 5.2% | 0.91%(+4.34)#77 | 0.84%(+4.41)#1,351 |
| 78. | Benton Borough | 5.2% | 0.91%(+4.30)#78 | 0.84%(+4.37)#1,368 |
| 79. | Lake Arthur Estates | 5.2% | 0.91%(+4.30)#79 | 0.84%(+4.37)#1,374 |
| 80. | Geneva | 5.2% | 0.91%(+4.27)#80 | 0.84%(+4.34)#1,391 |
| 81. | Fredonia Borough | 5.2% | 0.91%(+4.25)#81 | 0.84%(+4.32)#1,397 |
| 82. | Harleigh | 5.1% | 0.91%(+4.24)#82 | 0.84%(+4.31)#1,401 |
| 83. | Mifflinville | 5.1% | 0.91%(+4.18)#83 | 0.84%(+4.25)#1,426 |
| 84. | Red Lion Borough | 5.1% | 0.91%(+4.15)#84 | 0.84%(+4.22)#1,440 |
| 85. | Julian | 5.0% | 0.91%(+4.09)#85 | 0.84%(+4.16)#1,466 |
| 86. | Port Royal Borough | 5.0% | 0.91%(+4.08)#86 | 0.84%(+4.15)#1,475 |
| 87. | Atlasburg | 5.0% | 0.91%(+4.05)#87 | 0.84%(+4.11)#1,491 |
| 88. | Bridgewater Borough | 4.9% | 0.91%(+4.02)#88 | 0.84%(+4.09)#1,500 |
| 89. | Mainville | 4.9% | 0.91%(+4.01)#89 | 0.84%(+4.08)#1,503 |
| 90. | Mount Eagle | 4.9% | 0.91%(+4.01)#90 | 0.84%(+4.08)#1,504 |
| 91. | Speers Borough | 4.8% | 0.91%(+3.92)#91 | 0.84%(+3.99)#1,543 |
| 92. | Austin Borough | 4.8% | 0.91%(+3.92)#92 | 0.84%(+3.99)#1,544 |
| 93. | Swartzville | 4.8% | 0.91%(+3.91)#93 | 0.84%(+3.98)#1,551 |
| 94. | Fernville | 4.8% | 0.91%(+3.88)#94 | 0.84%(+3.95)#1,557 |
| 95. | Spring City Borough | 4.8% | 0.91%(+3.88)#95 | 0.84%(+3.95)#1,558 |
| 96. | Houston Borough | 4.8% | 0.91%(+3.87)#96 | 0.84%(+3.94)#1,562 |
| 97. | Timblin Borough | 4.8% | 0.91%(+3.86)#97 | 0.84%(+3.92)#1,574 |
| 98. | Port Clinton Borough | 4.7% | 0.91%(+3.82)#98 | 0.84%(+3.89)#1,591 |
| 99. | Wilmerding Borough | 4.6% | 0.91%(+3.69)#99 | 0.84%(+3.76)#1,665 |
| 100. | Rennerdale | 4.6% | 0.91%(+3.65)#100 | 0.84%(+3.72)#1,688 |
Common Questions
What are the Top 10 Cities with the Highest Percentage of Population Employed in Utilities in Pennsylvania?
Top 10 Cities with the Highest Percentage of Population Employed in Utilities in Pennsylvania are:
#1
25.2%
#2
22.8%
#3
22.7%
#4
17.8%
#5
17.6%
#6
14.9%
#7
14.5%
#8
14.3%
#9
14.0%
#10
13.9%
What city has the Highest Percentage of Population Employed in Utilities in Pennsylvania?
Nemacolin has the Highest Percentage of Population Employed in Utilities in Pennsylvania with 25.2%.
What is the Percentage of Population Employed in Utilities in the State of Pennsylvania?
Percentage of Population Employed in Utilities in Pennsylvania is 0.91%.
What is the Percentage of Population Employed in Utilities in the United States?
Percentage of Population Employed in Utilities in the United States is 0.84%.