Cities with the Highest Percentage of Immigrants from Ecuador in Pennsylvania
RELATED REPORTS & OPTIONS
Ecuador
Pennsylvania
Compare Cities
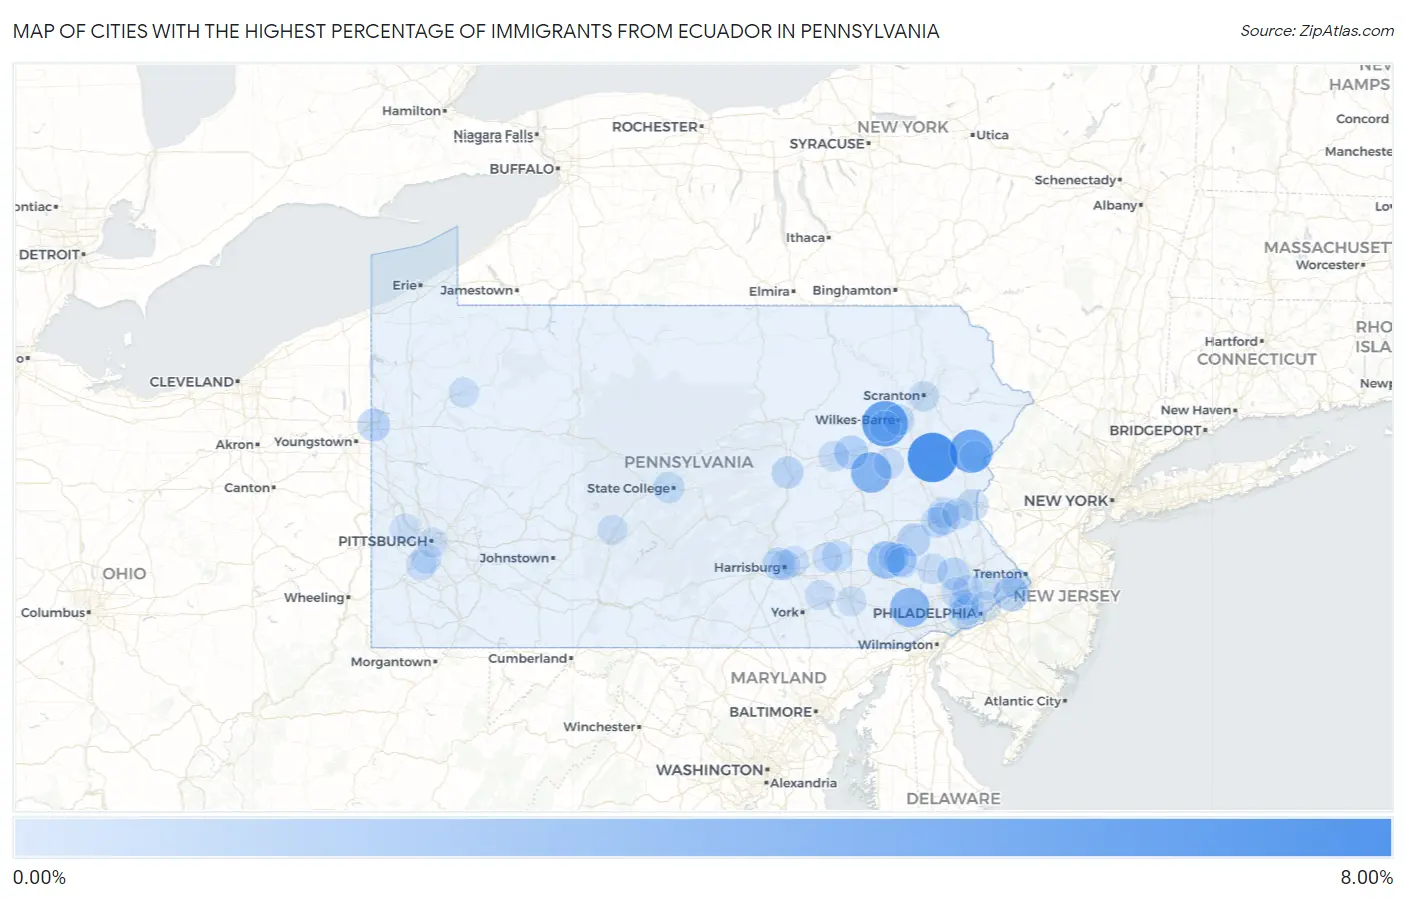
Map of Cities with the Highest Percentage of Immigrants from Ecuador in Pennsylvania
0.00%
8.00%
Cities with the Highest Percentage of Immigrants from Ecuador in Pennsylvania
| City | Ecuador | vs State | vs National | |
| 1. | Towamensing Trails | 7.18% | 0.077%(+7.11)#-1 | 0.15%(+7.04)#0 |
| 2. | Le Raysville Borough | 6.92% | 0.077%(+6.84)#0 | 0.15%(+6.78)#1 |
| 3. | West Nanticoke | 5.68% | 0.077%(+5.60)#35 | 0.15%(+5.54)#3,951 |
| 4. | Penn Estates | 4.92% | 0.077%(+4.84)#36 | 0.15%(+4.77)#3,952 |
| 5. | Sheppton | 3.77% | 0.077%(+3.70)#207 | 0.15%(+3.63)#9,942 |
| 6. | Caln | 3.35% | 0.077%(+3.27)#208 | 0.15%(+3.20)#9,943 |
| 7. | Lincoln Park | 2.68% | 0.077%(+2.60)#209 | 0.15%(+2.53)#9,944 |
| 8. | Mckinley | 1.80% | 0.077%(+1.72)#210 | 0.15%(+1.65)#9,945 |
| 9. | Croydon | 1.69% | 0.077%(+1.61)#301 | 0.15%(+1.55)#12,192 |
| 10. | Stroudsburg Borough | 1.58% | 0.077%(+1.50)#302 | 0.15%(+1.43)#12,193 |
| 11. | Mifflinville | 1.33% | 0.077%(+1.25)#303 | 0.15%(+1.18)#12,194 |
| 12. | Hayti | 1.26% | 0.077%(+1.18)#304 | 0.15%(+1.11)#12,195 |
| 13. | New Jerusalem | 1.11% | 0.077%(+1.03)#305 | 0.15%(+0.966)#12,196 |
| 14. | Great Bend Borough | 1.04% | 0.077%(+0.963)#306 | 0.15%(+0.895)#12,197 |
| 15. | Allentown | 0.97% | 0.077%(+0.890)#307 | 0.15%(+0.822)#12,198 |
| 16. | Milford Borough | 0.94% | 0.077%(+0.866)#308 | 0.15%(+0.798)#12,199 |
| 17. | Farrell | 0.93% | 0.077%(+0.857)#309 | 0.15%(+0.789)#12,200 |
| 18. | Enola | 0.89% | 0.077%(+0.808)#310 | 0.15%(+0.740)#12,201 |
| 19. | Reiffton | 0.86% | 0.077%(+0.781)#311 | 0.15%(+0.713)#12,202 |
| 20. | Skippack | 0.80% | 0.077%(+0.727)#312 | 0.15%(+0.659)#12,203 |
| 21. | Shiremanstown Borough | 0.80% | 0.077%(+0.722)#313 | 0.15%(+0.654)#12,204 |
| 22. | Lansdowne Borough | 0.77% | 0.077%(+0.692)#314 | 0.15%(+0.624)#12,205 |
| 23. | Tarentum Borough | 0.74% | 0.077%(+0.662)#315 | 0.15%(+0.594)#12,206 |
| 24. | North Catasauqua Borough | 0.71% | 0.077%(+0.633)#316 | 0.15%(+0.565)#12,207 |
| 25. | Winfield | 0.71% | 0.077%(+0.629)#317 | 0.15%(+0.561)#12,208 |
| 26. | West Easton Borough | 0.70% | 0.077%(+0.621)#318 | 0.15%(+0.553)#12,209 |
| 27. | East Stroudsburg Borough | 0.66% | 0.077%(+0.586)#319 | 0.15%(+0.518)#12,210 |
| 28. | Easton | 0.63% | 0.077%(+0.556)#320 | 0.15%(+0.488)#12,211 |
| 29. | Pennsbury Village Borough | 0.63% | 0.077%(+0.555)#321 | 0.15%(+0.487)#12,212 |
| 30. | Beaver Meadows Borough | 0.62% | 0.077%(+0.547)#322 | 0.15%(+0.479)#12,213 |
| 31. | Mcadoo Borough | 0.62% | 0.077%(+0.542)#323 | 0.15%(+0.474)#12,214 |
| 32. | Roaring Spring Borough | 0.56% | 0.077%(+0.480)#324 | 0.15%(+0.412)#12,215 |
| 33. | Freemansburg Borough | 0.52% | 0.077%(+0.447)#325 | 0.15%(+0.379)#12,216 |
| 34. | Catawissa Borough | 0.50% | 0.077%(+0.427)#326 | 0.15%(+0.359)#12,217 |
| 35. | Girard Borough | 0.50% | 0.077%(+0.424)#327 | 0.15%(+0.356)#12,218 |
| 36. | Penn Wynne | 0.46% | 0.077%(+0.380)#328 | 0.15%(+0.312)#12,219 |
| 37. | Hanover Borough | 0.44% | 0.077%(+0.361)#329 | 0.15%(+0.293)#12,220 |
| 38. | Park Forest Village | 0.44% | 0.077%(+0.358)#330 | 0.15%(+0.290)#12,221 |
| 39. | Robesonia Borough | 0.42% | 0.077%(+0.342)#331 | 0.15%(+0.274)#12,222 |
| 40. | Fullerton | 0.40% | 0.077%(+0.326)#332 | 0.15%(+0.258)#12,223 |
| 41. | West Reading Borough | 0.40% | 0.077%(+0.320)#333 | 0.15%(+0.252)#12,224 |
| 42. | Gallitzin Borough | 0.39% | 0.077%(+0.315)#334 | 0.15%(+0.247)#12,225 |
| 43. | Arlington Heights | 0.39% | 0.077%(+0.311)#335 | 0.15%(+0.243)#12,226 |
| 44. | Lebanon | 0.39% | 0.077%(+0.309)#336 | 0.15%(+0.241)#12,227 |
| 45. | Drexel Hill | 0.38% | 0.077%(+0.306)#337 | 0.15%(+0.238)#12,228 |
| 46. | Wilkes Barre | 0.37% | 0.077%(+0.294)#338 | 0.15%(+0.226)#12,229 |
| 47. | Dormont Borough | 0.33% | 0.077%(+0.252)#339 | 0.15%(+0.184)#12,230 |
| 48. | Plymouth Borough | 0.33% | 0.077%(+0.252)#340 | 0.15%(+0.184)#12,231 |
| 49. | Wescosville | 0.32% | 0.077%(+0.246)#341 | 0.15%(+0.178)#12,232 |
| 50. | Lorane | 0.32% | 0.077%(+0.243)#342 | 0.15%(+0.175)#12,233 |
| 51. | Coplay Borough | 0.29% | 0.077%(+0.218)#343 | 0.15%(+0.150)#12,234 |
| 52. | Bethlehem | 0.29% | 0.077%(+0.211)#344 | 0.15%(+0.143)#12,235 |
| 53. | Pen Argyl Borough | 0.28% | 0.077%(+0.208)#345 | 0.15%(+0.140)#12,236 |
| 54. | Haverford College | 0.27% | 0.077%(+0.196)#346 | 0.15%(+0.128)#12,237 |
| 55. | Royersford Borough | 0.24% | 0.077%(+0.167)#347 | 0.15%(+0.099)#12,238 |
| 56. | West Hazleton Borough | 0.23% | 0.077%(+0.157)#348 | 0.15%(+0.089)#12,239 |
| 57. | Reading | 0.23% | 0.077%(+0.156)#349 | 0.15%(+0.088)#12,240 |
| 58. | Spring Grove Borough | 0.23% | 0.077%(+0.156)#350 | 0.15%(+0.088)#12,241 |
| 59. | Pottstown Borough | 0.22% | 0.077%(+0.145)#351 | 0.15%(+0.077)#12,242 |
| 60. | Sellersville Borough | 0.22% | 0.077%(+0.143)#352 | 0.15%(+0.075)#12,243 |
| 61. | Yeadon Borough | 0.22% | 0.077%(+0.139)#353 | 0.15%(+0.071)#12,244 |
| 62. | Sanatoga | 0.22% | 0.077%(+0.138)#354 | 0.15%(+0.070)#12,245 |
| 63. | Bloomsburg | 0.21% | 0.077%(+0.133)#355 | 0.15%(+0.065)#12,246 |
| 64. | Hazleton | 0.20% | 0.077%(+0.125)#356 | 0.15%(+0.057)#12,247 |
| 65. | Scranton | 0.20% | 0.077%(+0.124)#357 | 0.15%(+0.056)#12,248 |
| 66. | Evans City Borough | 0.20% | 0.077%(+0.123)#358 | 0.15%(+0.055)#12,249 |
| 67. | Nanticoke | 0.20% | 0.077%(+0.121)#359 | 0.15%(+0.053)#12,250 |
| 68. | Mcmurray | 0.19% | 0.077%(+0.115)#360 | 0.15%(+0.047)#12,251 |
| 69. | New Cumberland Borough | 0.19% | 0.077%(+0.109)#361 | 0.15%(+0.041)#12,252 |
| 70. | Morrisville Borough | 0.17% | 0.077%(+0.098)#362 | 0.15%(+0.030)#12,253 |
| 71. | King Of Prussia | 0.17% | 0.077%(+0.095)#363 | 0.15%(+0.027)#12,254 |
| 72. | Rose Valley Borough | 0.17% | 0.077%(+0.091)#364 | 0.15%(+0.023)#12,255 |
| 73. | Colonial Park | 0.17% | 0.077%(+0.089)#365 | 0.15%(+0.021)#12,256 |
| 74. | Ambler Borough | 0.15% | 0.077%(+0.070)#366 | 0.15%(+0.002)#12,257 |
| 75. | Nottingham | 0.14% | 0.077%(+0.060)#367 | 0.15%(-0.008)#12,258 |
| 76. | Villanova | 0.14% | 0.077%(+0.059)#368 | 0.15%(-0.009)#12,259 |
| 77. | Emmaus Borough | 0.13% | 0.077%(+0.052)#369 | 0.15%(-0.016)#12,260 |
| 78. | Plymouth Meeting | 0.12% | 0.077%(+0.041)#370 | 0.15%(-0.027)#12,261 |
| 79. | Harrisburg | 0.12% | 0.077%(+0.039)#371 | 0.15%(-0.029)#12,262 |
| 80. | Philadelphia | 0.11% | 0.077%(+0.034)#372 | 0.15%(-0.034)#12,263 |
| 81. | Annville | 0.10% | 0.077%(+0.026)#373 | 0.15%(-0.042)#12,264 |
| 82. | Clarks Summit Borough | 0.098% | 0.077%(+0.021)#374 | 0.15%(-0.047)#12,265 |
| 83. | Souderton Borough | 0.098% | 0.077%(+0.020)#375 | 0.15%(-0.048)#12,266 |
| 84. | Kennett Square Borough | 0.084% | 0.077%(+0.006)#376 | 0.15%(-0.062)#12,267 |
| 85. | Bristol Borough | 0.081% | 0.077%(+0.004)#377 | 0.15%(-0.064)#12,268 |
| 86. | Norristown Borough | 0.076% | 0.077%(-0.002)#378 | 0.15%(-0.070)#12,269 |
| 87. | Maytown | 0.074% | 0.077%(-0.004)#379 | 0.15%(-0.072)#12,270 |
| 88. | Chambersburg Borough | 0.068% | 0.077%(-0.009)#380 | 0.15%(-0.077)#12,271 |
| 89. | Phoenixville Borough | 0.064% | 0.077%(-0.013)#381 | 0.15%(-0.081)#12,272 |
| 90. | Carnot Moon | 0.060% | 0.077%(-0.017)#382 | 0.15%(-0.085)#12,273 |
| 91. | Willow Grove | 0.051% | 0.077%(-0.026)#383 | 0.15%(-0.094)#12,274 |
| 92. | Levittown | 0.049% | 0.077%(-0.028)#384 | 0.15%(-0.096)#12,275 |
| 93. | Bethel Park | 0.045% | 0.077%(-0.032)#385 | 0.15%(-0.100)#12,392 |
| 94. | Lansdale Borough | 0.027% | 0.077%(-0.051)#386 | 0.15%(-0.119)#12,393 |
| 95. | Pittsburgh | 0.023% | 0.077%(-0.054)#387 | 0.15%(-0.122)#12,394 |
| 96. | Oil City | 0.021% | 0.077%(-0.056)#388 | 0.15%(-0.124)#12,395 |
| 97. | Altoona | 0.016% | 0.077%(-0.061)#389 | 0.15%(-0.129)#12,396 |
| 98. | Lancaster | 0.014% | 0.077%(-0.063)#390 | 0.15%(-0.131)#12,397 |
Common Questions
What are the Top 10 Cities with the Highest Percentage of Immigrants from Ecuador in Pennsylvania?
Top 10 Cities with the Highest Percentage of Immigrants from Ecuador in Pennsylvania are:
#1
7.18%
#2
5.68%
#3
4.92%
#4
3.77%
#5
3.35%
#6
2.68%
#7
1.69%
#8
1.33%
#9
1.11%
#10
0.97%
What city has the Highest Percentage of Immigrants from Ecuador in Pennsylvania?
Towamensing Trails has the Highest Percentage of Immigrants from Ecuador in Pennsylvania with 7.18%.
What is the Percentage of Immigrants from Ecuador in the State of Pennsylvania?
Percentage of Immigrants from Ecuador in Pennsylvania is 0.077%.
What is the Percentage of Immigrants from Ecuador in the United States?
Percentage of Immigrants from Ecuador in the United States is 0.15%.