Lincoln University, PA Map & Demographics
Lincoln University Map
Lincoln University Overview
$25,411
PER CAPITA INCOME
18.7%
WAGE / INCOME GAP [ % ]
81.3¢/ $1
WAGE / INCOME GAP [ $ ]
1,984
TOTAL POPULATION
780
MALE POPULATION
1,204
FEMALE POPULATION
64.78
MALES / 100 FEMALES
154.36
FEMALES / 100 MALES
19.7
MEDIAN AGE
1,093
LABOR FORCE [ PEOPLE ]
55.1%
PERCENT IN LABOR FORCE
7.9%
UNEMPLOYMENT RATE
Lincoln University Zip Codes
Income in Lincoln University
Income Overview in Lincoln University
| Characteristic | Number | Measure |
| Per Capita Income | 1,984 | $25,411 |
| Median Family Income | 0 | $0 |
| Mean Family Income | 0 | $0 |
| Median Household Income | 0 | $0 |
| Mean Household Income | 0 | $0 |
| Income Deficit | 0 | $0 |
| Wage / Income Gap (%) | 1,984 | 18.74% |
| Wage / Income Gap ($) | 1,984 | 81.26¢ per $1 |
| Gini / Inequality Index | 1,984 | 0.00 |
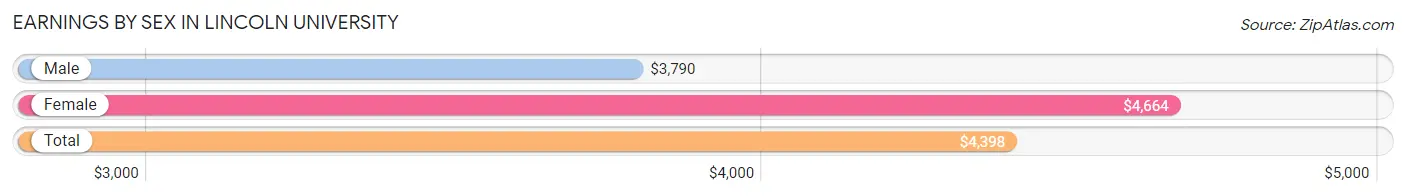
Earnings by Sex in Lincoln University
Average Earnings in Lincoln University are $4,398, $3,790 for men and $4,664 for women, a difference of 18.7%.
| Sex | Number | Average Earnings |
| Male | 686 (39.3%) | $3,790 |
| Female | 1,058 (60.7%) | $4,664 |
| Total | 1,744 (100.0%) | $4,398 |
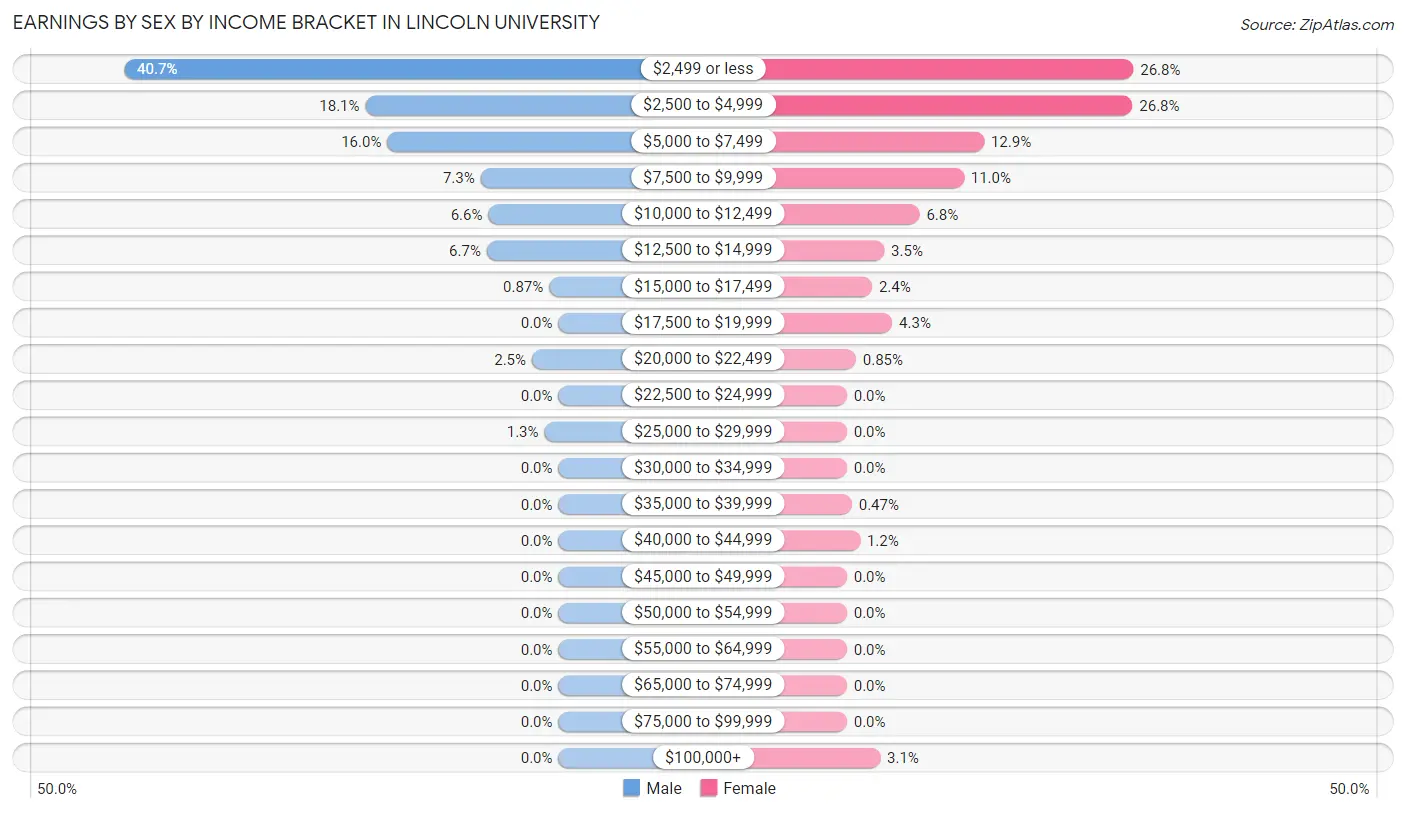
Earnings by Sex by Income Bracket in Lincoln University
The most common earnings brackets in Lincoln University are $2,499 or less for men (279 | 40.7%) and $2,499 or less for women (284 | 26.8%).
| Income | Male | Female |
| $2,499 or less | 279 (40.7%) | 284 (26.8%) |
| $2,500 to $4,999 | 124 (18.1%) | 283 (26.8%) |
| $5,000 to $7,499 | 110 (16.0%) | 136 (12.9%) |
| $7,500 to $9,999 | 50 (7.3%) | 116 (11.0%) |
| $10,000 to $12,499 | 45 (6.6%) | 72 (6.8%) |
| $12,500 to $14,999 | 46 (6.7%) | 37 (3.5%) |
| $15,000 to $17,499 | 6 (0.9%) | 25 (2.4%) |
| $17,500 to $19,999 | 0 (0.0%) | 45 (4.3%) |
| $20,000 to $22,499 | 17 (2.5%) | 9 (0.9%) |
| $22,500 to $24,999 | 0 (0.0%) | 0 (0.0%) |
| $25,000 to $29,999 | 9 (1.3%) | 0 (0.0%) |
| $30,000 to $34,999 | 0 (0.0%) | 0 (0.0%) |
| $35,000 to $39,999 | 0 (0.0%) | 5 (0.5%) |
| $40,000 to $44,999 | 0 (0.0%) | 13 (1.2%) |
| $45,000 to $49,999 | 0 (0.0%) | 0 (0.0%) |
| $50,000 to $54,999 | 0 (0.0%) | 0 (0.0%) |
| $55,000 to $64,999 | 0 (0.0%) | 0 (0.0%) |
| $65,000 to $74,999 | 0 (0.0%) | 0 (0.0%) |
| $75,000 to $99,999 | 0 (0.0%) | 0 (0.0%) |
| $100,000+ | 0 (0.0%) | 33 (3.1%) |
| Total | 686 (100.0%) | 1,058 (100.0%) |
Earnings by Sex by Educational Attainment in Lincoln University
| Educational Attainment | Male Income | Female Income |
| Less than High School | - | - |
| High School Diploma | - | - |
| College or Associate's Degree | - | - |
| Bachelor's Degree | - | - |
| Graduate Degree | - | - |
| Total | - | - |
Family Income in Lincoln University
Family Income Brackets in Lincoln University
| Income Bracket | # Families | % Families |
| Less than $10,000 | 0 | 0.0% |
| $10,000 to $14,999 | 0 | 0.0% |
| $15,000 to $24,999 | 0 | 0.0% |
| $25,000 to $34,999 | 0 | 0.0% |
| $35,000 to $49,999 | 0 | 0.0% |
| $50,000 to $74,999 | 0 | 0.0% |
| $75,000 to $99,999 | 0 | 0.0% |
| $100,000 to $149,999 | 0 | 0.0% |
| $150,000 to $199,999 | 0 | 0.0% |
| $200,000+ | 0 | 0.0% |
Family Income by Famaliy Size in Lincoln University
| Income Bracket | # Families | Median Income |
| 2-Person Families | 0 (0.0%) | $0 |
| 3-Person Families | 0 (0.0%) | $0 |
| 4-Person Families | 0 (0.0%) | $0 |
| 5-Person Families | 0 (0.0%) | $0 |
| 6-Person Families | 0 (0.0%) | $0 |
| 7+ Person Families | 0 (0.0%) | $0 |
| Total | 0 (0.0%) | $0 |
Family Income by Number of Earners in Lincoln University
| Number of Earners | # Families | Median Income |
| No Earners | 0 (0.0%) | $0 |
| 1 Earner | 0 (0.0%) | $0 |
| 2 Earners | 0 (0.0%) | $0 |
| 3+ Earners | 0 (0.0%) | $0 |
| Total | 0 (0.0%) | $0 |
Household Income in Lincoln University
Household Income Brackets in Lincoln University
| Income Bracket | # Households | % Households |
| Less than $10,000 | 0 | 0.0% |
| $10,000 to $14,999 | 0 | 0.0% |
| $15,000 to $24,999 | 0 | 0.0% |
| $25,000 to $34,999 | 0 | 0.0% |
| $35,000 to $49,999 | 0 | 0.0% |
| $50,000 to $74,999 | 0 | 0.0% |
| $75,000 to $99,999 | 0 | 0.0% |
| $100,000 to $149,999 | 0 | 0.0% |
| $150,000 to $199,999 | 0 | 0.0% |
| $200,000+ | 0 | 0.0% |
Household Income by Householder Age in Lincoln University
| Income Bracket | # Households | Median Income |
| 15 to 24 Years | 0 (0.0%) | $0 |
| 25 to 44 Years | 0 (0.0%) | $0 |
| 45 to 64 Years | 0 (0.0%) | $0 |
| 65+ Years | 0 (0.0%) | $0 |
| Total | 0 (0.0%) | $0 |
Poverty in Lincoln University
Income Below Poverty by Sex and Age in Lincoln University
| Age Bracket | Male | Female |
| Under 5 Years | 0 (0.0%) | 0 (0.0%) |
| 5 Years | 0 (0.0%) | 0 (0.0%) |
| 6 to 11 Years | 0 (0.0%) | 0 (0.0%) |
| 12 to 14 Years | 0 (0.0%) | 0 (0.0%) |
| 15 Years | 0 (0.0%) | 0 (0.0%) |
| 16 and 17 Years | 0 (0.0%) | 0 (0.0%) |
| 18 to 24 Years | 0 (0.0%) | 0 (0.0%) |
| 25 to 34 Years | 0 (0.0%) | 0 (0.0%) |
| 35 to 44 Years | 0 (0.0%) | 0 (0.0%) |
| 45 to 54 Years | 0 (0.0%) | 0 (0.0%) |
| 55 to 64 Years | 0 (0.0%) | 0 (0.0%) |
| 65 to 74 Years | 0 (0.0%) | 0 (0.0%) |
| 75 Years and over | 0 (0.0%) | 0 (0.0%) |
| Total | 0 (0.0%) | 0 (0.0%) |
Income Above Poverty by Sex and Age in Lincoln University
| Age Bracket | Male | Female |
| Under 5 Years | 0 (0.0%) | 0 (0.0%) |
| 5 Years | 0 (0.0%) | 0 (0.0%) |
| 6 to 11 Years | 0 (0.0%) | 0 (0.0%) |
| 12 to 14 Years | 0 (0.0%) | 0 (0.0%) |
| 15 Years | 0 (0.0%) | 0 (0.0%) |
| 16 and 17 Years | 0 (0.0%) | 0 (0.0%) |
| 18 to 24 Years | 0 (0.0%) | 0 (0.0%) |
| 25 to 34 Years | 0 (0.0%) | 0 (0.0%) |
| 35 to 44 Years | 0 (0.0%) | 0 (0.0%) |
| 45 to 54 Years | 0 (0.0%) | 0 (0.0%) |
| 55 to 64 Years | 0 (0.0%) | 0 (0.0%) |
| 65 to 74 Years | 0 (0.0%) | 0 (0.0%) |
| 75 Years and over | 0 (0.0%) | 0 (0.0%) |
| Total | 0 (0.0%) | 0 (0.0%) |
Income Below Poverty Among Married-Couple Families in Lincoln University
| Children | Above Poverty | Below Poverty |
| No Children | 0 (0.0%) | 0 (0.0%) |
| 1 or 2 Children | 0 (0.0%) | 0 (0.0%) |
| 3 or 4 Children | 0 (0.0%) | 0 (0.0%) |
| 5 or more Children | 0 (0.0%) | 0 (0.0%) |
| Total | 0 (0.0%) | 0 (0.0%) |
Income Below Poverty Among Single-Parent Households in Lincoln University
| Children | Single Father | Single Mother |
| No Children | 0 (0.0%) | 0 (0.0%) |
| 1 or 2 Children | 0 (0.0%) | 0 (0.0%) |
| 3 or 4 Children | 0 (0.0%) | 0 (0.0%) |
| 5 or more Children | 0 (0.0%) | 0 (0.0%) |
| Total | 0 (0.0%) | 0 (0.0%) |
Income Below Poverty Among Married-Couple vs Single-Parent Households in Lincoln University
| Children | Married-Couple Families | Single-Parent Households |
| No Children | 0 (0.0%) | 0 (0.0%) |
| 1 or 2 Children | 0 (0.0%) | 0 (0.0%) |
| 3 or 4 Children | 0 (0.0%) | 0 (0.0%) |
| 5 or more Children | 0 (0.0%) | 0 (0.0%) |
| Total | 0 (0.0%) | 0 (0.0%) |
Race in Lincoln University
The most populous races in Lincoln University are Black / African American (939 | 47.3%), White / Caucasian (769 | 38.8%), and Two or more Races (182 | 9.2%).
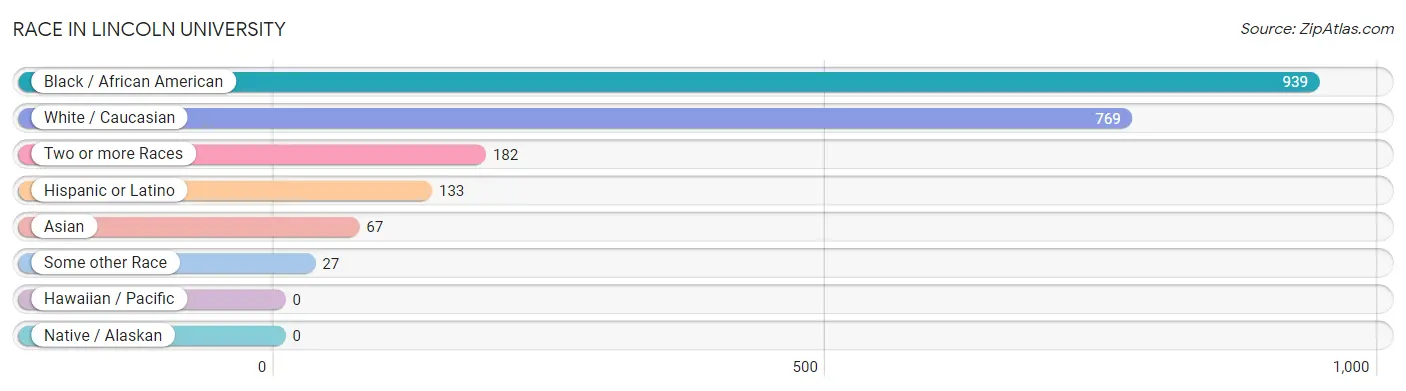
| Race | # Population | % Population |
| Asian | 67 | 3.4% |
| Black / African American | 939 | 47.3% |
| Hawaiian / Pacific | 0 | 0.0% |
| Hispanic or Latino | 133 | 6.7% |
| Native / Alaskan | 0 | 0.0% |
| White / Caucasian | 769 | 38.8% |
| Two or more Races | 182 | 9.2% |
| Some other Race | 27 | 1.4% |
| Total | 1,984 | 100.0% |
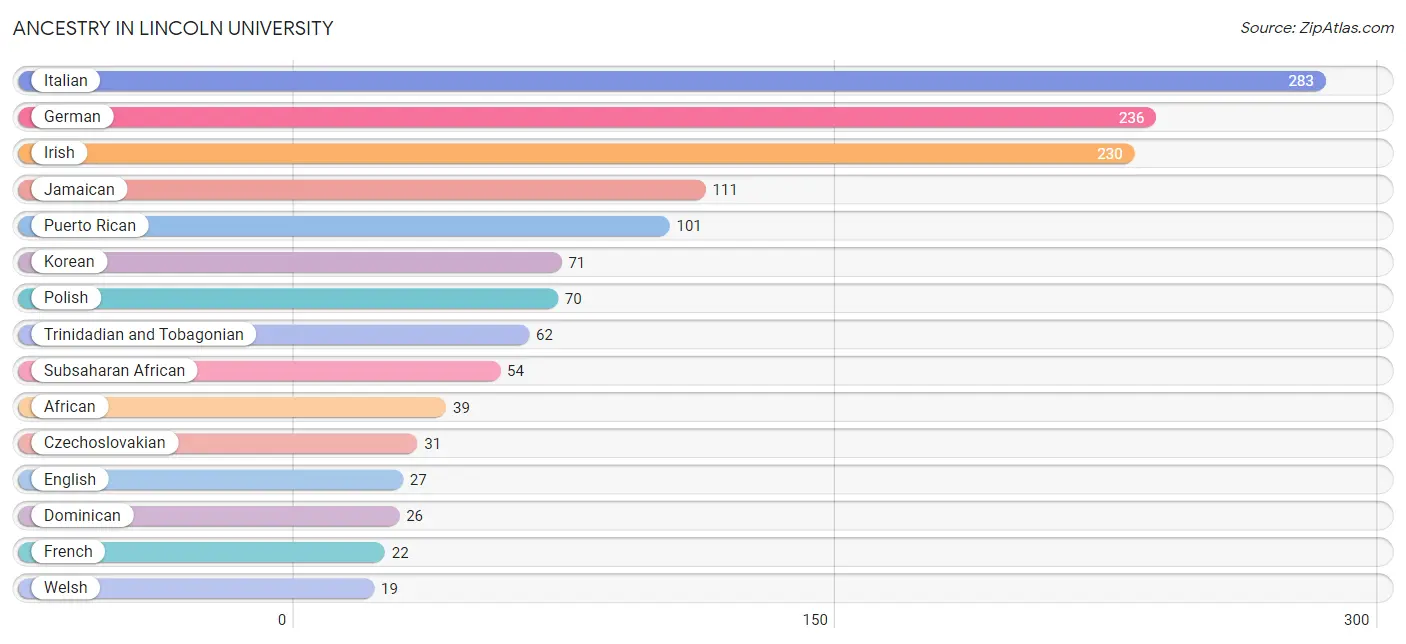
Ancestry in Lincoln University
The most populous ancestries reported in Lincoln University are Italian (283 | 14.3%), German (236 | 11.9%), Irish (230 | 11.6%), Jamaican (111 | 5.6%), and Puerto Rican (101 | 5.1%), together accounting for 48.4% of all Lincoln University residents.
| Ancestry | # Population | % Population |
| African | 39 | 2.0% |
| American | 18 | 0.9% |
| Apache | 6 | 0.3% |
| Armenian | 6 | 0.3% |
| Bahamian | 4 | 0.2% |
| Barbadian | 9 | 0.4% |
| Bhutanese | 4 | 0.2% |
| Blackfeet | 7 | 0.4% |
| British West Indian | 11 | 0.5% |
| Cherokee | 7 | 0.4% |
| Croatian | 8 | 0.4% |
| Czech | 8 | 0.4% |
| Czechoslovakian | 31 | 1.6% |
| Dominican | 26 | 1.3% |
| Dutch | 15 | 0.8% |
| English | 27 | 1.4% |
| European | 6 | 0.3% |
| French | 22 | 1.1% |
| French American Indian | 6 | 0.3% |
| French Canadian | 10 | 0.5% |
| German | 236 | 11.9% |
| Ghanaian | 4 | 0.2% |
| Greek | 9 | 0.4% |
| Haitian | 18 | 0.9% |
| Irish | 230 | 11.6% |
| Italian | 283 | 14.3% |
| Jamaican | 111 | 5.6% |
| Korean | 71 | 3.6% |
| Mexican | 6 | 0.3% |
| Native Hawaiian | 7 | 0.4% |
| Nigerian | 11 | 0.5% |
| Polish | 70 | 3.5% |
| Portuguese | 8 | 0.4% |
| Puerto Rican | 101 | 5.1% |
| Russian | 15 | 0.8% |
| Scotch-Irish | 6 | 0.3% |
| Senegalese | 4 | 0.2% |
| Slovak | 3 | 0.2% |
| Sri Lankan | 14 | 0.7% |
| Subsaharan African | 54 | 2.7% |
| Thai | 8 | 0.4% |
| Trinidadian and Tobagonian | 62 | 3.1% |
| Welsh | 19 | 1.0% |
| West Indian | 4 | 0.2% | View All 44 Rows |
Immigrants in Lincoln University
The most numerous immigrant groups reported in Lincoln University came from Africa (26 | 1.3%), Caribbean (19 | 1.0%), Latin America (19 | 1.0%), Western Africa (17 | 0.9%), and Dominican Republic (11 | 0.5%), together accounting for 4.6% of all Lincoln University residents.

| Immigration Origin | # Population | % Population |
| Africa | 26 | 1.3% |
| Asia | 8 | 0.4% |
| Bahamas | 4 | 0.2% |
| Canada | 8 | 0.4% |
| Caribbean | 19 | 1.0% |
| Dominican Republic | 11 | 0.5% |
| Ghana | 6 | 0.3% |
| India | 8 | 0.4% |
| Jamaica | 4 | 0.2% |
| Latin America | 19 | 1.0% |
| Nigeria | 11 | 0.5% |
| South Central Asia | 8 | 0.4% |
| Western Africa | 17 | 0.9% | View All 13 Rows |
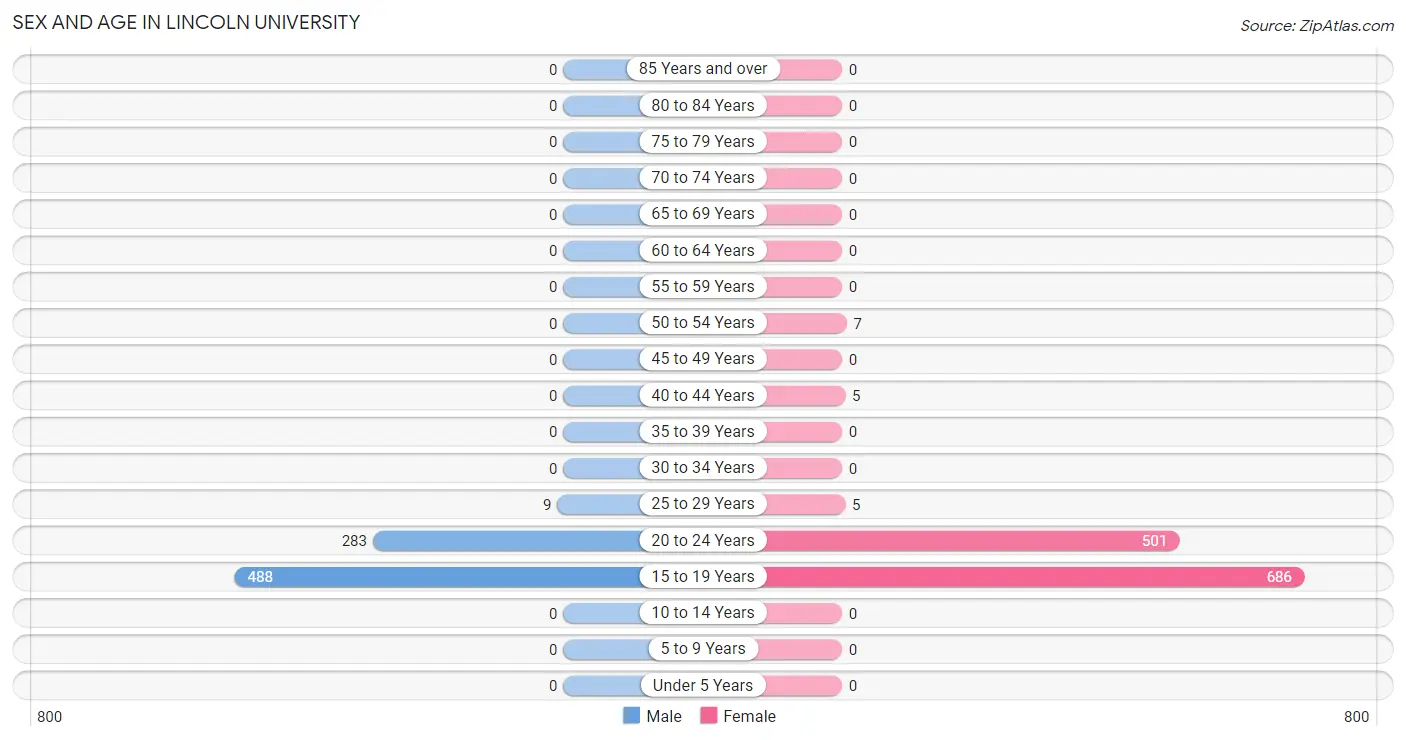
Sex and Age in Lincoln University
Sex and Age in Lincoln University
The most populous age groups in Lincoln University are 15 to 19 Years (488 | 62.6%) for men and 15 to 19 Years (686 | 57.0%) for women.
| Age Bracket | Male | Female |
| Under 5 Years | 0 (0.0%) | 0 (0.0%) |
| 5 to 9 Years | 0 (0.0%) | 0 (0.0%) |
| 10 to 14 Years | 0 (0.0%) | 0 (0.0%) |
| 15 to 19 Years | 488 (62.6%) | 686 (57.0%) |
| 20 to 24 Years | 283 (36.3%) | 501 (41.6%) |
| 25 to 29 Years | 9 (1.1%) | 5 (0.4%) |
| 30 to 34 Years | 0 (0.0%) | 0 (0.0%) |
| 35 to 39 Years | 0 (0.0%) | 0 (0.0%) |
| 40 to 44 Years | 0 (0.0%) | 5 (0.4%) |
| 45 to 49 Years | 0 (0.0%) | 0 (0.0%) |
| 50 to 54 Years | 0 (0.0%) | 7 (0.6%) |
| 55 to 59 Years | 0 (0.0%) | 0 (0.0%) |
| 60 to 64 Years | 0 (0.0%) | 0 (0.0%) |
| 65 to 69 Years | 0 (0.0%) | 0 (0.0%) |
| 70 to 74 Years | 0 (0.0%) | 0 (0.0%) |
| 75 to 79 Years | 0 (0.0%) | 0 (0.0%) |
| 80 to 84 Years | 0 (0.0%) | 0 (0.0%) |
| 85 Years and over | 0 (0.0%) | 0 (0.0%) |
| Total | 780 (100.0%) | 1,204 (100.0%) |
Families and Households in Lincoln University
Median Family Size in Lincoln University
| Family Type | # Families | Family Size |
| Married-Couple | 0 (0.0%) | - |
| Single Male/Father | 0 (0.0%) | - |
| Single Female/Mother | 0 (0.0%) | - |
| Total Families | 0 (0.0%) | - |
Median Household Size in Lincoln University
| Household Type | # Households | Household Size |
| Married-Couple | 0 (0.0%) | - |
| Single Male/Father | 0 (0.0%) | - |
| Single Female/Mother | 0 (0.0%) | - |
| Non-family | 0 (0.0%) | - |
| Total Households | 0 (0.0%) | - |
Household Size by Marriage Status in Lincoln University
| Household Size | Family Households | Nonfamily Households |
| 1-Person Households | - | 0 (0.0%) |
| 2-Person Households | 0 (0.0%) | 0 (0.0%) |
| 3-Person Households | 0 (0.0%) | 0 (0.0%) |
| 4-Person Households | 0 (0.0%) | 0 (0.0%) |
| 5-Person Households | 0 (0.0%) | 0 (0.0%) |
| 6-Person Households | 0 (0.0%) | 0 (0.0%) |
| 7+ Person Households | 0 (0.0%) | 0 (0.0%) |
| Total | 0 (0.0%) | 0 (0.0%) |
Female Fertility in Lincoln University
Fertility by Age in Lincoln University
| Age Bracket | Women with Births | Births / 1,000 Women |
| 15 to 19 years | 0 (0.0%) | 0.0 |
| 20 to 34 years | 0 (0.0%) | 0.0 |
| 35 to 50 years | 0 (0.0%) | 0.0 |
| Total | 0 (0.0%) | 0.0 |
Fertility by Age by Marriage Status in Lincoln University
| Age Bracket | Married | Unmarried |
| 15 to 19 years | 0 (0.0%) | 0 (0.0%) |
| 20 to 34 years | 0 (0.0%) | 0 (0.0%) |
| 35 to 50 years | 0 (0.0%) | 0 (0.0%) |
| Total | 0 (0.0%) | 0 (0.0%) |
Fertility by Education in Lincoln University
| Educational Attainment | Women with Births | Births / 1,000 Women |
| Less than High School | 0 (0.0%) | 0.0 |
| High School Diploma | 0 (0.0%) | 0.0 |
| College or Associate's Degree | 0 (0.0%) | 0.0 |
| Bachelor's Degree | 0 (0.0%) | 0.0 |
| Graduate Degree | 0 (0.0%) | 0.0 |
| Total | 0 (0.0%) | 0.0 |
Fertility by Education by Marriage Status in Lincoln University
| Educational Attainment | Married | Unmarried |
| Less than High School | 0 (0.0%) | 0 (0.0%) |
| High School Diploma | 0 (0.0%) | 0 (0.0%) |
| College or Associate's Degree | 0 (0.0%) | 0 (0.0%) |
| Bachelor's Degree | 0 (0.0%) | 0 (0.0%) |
| Graduate Degree | 0 (0.0%) | 0 (0.0%) |
| Total | 0 (0.0%) | 0 (0.0%) |
Employment Characteristics in Lincoln University
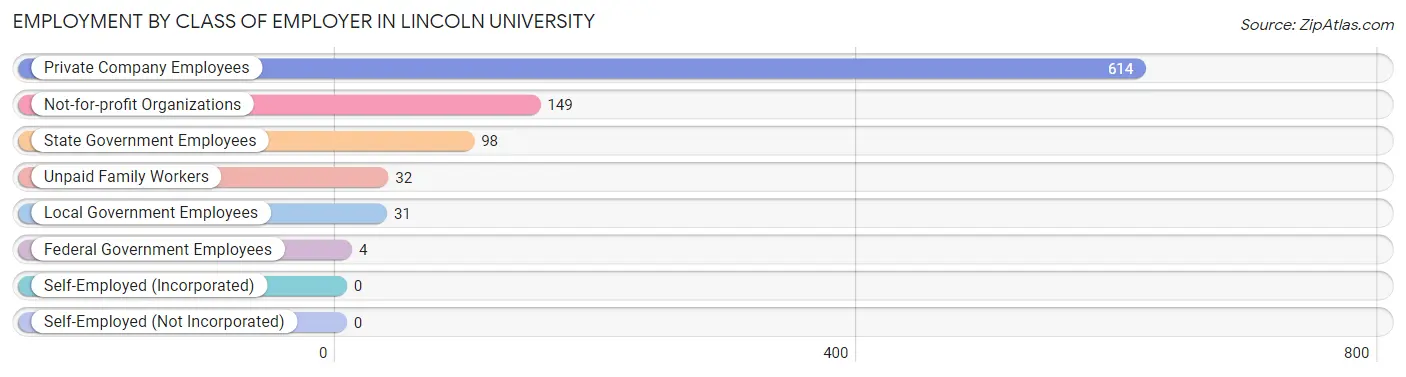
Employment by Class of Employer in Lincoln University
Among the 928 employed individuals in Lincoln University, private company employees (614 | 66.2%), not-for-profit organizations (149 | 16.1%), and state government employees (98 | 10.6%) make up the most common classes of employment.
| Employer Class | # Employees | % Employees |
| Private Company Employees | 614 | 66.2% |
| Self-Employed (Incorporated) | 0 | 0.0% |
| Self-Employed (Not Incorporated) | 0 | 0.0% |
| Not-for-profit Organizations | 149 | 16.1% |
| Local Government Employees | 31 | 3.3% |
| State Government Employees | 98 | 10.6% |
| Federal Government Employees | 4 | 0.4% |
| Unpaid Family Workers | 32 | 3.5% |
| Total | 928 | 100.0% |
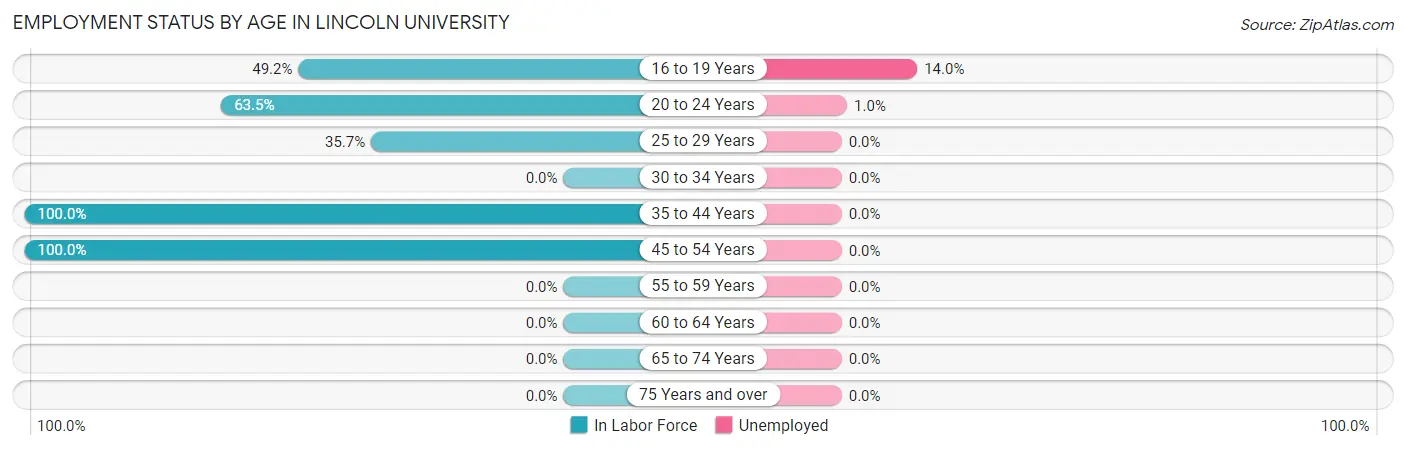
Employment Status by Age in Lincoln University
According to the labor force statistics for Lincoln University, out of the total population over 16 years of age (1,984), 55.1% or 1,093 individuals are in the labor force, with 7.9% or 86 of them unemployed. The age group with the highest labor force participation rate is 35 to 44 years, with 100.0% or 5 individuals in the labor force. Within the labor force, the 16 to 19 years age range has the highest percentage of unemployed individuals, with 14.0% or 81 of them being unemployed.
| Age Bracket | In Labor Force | Unemployed |
| 16 to 19 Years | 578 (49.2%) | 81 (14.0%) |
| 20 to 24 Years | 498 (63.5%) | 5 (1.0%) |
| 25 to 29 Years | 5 (35.7%) | 0 (0.0%) |
| 30 to 34 Years | 0 (0.0%) | 0 (0.0%) |
| 35 to 44 Years | 5 (100.0%) | 0 (0.0%) |
| 45 to 54 Years | 7 (100.0%) | 0 (0.0%) |
| 55 to 59 Years | 0 (0.0%) | 0 (0.0%) |
| 60 to 64 Years | 0 (0.0%) | 0 (0.0%) |
| 65 to 74 Years | 0 (0.0%) | 0 (0.0%) |
| 75 Years and over | 0 (0.0%) | 0 (0.0%) |
| Total | 1,093 (55.1%) | 86 (7.9%) |
Employment Status by Educational Attainment in Lincoln University
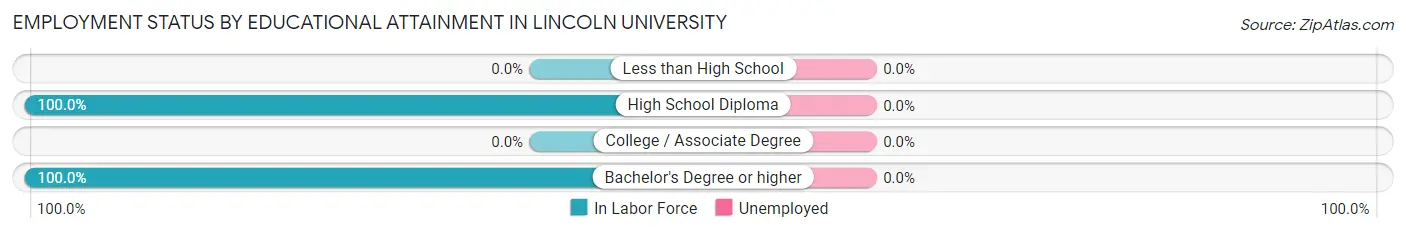
| Educational Attainment | In Labor Force | Unemployed |
| Less than High School | 0 (0.0%) | 0 (0.0%) |
| High School Diploma | 10 (100.0%) | 0 (0.0%) |
| College / Associate Degree | 0 (0.0%) | 0 (0.0%) |
| Bachelor's Degree or higher | 7 (100.0%) | 0 (0.0%) |
| Total | 17 (65.4%) | 0 (0.0%) |
Employment Occupations by Sex in Lincoln University
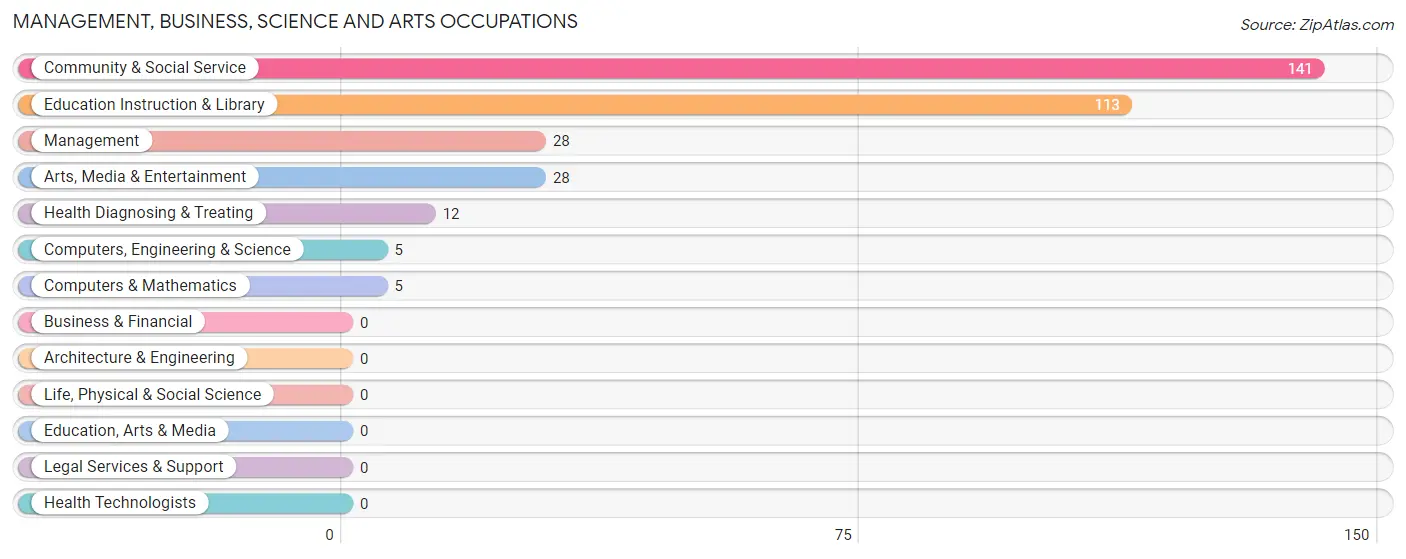
Management, Business, Science and Arts Occupations
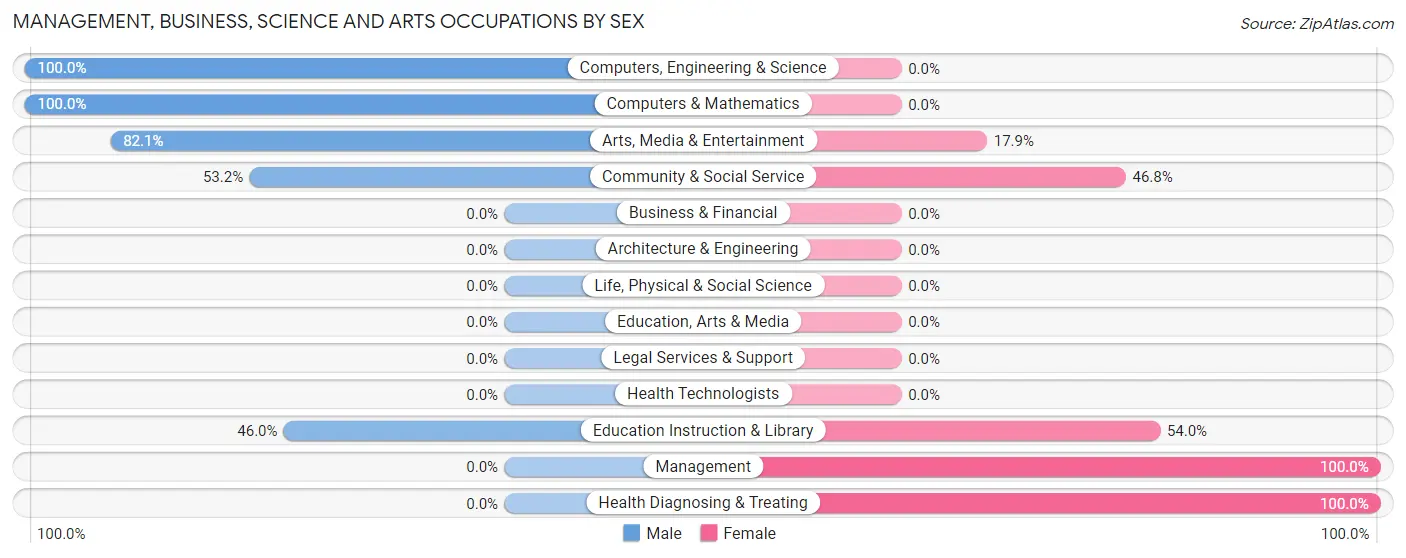
The most common Management, Business, Science and Arts occupations in Lincoln University are Community & Social Service (141 | 14.0%), Education Instruction & Library (113 | 11.2%), Management (28 | 2.8%), Arts, Media & Entertainment (28 | 2.8%), and Health Diagnosing & Treating (12 | 1.2%).
Management, Business, Science and Arts Occupations by Sex
Within the Management, Business, Science and Arts occupations in Lincoln University, the most male-oriented occupations are Computers, Engineering & Science (100.0%), Computers & Mathematics (100.0%), and Arts, Media & Entertainment (82.1%), while the most female-oriented occupations are Management (100.0%), Health Diagnosing & Treating (100.0%), and Education Instruction & Library (54.0%).
| Occupation | Male | Female |
| Management | 0 (0.0%) | 28 (100.0%) |
| Business & Financial | 0 (0.0%) | 0 (0.0%) |
| Computers, Engineering & Science | 5 (100.0%) | 0 (0.0%) |
| Computers & Mathematics | 5 (100.0%) | 0 (0.0%) |
| Architecture & Engineering | 0 (0.0%) | 0 (0.0%) |
| Life, Physical & Social Science | 0 (0.0%) | 0 (0.0%) |
| Community & Social Service | 75 (53.2%) | 66 (46.8%) |
| Education, Arts & Media | 0 (0.0%) | 0 (0.0%) |
| Legal Services & Support | 0 (0.0%) | 0 (0.0%) |
| Education Instruction & Library | 52 (46.0%) | 61 (54.0%) |
| Arts, Media & Entertainment | 23 (82.1%) | 5 (17.9%) |
| Health Diagnosing & Treating | 0 (0.0%) | 12 (100.0%) |
| Health Technologists | 0 (0.0%) | 0 (0.0%) |
| Total (Category) | 80 (43.0%) | 106 (57.0%) |
| Total (Overall) | 350 (34.8%) | 657 (65.2%) |
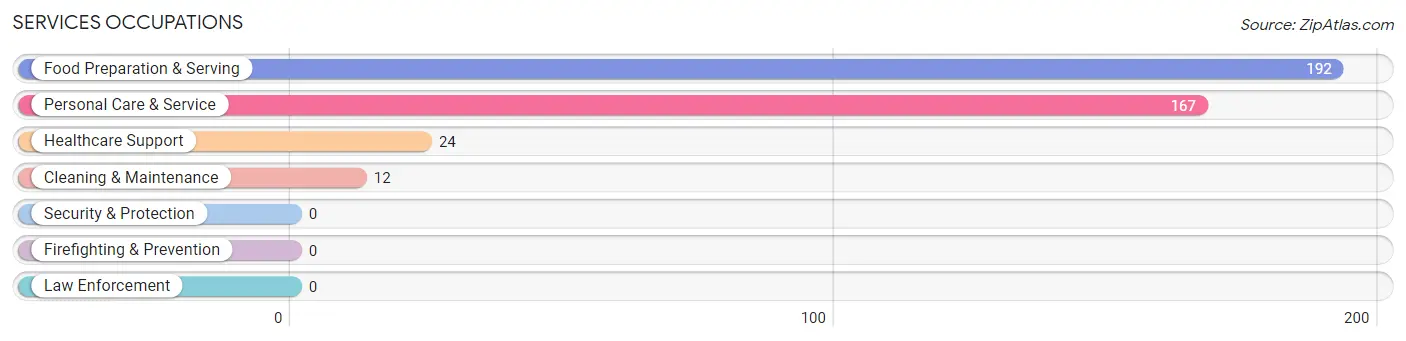
Services Occupations
The most common Services occupations in Lincoln University are Food Preparation & Serving (192 | 19.1%), Personal Care & Service (167 | 16.6%), Healthcare Support (24 | 2.4%), and Cleaning & Maintenance (12 | 1.2%).
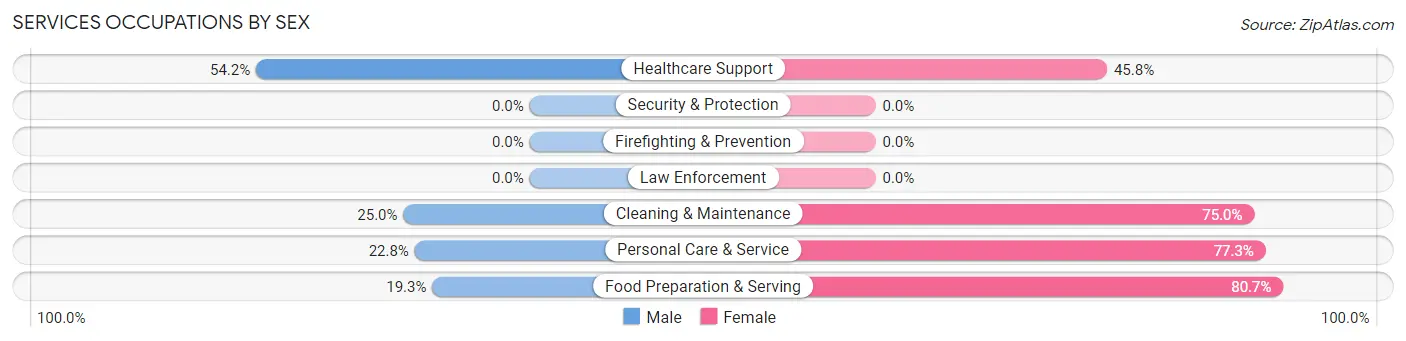
Services Occupations by Sex
Within the Services occupations in Lincoln University, the most male-oriented occupations are Healthcare Support (54.2%), Cleaning & Maintenance (25.0%), and Personal Care & Service (22.8%), while the most female-oriented occupations are Food Preparation & Serving (80.7%), Personal Care & Service (77.2%), and Cleaning & Maintenance (75.0%).
| Occupation | Male | Female |
| Healthcare Support | 13 (54.2%) | 11 (45.8%) |
| Security & Protection | 0 (0.0%) | 0 (0.0%) |
| Firefighting & Prevention | 0 (0.0%) | 0 (0.0%) |
| Law Enforcement | 0 (0.0%) | 0 (0.0%) |
| Food Preparation & Serving | 37 (19.3%) | 155 (80.7%) |
| Cleaning & Maintenance | 3 (25.0%) | 9 (75.0%) |
| Personal Care & Service | 38 (22.8%) | 129 (77.2%) |
| Total (Category) | 91 (23.0%) | 304 (77.0%) |
| Total (Overall) | 350 (34.8%) | 657 (65.2%) |
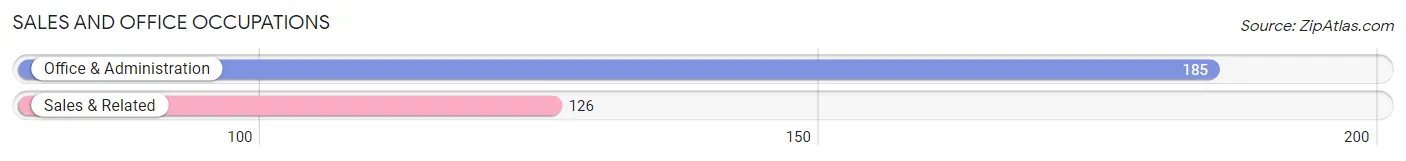
Sales and Office Occupations
The most common Sales and Office occupations in Lincoln University are Office & Administration (185 | 18.4%), and Sales & Related (126 | 12.5%).
Sales and Office Occupations by Sex
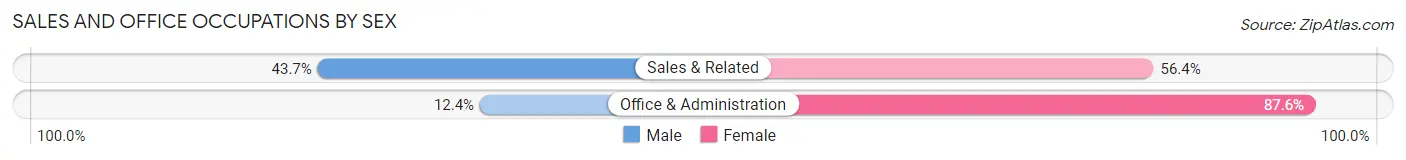
| Occupation | Male | Female |
| Sales & Related | 55 (43.6%) | 71 (56.4%) |
| Office & Administration | 23 (12.4%) | 162 (87.6%) |
| Total (Category) | 78 (25.1%) | 233 (74.9%) |
| Total (Overall) | 350 (34.8%) | 657 (65.2%) |
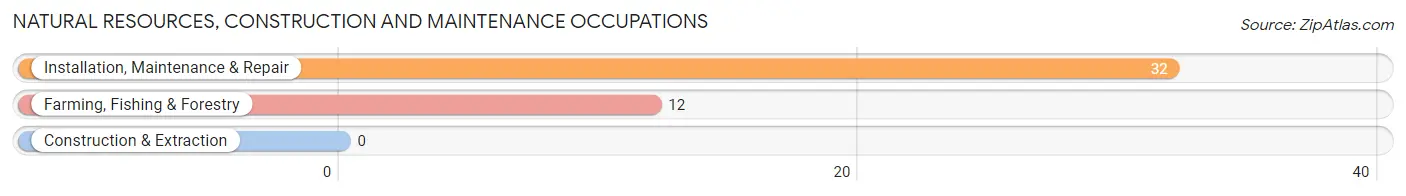
Natural Resources, Construction and Maintenance Occupations
The most common Natural Resources, Construction and Maintenance occupations in Lincoln University are Installation, Maintenance & Repair (32 | 3.2%), and Farming, Fishing & Forestry (12 | 1.2%).
Natural Resources, Construction and Maintenance Occupations by Sex
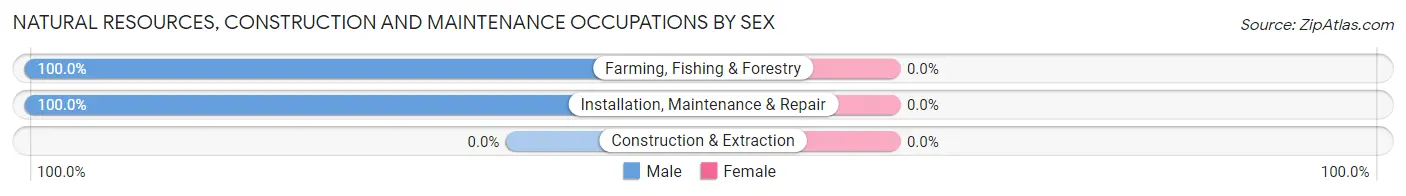
| Occupation | Male | Female |
| Farming, Fishing & Forestry | 12 (100.0%) | 0 (0.0%) |
| Construction & Extraction | 0 (0.0%) | 0 (0.0%) |
| Installation, Maintenance & Repair | 32 (100.0%) | 0 (0.0%) |
| Total (Category) | 44 (100.0%) | 0 (0.0%) |
| Total (Overall) | 350 (34.8%) | 657 (65.2%) |
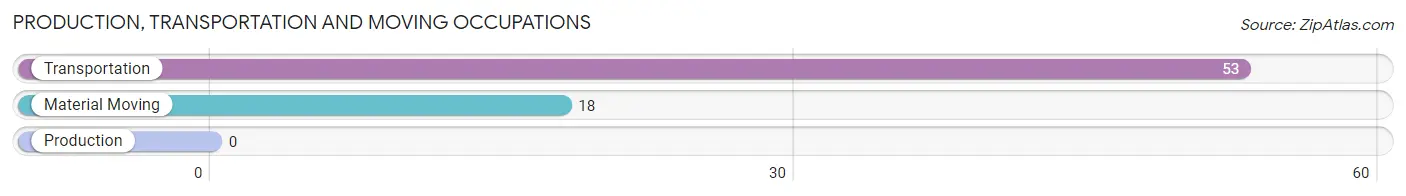
Production, Transportation and Moving Occupations
The most common Production, Transportation and Moving occupations in Lincoln University are Transportation (53 | 5.3%), and Material Moving (18 | 1.8%).
Production, Transportation and Moving Occupations by Sex
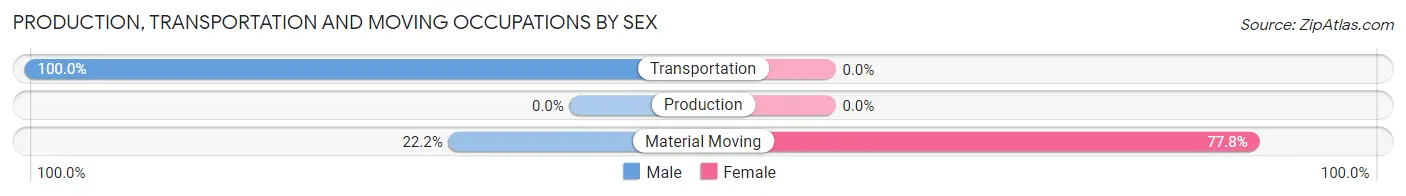
| Occupation | Male | Female |
| Production | 0 (0.0%) | 0 (0.0%) |
| Transportation | 53 (100.0%) | 0 (0.0%) |
| Material Moving | 4 (22.2%) | 14 (77.8%) |
| Total (Category) | 57 (80.3%) | 14 (19.7%) |
| Total (Overall) | 350 (34.8%) | 657 (65.2%) |
Employment Industries by Sex in Lincoln University
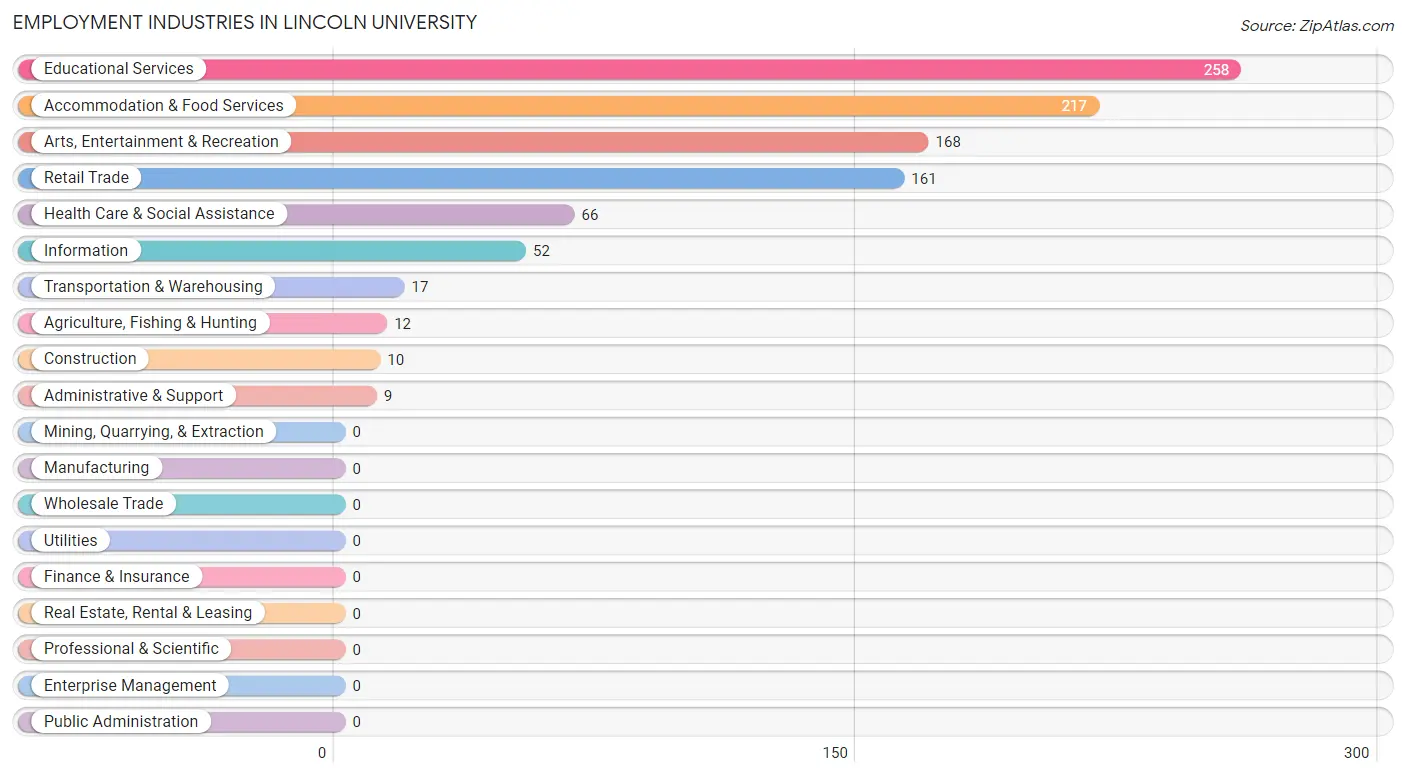
Employment Industries in Lincoln University
The major employment industries in Lincoln University include Educational Services (258 | 25.6%), Accommodation & Food Services (217 | 21.5%), Arts, Entertainment & Recreation (168 | 16.7%), Retail Trade (161 | 16.0%), and Health Care & Social Assistance (66 | 6.6%).
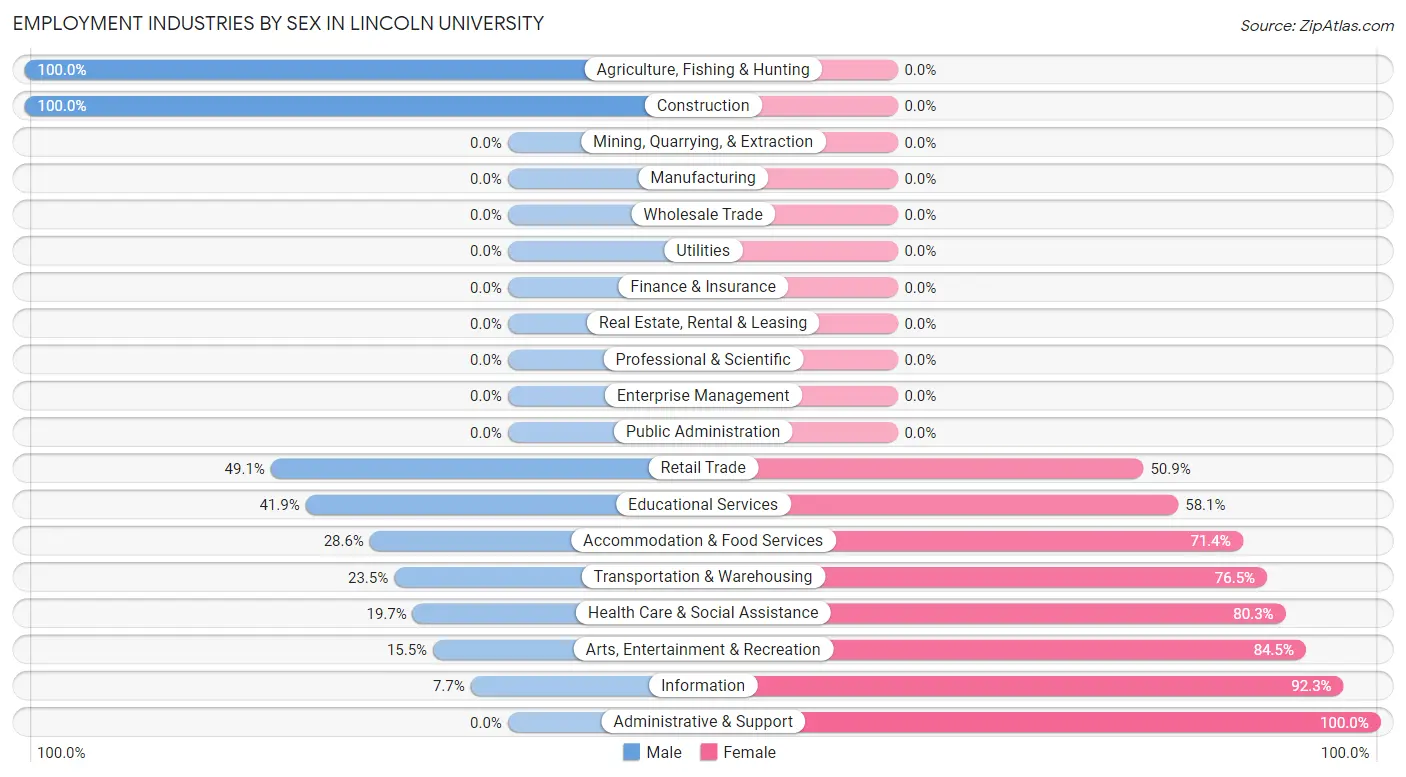
Employment Industries by Sex in Lincoln University
The Lincoln University industries that see more men than women are Agriculture, Fishing & Hunting (100.0%), Construction (100.0%), and Retail Trade (49.1%), whereas the industries that tend to have a higher number of women are Administrative & Support (100.0%), Information (92.3%), and Arts, Entertainment & Recreation (84.5%).
| Industry | Male | Female |
| Agriculture, Fishing & Hunting | 12 (100.0%) | 0 (0.0%) |
| Mining, Quarrying, & Extraction | 0 (0.0%) | 0 (0.0%) |
| Construction | 10 (100.0%) | 0 (0.0%) |
| Manufacturing | 0 (0.0%) | 0 (0.0%) |
| Wholesale Trade | 0 (0.0%) | 0 (0.0%) |
| Retail Trade | 79 (49.1%) | 82 (50.9%) |
| Transportation & Warehousing | 4 (23.5%) | 13 (76.5%) |
| Utilities | 0 (0.0%) | 0 (0.0%) |
| Information | 4 (7.7%) | 48 (92.3%) |
| Finance & Insurance | 0 (0.0%) | 0 (0.0%) |
| Real Estate, Rental & Leasing | 0 (0.0%) | 0 (0.0%) |
| Professional & Scientific | 0 (0.0%) | 0 (0.0%) |
| Enterprise Management | 0 (0.0%) | 0 (0.0%) |
| Administrative & Support | 0 (0.0%) | 9 (100.0%) |
| Educational Services | 108 (41.9%) | 150 (58.1%) |
| Health Care & Social Assistance | 13 (19.7%) | 53 (80.3%) |
| Arts, Entertainment & Recreation | 26 (15.5%) | 142 (84.5%) |
| Accommodation & Food Services | 62 (28.6%) | 155 (71.4%) |
| Public Administration | 0 (0.0%) | 0 (0.0%) |
| Total | 350 (34.8%) | 657 (65.2%) |
Education in Lincoln University
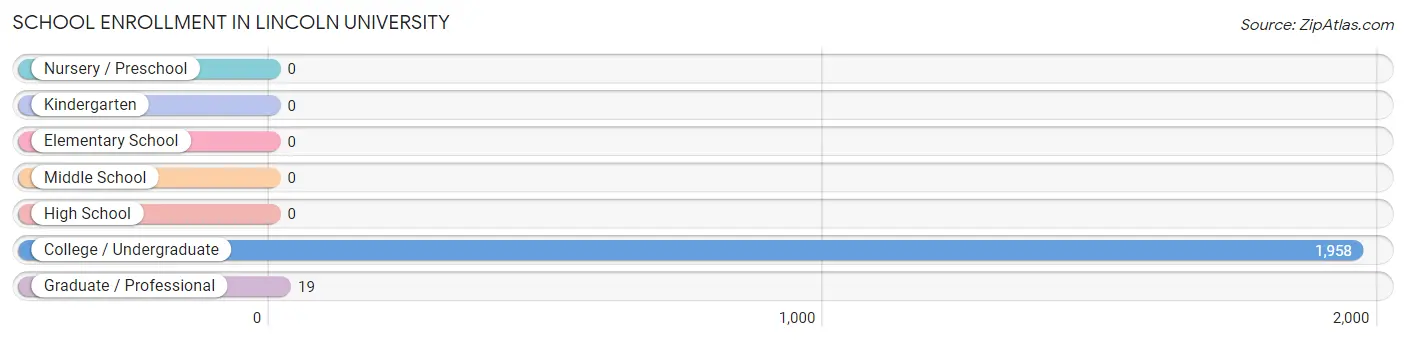
School Enrollment in Lincoln University
The most common levels of schooling among the 1,977 students in Lincoln University are college / undergraduate (1,958 | 99.0%), and graduate / professional (19 | 1.0%).
| School Level | # Students | % Students |
| Nursery / Preschool | 0 | 0.0% |
| Kindergarten | 0 | 0.0% |
| Elementary School | 0 | 0.0% |
| Middle School | 0 | 0.0% |
| High School | 0 | 0.0% |
| College / Undergraduate | 1,958 | 99.0% |
| Graduate / Professional | 19 | 1.0% |
| Total | 1,977 | 100.0% |
School Enrollment by Age by Funding Source in Lincoln University
Out of a total of 1,977 students who are enrolled in schools in Lincoln University, 427 (21.6%) attend a private institution, while the remaining 1,550 (78.4%) are enrolled in public schools. The age group of 25 to 34 year olds has the highest likelihood of being enrolled in private schools, with 14 (100.0% in the age bracket) enrolled. Conversely, the age group of 15 to 17 year olds has the lowest likelihood of being enrolled in a private school, with 7 (100.0% in the age bracket) attending a public institution.
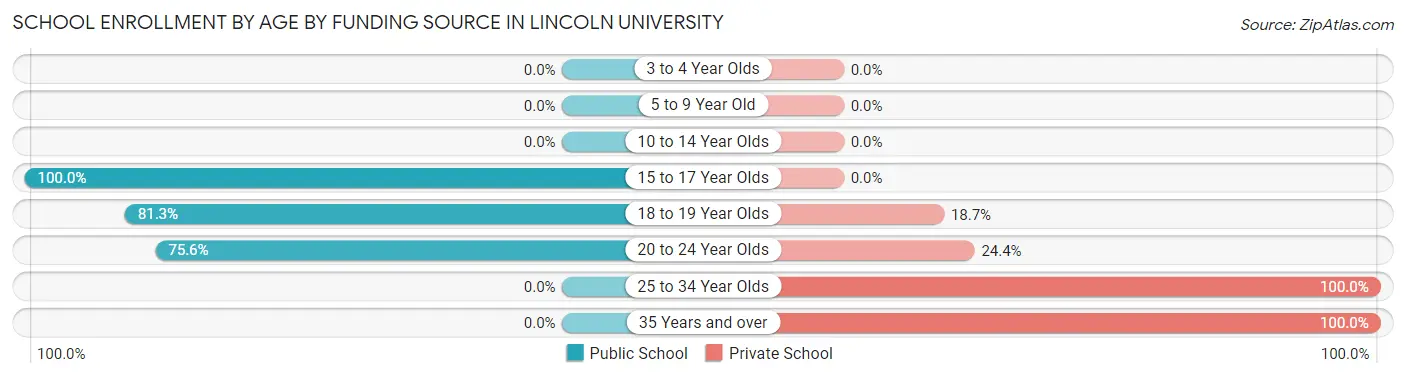
| Age Bracket | Public School | Private School |
| 3 to 4 Year Olds | 0 (0.0%) | 0 (0.0%) |
| 5 to 9 Year Old | 0 (0.0%) | 0 (0.0%) |
| 10 to 14 Year Olds | 0 (0.0%) | 0 (0.0%) |
| 15 to 17 Year Olds | 7 (100.0%) | 0 (0.0%) |
| 18 to 19 Year Olds | 949 (81.3%) | 218 (18.7%) |
| 20 to 24 Year Olds | 593 (75.6%) | 191 (24.4%) |
| 25 to 34 Year Olds | 0 (0.0%) | 14 (100.0%) |
| 35 Years and over | 0 (0.0%) | 5 (100.0%) |
| Total | 1,550 (78.4%) | 427 (21.6%) |
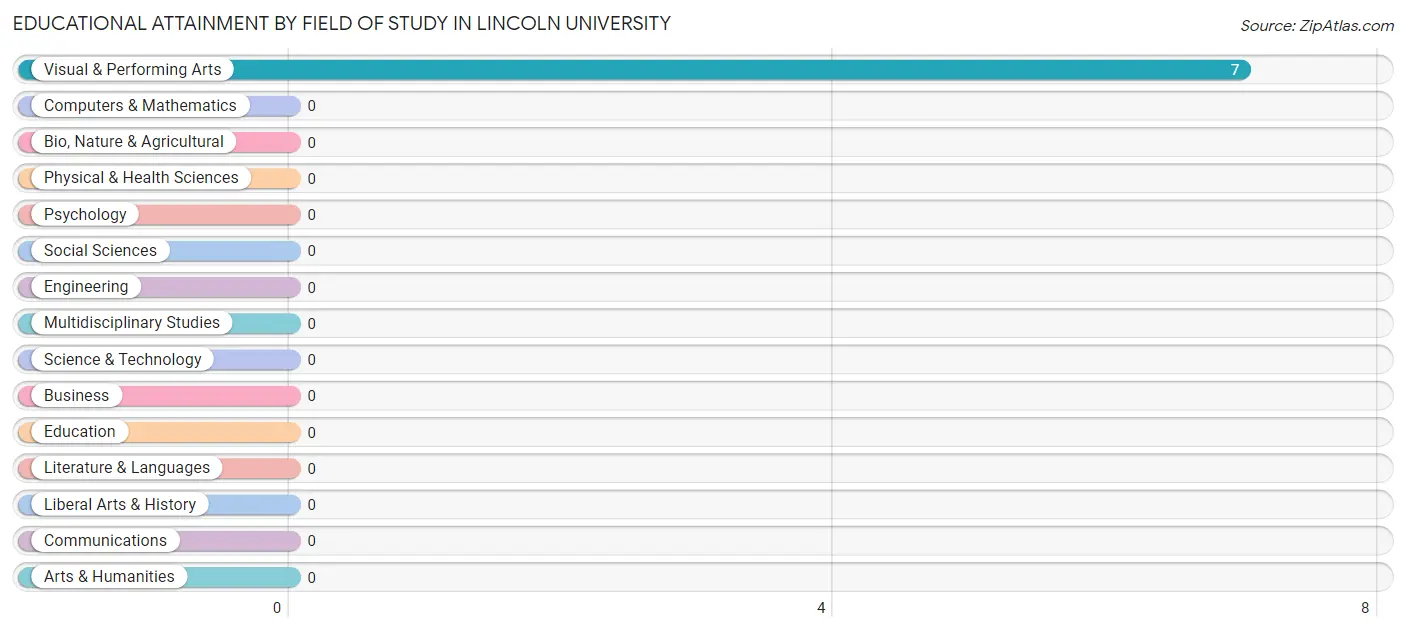
Educational Attainment by Field of Study in Lincoln University
, and visual & performing arts (7 | 100.0%) are the most common fields of study among 7 individuals in Lincoln University who have obtained a bachelor's degree or higher.
| Field of Study | # Graduates | % Graduates |
| Computers & Mathematics | 0 | 0.0% |
| Bio, Nature & Agricultural | 0 | 0.0% |
| Physical & Health Sciences | 0 | 0.0% |
| Psychology | 0 | 0.0% |
| Social Sciences | 0 | 0.0% |
| Engineering | 0 | 0.0% |
| Multidisciplinary Studies | 0 | 0.0% |
| Science & Technology | 0 | 0.0% |
| Business | 0 | 0.0% |
| Education | 0 | 0.0% |
| Literature & Languages | 0 | 0.0% |
| Liberal Arts & History | 0 | 0.0% |
| Visual & Performing Arts | 7 | 100.0% |
| Communications | 0 | 0.0% |
| Arts & Humanities | 0 | 0.0% |
| Total | 7 | 100.0% |
Transportation & Commute in Lincoln University
Vehicle Availability by Sex in Lincoln University
| Vehicles Available | Male | Female |
| No Vehicle | 0 (0.0%) | 0 (0.0%) |
| 1 Vehicle | 0 (0.0%) | 0 (0.0%) |
| 2 Vehicles | 0 (0.0%) | 0 (0.0%) |
| 3 Vehicles | 0 (0.0%) | 0 (0.0%) |
| 4 Vehicles | 0 (0.0%) | 0 (0.0%) |
| 5 or more Vehicles | 0 (0.0%) | 0 (0.0%) |
| Total | 0 (0.0%) | 0 (0.0%) |
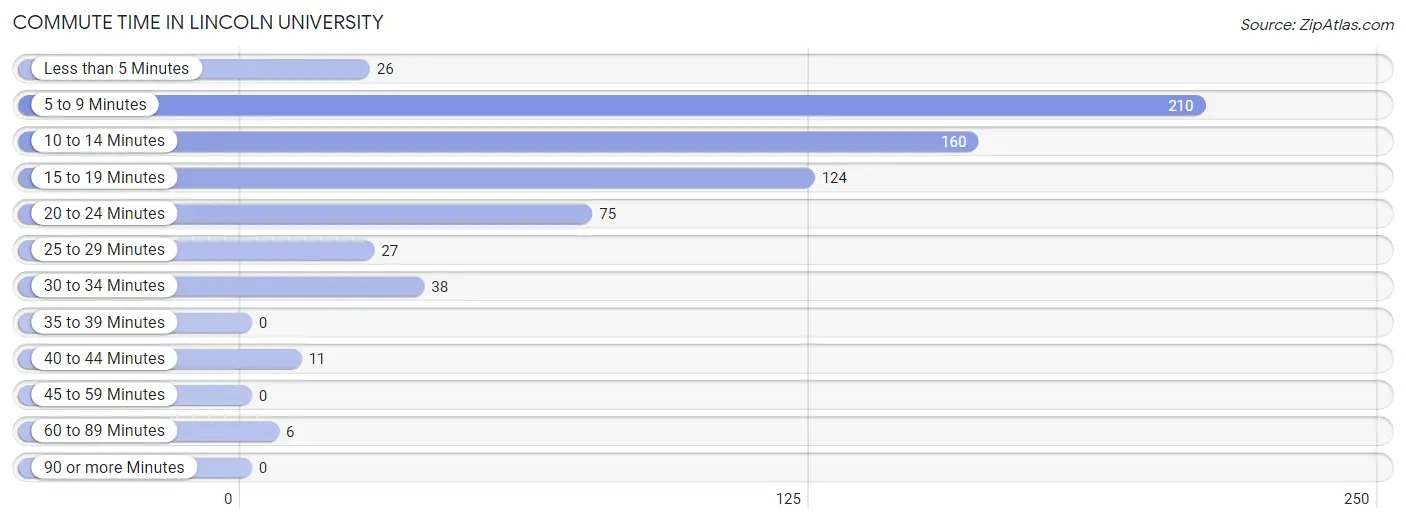
Commute Time in Lincoln University
The most frequently occuring commute durations in Lincoln University are 5 to 9 minutes (210 commuters, 31.0%), 10 to 14 minutes (160 commuters, 23.6%), and 15 to 19 minutes (124 commuters, 18.3%).
| Commute Time | # Commuters | % Commuters |
| Less than 5 Minutes | 26 | 3.8% |
| 5 to 9 Minutes | 210 | 31.0% |
| 10 to 14 Minutes | 160 | 23.6% |
| 15 to 19 Minutes | 124 | 18.3% |
| 20 to 24 Minutes | 75 | 11.1% |
| 25 to 29 Minutes | 27 | 4.0% |
| 30 to 34 Minutes | 38 | 5.6% |
| 35 to 39 Minutes | 0 | 0.0% |
| 40 to 44 Minutes | 11 | 1.6% |
| 45 to 59 Minutes | 0 | 0.0% |
| 60 to 89 Minutes | 6 | 0.9% |
| 90 or more Minutes | 0 | 0.0% |
Commute Time by Sex in Lincoln University
The most common commute times in Lincoln University are 5 to 9 minutes (102 commuters, 43.4%) for males and 5 to 9 minutes (108 commuters, 24.4%) for females.
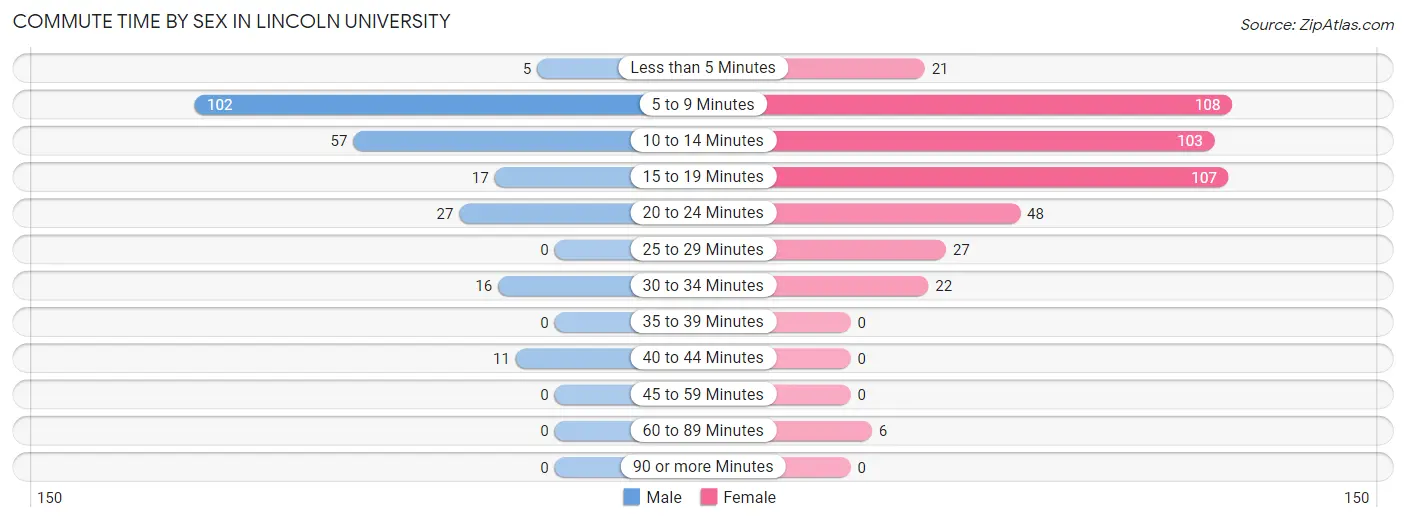
| Commute Time | Male | Female |
| Less than 5 Minutes | 5 (2.1%) | 21 (4.8%) |
| 5 to 9 Minutes | 102 (43.4%) | 108 (24.4%) |
| 10 to 14 Minutes | 57 (24.3%) | 103 (23.3%) |
| 15 to 19 Minutes | 17 (7.2%) | 107 (24.2%) |
| 20 to 24 Minutes | 27 (11.5%) | 48 (10.9%) |
| 25 to 29 Minutes | 0 (0.0%) | 27 (6.1%) |
| 30 to 34 Minutes | 16 (6.8%) | 22 (5.0%) |
| 35 to 39 Minutes | 0 (0.0%) | 0 (0.0%) |
| 40 to 44 Minutes | 11 (4.7%) | 0 (0.0%) |
| 45 to 59 Minutes | 0 (0.0%) | 0 (0.0%) |
| 60 to 89 Minutes | 0 (0.0%) | 6 (1.4%) |
| 90 or more Minutes | 0 (0.0%) | 0 (0.0%) |
Time of Departure to Work by Sex in Lincoln University
The most frequent times of departure to work in Lincoln University are 12:00 PM to 3:59 PM (115, 48.9%) for males and 12:00 PM to 3:59 PM (189, 42.8%) for females.
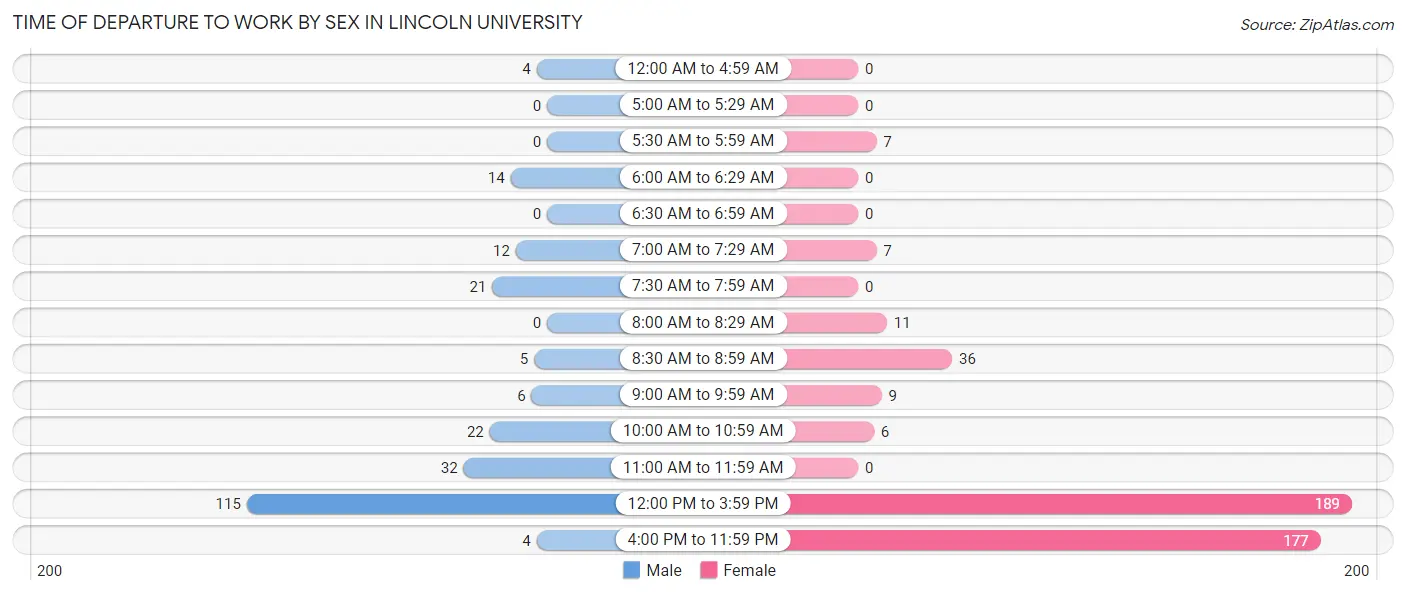
| Time of Departure | Male | Female |
| 12:00 AM to 4:59 AM | 4 (1.7%) | 0 (0.0%) |
| 5:00 AM to 5:29 AM | 0 (0.0%) | 0 (0.0%) |
| 5:30 AM to 5:59 AM | 0 (0.0%) | 7 (1.6%) |
| 6:00 AM to 6:29 AM | 14 (6.0%) | 0 (0.0%) |
| 6:30 AM to 6:59 AM | 0 (0.0%) | 0 (0.0%) |
| 7:00 AM to 7:29 AM | 12 (5.1%) | 7 (1.6%) |
| 7:30 AM to 7:59 AM | 21 (8.9%) | 0 (0.0%) |
| 8:00 AM to 8:29 AM | 0 (0.0%) | 11 (2.5%) |
| 8:30 AM to 8:59 AM | 5 (2.1%) | 36 (8.1%) |
| 9:00 AM to 9:59 AM | 6 (2.5%) | 9 (2.0%) |
| 10:00 AM to 10:59 AM | 22 (9.4%) | 6 (1.4%) |
| 11:00 AM to 11:59 AM | 32 (13.6%) | 0 (0.0%) |
| 12:00 PM to 3:59 PM | 115 (48.9%) | 189 (42.8%) |
| 4:00 PM to 11:59 PM | 4 (1.7%) | 177 (40.1%) |
| Total | 235 (100.0%) | 442 (100.0%) |
Housing Occupancy in Lincoln University
Occupancy by Ownership in Lincoln University
| Occupancy | # Housing Units | % Housing Units |
| Owner Occupied Housing Units | 0 | 0.0% |
| Renter-Occupied Housing Units | 0 | 0.0% |
| Total Occupied Housing Units | 0 | 0.0% |
Occupancy by Household Size in Lincoln University
| Household Size | # Housing Units | % Housing Units |
| 1-Person Household | 0 | 0.0% |
| 2-Person Household | 0 | 0.0% |
| 3-Person Household | 0 | 0.0% |
| 4+ Person Household | 0 | 0.0% |
| Total Housing Units | 0 | 0.0% |
Occupancy by Ownership by Household Size in Lincoln University
| Household Size | Owner-occupied | Renter-occupied |
| 1-Person Household | 0 (0.0%) | 0 (0.0%) |
| 2-Person Household | 0 (0.0%) | 0 (0.0%) |
| 3-Person Household | 0 (0.0%) | 0 (0.0%) |
| 4+ Person Household | 0 (0.0%) | 0 (0.0%) |
| Total Housing Units | 0 (0.0%) | 0 (0.0%) |
Occupancy by Educational Attainment in Lincoln University
| Household Size | Owner-occupied | Renter-occupied |
| Less than High School | 0 (0.0%) | 0 (0.0%) |
| High School Diploma | 0 (0.0%) | 0 (0.0%) |
| College/Associate Degree | 0 (0.0%) | 0 (0.0%) |
| Bachelor's Degree or higher | 0 (0.0%) | 0 (0.0%) |
Occupancy by Age of Householder in Lincoln University
| Age Bracket | # Households | % Households |
| Under 35 Years | 0 | 0.0% |
| 35 to 44 Years | 0 | 0.0% |
| 45 to 54 Years | 0 | 0.0% |
| 55 to 64 Years | 0 | 0.0% |
| 65 to 74 Years | 0 | 0.0% |
| 75 to 84 Years | 0 | 0.0% |
| 85 Years and Over | 0 | 0.0% |
| Total | 0 | 0.0% |
Housing Finances in Lincoln University
Median Income by Occupancy in Lincoln University
| Occupancy Type | # Households | Median Income |
| Owner-Occupied | 0 (0.0%) | $0 |
| Renter-Occupied | 0 (0.0%) | $0 |
| Average | 0 (0.0%) | $0 |
Occupancy by Householder Income Bracket in Lincoln University
| Income Bracket | Owner-occupied | Renter-occupied |
| Less than $5,000 | 0 (0.0%) | 0 (0.0%) |
| $5,000 to $9,999 | 0 (0.0%) | 0 (0.0%) |
| $10,000 to $14,999 | 0 (0.0%) | 0 (0.0%) |
| $15,000 to $19,999 | 0 (0.0%) | 0 (0.0%) |
| $20,000 to $24,999 | 0 (0.0%) | 0 (0.0%) |
| $25,000 to $34,999 | 0 (0.0%) | 0 (0.0%) |
| $35,000 to $49,999 | 0 (0.0%) | 0 (0.0%) |
| $50,000 to $74,999 | 0 (0.0%) | 0 (0.0%) |
| $75,000 to $99,999 | 0 (0.0%) | 0 (0.0%) |
| $100,000 to $149,999 | 0 (0.0%) | 0 (0.0%) |
| $150,000 or more | 0 (0.0%) | 0 (0.0%) |
| Total | 0 (0.0%) | 0 (0.0%) |
Monthly Housing Cost Tiers in Lincoln University
| Monthly Cost | Owner-occupied | Renter-occupied |
| Less than $300 | 0 (0.0%) | 0 (0.0%) |
| $300 to $499 | 0 (0.0%) | 0 (0.0%) |
| $500 to $799 | 0 (0.0%) | 0 (0.0%) |
| $800 to $999 | 0 (0.0%) | 0 (0.0%) |
| $1,000 to $1,499 | 0 (0.0%) | 0 (0.0%) |
| $1,500 to $1,999 | 0 (0.0%) | 0 (0.0%) |
| $2,000 to $2,499 | 0 (0.0%) | 0 (0.0%) |
| $2,500 to $2,999 | 0 (0.0%) | 0 (0.0%) |
| $3,000 or more | 0 (0.0%) | 0 (0.0%) |
| Total | 0 (0.0%) | 0 (0.0%) |
Physical Housing Characteristics in Lincoln University
Housing Structures in Lincoln University
| Structure Type | # Housing Units | % Housing Units |
| Single Unit, Detached | 0 | 0.0% |
| Single Unit, Attached | 0 | 0.0% |
| 2 Unit Apartments | 0 | 0.0% |
| 3 or 4 Unit Apartments | 0 | 0.0% |
| 5 to 9 Unit Apartments | 0 | 0.0% |
| 10 or more Apartments | 0 | 0.0% |
| Mobile Home / Other | 0 | 0.0% |
| Total | 0 | 0.0% |
Housing Structures by Occupancy in Lincoln University
| Structure Type | Owner-occupied | Renter-occupied |
| Single Unit, Detached | 0 (0.0%) | 0 (0.0%) |
| Single Unit, Attached | 0 (0.0%) | 0 (0.0%) |
| 2 Unit Apartments | 0 (0.0%) | 0 (0.0%) |
| 3 or 4 Unit Apartments | 0 (0.0%) | 0 (0.0%) |
| 5 to 9 Unit Apartments | 0 (0.0%) | 0 (0.0%) |
| 10 or more Apartments | 0 (0.0%) | 0 (0.0%) |
| Mobile Home / Other | 0 (0.0%) | 0 (0.0%) |
| Total | 0 (0.0%) | 0 (0.0%) |
Housing Structures by Number of Rooms in Lincoln University
| Number of Rooms | Owner-occupied | Renter-occupied |
| 1 Room | 0 (0.0%) | 0 (0.0%) |
| 2 or 3 Rooms | 0 (0.0%) | 0 (0.0%) |
| 4 or 5 Rooms | 0 (0.0%) | 0 (0.0%) |
| 6 or 7 Rooms | 0 (0.0%) | 0 (0.0%) |
| 8 or more Rooms | 0 (0.0%) | 0 (0.0%) |
| Total | 0 (0.0%) | 0 (0.0%) |
Housing Structure by Heating Type in Lincoln University
| Heating Type | Owner-occupied | Renter-occupied |
| Utility Gas | 0 (0.0%) | 0 (0.0%) |
| Bottled, Tank, or LP Gas | 0 (0.0%) | 0 (0.0%) |
| Electricity | 0 (0.0%) | 0 (0.0%) |
| Fuel Oil or Kerosene | 0 (0.0%) | 0 (0.0%) |
| Coal or Coke | 0 (0.0%) | 0 (0.0%) |
| All other Fuels | 0 (0.0%) | 0 (0.0%) |
| No Fuel Used | 0 (0.0%) | 0 (0.0%) |
| Total | 0 (0.0%) | 0 (0.0%) |
Household Vehicle Usage in Lincoln University
| Vehicles per Household | Owner-occupied | Renter-occupied |
| No Vehicle | 0 (0.0%) | 0 (0.0%) |
| 1 Vehicle | 0 (0.0%) | 0 (0.0%) |
| 2 Vehicles | 0 (0.0%) | 0 (0.0%) |
| 3 or more Vehicles | 0 (0.0%) | 0 (0.0%) |
| Total | 0 (0.0%) | 0 (0.0%) |
Real Estate & Mortgages in Lincoln University
Real Estate and Mortgage Overview in Lincoln University
| Characteristic | Without Mortgage | With Mortgage |
| Housing Units | 0 | 0 |
| Median Property Value | - | - |
| Median Household Income | - | - |
| Monthly Housing Costs | - | - |
| Real Estate Taxes | - | - |
Property Value by Mortgage Status in Lincoln University
| Property Value | Without Mortgage | With Mortgage |
| Less than $50,000 | 0 (0.0%) | 0 (0.0%) |
| $50,000 to $99,999 | 0 (0.0%) | 0 (0.0%) |
| $100,000 to $299,999 | 0 (0.0%) | 0 (0.0%) |
| $300,000 to $499,999 | 0 (0.0%) | 0 (0.0%) |
| $500,000 to $749,999 | 0 (0.0%) | 0 (0.0%) |
| $750,000 to $999,999 | 0 (0.0%) | 0 (0.0%) |
| $1,000,000 or more | 0 (0.0%) | 0 (0.0%) |
| Total | 0 (0.0%) | 0 (0.0%) |
Household Income by Mortgage Status in Lincoln University
| Household Income | Without Mortgage | With Mortgage |
| Less than $10,000 | 0 (0.0%) | 0 (0.0%) |
| $10,000 to $24,999 | 0 (0.0%) | 0 (0.0%) |
| $25,000 to $34,999 | 0 (0.0%) | 0 (0.0%) |
| $35,000 to $49,999 | 0 (0.0%) | 0 (0.0%) |
| $50,000 to $74,999 | 0 (0.0%) | 0 (0.0%) |
| $75,000 to $99,999 | 0 (0.0%) | 0 (0.0%) |
| $100,000 to $149,999 | 0 (0.0%) | 0 (0.0%) |
| $150,000 or more | 0 (0.0%) | 0 (0.0%) |
| Total | 0 (0.0%) | 0 (0.0%) |
Property Value to Household Income Ratio in Lincoln University
| Value-to-Income Ratio | Without Mortgage | With Mortgage |
| Less than 2.0x | 0 (0.0%) | 0 (0.0%) |
| 2.0x to 2.9x | 0 (0.0%) | 0 (0.0%) |
| 3.0x to 3.9x | 0 (0.0%) | 0 (0.0%) |
| 4.0x or more | 0 (0.0%) | 0 (0.0%) |
| Total | 0 (0.0%) | 0 (0.0%) |
Real Estate Taxes by Mortgage Status in Lincoln University

| Property Taxes | Without Mortgage | With Mortgage |
| Less than $800 | 0 (0.0%) | 0 (0.0%) |
| $800 to $1,499 | 0 (0.0%) | 0 (0.0%) |
| $800 to $1,499 | 0 (0.0%) | 0 (0.0%) |
| Total | 0 (0.0%) | 0 (0.0%) |
Health & Disability in Lincoln University
Health Insurance Coverage by Age in Lincoln University
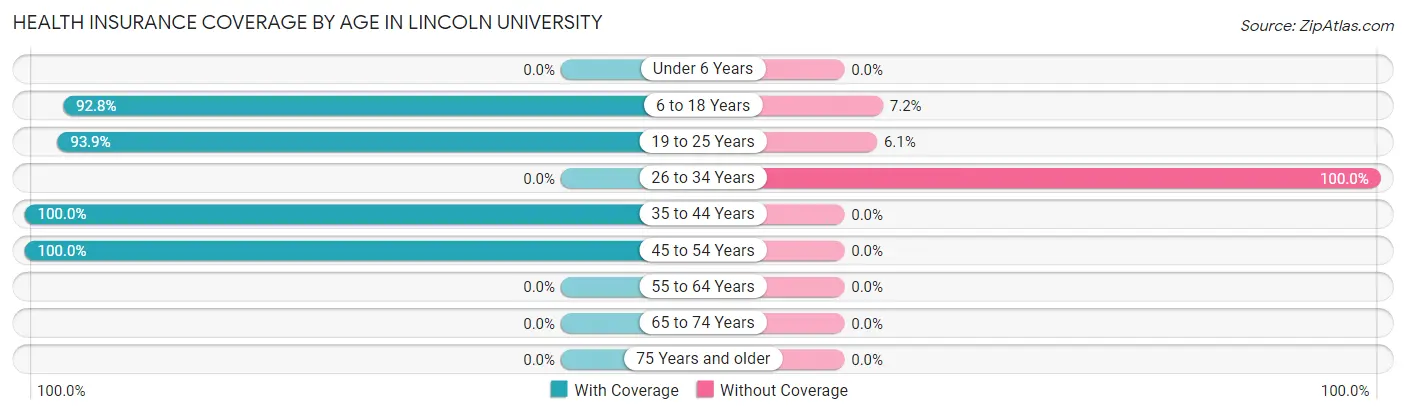
| Age Bracket | With Coverage | Without Coverage |
| Under 6 Years | 0 (0.0%) | 0 (0.0%) |
| 6 to 18 Years | 452 (92.8%) | 35 (7.2%) |
| 19 to 25 Years | 1,386 (93.9%) | 90 (6.1%) |
| 26 to 34 Years | 0 (0.0%) | 9 (100.0%) |
| 35 to 44 Years | 5 (100.0%) | 0 (0.0%) |
| 45 to 54 Years | 7 (100.0%) | 0 (0.0%) |
| 55 to 64 Years | 0 (0.0%) | 0 (0.0%) |
| 65 to 74 Years | 0 (0.0%) | 0 (0.0%) |
| 75 Years and older | 0 (0.0%) | 0 (0.0%) |
| Total | 1,850 (93.2%) | 134 (6.8%) |
Health Insurance Coverage by Citizenship Status in Lincoln University
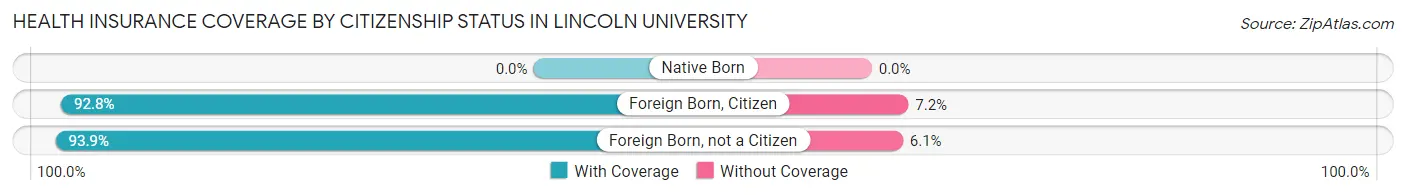
| Citizenship Status | With Coverage | Without Coverage |
| Native Born | 0 (0.0%) | 0 (0.0%) |
| Foreign Born, Citizen | 452 (92.8%) | 35 (7.2%) |
| Foreign Born, not a Citizen | 1,386 (93.9%) | 90 (6.1%) |
Health Insurance Coverage by Household Income in Lincoln University
| Household Income | With Coverage | Without Coverage |
| Under $25,000 | 0 (0.0%) | 0 (0.0%) |
| $25,000 to $49,999 | 0 (0.0%) | 0 (0.0%) |
| $50,000 to $74,999 | 0 (0.0%) | 0 (0.0%) |
| $75,000 to $99,999 | 0 (0.0%) | 0 (0.0%) |
| $100,000 and over | 0 (0.0%) | 0 (0.0%) |
Public vs Private Health Insurance Coverage by Age in Lincoln University
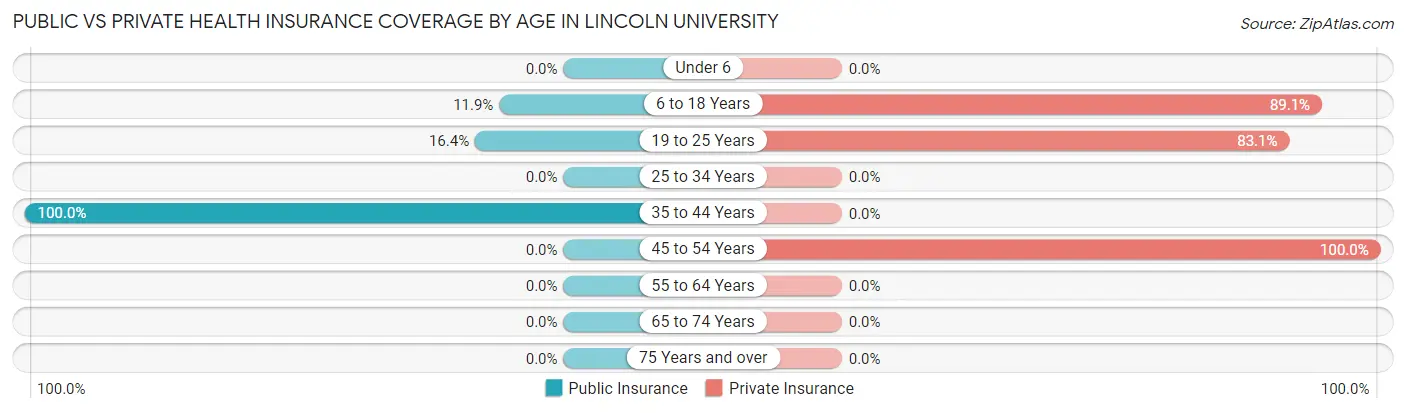
| Age Bracket | Public Insurance | Private Insurance |
| Under 6 | 0 (0.0%) | 0 (0.0%) |
| 6 to 18 Years | 58 (11.9%) | 434 (89.1%) |
| 19 to 25 Years | 242 (16.4%) | 1,226 (83.1%) |
| 25 to 34 Years | 0 (0.0%) | 0 (0.0%) |
| 35 to 44 Years | 5 (100.0%) | 0 (0.0%) |
| 45 to 54 Years | 0 (0.0%) | 7 (100.0%) |
| 55 to 64 Years | 0 (0.0%) | 0 (0.0%) |
| 65 to 74 Years | 0 (0.0%) | 0 (0.0%) |
| 75 Years and over | 0 (0.0%) | 0 (0.0%) |
| Total | 305 (15.4%) | 1,667 (84.0%) |
Disability Status by Sex by Age in Lincoln University
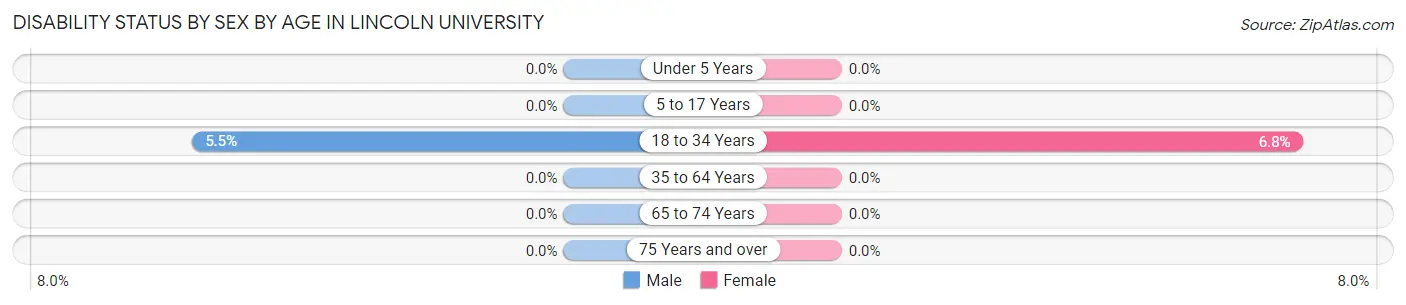
| Age Bracket | Male | Female |
| Under 5 Years | 0 (0.0%) | 0 (0.0%) |
| 5 to 17 Years | 0 (0.0%) | 0 (0.0%) |
| 18 to 34 Years | 43 (5.5%) | 81 (6.8%) |
| 35 to 64 Years | 0 (0.0%) | 0 (0.0%) |
| 65 to 74 Years | 0 (0.0%) | 0 (0.0%) |
| 75 Years and over | 0 (0.0%) | 0 (0.0%) |
Disability Class by Sex by Age in Lincoln University
Disability Class: Hearing Difficulty
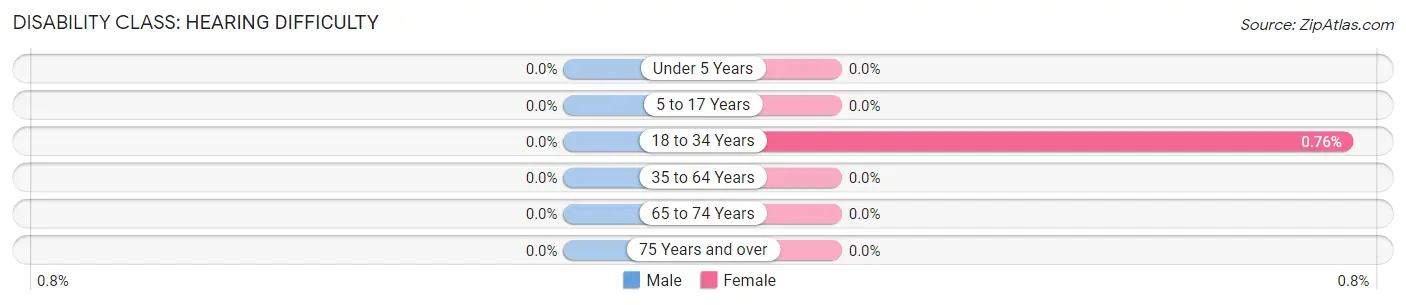
| Age Bracket | Male | Female |
| Under 5 Years | 0 (0.0%) | 0 (0.0%) |
| 5 to 17 Years | 0 (0.0%) | 0 (0.0%) |
| 18 to 34 Years | 0 (0.0%) | 9 (0.8%) |
| 35 to 64 Years | 0 (0.0%) | 0 (0.0%) |
| 65 to 74 Years | 0 (0.0%) | 0 (0.0%) |
| 75 Years and over | 0 (0.0%) | 0 (0.0%) |
Disability Class: Vision Difficulty
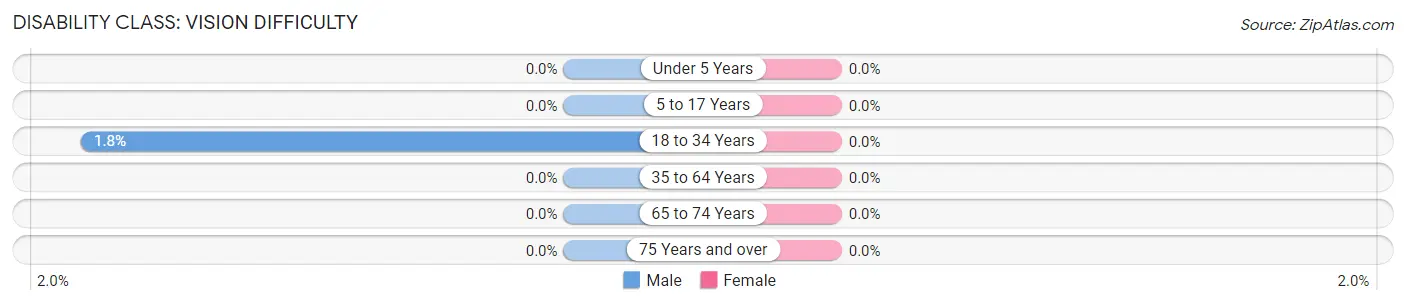
| Age Bracket | Male | Female |
| Under 5 Years | 0 (0.0%) | 0 (0.0%) |
| 5 to 17 Years | 0 (0.0%) | 0 (0.0%) |
| 18 to 34 Years | 14 (1.8%) | 0 (0.0%) |
| 35 to 64 Years | 0 (0.0%) | 0 (0.0%) |
| 65 to 74 Years | 0 (0.0%) | 0 (0.0%) |
| 75 Years and over | 0 (0.0%) | 0 (0.0%) |
Disability Class: Cognitive Difficulty
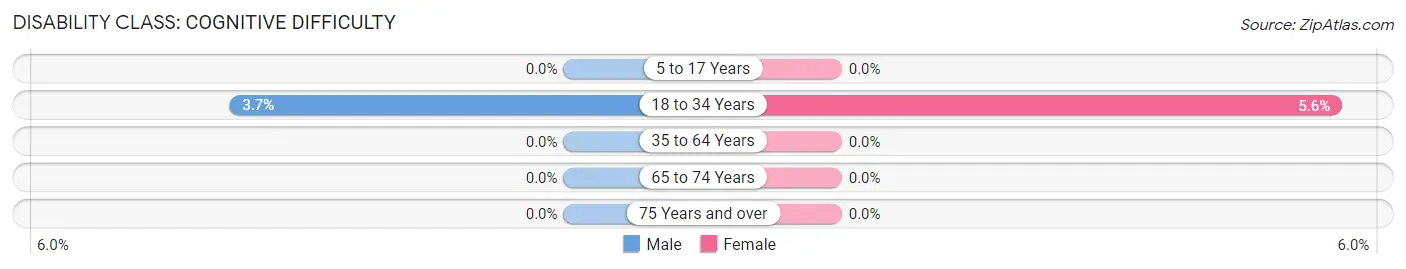
| Age Bracket | Male | Female |
| 5 to 17 Years | 0 (0.0%) | 0 (0.0%) |
| 18 to 34 Years | 29 (3.7%) | 66 (5.6%) |
| 35 to 64 Years | 0 (0.0%) | 0 (0.0%) |
| 65 to 74 Years | 0 (0.0%) | 0 (0.0%) |
| 75 Years and over | 0 (0.0%) | 0 (0.0%) |
Disability Class: Ambulatory Difficulty
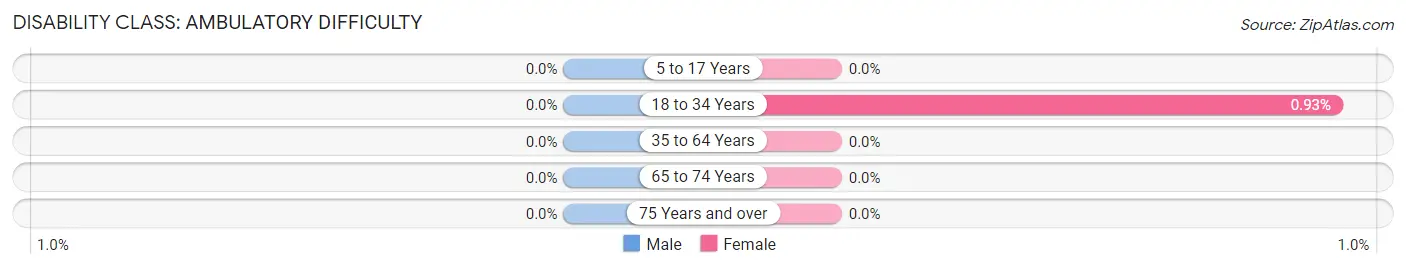
| Age Bracket | Male | Female |
| 5 to 17 Years | 0 (0.0%) | 0 (0.0%) |
| 18 to 34 Years | 0 (0.0%) | 11 (0.9%) |
| 35 to 64 Years | 0 (0.0%) | 0 (0.0%) |
| 65 to 74 Years | 0 (0.0%) | 0 (0.0%) |
| 75 Years and over | 0 (0.0%) | 0 (0.0%) |
Disability Class: Self-Care Difficulty
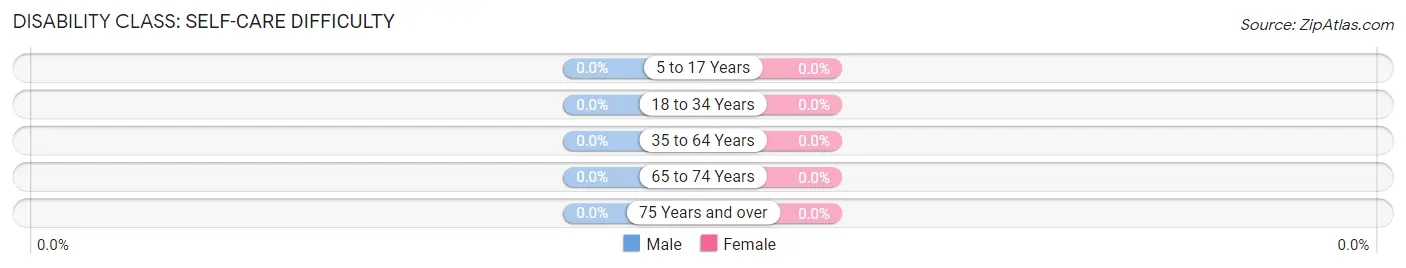
| Age Bracket | Male | Female |
| 5 to 17 Years | 0 (0.0%) | 0 (0.0%) |
| 18 to 34 Years | 0 (0.0%) | 0 (0.0%) |
| 35 to 64 Years | 0 (0.0%) | 0 (0.0%) |
| 65 to 74 Years | 0 (0.0%) | 0 (0.0%) |
| 75 Years and over | 0 (0.0%) | 0 (0.0%) |
Technology Access in Lincoln University
Computing Device Access in Lincoln University
| Device Type | # Households | % Households |
| Desktop or Laptop | 0 | 0.0% |
| Smartphone | 0 | 0.0% |
| Tablet | 0 | 0.0% |
| No Computing Device | 0 | 0.0% |
| Total | 0 | 0.0% |
Internet Access in Lincoln University
| Internet Type | # Households | % Households |
| Dial-Up Internet | 0 | 0.0% |
| Broadband Home | 0 | 0.0% |
| Cellular Data Only | 0 | 0.0% |
| Satellite Internet | 0 | 0.0% |
| No Internet | 0 | 0.0% |
| Total | 0 | 0.0% |
Lincoln University Summary
Lincoln University is a historically black university located in Lincoln University, Pennsylvania. Founded in 1854, it is the first degree-granting Historically Black College and University (HBCU) in the United States. The university is a member of the Thurgood Marshall College Fund and is accredited by the Middle States Commission on Higher Education.
History
Lincoln University was founded in 1854 as the Ashmun Institute, named after Jehudi Ashmun, a leader of the American Colonization Society. The school was established to educate African Americans who had been freed from slavery. The school was renamed Lincoln University in 1866 in honor of President Abraham Lincoln.
In 1872, the school was granted a charter by the Commonwealth of Pennsylvania and began offering college degrees. In the early 20th century, the school was a leader in the civil rights movement, producing many prominent African American leaders, including Thurgood Marshall, Langston Hughes, and Paul Robeson.
Geography
Lincoln University is located in Chester County, Pennsylvania, about 25 miles west of Philadelphia. The university is situated on a rural campus of about 200 acres. The campus is surrounded by rolling hills and farmland.
Economy
Lincoln University is a major economic force in the region. The university employs over 1,000 people and has an annual economic impact of over $100 million. The university also serves as a major employer in the region, providing jobs to local residents.
Demographics
As of 2020, Lincoln University had a total enrollment of 2,845 students. The student body is composed of students from all 50 states and over 40 countries. The student body is also diverse, with African Americans making up the majority of the student body (63%), followed by White (17%), Hispanic (7%), Asian (5%), and other (8%).
The faculty and staff at Lincoln University are also diverse, with African Americans making up the majority of the faculty and staff (60%), followed by White (20%), Hispanic (7%), Asian (5%), and other (8%).
Conclusion
Lincoln University is a historically black university located in Lincoln University, Pennsylvania. Founded in 1854, it is the first degree-granting Historically Black College and University (HBCU) in the United States. The university is a major economic force in the region, employing over 1,000 people and having an annual economic impact of over $100 million. The university also serves as a major employer in the region, providing jobs to local residents. The student body is diverse, with African Americans making up the majority of the student body, followed by White, Hispanic, Asian, and other. The faculty and staff at Lincoln University are also diverse, with African Americans making up the majority of the faculty and staff.
Common Questions
What is Per Capita Income in Lincoln University?
Per Capita income in Lincoln University is $25,411.
What is Income or Wage Gap in Lincoln University?
Income or Wage Gap in Lincoln University is 18.7%.
Women in Lincoln University earn 81.3 cents for every dollar earned by a man.
What is the Total Population of Lincoln University?
Total Population of Lincoln University is 1,984.
What is the Total Male Population of Lincoln University?
Total Male Population of Lincoln University is 780.
What is the Total Female Population of Lincoln University?
Total Female Population of Lincoln University is 1,204.
What is the Ratio of Males per 100 Females in Lincoln University?
There are 64.78 Males per 100 Females in Lincoln University.
What is the Ratio of Females per 100 Males in Lincoln University?
There are 154.36 Females per 100 Males in Lincoln University.
What is the Median Population Age in Lincoln University?
Median Population Age in Lincoln University is 19.7 Years.
How Large is the Labor Force in Lincoln University?
There are 1,093 People in the Labor Forcein in Lincoln University.
What is the Percentage of People in the Labor Force in Lincoln University?
55.1% of People are in the Labor Force in Lincoln University.
What is the Unemployment Rate in Lincoln University?
Unemployment Rate in Lincoln University is 7.9%.