Zip Codes with the Highest Percentage of Population Employed in Food Preparation & Serving in Pittston, PA
RELATED REPORTS & OPTIONS
Food Preparation & Serving
Pittston
Compare Zip Codes
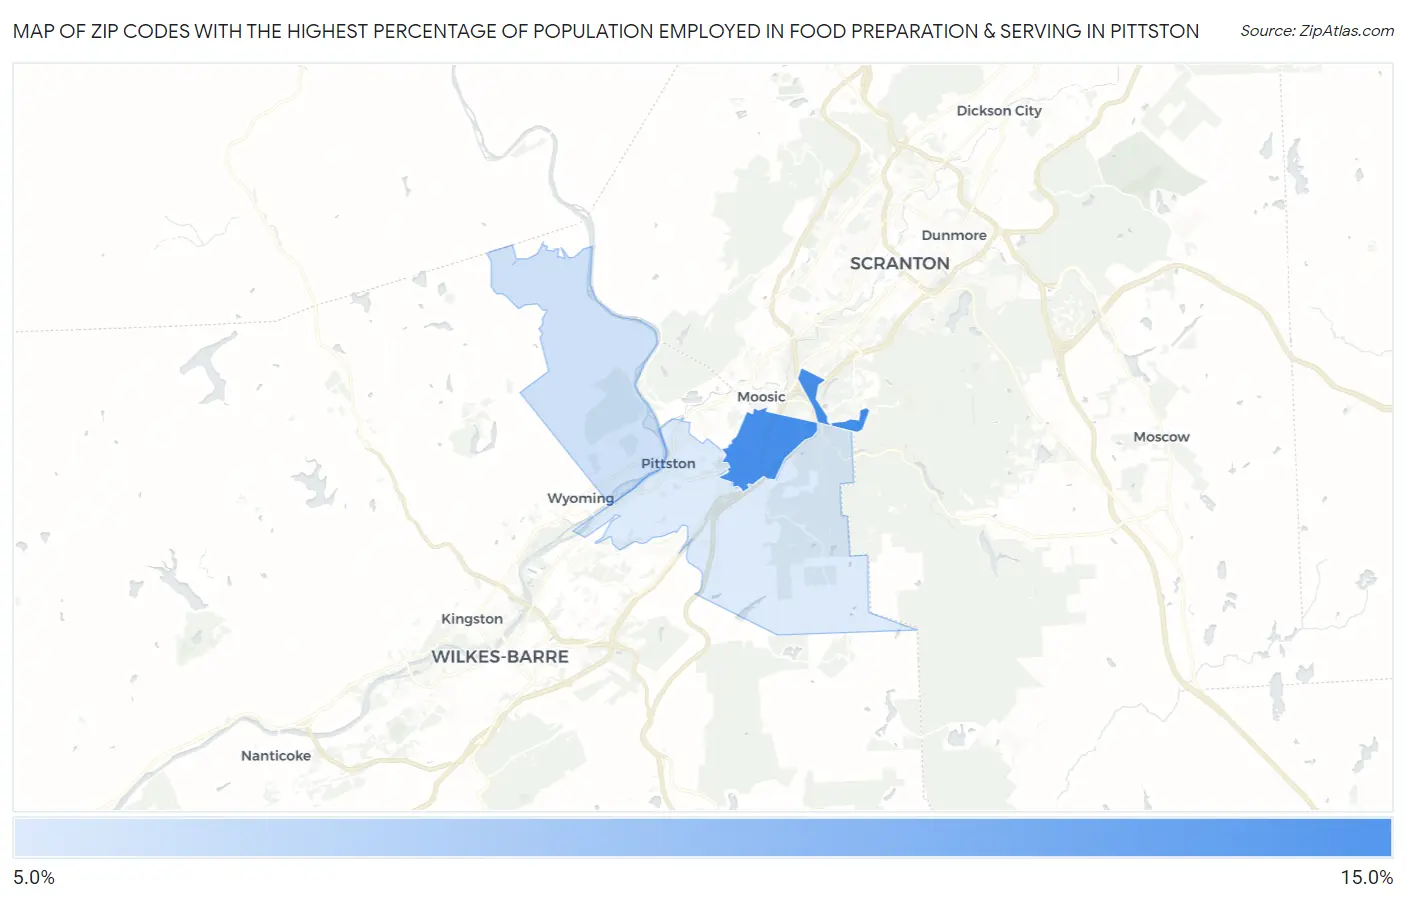
Map of Zip Codes with the Highest Percentage of Population Employed in Food Preparation & Serving in Pittston
5.8%
11.8%
Zip Codes with the Highest Percentage of Population Employed in Food Preparation & Serving in Pittston, PA
| Zip Code | % Employed | vs State | vs National | |
| 1. | 18641 | 11.8% | 5.0%(+6.75)#106 | 5.3%(+6.50)#1,738 |
| 2. | 18643 | 6.4% | 5.0%(+1.33)#434 | 5.3%(+1.08)#8,219 |
| 3. | 18640 | 5.8% | 5.0%(+0.759)#540 | 5.3%(+0.516)#10,031 |
1
Common Questions
What are the Top Zip Codes with the Highest Percentage of Population Employed in Food Preparation & Serving in Pittston, PA?
Top Zip Codes with the Highest Percentage of Population Employed in Food Preparation & Serving in Pittston, PA are:
What zip code has the Highest Percentage of Population Employed in Food Preparation & Serving in Pittston, PA?
18641 has the Highest Percentage of Population Employed in Food Preparation & Serving in Pittston, PA with 11.8%.
What is the Percentage of Population Employed in Food Preparation & Serving in Pittston, PA?
Percentage of Population Employed in Food Preparation & Serving in Pittston is 4.9%.
What is the Percentage of Population Employed in Food Preparation & Serving in Pennsylvania?
Percentage of Population Employed in Food Preparation & Serving in Pennsylvania is 5.0%.
What is the Percentage of Population Employed in Food Preparation & Serving in the United States?
Percentage of Population Employed in Food Preparation & Serving in the United States is 5.3%.