Zip Codes with the Highest Percentage of Population Employed in Food Preparation & Serving in Edinboro, PA
RELATED REPORTS & OPTIONS
Food Preparation & Serving
Edinboro
Compare Zip Codes
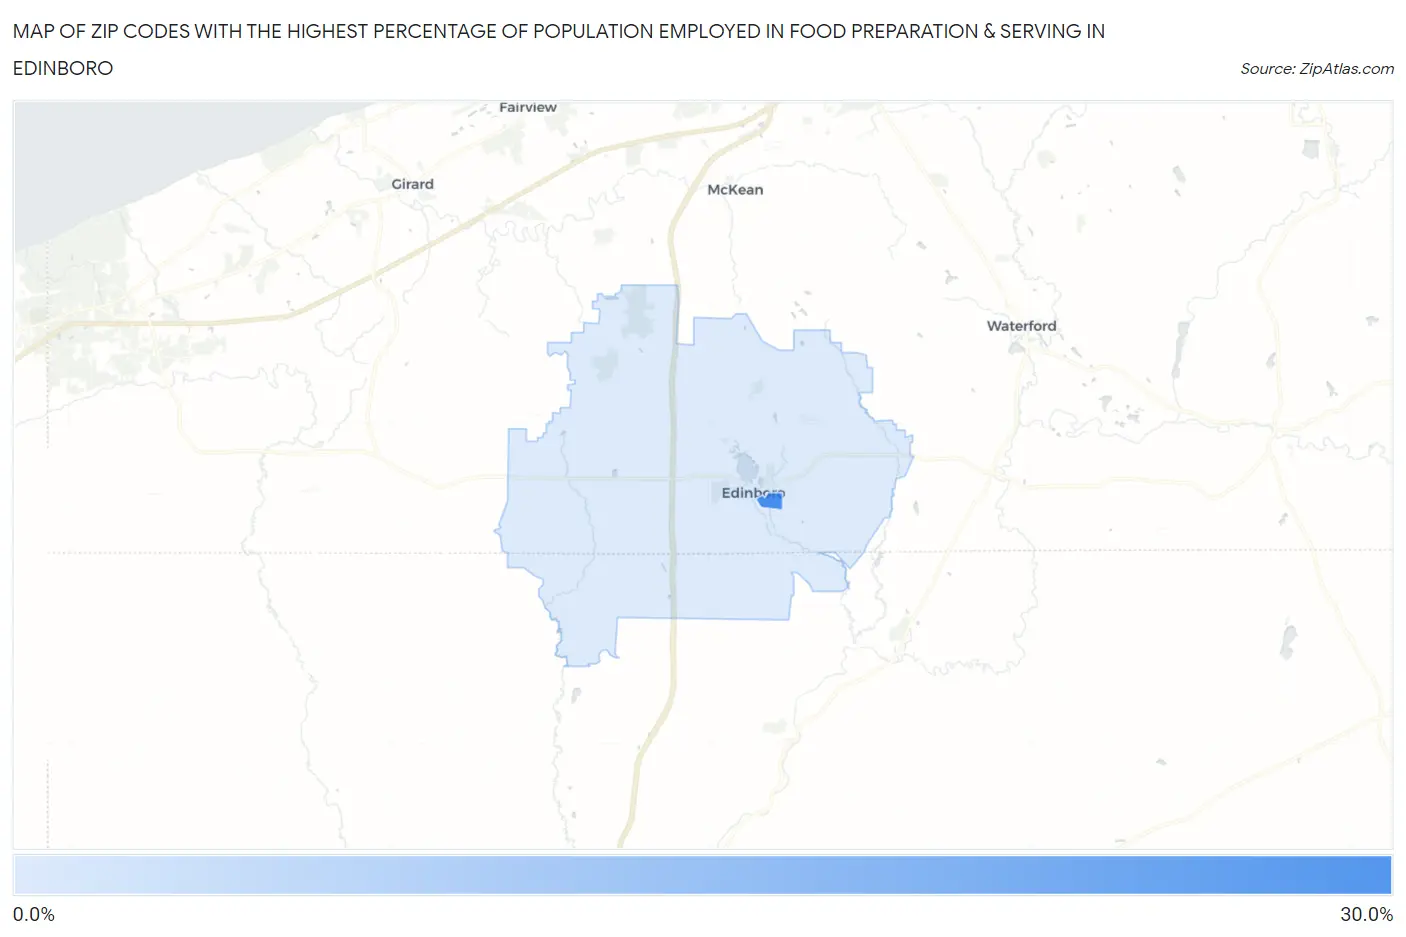
Map of Zip Codes with the Highest Percentage of Population Employed in Food Preparation & Serving in Edinboro
8.8%
26.5%
Zip Codes with the Highest Percentage of Population Employed in Food Preparation & Serving in Edinboro, PA
| Zip Code | % Employed | vs State | vs National | |
| 1. | 16444 | 26.5% | 5.0%(+21.4)#23 | 5.3%(+21.2)#272 |
| 2. | 16412 | 8.8% | 5.0%(+3.72)#195 | 5.3%(+3.48)#3,773 |
1
Common Questions
What are the Top Zip Codes with the Highest Percentage of Population Employed in Food Preparation & Serving in Edinboro, PA?
Top Zip Codes with the Highest Percentage of Population Employed in Food Preparation & Serving in Edinboro, PA are:
What zip code has the Highest Percentage of Population Employed in Food Preparation & Serving in Edinboro, PA?
16444 has the Highest Percentage of Population Employed in Food Preparation & Serving in Edinboro, PA with 26.5%.
What is the Percentage of Population Employed in Food Preparation & Serving in Pennsylvania?
Percentage of Population Employed in Food Preparation & Serving in Pennsylvania is 5.0%.
What is the Percentage of Population Employed in Food Preparation & Serving in the United States?
Percentage of Population Employed in Food Preparation & Serving in the United States is 5.3%.