Brandonville, PA Map & Demographics
Brandonville Map
Brandonville Overview
$25,584
PER CAPITA INCOME
$80,833
AVG FAMILY INCOME
$31,719
AVG HOUSEHOLD INCOME
65.7%
WAGE / INCOME GAP [ % ]
34.3¢/ $1
WAGE / INCOME GAP [ $ ]
0.41
INEQUALITY / GINI INDEX
161
TOTAL POPULATION
94
MALE POPULATION
67
FEMALE POPULATION
140.30
MALES / 100 FEMALES
71.28
FEMALES / 100 MALES
51.6
MEDIAN AGE
3.1
AVG FAMILY SIZE
2.1
AVG HOUSEHOLD SIZE
74
LABOR FORCE [ PEOPLE ]
49.7%
PERCENT IN LABOR FORCE
29.7%
UNEMPLOYMENT RATE
Income in Brandonville
Income Overview in Brandonville
Per Capita Income in Brandonville is $25,584, while median incomes of families and households are $80,833 and $31,719 respectively.
| Characteristic | Number | Measure |
| Per Capita Income | 161 | $25,584 |
| Median Family Income | 34 | $80,833 |
| Mean Family Income | 34 | $70,276 |
| Median Household Income | 77 | $31,719 |
| Mean Household Income | 77 | $54,058 |
| Income Deficit | 34 | $0 |
| Wage / Income Gap (%) | 161 | 65.66% |
| Wage / Income Gap ($) | 161 | 34.34¢ per $1 |
| Gini / Inequality Index | 161 | 0.41 |
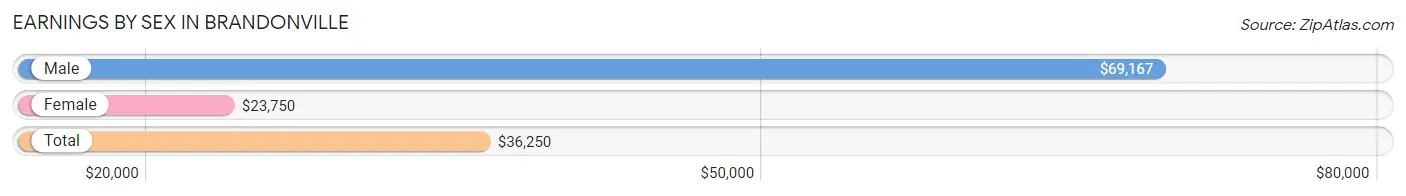
Earnings by Sex in Brandonville
Average Earnings in Brandonville are $36,250, $69,167 for men and $23,750 for women, a difference of 65.7%.
| Sex | Number | Average Earnings |
| Male | 38 (58.5%) | $69,167 |
| Female | 27 (41.5%) | $23,750 |
| Total | 65 (100.0%) | $36,250 |
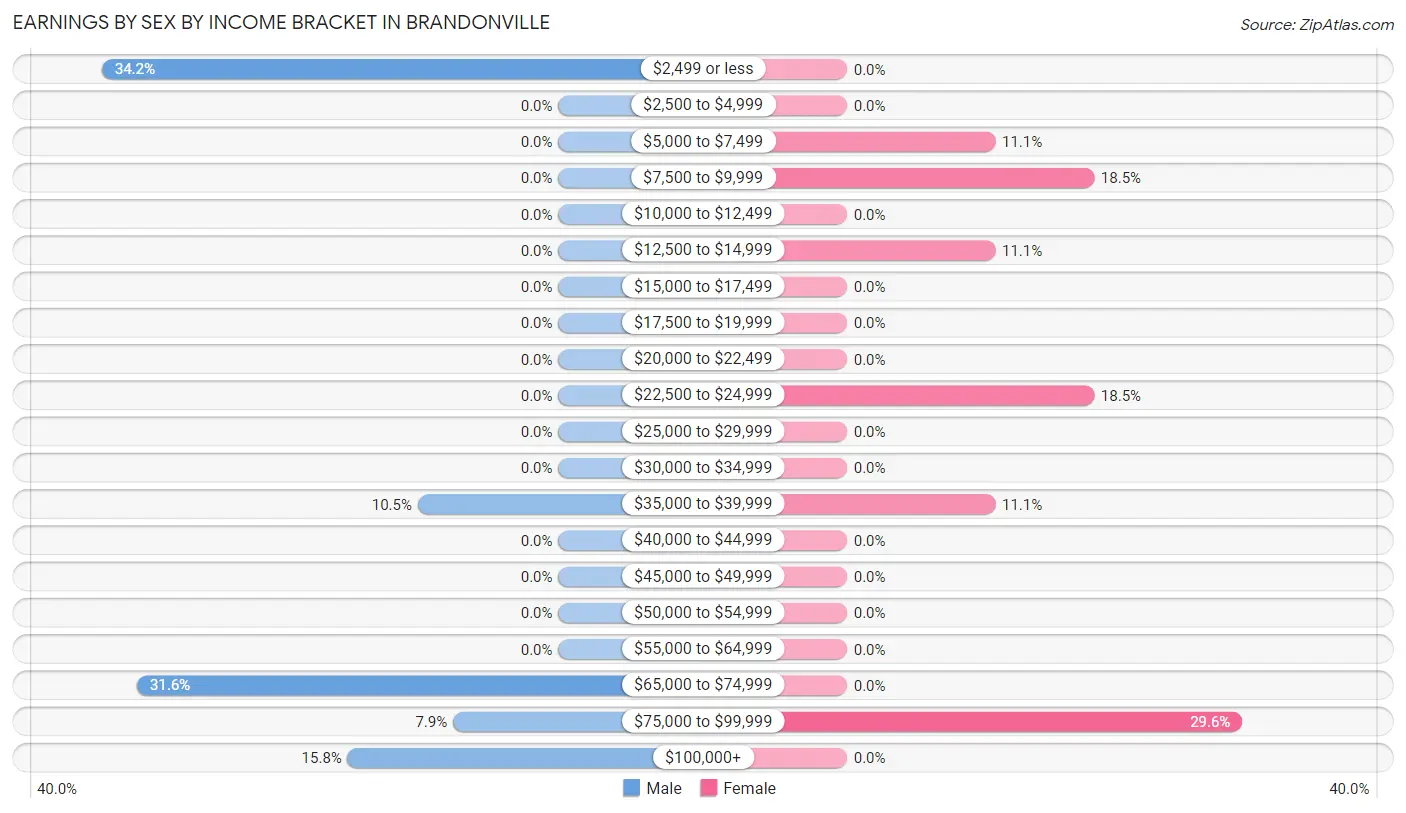
Earnings by Sex by Income Bracket in Brandonville
The most common earnings brackets in Brandonville are $2,499 or less for men (13 | 34.2%) and $75,000 to $99,999 for women (8 | 29.6%).
| Income | Male | Female |
| $2,499 or less | 13 (34.2%) | 0 (0.0%) |
| $2,500 to $4,999 | 0 (0.0%) | 0 (0.0%) |
| $5,000 to $7,499 | 0 (0.0%) | 3 (11.1%) |
| $7,500 to $9,999 | 0 (0.0%) | 5 (18.5%) |
| $10,000 to $12,499 | 0 (0.0%) | 0 (0.0%) |
| $12,500 to $14,999 | 0 (0.0%) | 3 (11.1%) |
| $15,000 to $17,499 | 0 (0.0%) | 0 (0.0%) |
| $17,500 to $19,999 | 0 (0.0%) | 0 (0.0%) |
| $20,000 to $22,499 | 0 (0.0%) | 0 (0.0%) |
| $22,500 to $24,999 | 0 (0.0%) | 5 (18.5%) |
| $25,000 to $29,999 | 0 (0.0%) | 0 (0.0%) |
| $30,000 to $34,999 | 0 (0.0%) | 0 (0.0%) |
| $35,000 to $39,999 | 4 (10.5%) | 3 (11.1%) |
| $40,000 to $44,999 | 0 (0.0%) | 0 (0.0%) |
| $45,000 to $49,999 | 0 (0.0%) | 0 (0.0%) |
| $50,000 to $54,999 | 0 (0.0%) | 0 (0.0%) |
| $55,000 to $64,999 | 0 (0.0%) | 0 (0.0%) |
| $65,000 to $74,999 | 12 (31.6%) | 0 (0.0%) |
| $75,000 to $99,999 | 3 (7.9%) | 8 (29.6%) |
| $100,000+ | 6 (15.8%) | 0 (0.0%) |
| Total | 38 (100.0%) | 27 (100.0%) |
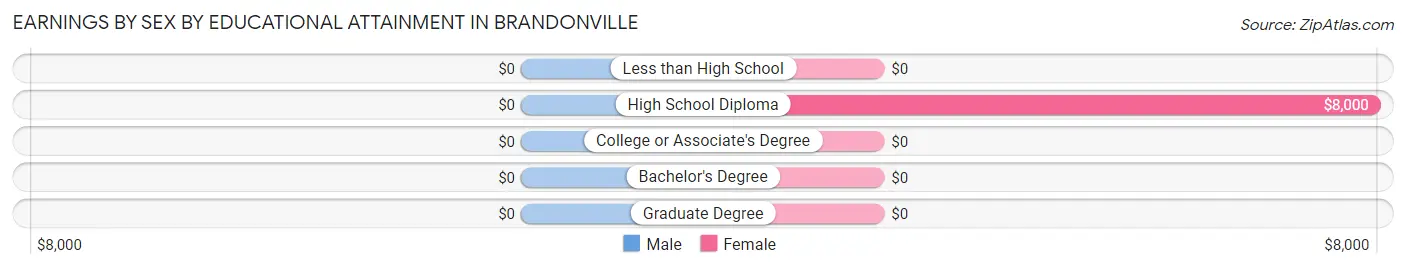
Earnings by Sex by Educational Attainment in Brandonville
| Educational Attainment | Male Income | Female Income |
| Less than High School | - | - |
| High School Diploma | - | - |
| College or Associate's Degree | - | - |
| Bachelor's Degree | - | - |
| Graduate Degree | - | - |
| Total | $71,250 | $0 |
Family Income in Brandonville
Family Income Brackets in Brandonville
According to the Brandonville family income data, there are 15 families falling into the $100,000 to $149,999 income range, which is the most common income bracket and makes up 44.1% of all families.
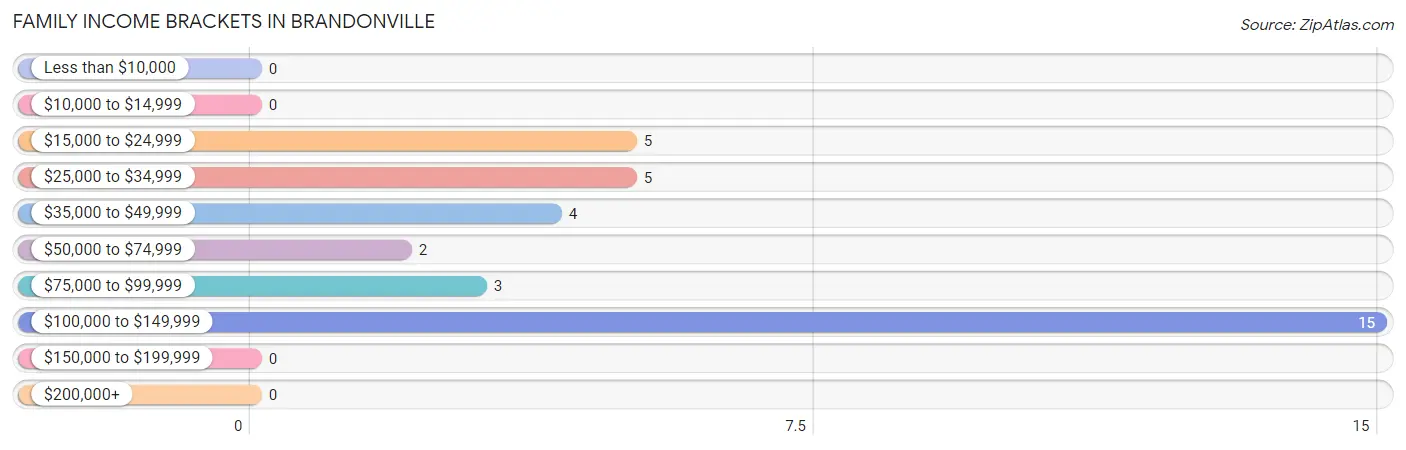
| Income Bracket | # Families | % Families |
| Less than $10,000 | 0 | 0.0% |
| $10,000 to $14,999 | 0 | 0.0% |
| $15,000 to $24,999 | 5 | 14.7% |
| $25,000 to $34,999 | 5 | 14.7% |
| $35,000 to $49,999 | 4 | 11.8% |
| $50,000 to $74,999 | 2 | 5.9% |
| $75,000 to $99,999 | 3 | 8.8% |
| $100,000 to $149,999 | 15 | 44.1% |
| $150,000 to $199,999 | 0 | 0.0% |
| $200,000+ | 0 | 0.0% |
Family Income by Famaliy Size in Brandonville
2-person families (16 | 47.1%) account for the highest median family income in Brandonville with $35,625 per family, while 2-person families (16 | 47.1%) have the highest median income of $17,812 per family member.
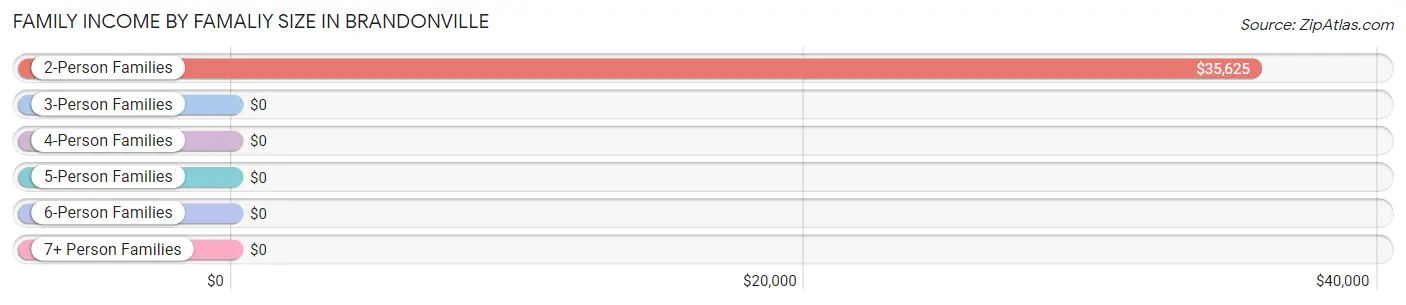
| Income Bracket | # Families | Median Income |
| 2-Person Families | 16 (47.1%) | $35,625 |
| 3-Person Families | 11 (32.4%) | $0 |
| 4-Person Families | 3 (8.8%) | $0 |
| 5-Person Families | 0 (0.0%) | $0 |
| 6-Person Families | 0 (0.0%) | $0 |
| 7+ Person Families | 4 (11.8%) | $0 |
| Total | 34 (100.0%) | $80,833 |
Family Income by Number of Earners in Brandonville
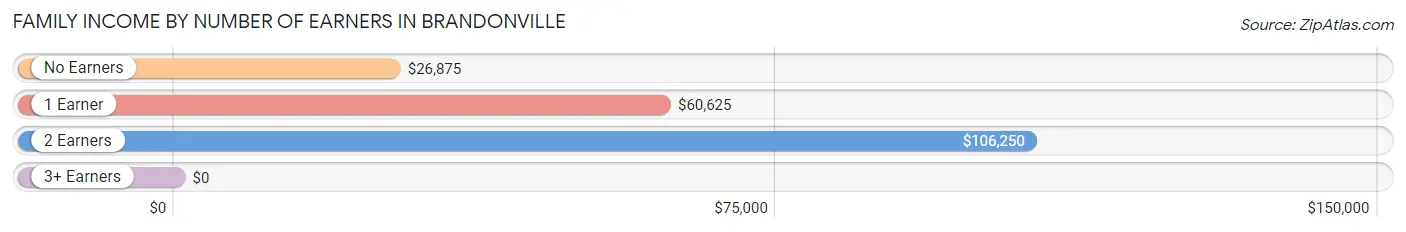
| Number of Earners | # Families | Median Income |
| No Earners | 7 (20.6%) | $26,875 |
| 1 Earner | 9 (26.5%) | $60,625 |
| 2 Earners | 18 (52.9%) | $106,250 |
| 3+ Earners | 0 (0.0%) | $0 |
| Total | 34 (100.0%) | $80,833 |
Household Income in Brandonville
Household Income Brackets in Brandonville
With 24 households falling in the category, the $100,000 to $149,999 income range is the most frequent in Brandonville, accounting for 31.2% of all households.
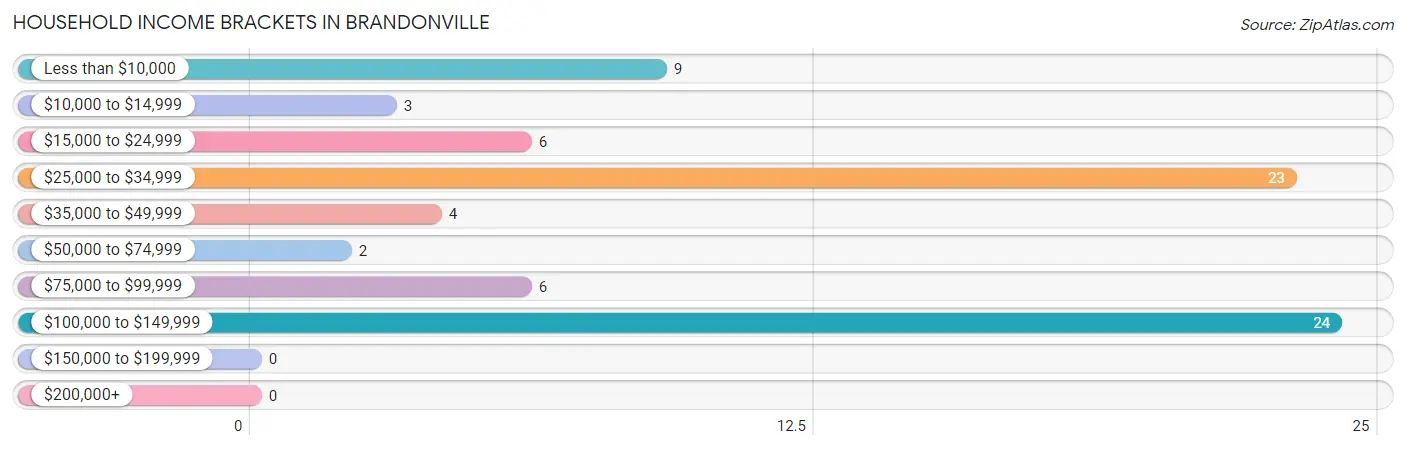
| Income Bracket | # Households | % Households |
| Less than $10,000 | 9 | 11.7% |
| $10,000 to $14,999 | 3 | 3.9% |
| $15,000 to $24,999 | 6 | 7.8% |
| $25,000 to $34,999 | 23 | 29.9% |
| $35,000 to $49,999 | 4 | 5.2% |
| $50,000 to $74,999 | 2 | 2.6% |
| $75,000 to $99,999 | 6 | 7.8% |
| $100,000 to $149,999 | 24 | 31.2% |
| $150,000 to $199,999 | 0 | 0.0% |
| $200,000+ | 0 | 0.0% |
Household Income by Householder Age in Brandonville
The median household income in Brandonville is $31,719, with the highest median household income of $30,938 found in the 65+ years age bracket for the primary householder. A total of 26 households (33.8%) fall into this category.
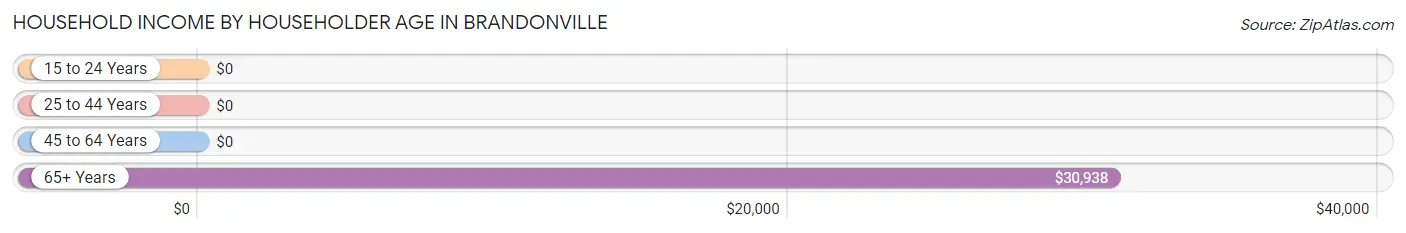
| Income Bracket | # Households | Median Income |
| 15 to 24 Years | 0 (0.0%) | $0 |
| 25 to 44 Years | 7 (9.1%) | $0 |
| 45 to 64 Years | 44 (57.1%) | $0 |
| 65+ Years | 26 (33.8%) | $30,938 |
| Total | 77 (100.0%) | $31,719 |
Poverty in Brandonville
Income Below Poverty by Sex and Age in Brandonville
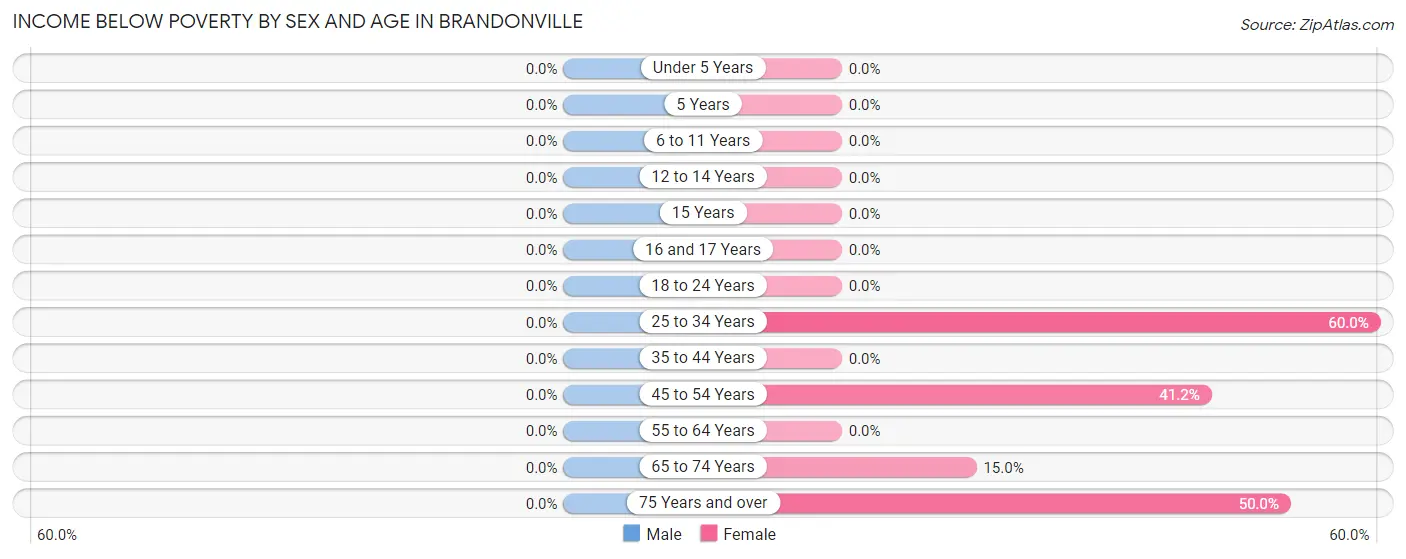
| Age Bracket | Male | Female |
| Under 5 Years | 0 (0.0%) | 0 (0.0%) |
| 5 Years | 0 (0.0%) | 0 (0.0%) |
| 6 to 11 Years | 0 (0.0%) | 0 (0.0%) |
| 12 to 14 Years | 0 (0.0%) | 0 (0.0%) |
| 15 Years | 0 (0.0%) | 0 (0.0%) |
| 16 and 17 Years | 0 (0.0%) | 0 (0.0%) |
| 18 to 24 Years | 0 (0.0%) | 0 (0.0%) |
| 25 to 34 Years | 0 (0.0%) | 3 (60.0%) |
| 35 to 44 Years | 0 (0.0%) | 0 (0.0%) |
| 45 to 54 Years | 0 (0.0%) | 7 (41.2%) |
| 55 to 64 Years | 0 (0.0%) | 0 (0.0%) |
| 65 to 74 Years | 0 (0.0%) | 3 (15.0%) |
| 75 Years and over | 0 (0.0%) | 2 (50.0%) |
| Total | 0 (0.0%) | 15 (22.4%) |
Income Above Poverty by Sex and Age in Brandonville
According to the poverty statistics in Brandonville, males aged under 5 years and females aged 6 to 11 years are the age groups that are most secure financially, with 100.0% of males and 100.0% of females in these age groups living above the poverty line.
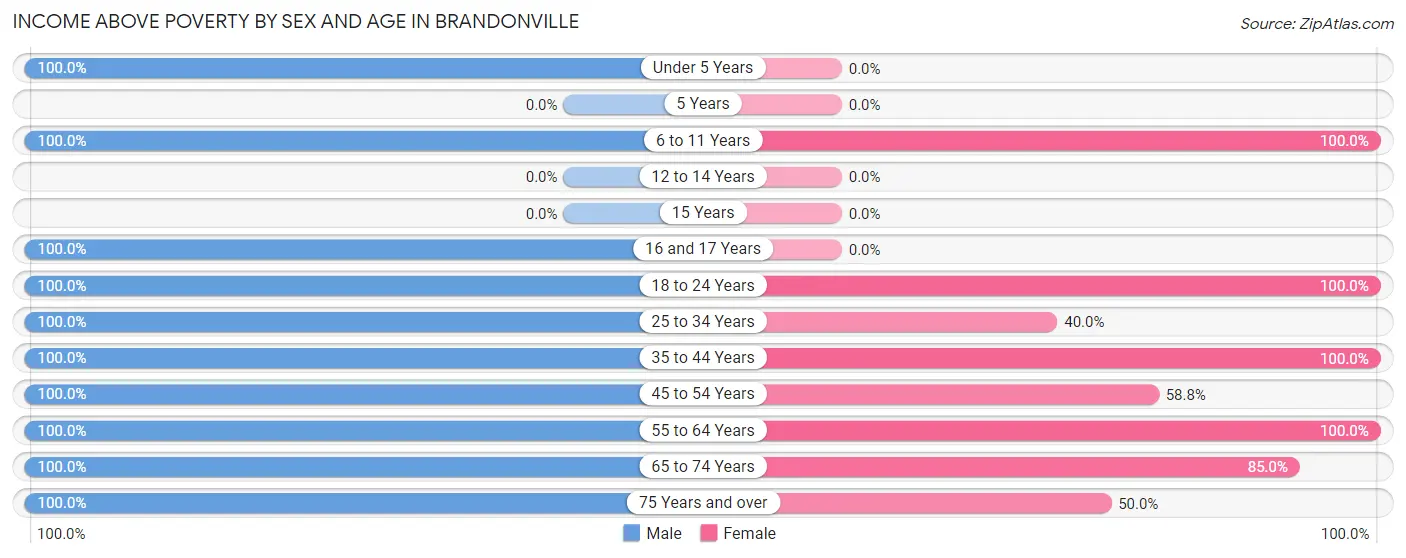
| Age Bracket | Male | Female |
| Under 5 Years | 3 (100.0%) | 0 (0.0%) |
| 5 Years | 0 (0.0%) | 0 (0.0%) |
| 6 to 11 Years | 6 (100.0%) | 3 (100.0%) |
| 12 to 14 Years | 0 (0.0%) | 0 (0.0%) |
| 15 Years | 0 (0.0%) | 0 (0.0%) |
| 16 and 17 Years | 4 (100.0%) | 0 (0.0%) |
| 18 to 24 Years | 11 (100.0%) | 5 (100.0%) |
| 25 to 34 Years | 4 (100.0%) | 2 (40.0%) |
| 35 to 44 Years | 7 (100.0%) | 6 (100.0%) |
| 45 to 54 Years | 19 (100.0%) | 10 (58.8%) |
| 55 to 64 Years | 28 (100.0%) | 7 (100.0%) |
| 65 to 74 Years | 5 (100.0%) | 17 (85.0%) |
| 75 Years and over | 7 (100.0%) | 2 (50.0%) |
| Total | 94 (100.0%) | 52 (77.6%) |
Income Below Poverty Among Married-Couple Families in Brandonville
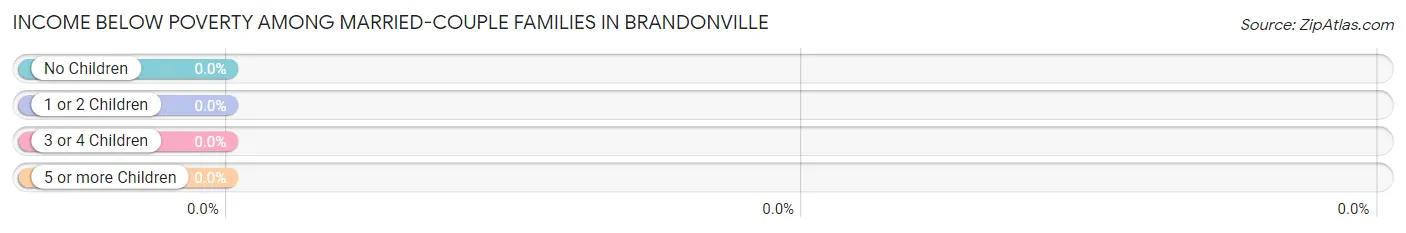
| Children | Above Poverty | Below Poverty |
| No Children | 18 (100.0%) | 0 (0.0%) |
| 1 or 2 Children | 4 (100.0%) | 0 (0.0%) |
| 3 or 4 Children | 0 (0.0%) | 0 (0.0%) |
| 5 or more Children | 0 (0.0%) | 0 (0.0%) |
| Total | 22 (100.0%) | 0 (0.0%) |
Income Below Poverty Among Single-Parent Households in Brandonville
| Children | Single Father | Single Mother |
| No Children | 0 (0.0%) | 0 (0.0%) |
| 1 or 2 Children | 0 (0.0%) | 0 (0.0%) |
| 3 or 4 Children | 0 (0.0%) | 0 (0.0%) |
| 5 or more Children | 0 (0.0%) | 0 (0.0%) |
| Total | 0 (0.0%) | 0 (0.0%) |
Income Below Poverty Among Married-Couple vs Single-Parent Households in Brandonville
| Children | Married-Couple Families | Single-Parent Households |
| No Children | 0 (0.0%) | 0 (0.0%) |
| 1 or 2 Children | 0 (0.0%) | 0 (0.0%) |
| 3 or 4 Children | 0 (0.0%) | 0 (0.0%) |
| 5 or more Children | 0 (0.0%) | 0 (0.0%) |
| Total | 0 (0.0%) | 0 (0.0%) |
Race in Brandonville
The most populous races in Brandonville are White / Caucasian (161 | 100.0%), and Hispanic or Latino (12 | 7.4%).
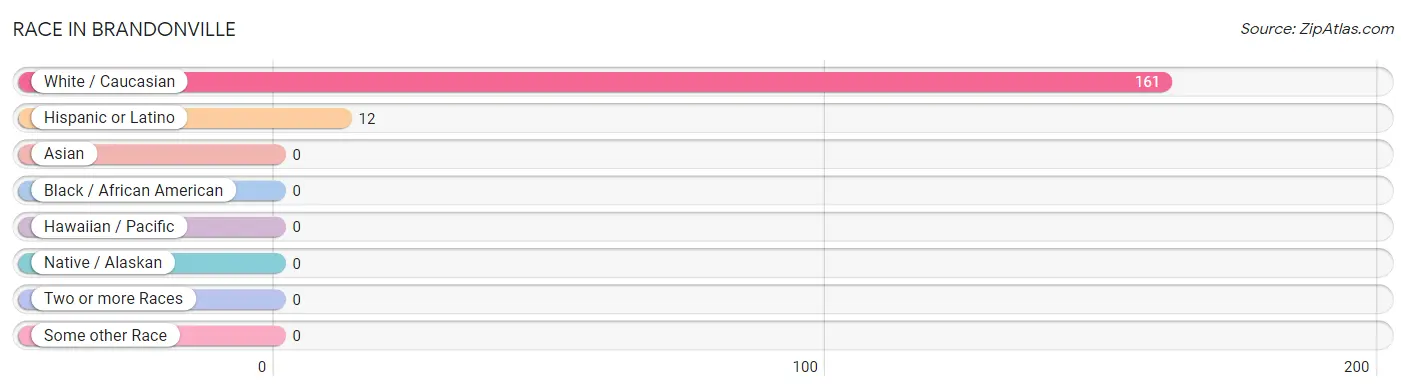
| Race | # Population | % Population |
| Asian | 0 | 0.0% |
| Black / African American | 0 | 0.0% |
| Hawaiian / Pacific | 0 | 0.0% |
| Hispanic or Latino | 12 | 7.4% |
| Native / Alaskan | 0 | 0.0% |
| White / Caucasian | 161 | 100.0% |
| Two or more Races | 0 | 0.0% |
| Some other Race | 0 | 0.0% |
| Total | 161 | 100.0% |
Ancestry in Brandonville
The most populous ancestries reported in Brandonville are Italian (52 | 32.3%), Greek (25 | 15.5%), Polish (23 | 14.3%), German (16 | 9.9%), and Dutch (15 | 9.3%), together accounting for 81.4% of all Brandonville residents.
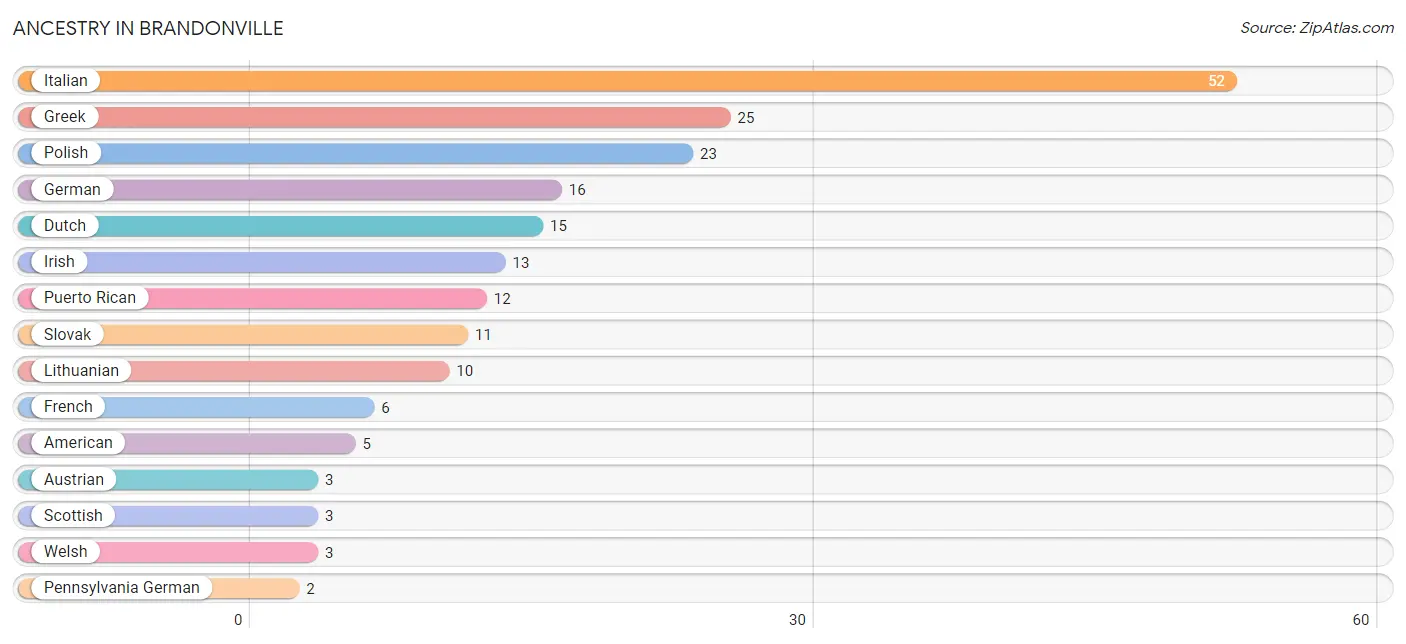
| Ancestry | # Population | % Population |
| American | 5 | 3.1% |
| Austrian | 3 | 1.9% |
| Dutch | 15 | 9.3% |
| French | 6 | 3.7% |
| German | 16 | 9.9% |
| Greek | 25 | 15.5% |
| Irish | 13 | 8.1% |
| Italian | 52 | 32.3% |
| Lithuanian | 10 | 6.2% |
| Pennsylvania German | 2 | 1.2% |
| Polish | 23 | 14.3% |
| Puerto Rican | 12 | 7.4% |
| Scottish | 3 | 1.9% |
| Slovak | 11 | 6.8% |
| Welsh | 3 | 1.9% | View All 15 Rows |
Immigrants in Brandonville

| Immigration Origin | # Population | % Population | View All 0 Rows |
Sex and Age in Brandonville
Sex and Age in Brandonville
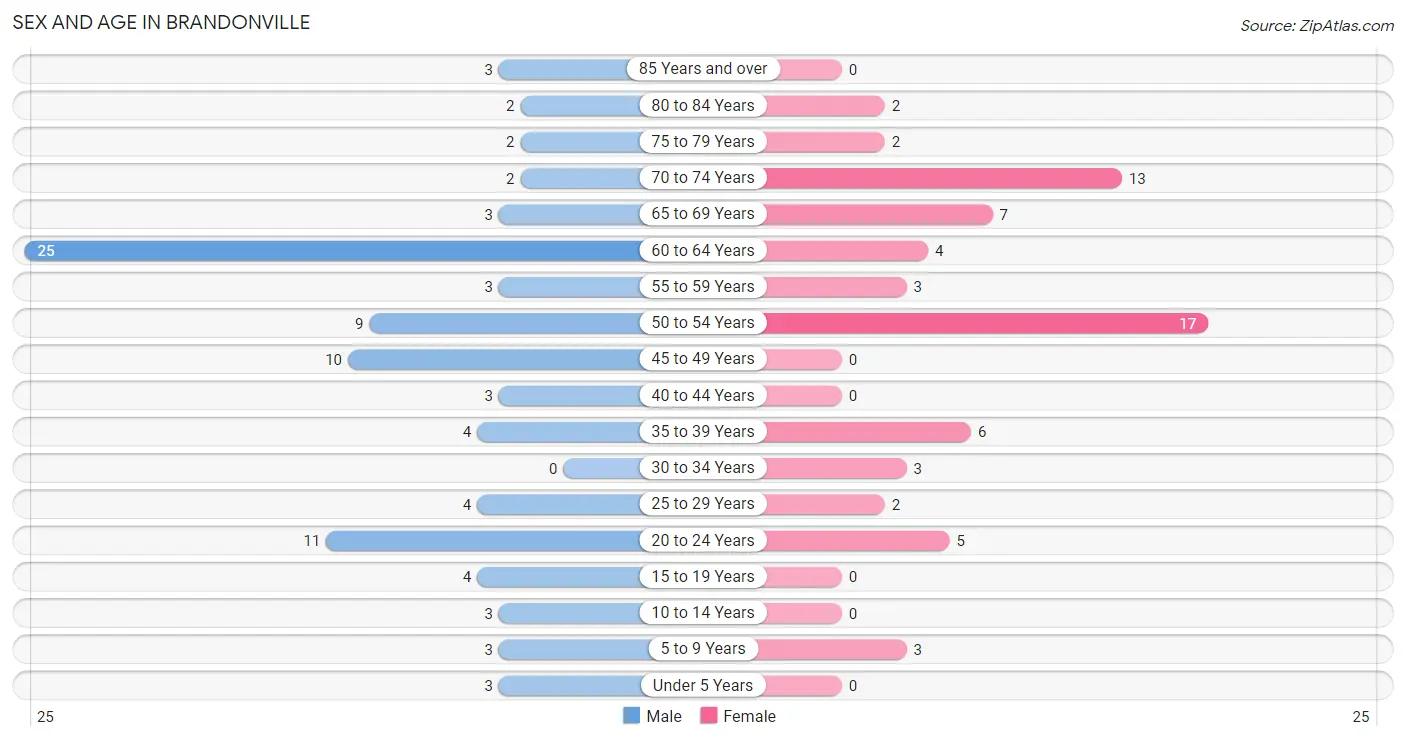
The most populous age groups in Brandonville are 60 to 64 Years (25 | 26.6%) for men and 50 to 54 Years (17 | 25.4%) for women.
| Age Bracket | Male | Female |
| Under 5 Years | 3 (3.2%) | 0 (0.0%) |
| 5 to 9 Years | 3 (3.2%) | 3 (4.5%) |
| 10 to 14 Years | 3 (3.2%) | 0 (0.0%) |
| 15 to 19 Years | 4 (4.3%) | 0 (0.0%) |
| 20 to 24 Years | 11 (11.7%) | 5 (7.5%) |
| 25 to 29 Years | 4 (4.3%) | 2 (3.0%) |
| 30 to 34 Years | 0 (0.0%) | 3 (4.5%) |
| 35 to 39 Years | 4 (4.3%) | 6 (9.0%) |
| 40 to 44 Years | 3 (3.2%) | 0 (0.0%) |
| 45 to 49 Years | 10 (10.6%) | 0 (0.0%) |
| 50 to 54 Years | 9 (9.6%) | 17 (25.4%) |
| 55 to 59 Years | 3 (3.2%) | 3 (4.5%) |
| 60 to 64 Years | 25 (26.6%) | 4 (6.0%) |
| 65 to 69 Years | 3 (3.2%) | 7 (10.4%) |
| 70 to 74 Years | 2 (2.1%) | 13 (19.4%) |
| 75 to 79 Years | 2 (2.1%) | 2 (3.0%) |
| 80 to 84 Years | 2 (2.1%) | 2 (3.0%) |
| 85 Years and over | 3 (3.2%) | 0 (0.0%) |
| Total | 94 (100.0%) | 67 (100.0%) |
Families and Households in Brandonville
Median Family Size in Brandonville
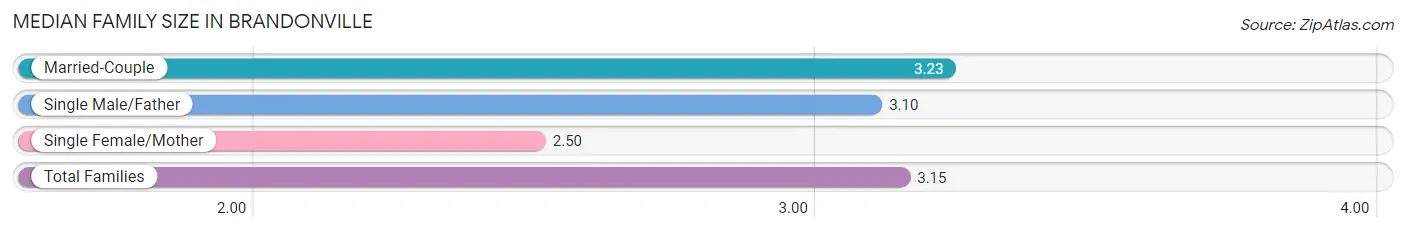
The median family size in Brandonville is 3.15 persons per family, with married-couple families (22 | 64.7%) accounting for the largest median family size of 3.23 persons per family. On the other hand, single female/mother families (2 | 5.9%) represent the smallest median family size with 2.50 persons per family.
| Family Type | # Families | Family Size |
| Married-Couple | 22 (64.7%) | 3.23 |
| Single Male/Father | 10 (29.4%) | 3.10 |
| Single Female/Mother | 2 (5.9%) | 2.50 |
| Total Families | 34 (100.0%) | 3.15 |
Median Household Size in Brandonville
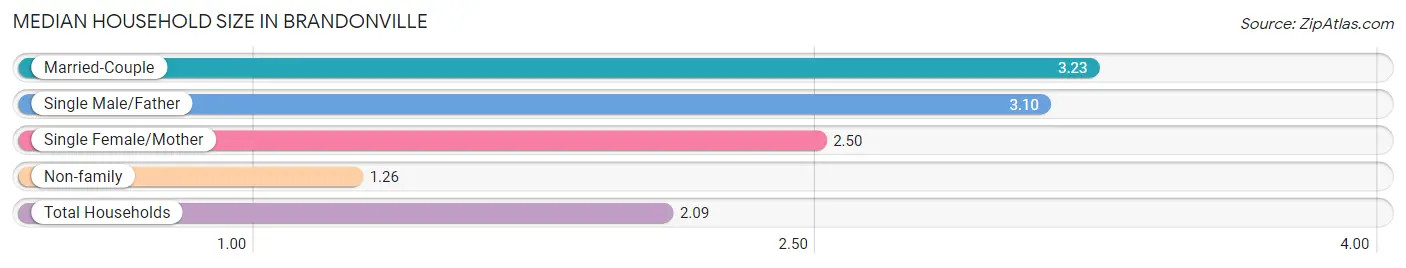
The median household size in Brandonville is 2.09 persons per household, with married-couple households (22 | 28.6%) accounting for the largest median household size of 3.23 persons per household. non-family households (43 | 55.8%) represent the smallest median household size with 1.26 persons per household.
| Household Type | # Households | Household Size |
| Married-Couple | 22 (28.6%) | 3.23 |
| Single Male/Father | 10 (13.0%) | 3.10 |
| Single Female/Mother | 2 (2.6%) | 2.50 |
| Non-family | 43 (55.8%) | 1.26 |
| Total Households | 77 (100.0%) | 2.09 |
Household Size by Marriage Status in Brandonville
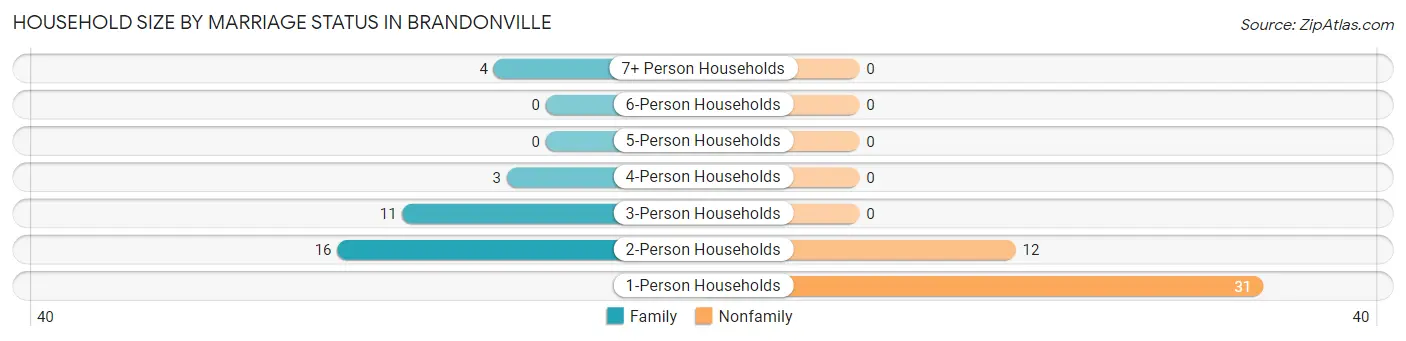
Out of a total of 77 households in Brandonville, 34 (44.2%) are family households, while 43 (55.8%) are nonfamily households. The most numerous type of family households are 2-person households, comprising 16, and the most common type of nonfamily households are 1-person households, comprising 31.
| Household Size | Family Households | Nonfamily Households |
| 1-Person Households | - | 31 (40.3%) |
| 2-Person Households | 16 (20.8%) | 12 (15.6%) |
| 3-Person Households | 11 (14.3%) | 0 (0.0%) |
| 4-Person Households | 3 (3.9%) | 0 (0.0%) |
| 5-Person Households | 0 (0.0%) | 0 (0.0%) |
| 6-Person Households | 0 (0.0%) | 0 (0.0%) |
| 7+ Person Households | 4 (5.2%) | 0 (0.0%) |
| Total | 34 (44.2%) | 43 (55.8%) |
Female Fertility in Brandonville
Fertility by Age in Brandonville
| Age Bracket | Women with Births | Births / 1,000 Women |
| 15 to 19 years | 0 (0.0%) | 0.0 |
| 20 to 34 years | 0 (0.0%) | 0.0 |
| 35 to 50 years | 0 (0.0%) | 0.0 |
| Total | 0 (0.0%) | 0.0 |
Fertility by Age by Marriage Status in Brandonville
| Age Bracket | Married | Unmarried |
| 15 to 19 years | 0 (0.0%) | 0 (0.0%) |
| 20 to 34 years | 0 (0.0%) | 0 (0.0%) |
| 35 to 50 years | 0 (0.0%) | 0 (0.0%) |
| Total | 0 (0.0%) | 0 (0.0%) |
Fertility by Education in Brandonville
| Educational Attainment | Women with Births | Births / 1,000 Women |
| Less than High School | 0 (0.0%) | 0.0 |
| High School Diploma | 0 (0.0%) | 0.0 |
| College or Associate's Degree | 0 (0.0%) | 0.0 |
| Bachelor's Degree | 0 (0.0%) | 0.0 |
| Graduate Degree | 0 (0.0%) | 0.0 |
| Total | 0 (0.0%) | 0.0 |
Fertility by Education by Marriage Status in Brandonville
| Educational Attainment | Married | Unmarried |
| Less than High School | 0 (0.0%) | 0 (0.0%) |
| High School Diploma | 0 (0.0%) | 0 (0.0%) |
| College or Associate's Degree | 0 (0.0%) | 0 (0.0%) |
| Bachelor's Degree | 0 (0.0%) | 0 (0.0%) |
| Graduate Degree | 0 (0.0%) | 0 (0.0%) |
| Total | 0 (0.0%) | 0 (0.0%) |
Employment Characteristics in Brandonville
Employment by Class of Employer in Brandonville
Among the 52 employed individuals in Brandonville, private company employees (39 | 75.0%), state government employees (6 | 11.5%), and not-for-profit organizations (4 | 7.7%) make up the most common classes of employment.
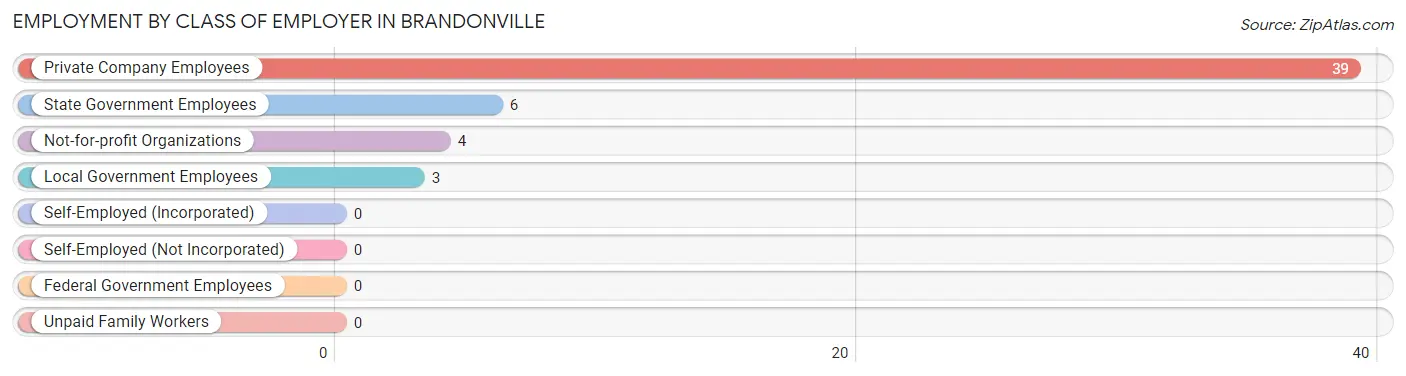
| Employer Class | # Employees | % Employees |
| Private Company Employees | 39 | 75.0% |
| Self-Employed (Incorporated) | 0 | 0.0% |
| Self-Employed (Not Incorporated) | 0 | 0.0% |
| Not-for-profit Organizations | 4 | 7.7% |
| Local Government Employees | 3 | 5.8% |
| State Government Employees | 6 | 11.5% |
| Federal Government Employees | 0 | 0.0% |
| Unpaid Family Workers | 0 | 0.0% |
| Total | 52 | 100.0% |
Employment Status by Age in Brandonville
According to the labor force statistics for Brandonville, out of the total population over 16 years of age (149), 49.7% or 74 individuals are in the labor force, with 29.7% or 22 of them unemployed. The age group with the highest labor force participation rate is 16 to 19 years, with 100.0% or 4 individuals in the labor force. Within the labor force, the 20 to 24 years age range has the highest percentage of unemployed individuals, with 68.8% or 11 of them being unemployed.
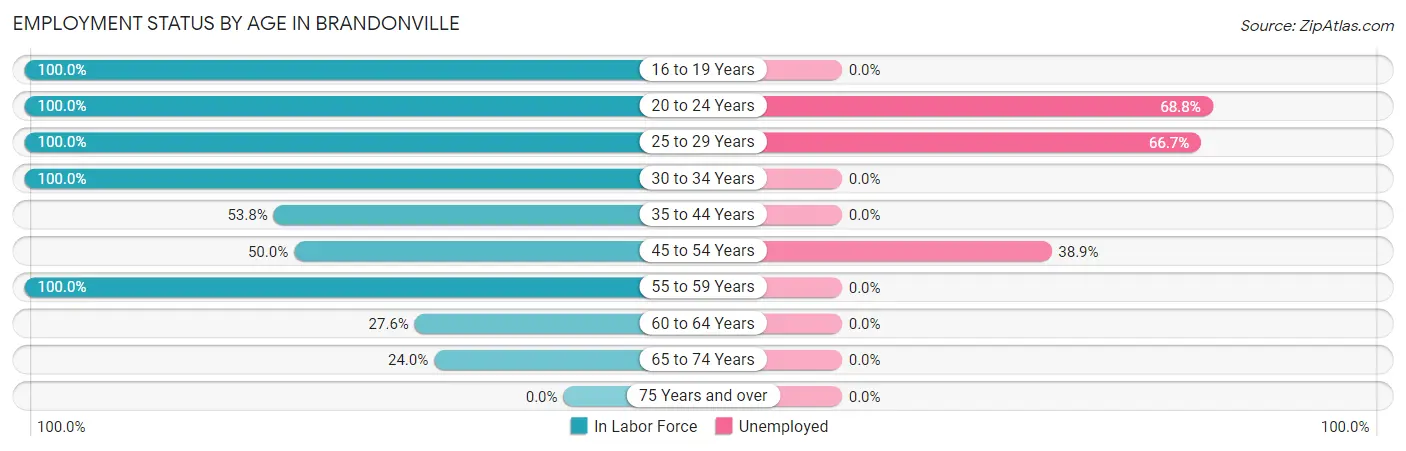
| Age Bracket | In Labor Force | Unemployed |
| 16 to 19 Years | 4 (100.0%) | 0 (0.0%) |
| 20 to 24 Years | 16 (100.0%) | 11 (68.8%) |
| 25 to 29 Years | 6 (100.0%) | 4 (66.7%) |
| 30 to 34 Years | 3 (100.0%) | 0 (0.0%) |
| 35 to 44 Years | 7 (53.8%) | 0 (0.0%) |
| 45 to 54 Years | 18 (50.0%) | 7 (38.9%) |
| 55 to 59 Years | 6 (100.0%) | 0 (0.0%) |
| 60 to 64 Years | 8 (27.6%) | 0 (0.0%) |
| 65 to 74 Years | 6 (24.0%) | 0 (0.0%) |
| 75 Years and over | 0 (0.0%) | 0 (0.0%) |
| Total | 74 (49.7%) | 22 (29.7%) |
Employment Status by Educational Attainment in Brandonville
According to labor force statistics for Brandonville, 51.6% of individuals (48) out of the total population between 25 and 64 years of age (93) are in the labor force, with 22.9% or 11 of them being unemployed. The group with the highest labor force participation rate are those with the educational attainment of college / associate degree, with 77.8% or 21 individuals in the labor force. Within the labor force, individuals with less than high school education have the highest percentage of unemployment, with 100.0% or 4 of them being unemployed.
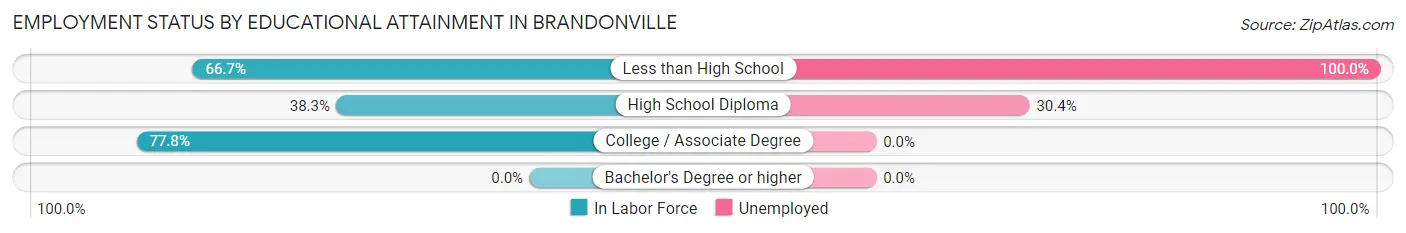
| Educational Attainment | In Labor Force | Unemployed |
| Less than High School | 4 (66.7%) | 6 (100.0%) |
| High School Diploma | 23 (38.3%) | 18 (30.4%) |
| College / Associate Degree | 21 (77.8%) | 0 (0.0%) |
| Bachelor's Degree or higher | 0 (0.0%) | 0 (0.0%) |
| Total | 48 (51.6%) | 21 (22.9%) |
Employment Occupations by Sex in Brandonville
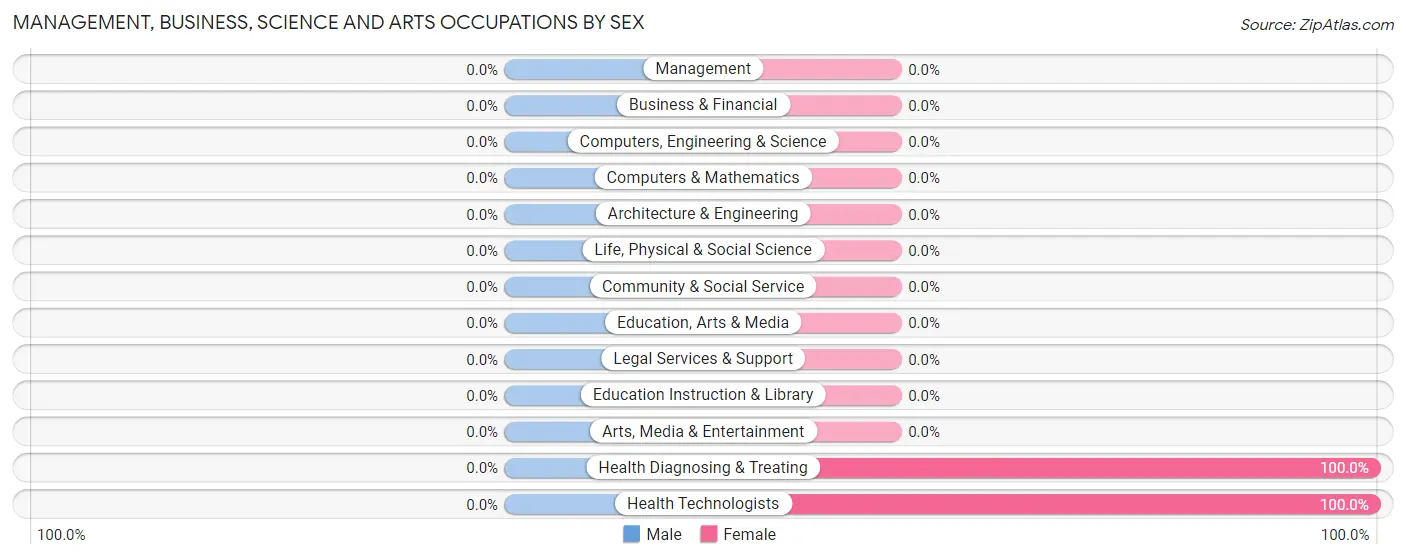
Management, Business, Science and Arts Occupations
The most common Management, Business, Science and Arts occupations in Brandonville are Health Diagnosing & Treating (11 | 21.1%), and Health Technologists (8 | 15.4%).
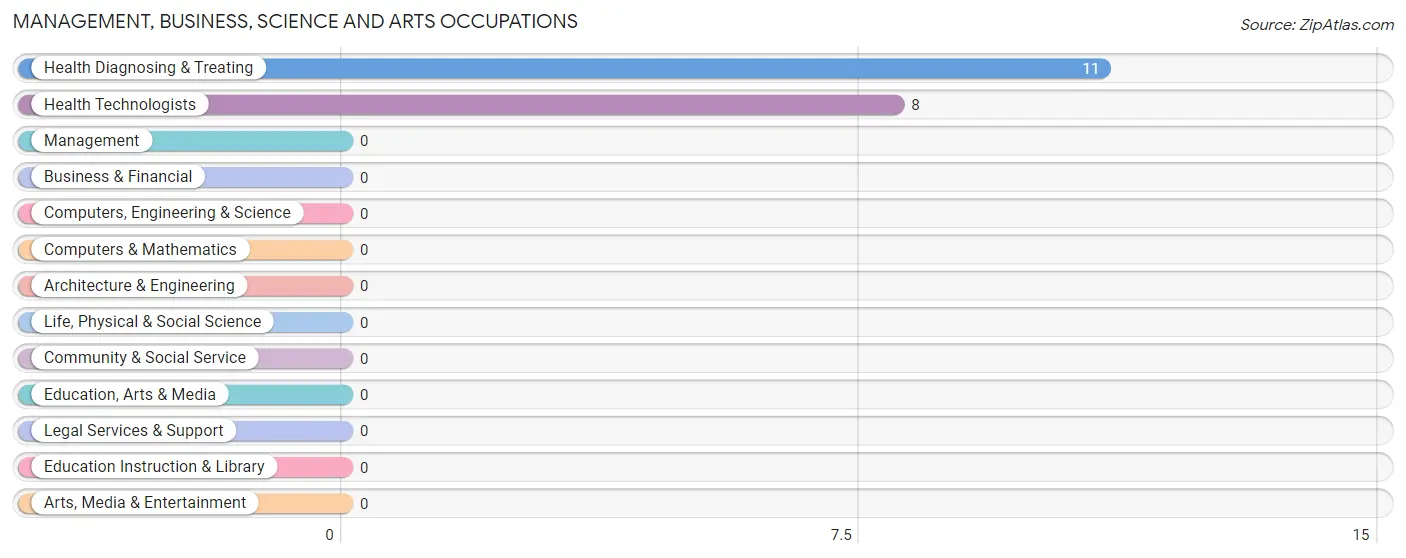
Management, Business, Science and Arts Occupations by Sex
| Occupation | Male | Female |
| Management | 0 (0.0%) | 0 (0.0%) |
| Business & Financial | 0 (0.0%) | 0 (0.0%) |
| Computers, Engineering & Science | 0 (0.0%) | 0 (0.0%) |
| Computers & Mathematics | 0 (0.0%) | 0 (0.0%) |
| Architecture & Engineering | 0 (0.0%) | 0 (0.0%) |
| Life, Physical & Social Science | 0 (0.0%) | 0 (0.0%) |
| Community & Social Service | 0 (0.0%) | 0 (0.0%) |
| Education, Arts & Media | 0 (0.0%) | 0 (0.0%) |
| Legal Services & Support | 0 (0.0%) | 0 (0.0%) |
| Education Instruction & Library | 0 (0.0%) | 0 (0.0%) |
| Arts, Media & Entertainment | 0 (0.0%) | 0 (0.0%) |
| Health Diagnosing & Treating | 0 (0.0%) | 11 (100.0%) |
| Health Technologists | 0 (0.0%) | 8 (100.0%) |
| Total (Category) | 0 (0.0%) | 11 (100.0%) |
| Total (Overall) | 25 (48.1%) | 27 (51.9%) |
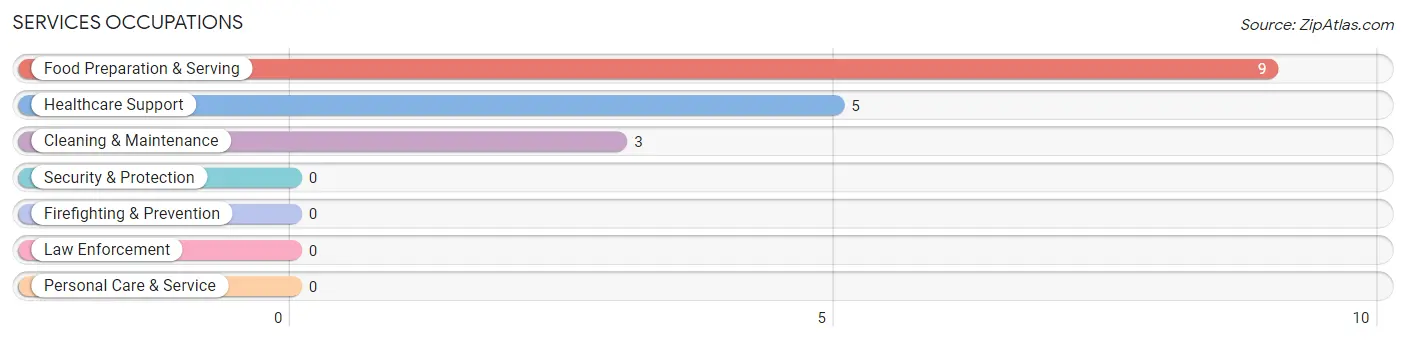
Services Occupations
The most common Services occupations in Brandonville are Food Preparation & Serving (9 | 17.3%), Healthcare Support (5 | 9.6%), and Cleaning & Maintenance (3 | 5.8%).
Services Occupations by Sex
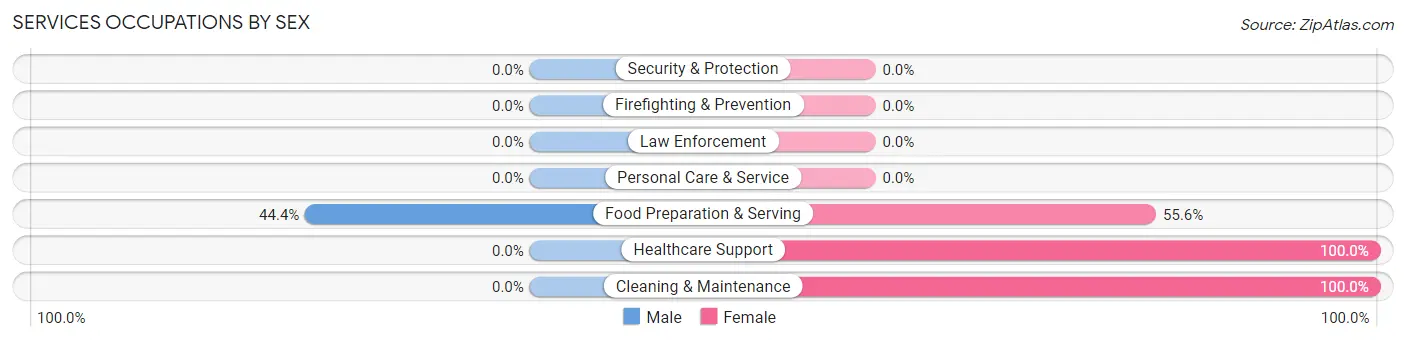
| Occupation | Male | Female |
| Healthcare Support | 0 (0.0%) | 5 (100.0%) |
| Security & Protection | 0 (0.0%) | 0 (0.0%) |
| Firefighting & Prevention | 0 (0.0%) | 0 (0.0%) |
| Law Enforcement | 0 (0.0%) | 0 (0.0%) |
| Food Preparation & Serving | 4 (44.4%) | 5 (55.6%) |
| Cleaning & Maintenance | 0 (0.0%) | 3 (100.0%) |
| Personal Care & Service | 0 (0.0%) | 0 (0.0%) |
| Total (Category) | 4 (23.5%) | 13 (76.5%) |
| Total (Overall) | 25 (48.1%) | 27 (51.9%) |
Sales and Office Occupations
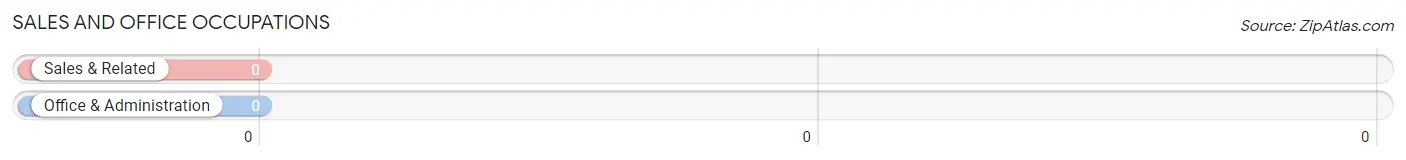
Sales and Office Occupations by Sex
| Occupation | Male | Female |
| Sales & Related | 0 (0.0%) | 0 (0.0%) |
| Office & Administration | 0 (0.0%) | 0 (0.0%) |
| Total (Category) | 0 (0.0%) | 0 (0.0%) |
| Total (Overall) | 25 (48.1%) | 27 (51.9%) |
Natural Resources, Construction and Maintenance Occupations
The most common Natural Resources, Construction and Maintenance occupations in Brandonville are , and Installation, Maintenance & Repair (9 | 17.3%).
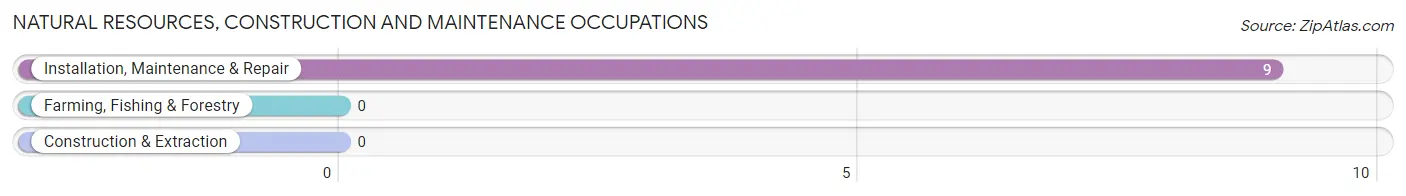
Natural Resources, Construction and Maintenance Occupations by Sex
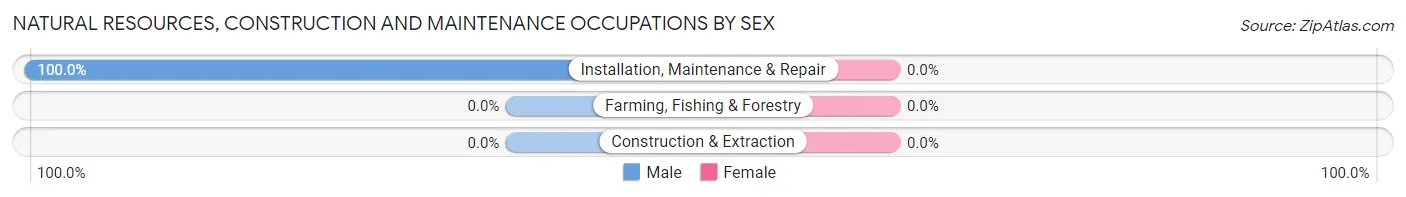
| Occupation | Male | Female |
| Farming, Fishing & Forestry | 0 (0.0%) | 0 (0.0%) |
| Construction & Extraction | 0 (0.0%) | 0 (0.0%) |
| Installation, Maintenance & Repair | 9 (100.0%) | 0 (0.0%) |
| Total (Category) | 9 (100.0%) | 0 (0.0%) |
| Total (Overall) | 25 (48.1%) | 27 (51.9%) |
Production, Transportation and Moving Occupations
The most common Production, Transportation and Moving occupations in Brandonville are Production (8 | 15.4%), Transportation (4 | 7.7%), and Material Moving (3 | 5.8%).
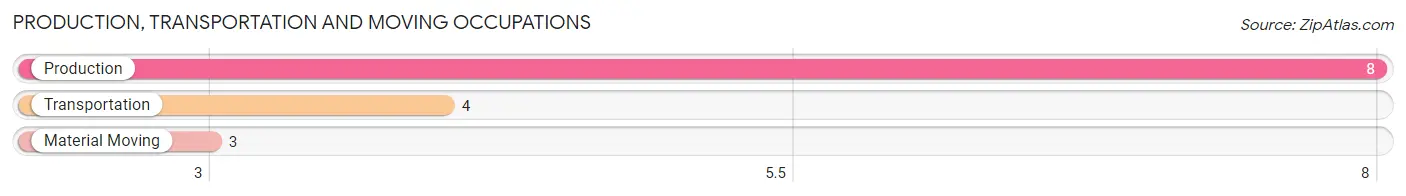
Production, Transportation and Moving Occupations by Sex
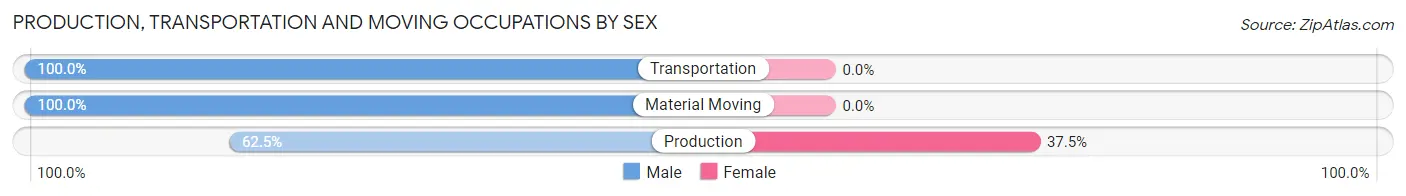
| Occupation | Male | Female |
| Production | 5 (62.5%) | 3 (37.5%) |
| Transportation | 4 (100.0%) | 0 (0.0%) |
| Material Moving | 3 (100.0%) | 0 (0.0%) |
| Total (Category) | 12 (80.0%) | 3 (20.0%) |
| Total (Overall) | 25 (48.1%) | 27 (51.9%) |
Employment Industries by Sex in Brandonville
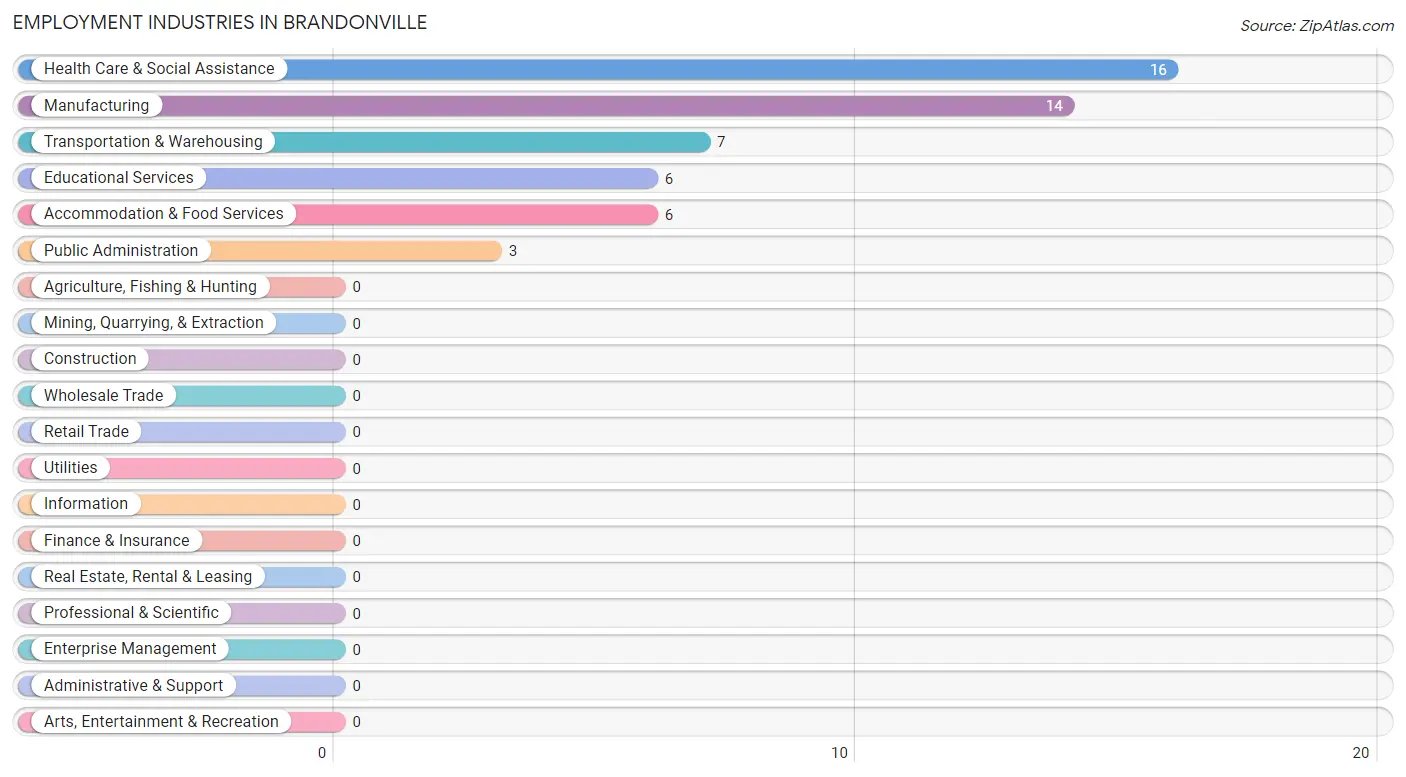
Employment Industries in Brandonville
The major employment industries in Brandonville include Health Care & Social Assistance (16 | 30.8%), Manufacturing (14 | 26.9%), Transportation & Warehousing (7 | 13.5%), Educational Services (6 | 11.5%), and Accommodation & Food Services (6 | 11.5%).
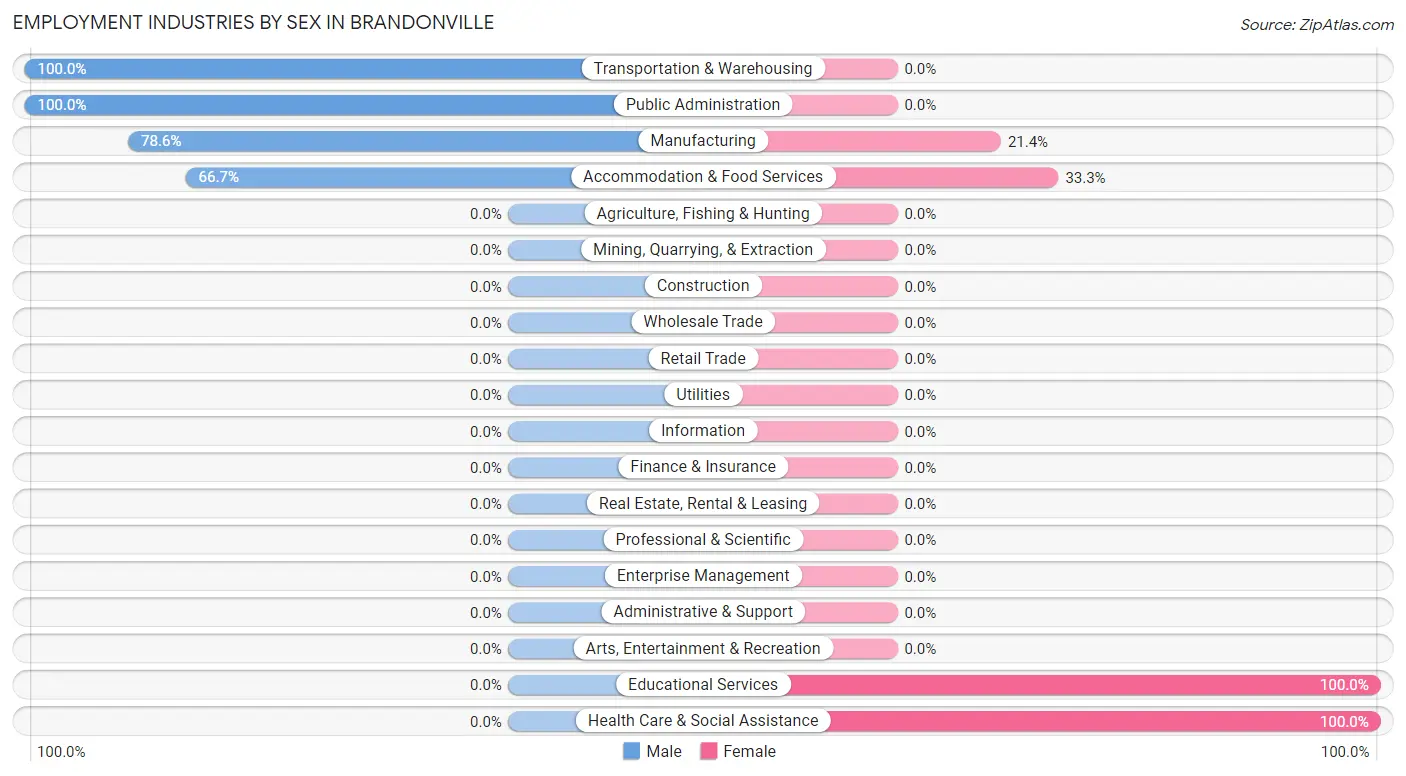
Employment Industries by Sex in Brandonville
The Brandonville industries that see more men than women are Transportation & Warehousing (100.0%), Public Administration (100.0%), and Manufacturing (78.6%), whereas the industries that tend to have a higher number of women are Educational Services (100.0%), Health Care & Social Assistance (100.0%), and Accommodation & Food Services (33.3%).
| Industry | Male | Female |
| Agriculture, Fishing & Hunting | 0 (0.0%) | 0 (0.0%) |
| Mining, Quarrying, & Extraction | 0 (0.0%) | 0 (0.0%) |
| Construction | 0 (0.0%) | 0 (0.0%) |
| Manufacturing | 11 (78.6%) | 3 (21.4%) |
| Wholesale Trade | 0 (0.0%) | 0 (0.0%) |
| Retail Trade | 0 (0.0%) | 0 (0.0%) |
| Transportation & Warehousing | 7 (100.0%) | 0 (0.0%) |
| Utilities | 0 (0.0%) | 0 (0.0%) |
| Information | 0 (0.0%) | 0 (0.0%) |
| Finance & Insurance | 0 (0.0%) | 0 (0.0%) |
| Real Estate, Rental & Leasing | 0 (0.0%) | 0 (0.0%) |
| Professional & Scientific | 0 (0.0%) | 0 (0.0%) |
| Enterprise Management | 0 (0.0%) | 0 (0.0%) |
| Administrative & Support | 0 (0.0%) | 0 (0.0%) |
| Educational Services | 0 (0.0%) | 6 (100.0%) |
| Health Care & Social Assistance | 0 (0.0%) | 16 (100.0%) |
| Arts, Entertainment & Recreation | 0 (0.0%) | 0 (0.0%) |
| Accommodation & Food Services | 4 (66.7%) | 2 (33.3%) |
| Public Administration | 3 (100.0%) | 0 (0.0%) |
| Total | 25 (48.1%) | 27 (51.9%) |
Education in Brandonville
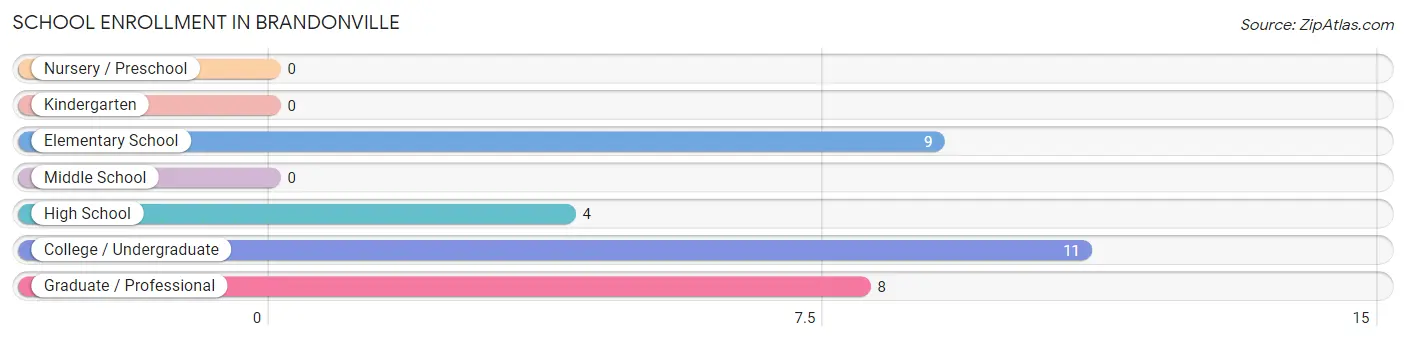
School Enrollment in Brandonville
The most common levels of schooling among the 32 students in Brandonville are college / undergraduate (11 | 34.4%), elementary school (9 | 28.1%), and graduate / professional (8 | 25.0%).
| School Level | # Students | % Students |
| Nursery / Preschool | 0 | 0.0% |
| Kindergarten | 0 | 0.0% |
| Elementary School | 9 | 28.1% |
| Middle School | 0 | 0.0% |
| High School | 4 | 12.5% |
| College / Undergraduate | 11 | 34.4% |
| Graduate / Professional | 8 | 25.0% |
| Total | 32 | 100.0% |
School Enrollment by Age by Funding Source in Brandonville
Out of a total of 32 students who are enrolled in schools in Brandonville, 4 (12.5%) attend a private institution, while the remaining 28 (87.5%) are enrolled in public schools. The age group of 15 to 17 year olds has the highest likelihood of being enrolled in private schools, with 4 (100.0% in the age bracket) enrolled. Conversely, the age group of 5 to 9 year old has the lowest likelihood of being enrolled in a private school, with 6 (100.0% in the age bracket) attending a public institution.
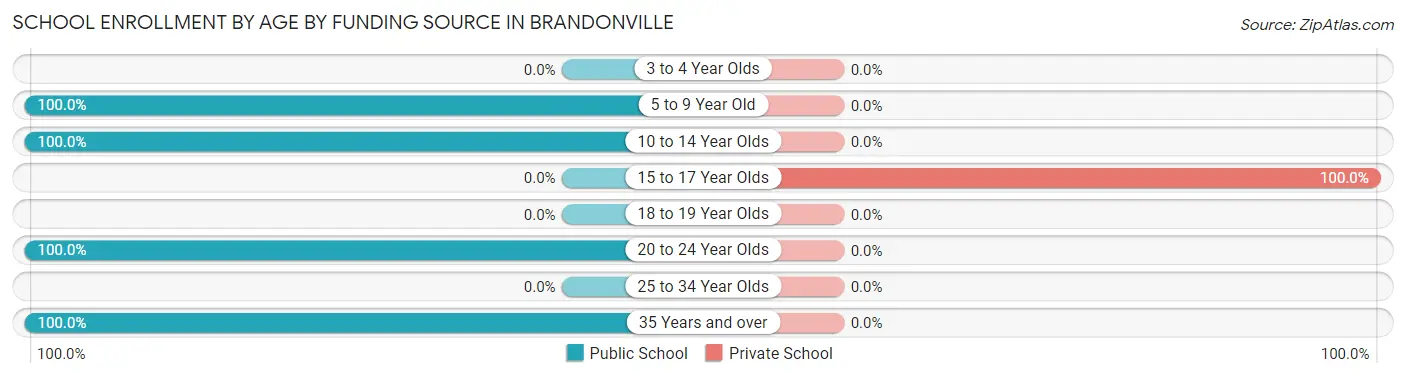
| Age Bracket | Public School | Private School |
| 3 to 4 Year Olds | 0 (0.0%) | 0 (0.0%) |
| 5 to 9 Year Old | 6 (100.0%) | 0 (0.0%) |
| 10 to 14 Year Olds | 3 (100.0%) | 0 (0.0%) |
| 15 to 17 Year Olds | 0 (0.0%) | 4 (100.0%) |
| 18 to 19 Year Olds | 0 (0.0%) | 0 (0.0%) |
| 20 to 24 Year Olds | 11 (100.0%) | 0 (0.0%) |
| 25 to 34 Year Olds | 0 (0.0%) | 0 (0.0%) |
| 35 Years and over | 8 (100.0%) | 0 (0.0%) |
| Total | 28 (87.5%) | 4 (12.5%) |
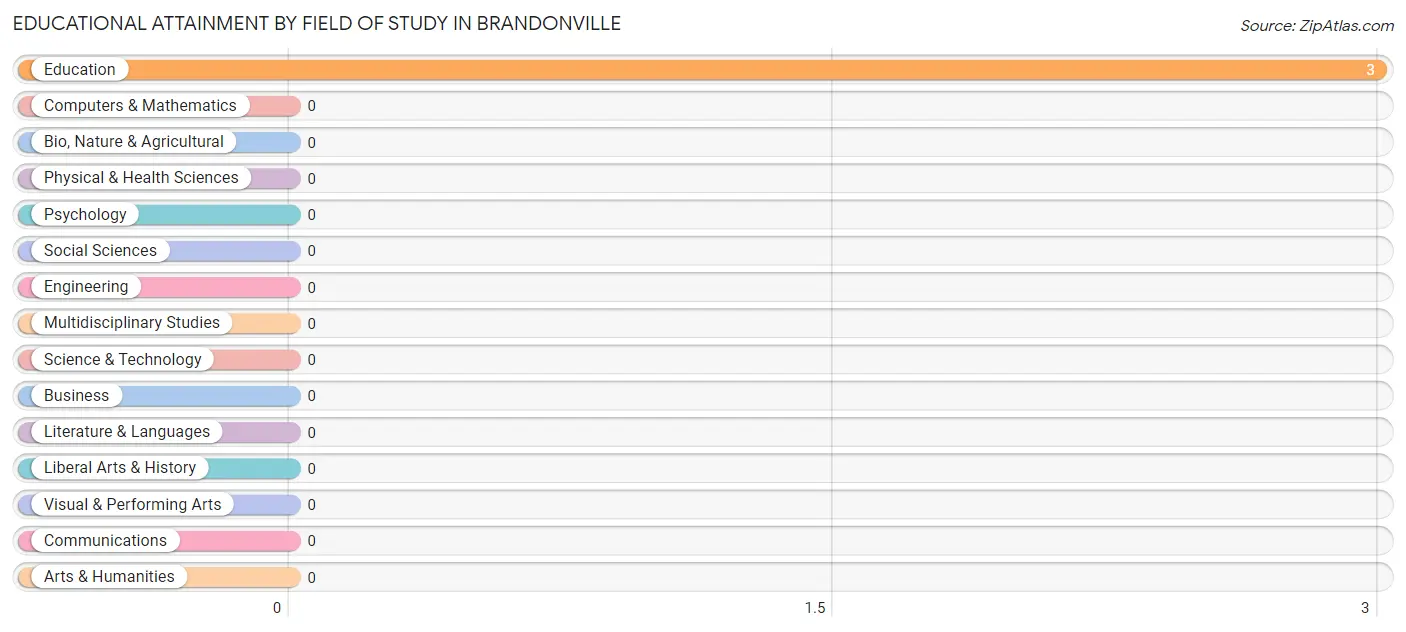
Educational Attainment by Field of Study in Brandonville
, and education (3 | 100.0%) are the most common fields of study among 3 individuals in Brandonville who have obtained a bachelor's degree or higher.
| Field of Study | # Graduates | % Graduates |
| Computers & Mathematics | 0 | 0.0% |
| Bio, Nature & Agricultural | 0 | 0.0% |
| Physical & Health Sciences | 0 | 0.0% |
| Psychology | 0 | 0.0% |
| Social Sciences | 0 | 0.0% |
| Engineering | 0 | 0.0% |
| Multidisciplinary Studies | 0 | 0.0% |
| Science & Technology | 0 | 0.0% |
| Business | 0 | 0.0% |
| Education | 3 | 100.0% |
| Literature & Languages | 0 | 0.0% |
| Liberal Arts & History | 0 | 0.0% |
| Visual & Performing Arts | 0 | 0.0% |
| Communications | 0 | 0.0% |
| Arts & Humanities | 0 | 0.0% |
| Total | 3 | 100.0% |
Transportation & Commute in Brandonville
Vehicle Availability by Sex in Brandonville
The most prevalent vehicle ownership categories in Brandonville are males with 2 vehicles (12, accounting for 48.0%) and females with 2 vehicles (11, making up 44.4%).
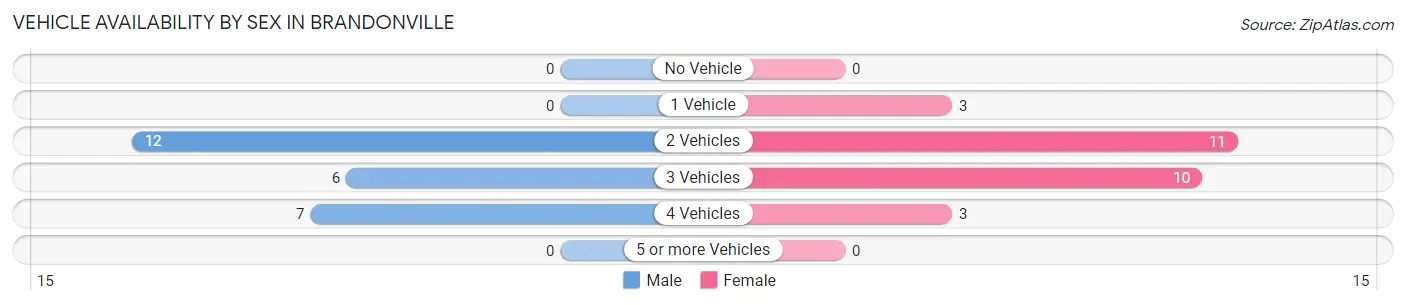
| Vehicles Available | Male | Female |
| No Vehicle | 0 (0.0%) | 0 (0.0%) |
| 1 Vehicle | 0 (0.0%) | 3 (11.1%) |
| 2 Vehicles | 12 (48.0%) | 11 (40.7%) |
| 3 Vehicles | 6 (24.0%) | 10 (37.0%) |
| 4 Vehicles | 7 (28.0%) | 3 (11.1%) |
| 5 or more Vehicles | 0 (0.0%) | 0 (0.0%) |
| Total | 25 (100.0%) | 27 (100.0%) |
Commute Time in Brandonville
The most frequently occuring commute durations in Brandonville are 5 to 9 minutes (11 commuters, 24.4%), 20 to 24 minutes (11 commuters, 24.4%), and 15 to 19 minutes (9 commuters, 20.0%).
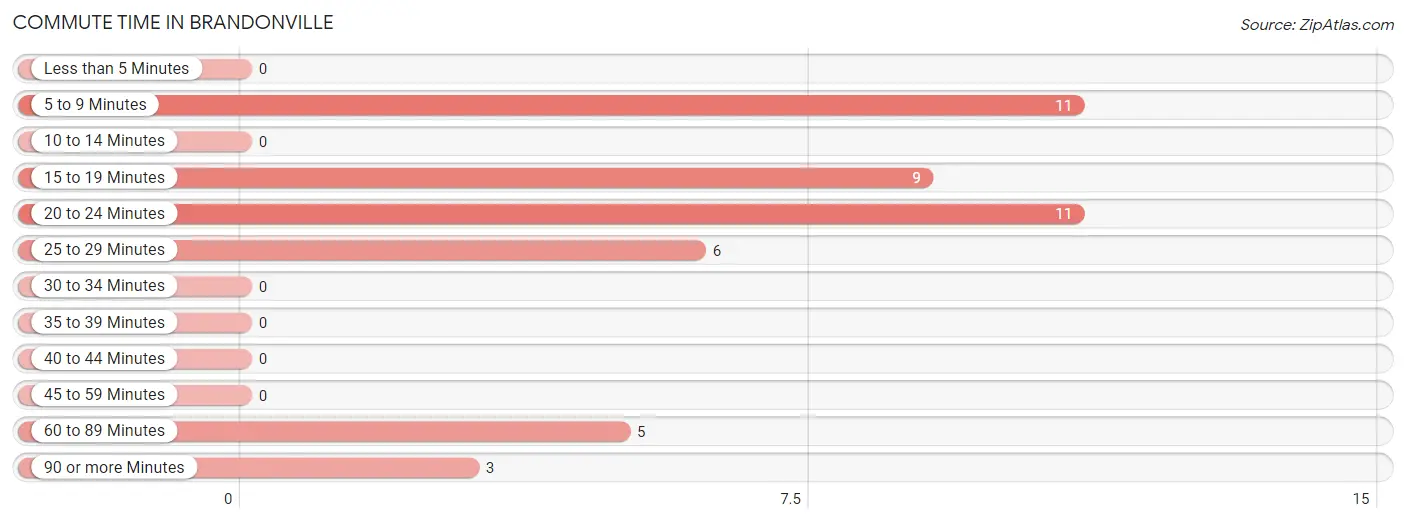
| Commute Time | # Commuters | % Commuters |
| Less than 5 Minutes | 0 | 0.0% |
| 5 to 9 Minutes | 11 | 24.4% |
| 10 to 14 Minutes | 0 | 0.0% |
| 15 to 19 Minutes | 9 | 20.0% |
| 20 to 24 Minutes | 11 | 24.4% |
| 25 to 29 Minutes | 6 | 13.3% |
| 30 to 34 Minutes | 0 | 0.0% |
| 35 to 39 Minutes | 0 | 0.0% |
| 40 to 44 Minutes | 0 | 0.0% |
| 45 to 59 Minutes | 0 | 0.0% |
| 60 to 89 Minutes | 5 | 11.1% |
| 90 or more Minutes | 3 | 6.7% |
Commute Time by Sex in Brandonville
The most common commute times in Brandonville are 15 to 19 minutes (9 commuters, 42.9%) for males and 5 to 9 minutes (11 commuters, 45.8%) for females.
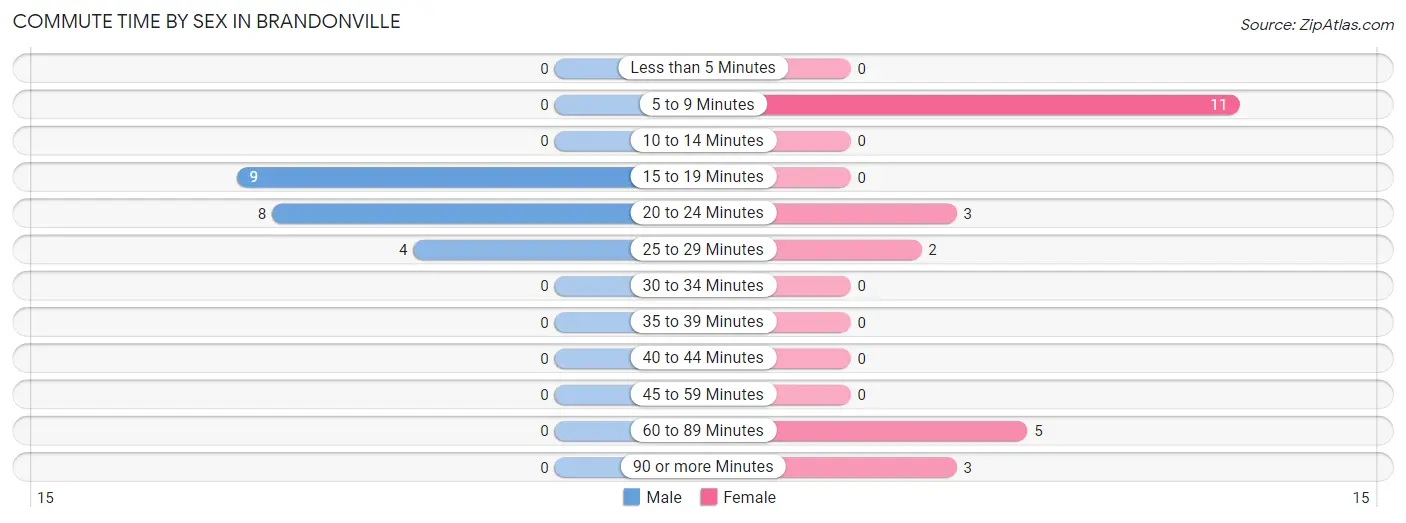
| Commute Time | Male | Female |
| Less than 5 Minutes | 0 (0.0%) | 0 (0.0%) |
| 5 to 9 Minutes | 0 (0.0%) | 11 (45.8%) |
| 10 to 14 Minutes | 0 (0.0%) | 0 (0.0%) |
| 15 to 19 Minutes | 9 (42.9%) | 0 (0.0%) |
| 20 to 24 Minutes | 8 (38.1%) | 3 (12.5%) |
| 25 to 29 Minutes | 4 (19.1%) | 2 (8.3%) |
| 30 to 34 Minutes | 0 (0.0%) | 0 (0.0%) |
| 35 to 39 Minutes | 0 (0.0%) | 0 (0.0%) |
| 40 to 44 Minutes | 0 (0.0%) | 0 (0.0%) |
| 45 to 59 Minutes | 0 (0.0%) | 0 (0.0%) |
| 60 to 89 Minutes | 0 (0.0%) | 5 (20.8%) |
| 90 or more Minutes | 0 (0.0%) | 3 (12.5%) |
Time of Departure to Work by Sex in Brandonville
The most frequent times of departure to work in Brandonville are 6:00 AM to 6:29 AM (8, 38.1%) for males and 8:00 AM to 8:29 AM (11, 45.8%) for females.
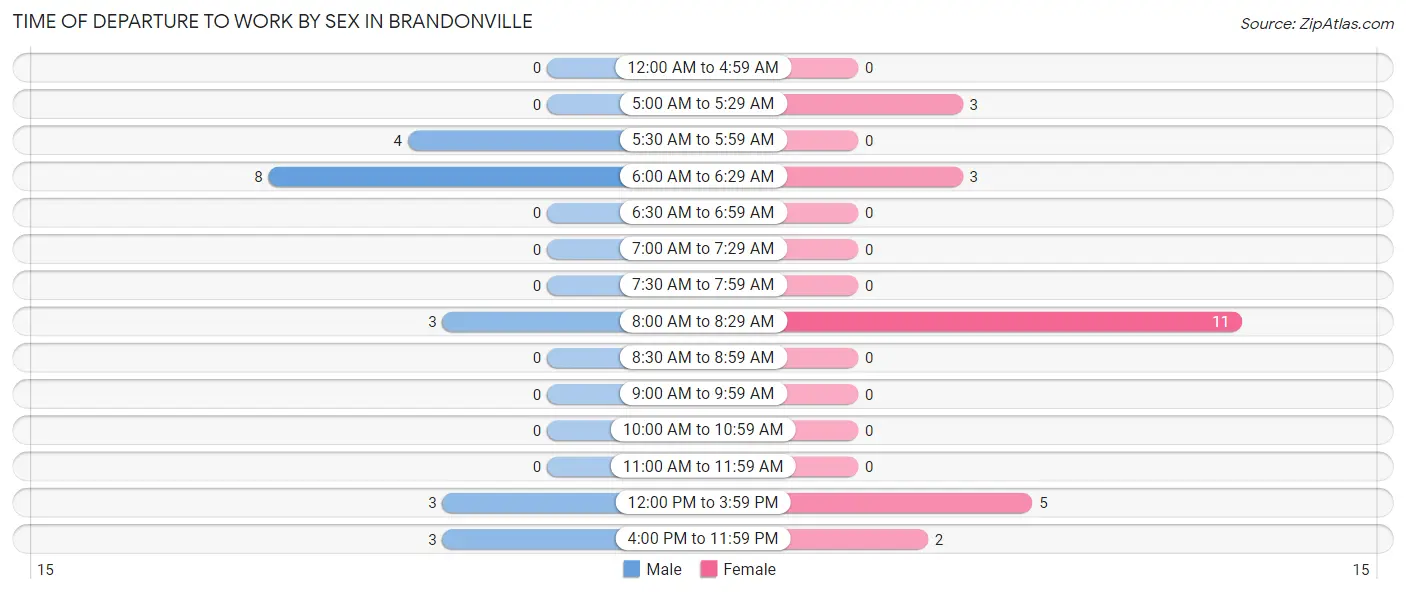
| Time of Departure | Male | Female |
| 12:00 AM to 4:59 AM | 0 (0.0%) | 0 (0.0%) |
| 5:00 AM to 5:29 AM | 0 (0.0%) | 3 (12.5%) |
| 5:30 AM to 5:59 AM | 4 (19.1%) | 0 (0.0%) |
| 6:00 AM to 6:29 AM | 8 (38.1%) | 3 (12.5%) |
| 6:30 AM to 6:59 AM | 0 (0.0%) | 0 (0.0%) |
| 7:00 AM to 7:29 AM | 0 (0.0%) | 0 (0.0%) |
| 7:30 AM to 7:59 AM | 0 (0.0%) | 0 (0.0%) |
| 8:00 AM to 8:29 AM | 3 (14.3%) | 11 (45.8%) |
| 8:30 AM to 8:59 AM | 0 (0.0%) | 0 (0.0%) |
| 9:00 AM to 9:59 AM | 0 (0.0%) | 0 (0.0%) |
| 10:00 AM to 10:59 AM | 0 (0.0%) | 0 (0.0%) |
| 11:00 AM to 11:59 AM | 0 (0.0%) | 0 (0.0%) |
| 12:00 PM to 3:59 PM | 3 (14.3%) | 5 (20.8%) |
| 4:00 PM to 11:59 PM | 3 (14.3%) | 2 (8.3%) |
| Total | 21 (100.0%) | 24 (100.0%) |
Housing Occupancy in Brandonville
Occupancy by Ownership in Brandonville
Of the total 77 dwellings in Brandonville, owner-occupied units account for 62 (80.5%), while renter-occupied units make up 15 (19.5%).
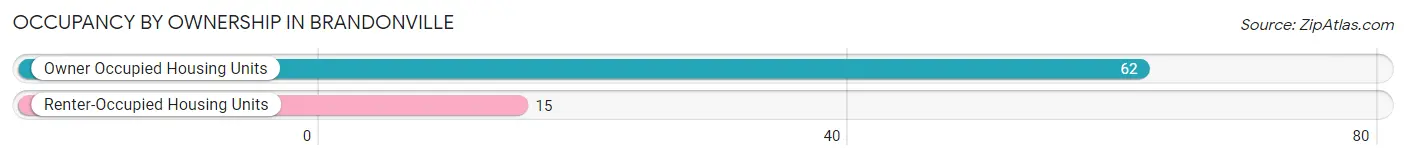
| Occupancy | # Housing Units | % Housing Units |
| Owner Occupied Housing Units | 62 | 80.5% |
| Renter-Occupied Housing Units | 15 | 19.5% |
| Total Occupied Housing Units | 77 | 100.0% |
Occupancy by Household Size in Brandonville
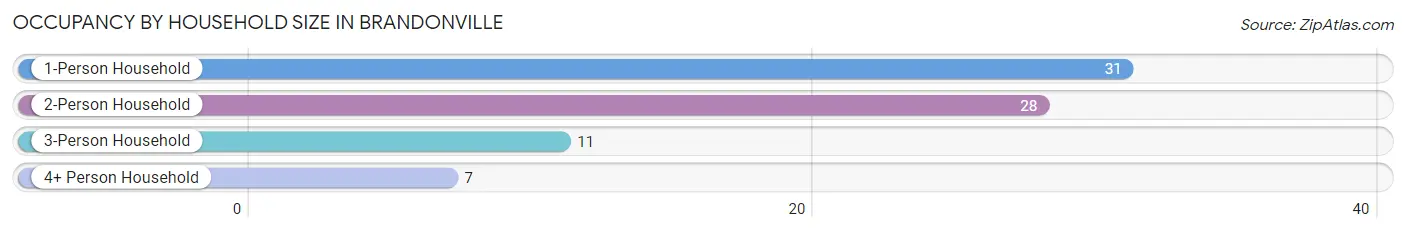
| Household Size | # Housing Units | % Housing Units |
| 1-Person Household | 31 | 40.3% |
| 2-Person Household | 28 | 36.4% |
| 3-Person Household | 11 | 14.3% |
| 4+ Person Household | 7 | 9.1% |
| Total Housing Units | 77 | 100.0% |
Occupancy by Ownership by Household Size in Brandonville
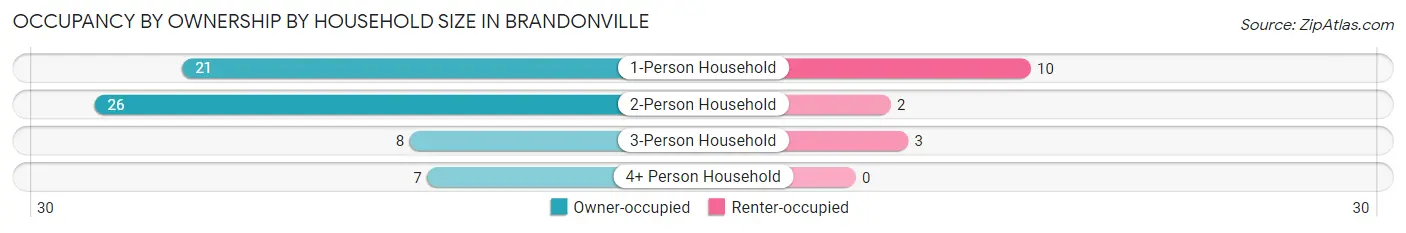
| Household Size | Owner-occupied | Renter-occupied |
| 1-Person Household | 21 (67.7%) | 10 (32.3%) |
| 2-Person Household | 26 (92.9%) | 2 (7.1%) |
| 3-Person Household | 8 (72.7%) | 3 (27.3%) |
| 4+ Person Household | 7 (100.0%) | 0 (0.0%) |
| Total Housing Units | 62 (80.5%) | 15 (19.5%) |
Occupancy by Educational Attainment in Brandonville
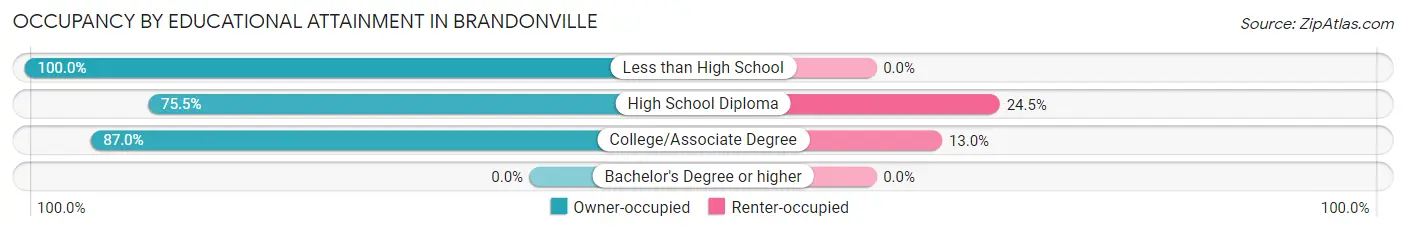
| Household Size | Owner-occupied | Renter-occupied |
| Less than High School | 5 (100.0%) | 0 (0.0%) |
| High School Diploma | 37 (75.5%) | 12 (24.5%) |
| College/Associate Degree | 20 (87.0%) | 3 (13.0%) |
| Bachelor's Degree or higher | 0 (0.0%) | 0 (0.0%) |
Occupancy by Age of Householder in Brandonville
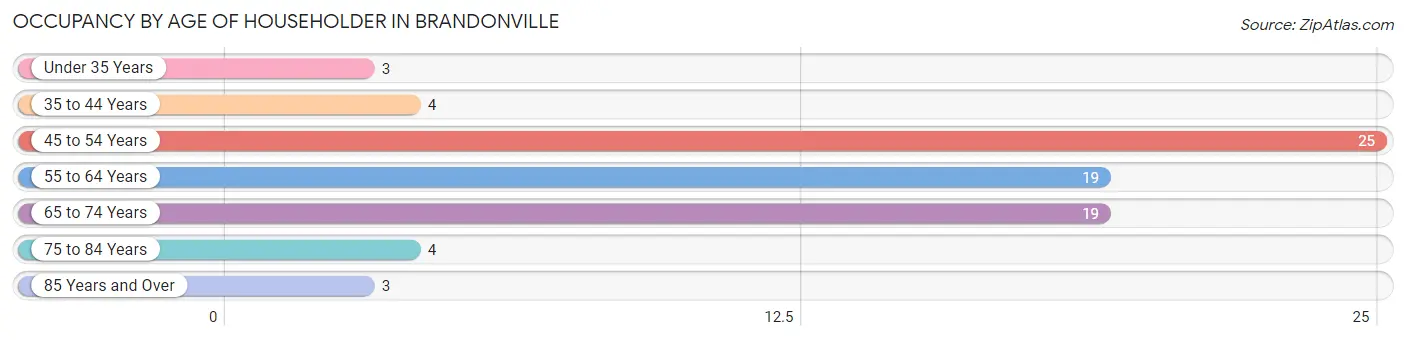
| Age Bracket | # Households | % Households |
| Under 35 Years | 3 | 3.9% |
| 35 to 44 Years | 4 | 5.2% |
| 45 to 54 Years | 25 | 32.5% |
| 55 to 64 Years | 19 | 24.7% |
| 65 to 74 Years | 19 | 24.7% |
| 75 to 84 Years | 4 | 5.2% |
| 85 Years and Over | 3 | 3.9% |
| Total | 77 | 100.0% |
Housing Finances in Brandonville
Median Income by Occupancy in Brandonville
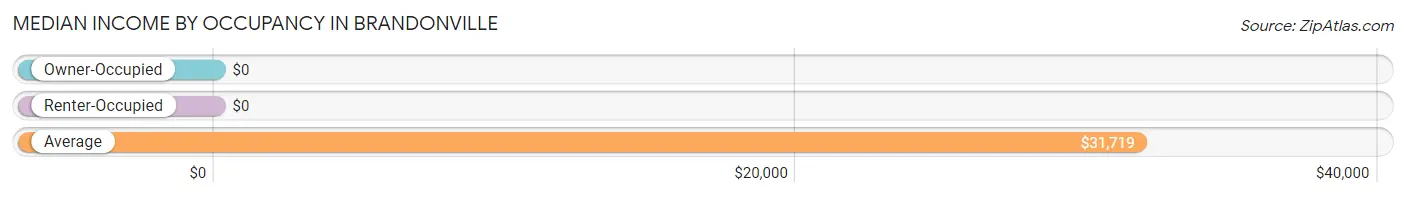
| Occupancy Type | # Households | Median Income |
| Owner-Occupied | 62 (80.5%) | $0 |
| Renter-Occupied | 15 (19.5%) | $0 |
| Average | 77 (100.0%) | $31,719 |
Occupancy by Householder Income Bracket in Brandonville
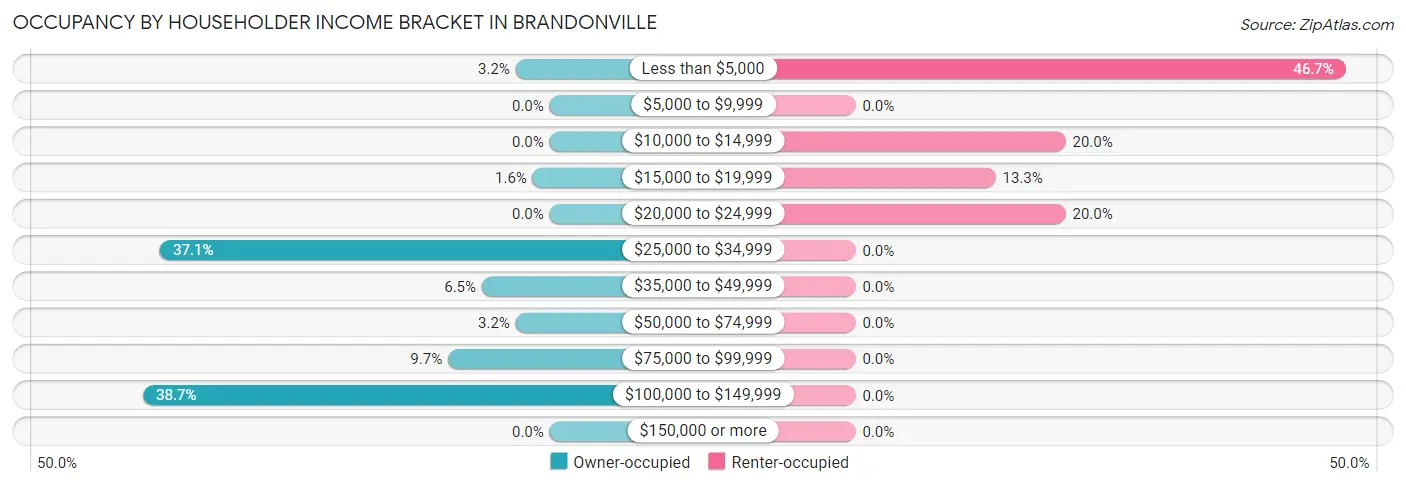
| Income Bracket | Owner-occupied | Renter-occupied |
| Less than $5,000 | 2 (3.2%) | 7 (46.7%) |
| $5,000 to $9,999 | 0 (0.0%) | 0 (0.0%) |
| $10,000 to $14,999 | 0 (0.0%) | 3 (20.0%) |
| $15,000 to $19,999 | 1 (1.6%) | 2 (13.3%) |
| $20,000 to $24,999 | 0 (0.0%) | 3 (20.0%) |
| $25,000 to $34,999 | 23 (37.1%) | 0 (0.0%) |
| $35,000 to $49,999 | 4 (6.5%) | 0 (0.0%) |
| $50,000 to $74,999 | 2 (3.2%) | 0 (0.0%) |
| $75,000 to $99,999 | 6 (9.7%) | 0 (0.0%) |
| $100,000 to $149,999 | 24 (38.7%) | 0 (0.0%) |
| $150,000 or more | 0 (0.0%) | 0 (0.0%) |
| Total | 62 (100.0%) | 15 (100.0%) |
Monthly Housing Cost Tiers in Brandonville
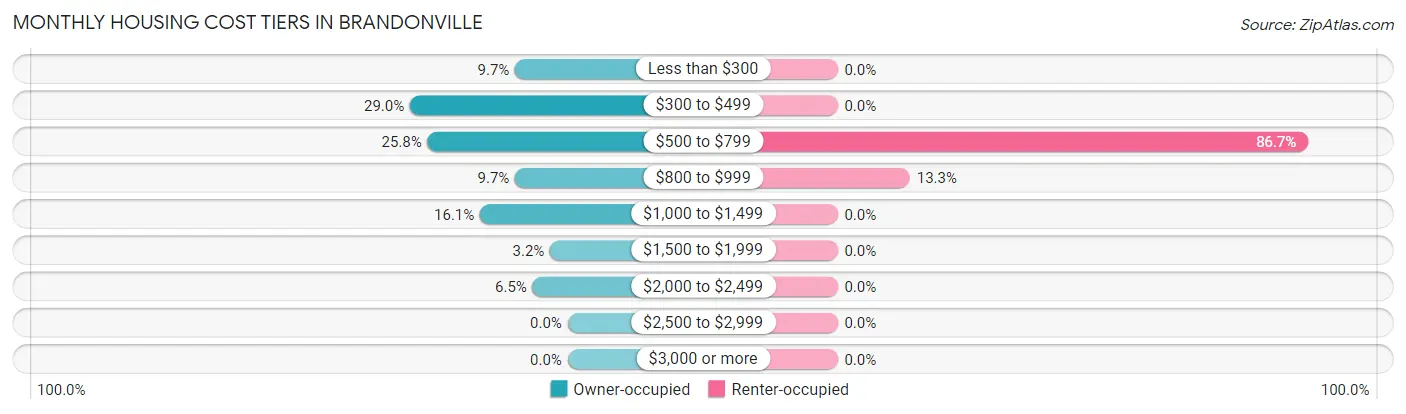
| Monthly Cost | Owner-occupied | Renter-occupied |
| Less than $300 | 6 (9.7%) | 0 (0.0%) |
| $300 to $499 | 18 (29.0%) | 0 (0.0%) |
| $500 to $799 | 16 (25.8%) | 13 (86.7%) |
| $800 to $999 | 6 (9.7%) | 2 (13.3%) |
| $1,000 to $1,499 | 10 (16.1%) | 0 (0.0%) |
| $1,500 to $1,999 | 2 (3.2%) | 0 (0.0%) |
| $2,000 to $2,499 | 4 (6.5%) | 0 (0.0%) |
| $2,500 to $2,999 | 0 (0.0%) | 0 (0.0%) |
| $3,000 or more | 0 (0.0%) | 0 (0.0%) |
| Total | 62 (100.0%) | 15 (100.0%) |
Physical Housing Characteristics in Brandonville
Housing Structures in Brandonville
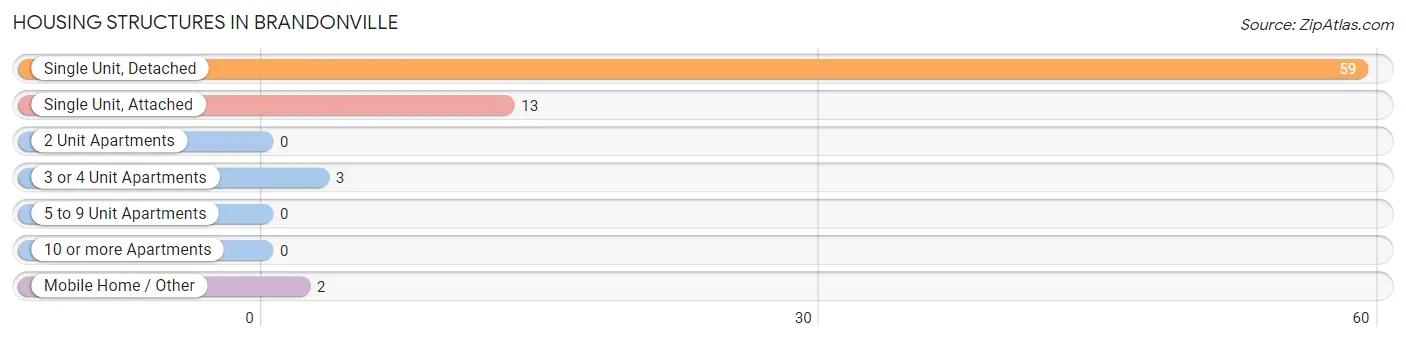
| Structure Type | # Housing Units | % Housing Units |
| Single Unit, Detached | 59 | 76.6% |
| Single Unit, Attached | 13 | 16.9% |
| 2 Unit Apartments | 0 | 0.0% |
| 3 or 4 Unit Apartments | 3 | 3.9% |
| 5 to 9 Unit Apartments | 0 | 0.0% |
| 10 or more Apartments | 0 | 0.0% |
| Mobile Home / Other | 2 | 2.6% |
| Total | 77 | 100.0% |
Housing Structures by Occupancy in Brandonville
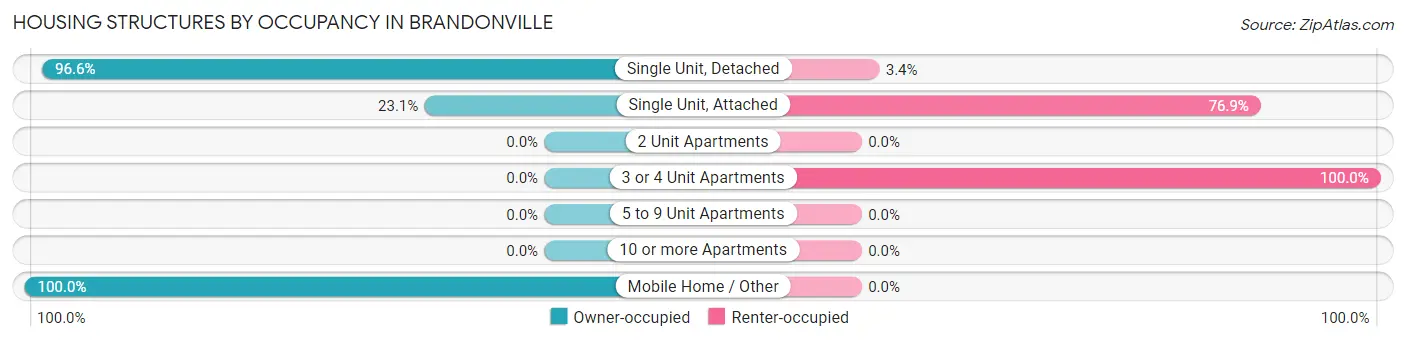
| Structure Type | Owner-occupied | Renter-occupied |
| Single Unit, Detached | 57 (96.6%) | 2 (3.4%) |
| Single Unit, Attached | 3 (23.1%) | 10 (76.9%) |
| 2 Unit Apartments | 0 (0.0%) | 0 (0.0%) |
| 3 or 4 Unit Apartments | 0 (0.0%) | 3 (100.0%) |
| 5 to 9 Unit Apartments | 0 (0.0%) | 0 (0.0%) |
| 10 or more Apartments | 0 (0.0%) | 0 (0.0%) |
| Mobile Home / Other | 2 (100.0%) | 0 (0.0%) |
| Total | 62 (80.5%) | 15 (19.5%) |
Housing Structures by Number of Rooms in Brandonville
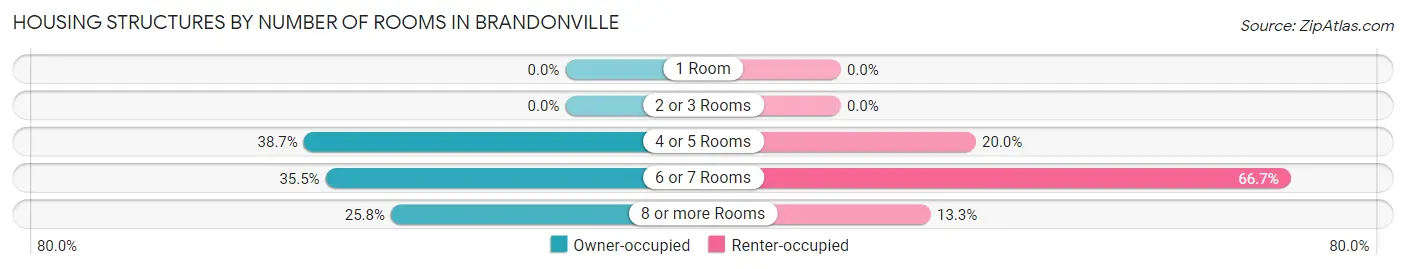
| Number of Rooms | Owner-occupied | Renter-occupied |
| 1 Room | 0 (0.0%) | 0 (0.0%) |
| 2 or 3 Rooms | 0 (0.0%) | 0 (0.0%) |
| 4 or 5 Rooms | 24 (38.7%) | 3 (20.0%) |
| 6 or 7 Rooms | 22 (35.5%) | 10 (66.7%) |
| 8 or more Rooms | 16 (25.8%) | 2 (13.3%) |
| Total | 62 (100.0%) | 15 (100.0%) |
Housing Structure by Heating Type in Brandonville
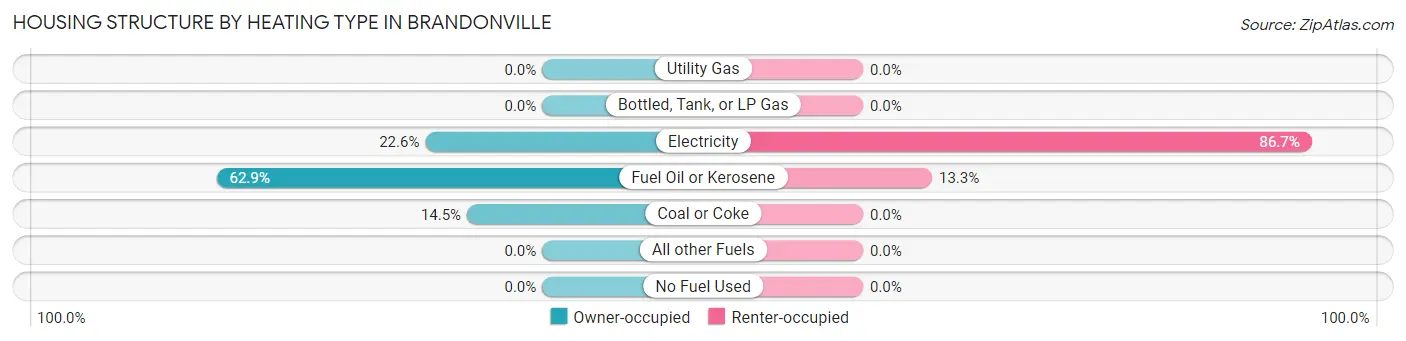
| Heating Type | Owner-occupied | Renter-occupied |
| Utility Gas | 0 (0.0%) | 0 (0.0%) |
| Bottled, Tank, or LP Gas | 0 (0.0%) | 0 (0.0%) |
| Electricity | 14 (22.6%) | 13 (86.7%) |
| Fuel Oil or Kerosene | 39 (62.9%) | 2 (13.3%) |
| Coal or Coke | 9 (14.5%) | 0 (0.0%) |
| All other Fuels | 0 (0.0%) | 0 (0.0%) |
| No Fuel Used | 0 (0.0%) | 0 (0.0%) |
| Total | 62 (100.0%) | 15 (100.0%) |
Household Vehicle Usage in Brandonville
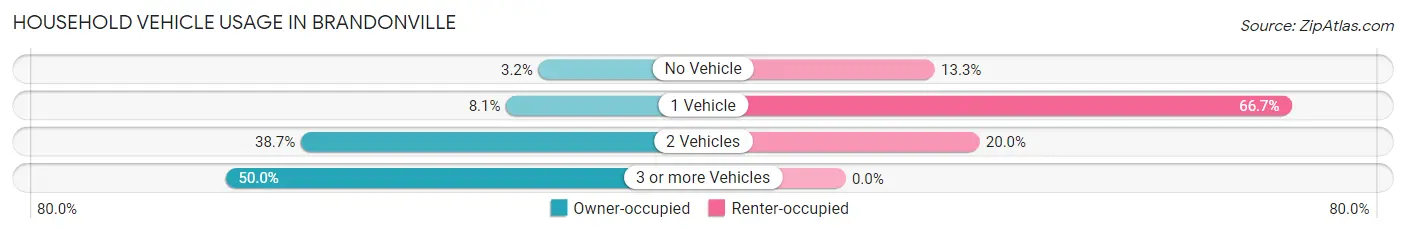
| Vehicles per Household | Owner-occupied | Renter-occupied |
| No Vehicle | 2 (3.2%) | 2 (13.3%) |
| 1 Vehicle | 5 (8.1%) | 10 (66.7%) |
| 2 Vehicles | 24 (38.7%) | 3 (20.0%) |
| 3 or more Vehicles | 31 (50.0%) | 0 (0.0%) |
| Total | 62 (100.0%) | 15 (100.0%) |
Real Estate & Mortgages in Brandonville
Real Estate and Mortgage Overview in Brandonville
| Characteristic | Without Mortgage | With Mortgage |
| Housing Units | 32 | 30 |
| Median Property Value | $110,000 | $139,300 |
| Median Household Income | - | - |
| Monthly Housing Costs | $420 | $0 |
| Real Estate Taxes | $2,111 | $0 |
Property Value by Mortgage Status in Brandonville
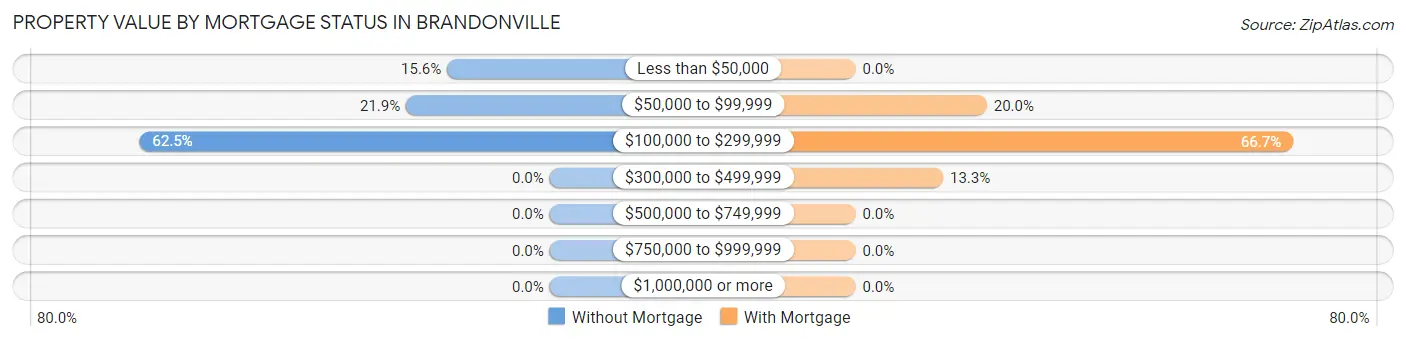
| Property Value | Without Mortgage | With Mortgage |
| Less than $50,000 | 5 (15.6%) | 0 (0.0%) |
| $50,000 to $99,999 | 7 (21.9%) | 6 (20.0%) |
| $100,000 to $299,999 | 20 (62.5%) | 20 (66.7%) |
| $300,000 to $499,999 | 0 (0.0%) | 4 (13.3%) |
| $500,000 to $749,999 | 0 (0.0%) | 0 (0.0%) |
| $750,000 to $999,999 | 0 (0.0%) | 0 (0.0%) |
| $1,000,000 or more | 0 (0.0%) | 0 (0.0%) |
| Total | 32 (100.0%) | 30 (100.0%) |
Household Income by Mortgage Status in Brandonville
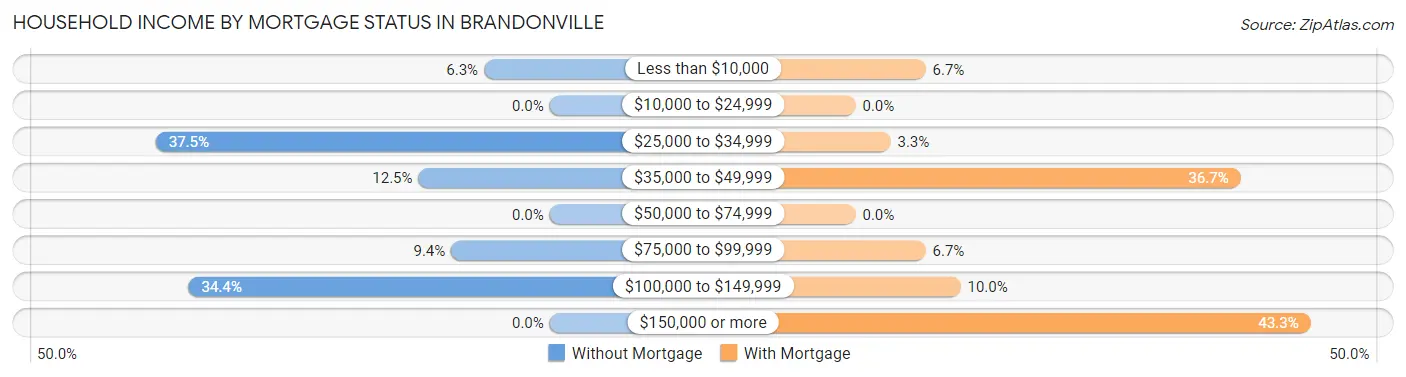
| Household Income | Without Mortgage | With Mortgage |
| Less than $10,000 | 2 (6.2%) | 2 (6.7%) |
| $10,000 to $24,999 | 0 (0.0%) | 0 (0.0%) |
| $25,000 to $34,999 | 12 (37.5%) | 1 (3.3%) |
| $35,000 to $49,999 | 4 (12.5%) | 11 (36.7%) |
| $50,000 to $74,999 | 0 (0.0%) | 0 (0.0%) |
| $75,000 to $99,999 | 3 (9.4%) | 2 (6.7%) |
| $100,000 to $149,999 | 11 (34.4%) | 3 (10.0%) |
| $150,000 or more | 0 (0.0%) | 13 (43.3%) |
| Total | 32 (100.0%) | 30 (100.0%) |
Property Value to Household Income Ratio in Brandonville
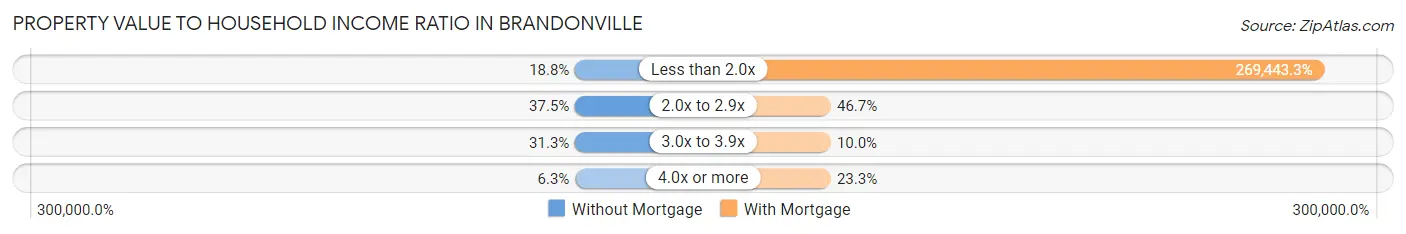
| Value-to-Income Ratio | Without Mortgage | With Mortgage |
| Less than 2.0x | 6 (18.8%) | 80,833 (269,443.3%) |
| 2.0x to 2.9x | 12 (37.5%) | 14 (46.7%) |
| 3.0x to 3.9x | 10 (31.2%) | 3 (10.0%) |
| 4.0x or more | 2 (6.2%) | 7 (23.3%) |
| Total | 32 (100.0%) | 30 (100.0%) |
Real Estate Taxes by Mortgage Status in Brandonville
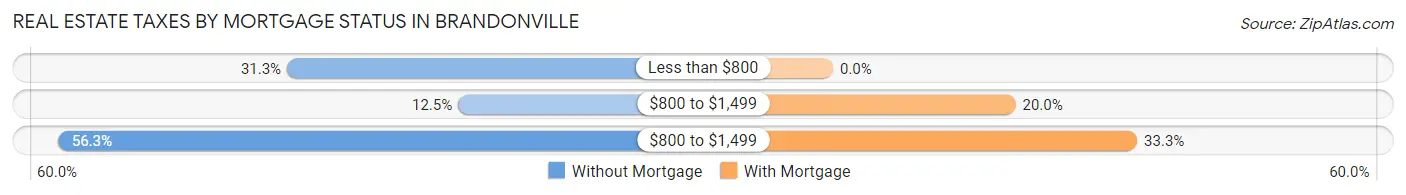
| Property Taxes | Without Mortgage | With Mortgage |
| Less than $800 | 10 (31.2%) | 0 (0.0%) |
| $800 to $1,499 | 4 (12.5%) | 6 (20.0%) |
| $800 to $1,499 | 18 (56.2%) | 10 (33.3%) |
| Total | 32 (100.0%) | 30 (100.0%) |
Health & Disability in Brandonville
Health Insurance Coverage by Age in Brandonville
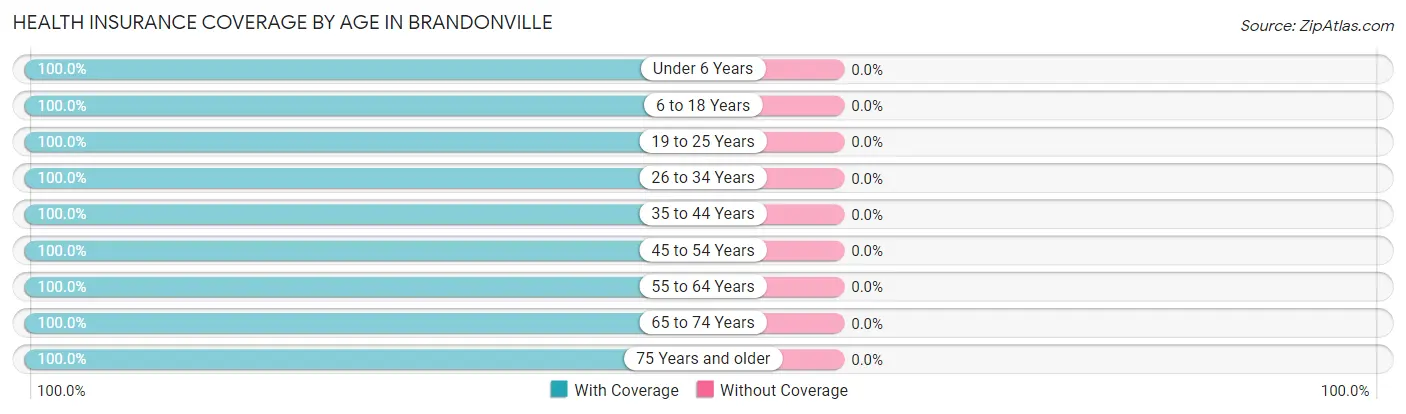
| Age Bracket | With Coverage | Without Coverage |
| Under 6 Years | 3 (100.0%) | 0 (0.0%) |
| 6 to 18 Years | 13 (100.0%) | 0 (0.0%) |
| 19 to 25 Years | 16 (100.0%) | 0 (0.0%) |
| 26 to 34 Years | 9 (100.0%) | 0 (0.0%) |
| 35 to 44 Years | 13 (100.0%) | 0 (0.0%) |
| 45 to 54 Years | 36 (100.0%) | 0 (0.0%) |
| 55 to 64 Years | 35 (100.0%) | 0 (0.0%) |
| 65 to 74 Years | 25 (100.0%) | 0 (0.0%) |
| 75 Years and older | 11 (100.0%) | 0 (0.0%) |
| Total | 161 (100.0%) | 0 (0.0%) |
Health Insurance Coverage by Citizenship Status in Brandonville
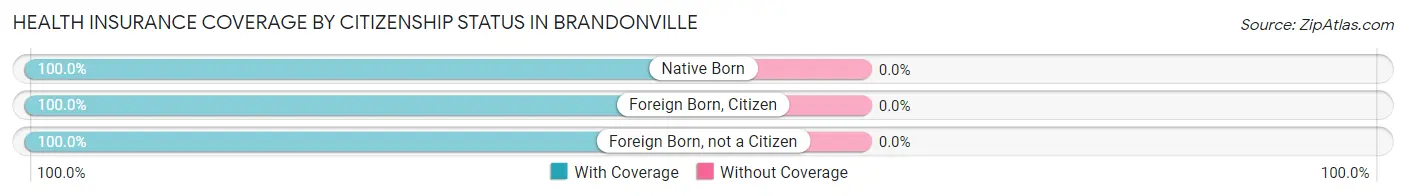
| Citizenship Status | With Coverage | Without Coverage |
| Native Born | 3 (100.0%) | 0 (0.0%) |
| Foreign Born, Citizen | 13 (100.0%) | 0 (0.0%) |
| Foreign Born, not a Citizen | 16 (100.0%) | 0 (0.0%) |
Health Insurance Coverage by Household Income in Brandonville
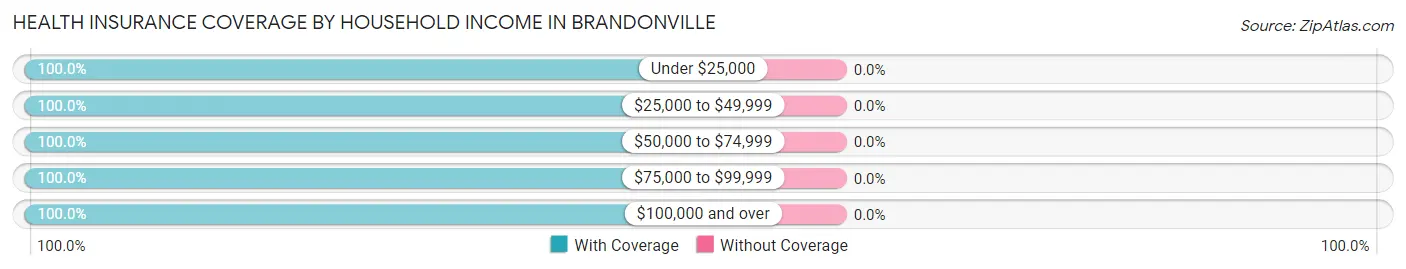
| Household Income | With Coverage | Without Coverage |
| Under $25,000 | 30 (100.0%) | 0 (0.0%) |
| $25,000 to $49,999 | 38 (100.0%) | 0 (0.0%) |
| $50,000 to $74,999 | 5 (100.0%) | 0 (0.0%) |
| $75,000 to $99,999 | 11 (100.0%) | 0 (0.0%) |
| $100,000 and over | 77 (100.0%) | 0 (0.0%) |
Public vs Private Health Insurance Coverage by Age in Brandonville
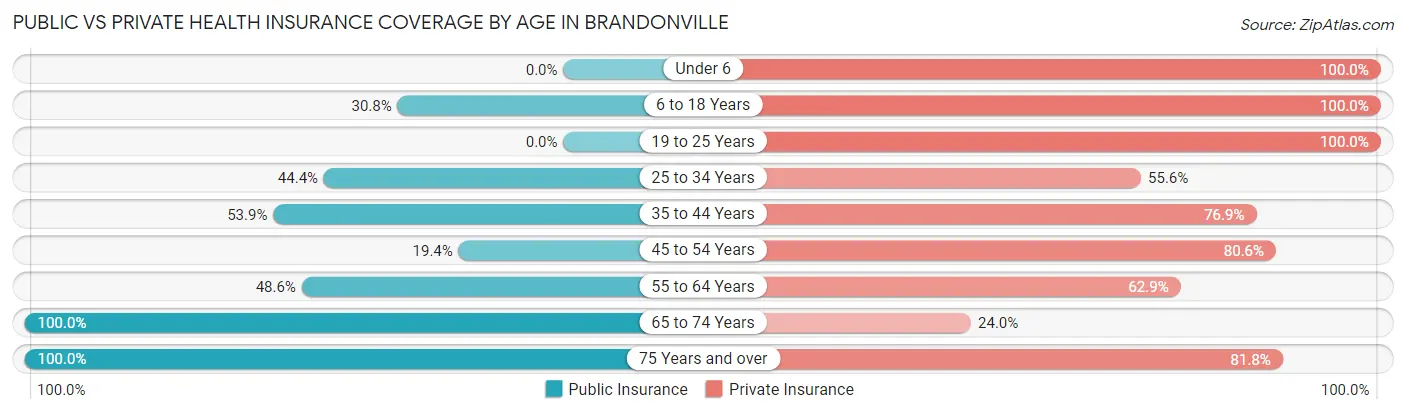
| Age Bracket | Public Insurance | Private Insurance |
| Under 6 | 0 (0.0%) | 3 (100.0%) |
| 6 to 18 Years | 4 (30.8%) | 13 (100.0%) |
| 19 to 25 Years | 0 (0.0%) | 16 (100.0%) |
| 25 to 34 Years | 4 (44.4%) | 5 (55.6%) |
| 35 to 44 Years | 7 (53.8%) | 10 (76.9%) |
| 45 to 54 Years | 7 (19.4%) | 29 (80.6%) |
| 55 to 64 Years | 17 (48.6%) | 22 (62.9%) |
| 65 to 74 Years | 25 (100.0%) | 6 (24.0%) |
| 75 Years and over | 11 (100.0%) | 9 (81.8%) |
| Total | 75 (46.6%) | 113 (70.2%) |
Disability Status by Sex by Age in Brandonville
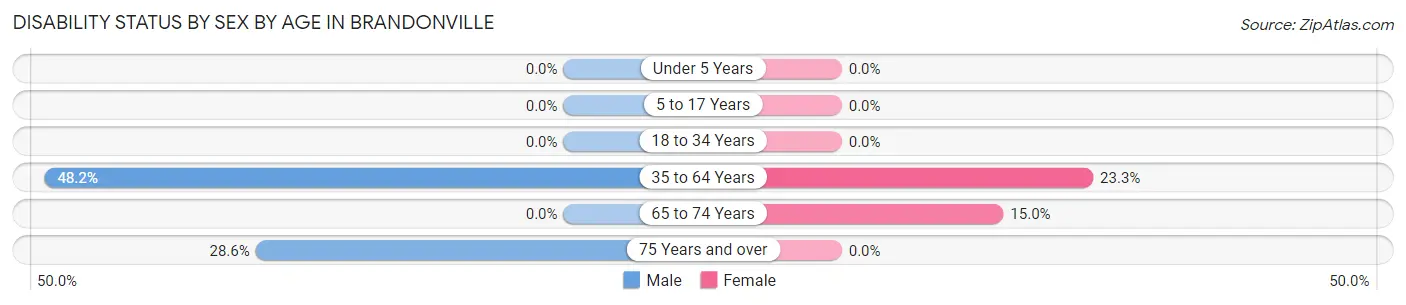
| Age Bracket | Male | Female |
| Under 5 Years | 0 (0.0%) | 0 (0.0%) |
| 5 to 17 Years | 0 (0.0%) | 0 (0.0%) |
| 18 to 34 Years | 0 (0.0%) | 0 (0.0%) |
| 35 to 64 Years | 26 (48.1%) | 7 (23.3%) |
| 65 to 74 Years | 0 (0.0%) | 3 (15.0%) |
| 75 Years and over | 2 (28.6%) | 0 (0.0%) |
Disability Class by Sex by Age in Brandonville
Disability Class: Hearing Difficulty
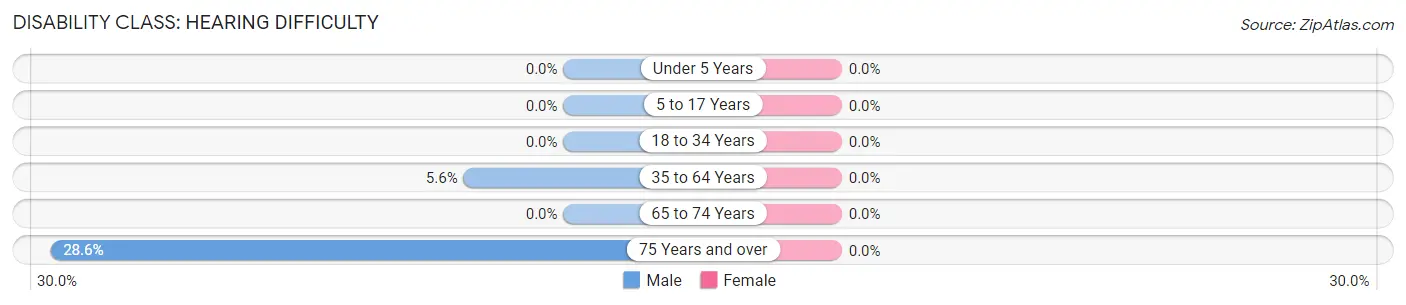
| Age Bracket | Male | Female |
| Under 5 Years | 0 (0.0%) | 0 (0.0%) |
| 5 to 17 Years | 0 (0.0%) | 0 (0.0%) |
| 18 to 34 Years | 0 (0.0%) | 0 (0.0%) |
| 35 to 64 Years | 3 (5.6%) | 0 (0.0%) |
| 65 to 74 Years | 0 (0.0%) | 0 (0.0%) |
| 75 Years and over | 2 (28.6%) | 0 (0.0%) |
Disability Class: Vision Difficulty
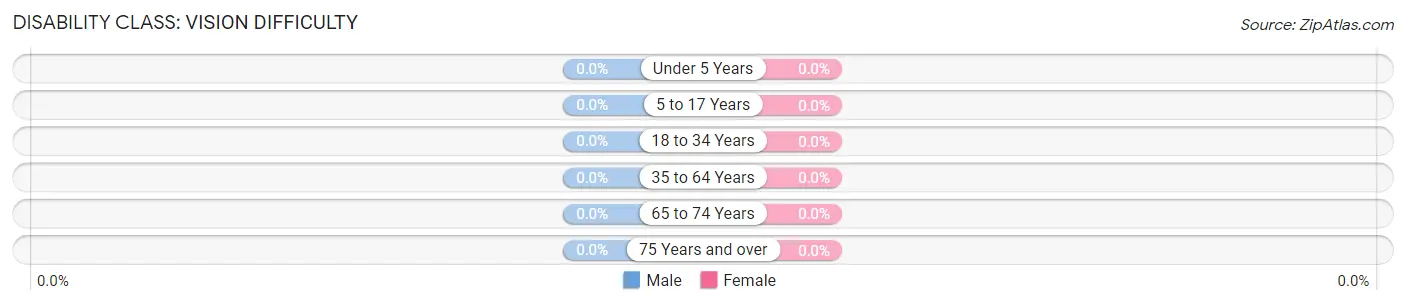
| Age Bracket | Male | Female |
| Under 5 Years | 0 (0.0%) | 0 (0.0%) |
| 5 to 17 Years | 0 (0.0%) | 0 (0.0%) |
| 18 to 34 Years | 0 (0.0%) | 0 (0.0%) |
| 35 to 64 Years | 0 (0.0%) | 0 (0.0%) |
| 65 to 74 Years | 0 (0.0%) | 0 (0.0%) |
| 75 Years and over | 0 (0.0%) | 0 (0.0%) |
Disability Class: Cognitive Difficulty
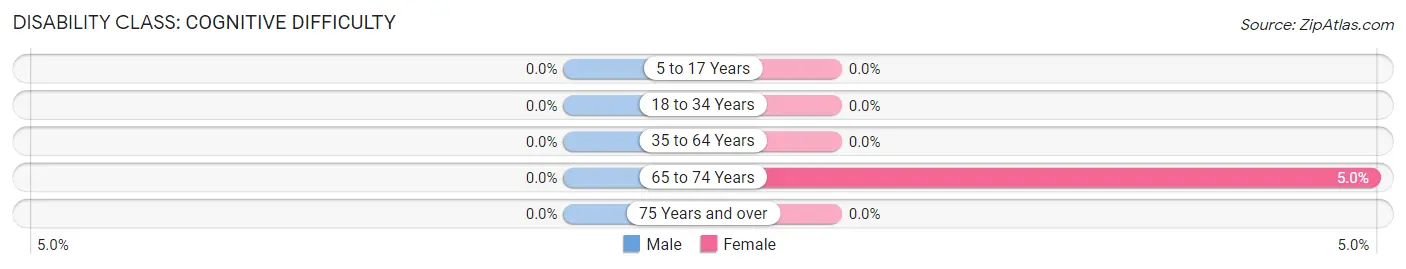
| Age Bracket | Male | Female |
| 5 to 17 Years | 0 (0.0%) | 0 (0.0%) |
| 18 to 34 Years | 0 (0.0%) | 0 (0.0%) |
| 35 to 64 Years | 0 (0.0%) | 0 (0.0%) |
| 65 to 74 Years | 0 (0.0%) | 1 (5.0%) |
| 75 Years and over | 0 (0.0%) | 0 (0.0%) |
Disability Class: Ambulatory Difficulty
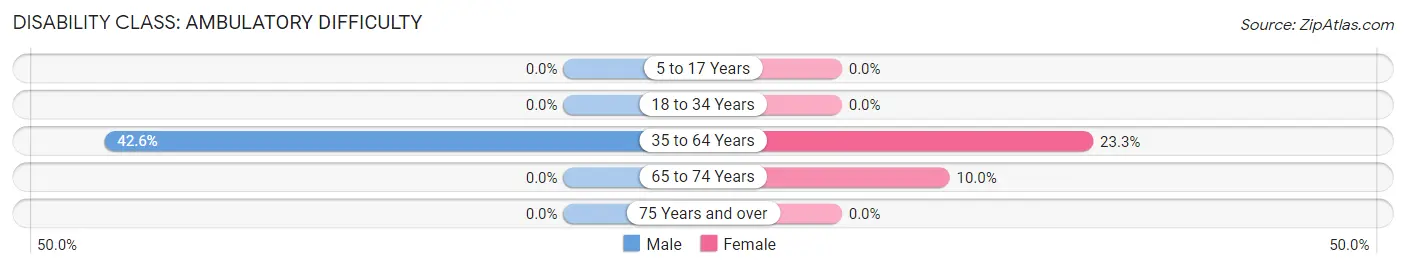
| Age Bracket | Male | Female |
| 5 to 17 Years | 0 (0.0%) | 0 (0.0%) |
| 18 to 34 Years | 0 (0.0%) | 0 (0.0%) |
| 35 to 64 Years | 23 (42.6%) | 7 (23.3%) |
| 65 to 74 Years | 0 (0.0%) | 2 (10.0%) |
| 75 Years and over | 0 (0.0%) | 0 (0.0%) |
Disability Class: Self-Care Difficulty
| Age Bracket | Male | Female |
| 5 to 17 Years | 0 (0.0%) | 0 (0.0%) |
| 18 to 34 Years | 0 (0.0%) | 0 (0.0%) |
| 35 to 64 Years | 0 (0.0%) | 0 (0.0%) |
| 65 to 74 Years | 0 (0.0%) | 0 (0.0%) |
| 75 Years and over | 0 (0.0%) | 0 (0.0%) |
Technology Access in Brandonville
Computing Device Access in Brandonville
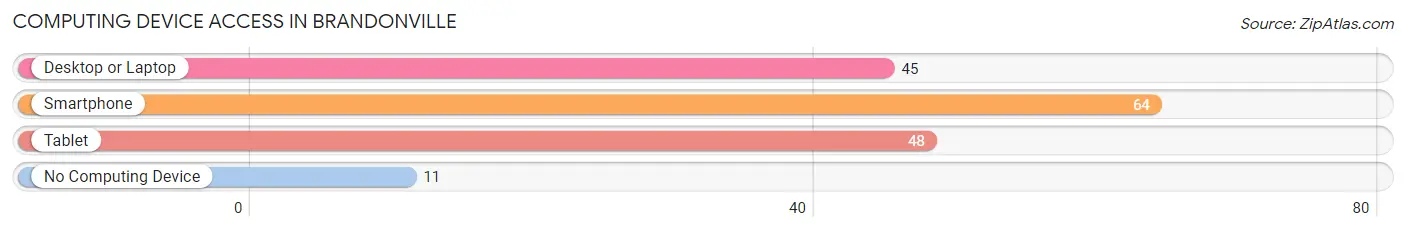
| Device Type | # Households | % Households |
| Desktop or Laptop | 45 | 58.4% |
| Smartphone | 64 | 83.1% |
| Tablet | 48 | 62.3% |
| No Computing Device | 11 | 14.3% |
| Total | 77 | 100.0% |
Internet Access in Brandonville
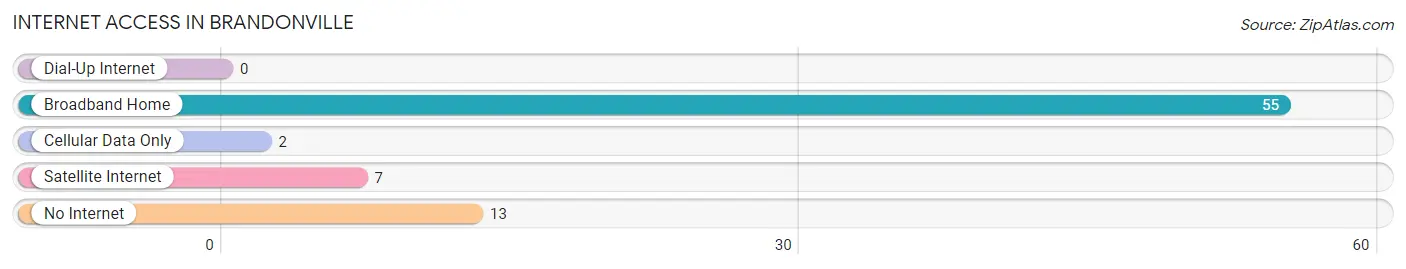
| Internet Type | # Households | % Households |
| Dial-Up Internet | 0 | 0.0% |
| Broadband Home | 55 | 71.4% |
| Cellular Data Only | 2 | 2.6% |
| Satellite Internet | 7 | 9.1% |
| No Internet | 13 | 16.9% |
| Total | 77 | 100.0% |
Brandonville Summary
Brandonville is a small borough located in Schuylkill County, Pennsylvania. It is situated in the southern part of the county, approximately two miles south of the county seat of Pottsville. The borough is located in the heart of the anthracite coal region of Pennsylvania, and has a population of approximately 1,000 people.
History
The area that is now Brandonville was first settled in the early 1800s by German immigrants. The town was originally known as “Brunnerville”, and was officially incorporated as a borough in 1876. The name was changed to Brandonville in 1883, in honor of a local landowner, William Brandon.
The town was a major center of the coal mining industry in the late 19th and early 20th centuries. The coal industry provided employment for many of the town’s residents, and the town was home to several coal mines. The coal industry declined in the mid-20th century, and the town’s economy shifted to other industries, such as manufacturing and tourism.
Geography
Brandonville is located in the southern part of Schuylkill County, approximately two miles south of the county seat of Pottsville. The borough is situated in the heart of the anthracite coal region of Pennsylvania. The town is located in the Appalachian Mountains, and is surrounded by rolling hills and forests. The town is located near several major highways, including Interstate 81 and the Pennsylvania Turnpike.
The climate in Brandonville is typical of the Appalachian region, with cold winters and warm summers. The average annual temperature is around 50 degrees Fahrenheit, and the average annual precipitation is around 40 inches.
Economy
The economy of Brandonville is largely based on tourism and manufacturing. The town is home to several tourist attractions, including the historic Brandonville Opera House and the Brandonville Museum. The town is also home to several manufacturing companies, including a paper mill and a furniture factory.
The town is also home to several small businesses, including restaurants, shops, and other services. The town is also home to several coal mines, although the coal industry has declined in recent years.
Demographics
As of the 2010 census, the population of Brandonville was 1,000 people. The racial makeup of the town was 97.2% White, 0.7% African American, 0.3% Native American, 0.2% Asian, and 1.6% from other races. The median household income was $37,500, and the median family income was $45,000.
The town is home to several churches, including the Brandonville United Methodist Church, the Brandonville Presbyterian Church, and the Brandonville Baptist Church. The town is also home to several schools, including the Brandonville Elementary School and the Brandonville High School.
Conclusion
Brandonville is a small borough located in Schuylkill County, Pennsylvania. It is situated in the southern part of the county, approximately two miles south of the county seat of Pottsville. The borough is located in the heart of the anthracite coal region of Pennsylvania, and has a population of approximately 1,000 people. The economy of Brandonville is largely based on tourism and manufacturing, and the town is home to several tourist attractions, manufacturing companies, and small businesses. The racial makeup of the town is 97.2% White, 0.7% African American, 0.3% Native American, 0.2% Asian, and 1.6% from other races. The median household income was $37,500, and the median family income was $45,000.
Common Questions
What is Per Capita Income in Brandonville?
Per Capita income in Brandonville is $25,584.
What is the Median Family Income in Brandonville?
Median Family Income in Brandonville is $80,833.
What is the Median Household income in Brandonville?
Median Household Income in Brandonville is $31,719.
What is Income or Wage Gap in Brandonville?
Income or Wage Gap in Brandonville is 65.7%.
Women in Brandonville earn 34.3 cents for every dollar earned by a man.
What is Inequality or Gini Index in Brandonville?
Inequality or Gini Index in Brandonville is 0.41.
What is the Total Population of Brandonville?
Total Population of Brandonville is 161.
What is the Total Male Population of Brandonville?
Total Male Population of Brandonville is 94.
What is the Total Female Population of Brandonville?
Total Female Population of Brandonville is 67.
What is the Ratio of Males per 100 Females in Brandonville?
There are 140.30 Males per 100 Females in Brandonville.
What is the Ratio of Females per 100 Males in Brandonville?
There are 71.28 Females per 100 Males in Brandonville.
What is the Median Population Age in Brandonville?
Median Population Age in Brandonville is 51.6 Years.
What is the Average Family Size in Brandonville
Average Family Size in Brandonville is 3.1 People.
What is the Average Household Size in Brandonville
Average Household Size in Brandonville is 2.1 People.
How Large is the Labor Force in Brandonville?
There are 74 People in the Labor Forcein in Brandonville.
What is the Percentage of People in the Labor Force in Brandonville?
49.7% of People are in the Labor Force in Brandonville.
What is the Unemployment Rate in Brandonville?
Unemployment Rate in Brandonville is 29.7%.