Cities with the Lowest Median Household Income in Pennsylvania
RELATED REPORTS & OPTIONS
Lowest Household Income
Pennsylvania
Compare Cities
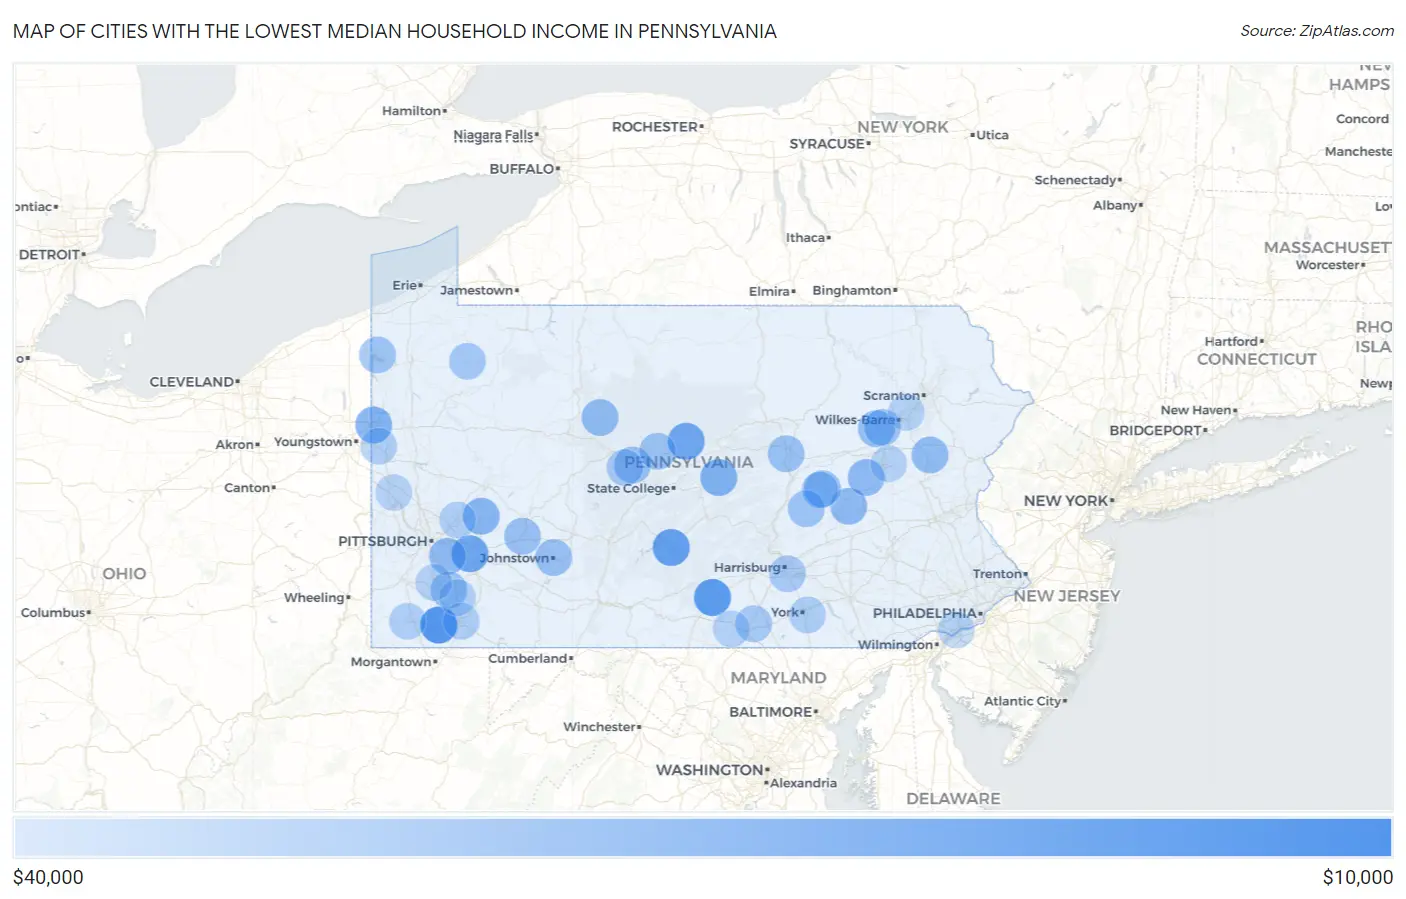
Map of Cities with the Lowest Median Household Income in Pennsylvania
$40,000
$0
Cities with the Lowest Median Household Income in Pennsylvania
| City | Household Income | vs State | vs National | |
| 1. | Aaronsburg Cdp Washington County | $13,269 | $73,170(-59.9k)#1 | $75,149(-61.9k)#75 |
| 2. | Nemacolin | $19,375 | $73,170(-53.8k)#2 | $75,149(-55.8k)#264 |
| 3. | Shippensburg University | $20,833 | $73,170(-52.3k)#3 | $75,149(-54.3k)#350 |
| 4. | Cedar Crest | $23,000 | $73,170(-50.2k)#4 | $75,149(-52.1k)#494 |
| 5. | St. Clair | $23,958 | $73,170(-49.2k)#5 | $75,149(-51.2k)#572 |
| 6. | Driftwood Borough | $24,167 | $73,170(-49.0k)#6 | $75,149(-51.0k)#593 |
| 7. | Harrison City | $24,659 | $73,170(-48.5k)#7 | $75,149(-50.5k)#638 |
| 8. | Orviston | $25,000 | $73,170(-48.2k)#8 | $75,149(-50.1k)#672 |
| 9. | Spring Drive Mobile Home Park | $26,000 | $73,170(-47.2k)#9 | $75,149(-49.1k)#763 |
| 10. | Braddock Borough | $27,212 | $73,170(-46.0k)#10 | $75,149(-47.9k)#921 |
| 11. | Coburn | $28,558 | $73,170(-44.6k)#11 | $75,149(-46.6k)#1,079 |
| 12. | Brownsville Borough | $28,657 | $73,170(-44.5k)#12 | $75,149(-46.5k)#1,085 |
| 13. | Renovo Borough | $28,750 | $73,170(-44.4k)#13 | $75,149(-46.4k)#1,097 |
| 14. | Hopewell Borough | $28,750 | $73,170(-44.4k)#14 | $75,149(-46.4k)#1,108 |
| 15. | Farrell | $29,063 | $73,170(-44.1k)#15 | $75,149(-46.1k)#1,156 |
| 16. | Rankin Borough | $29,107 | $73,170(-44.1k)#16 | $75,149(-46.0k)#1,165 |
| 17. | Homestead Borough | $29,306 | $73,170(-43.9k)#17 | $75,149(-45.8k)#1,197 |
| 18. | Lanesboro Borough | $29,576 | $73,170(-43.6k)#18 | $75,149(-45.6k)#1,247 |
| 19. | North Vandergrift | $29,643 | $73,170(-43.5k)#19 | $75,149(-45.5k)#1,251 |
| 20. | Branchdale | $31,319 | $73,170(-41.9k)#20 | $75,149(-43.8k)#1,507 |
| 21. | Mckeesport | $31,635 | $73,170(-41.5k)#21 | $75,149(-43.5k)#1,552 |
| 22. | Beavertown | $31,667 | $73,170(-41.5k)#22 | $75,149(-43.5k)#1,564 |
| 23. | Brandonville | $31,719 | $73,170(-41.5k)#23 | $75,149(-43.4k)#1,570 |
| 24. | Force | $31,786 | $73,170(-41.4k)#24 | $75,149(-43.4k)#1,579 |
| 25. | Albrightsville | $32,083 | $73,170(-41.1k)#25 | $75,149(-43.1k)#1,630 |
| 26. | Dushore Borough | $32,250 | $73,170(-40.9k)#26 | $75,149(-42.9k)#1,653 |
| 27. | South Fork Borough | $32,273 | $73,170(-40.9k)#27 | $75,149(-42.9k)#1,658 |
| 28. | Glen Lyon | $32,746 | $73,170(-40.4k)#28 | $75,149(-42.4k)#1,728 |
| 29. | Shamokin | $32,753 | $73,170(-40.4k)#29 | $75,149(-42.4k)#1,731 |
| 30. | Morrisdale | $33,117 | $73,170(-40.1k)#30 | $75,149(-42.0k)#1,786 |
| 31. | Black Lick | $33,375 | $73,170(-39.8k)#31 | $75,149(-41.8k)#1,840 |
| 32. | Mcconnellsburg Borough | $33,458 | $73,170(-39.7k)#32 | $75,149(-41.7k)#1,859 |
| 33. | Johnstown | $33,466 | $73,170(-39.7k)#33 | $75,149(-41.7k)#1,860 |
| 34. | West Milton | $33,514 | $73,170(-39.7k)#34 | $75,149(-41.6k)#1,871 |
| 35. | Dale Borough | $33,542 | $73,170(-39.6k)#35 | $75,149(-41.6k)#1,874 |
| 36. | Coaldale Borough Bedford County | $33,750 | $73,170(-39.4k)#36 | $75,149(-41.4k)#1,941 |
| 37. | Coalmont Borough | $33,750 | $73,170(-39.4k)#37 | $75,149(-41.4k)#1,946 |
| 38. | Mckees Rocks Borough | $33,958 | $73,170(-39.2k)#38 | $75,149(-41.2k)#1,978 |
| 39. | Moshannon | $34,063 | $73,170(-39.1k)#39 | $75,149(-41.1k)#2,011 |
| 40. | Klingerstown | $34,318 | $73,170(-38.9k)#40 | $75,149(-40.8k)#2,061 |
| 41. | Sheatown | $34,352 | $73,170(-38.8k)#41 | $75,149(-40.8k)#2,067 |
| 42. | Fairhope | $34,363 | $73,170(-38.8k)#42 | $75,149(-40.8k)#2,068 |
| 43. | Emporium Borough | $34,387 | $73,170(-38.8k)#43 | $75,149(-40.8k)#2,092 |
| 44. | Pymatuning North | $34,394 | $73,170(-38.8k)#44 | $75,149(-40.8k)#2,093 |
| 45. | Honesdale Borough | $34,700 | $73,170(-38.5k)#45 | $75,149(-40.4k)#2,163 |
| 46. | Orbisonia Borough | $34,861 | $73,170(-38.3k)#46 | $75,149(-40.3k)#2,203 |
| 47. | Briar Creek Borough | $34,886 | $73,170(-38.3k)#47 | $75,149(-40.3k)#2,212 |
| 48. | Donegal Borough | $35,000 | $73,170(-38.2k)#48 | $75,149(-40.1k)#2,252 |
| 49. | Alverda | $35,208 | $73,170(-38.0k)#49 | $75,149(-39.9k)#2,281 |
| 50. | East Pittsburgh Borough | $35,483 | $73,170(-37.7k)#50 | $75,149(-39.7k)#2,344 |
| 51. | New Columbus Borough | $35,625 | $73,170(-37.5k)#51 | $75,149(-39.5k)#2,364 |
| 52. | Mount Oliver Borough | $35,640 | $73,170(-37.5k)#52 | $75,149(-39.5k)#2,372 |
| 53. | Pitcairn Borough | $35,829 | $73,170(-37.3k)#53 | $75,149(-39.3k)#2,422 |
| 54. | Titusville | $36,071 | $73,170(-37.1k)#54 | $75,149(-39.1k)#2,474 |
| 55. | New Bethlehem Borough | $36,103 | $73,170(-37.1k)#55 | $75,149(-39.0k)#2,483 |
| 56. | Braddock Hills Borough | $36,138 | $73,170(-37.0k)#56 | $75,149(-39.0k)#2,489 |
| 57. | Wilmerding Borough | $36,161 | $73,170(-37.0k)#57 | $75,149(-39.0k)#2,494 |
| 58. | Lewistown Borough | $36,166 | $73,170(-37.0k)#58 | $75,149(-39.0k)#2,497 |
| 59. | Saxton Borough | $36,250 | $73,170(-36.9k)#59 | $75,149(-38.9k)#2,517 |
| 60. | Edwardsville Borough | $36,299 | $73,170(-36.9k)#60 | $75,149(-38.9k)#2,552 |
| 61. | Benton Borough | $36,500 | $73,170(-36.7k)#61 | $75,149(-38.6k)#2,601 |
| 62. | Hunterstown | $36,528 | $73,170(-36.6k)#62 | $75,149(-38.6k)#2,610 |
| 63. | West Decatur | $36,591 | $73,170(-36.6k)#63 | $75,149(-38.6k)#2,631 |
| 64. | New Market | $36,645 | $73,170(-36.5k)#64 | $75,149(-38.5k)#2,654 |
| 65. | Coal Center Borough | $36,750 | $73,170(-36.4k)#65 | $75,149(-38.4k)#2,676 |
| 66. | Fairview Ferndale | $37,163 | $73,170(-36.0k)#66 | $75,149(-38.0k)#2,766 |
| 67. | Fairchance Borough | $37,232 | $73,170(-35.9k)#67 | $75,149(-37.9k)#2,786 |
| 68. | Newburg | $37,292 | $73,170(-35.9k)#68 | $75,149(-37.9k)#2,815 |
| 69. | Glen Campbell Borough | $37,321 | $73,170(-35.8k)#69 | $75,149(-37.8k)#2,823 |
| 70. | Freeport Borough | $37,336 | $73,170(-35.8k)#70 | $75,149(-37.8k)#2,825 |
| 71. | North Charleroi Borough | $37,409 | $73,170(-35.8k)#71 | $75,149(-37.7k)#2,846 |
| 72. | Marion Heights Borough | $37,417 | $73,170(-35.8k)#72 | $75,149(-37.7k)#2,848 |
| 73. | Mahanoy City Borough | $37,440 | $73,170(-35.7k)#73 | $75,149(-37.7k)#2,855 |
| 74. | Queens Gate | $37,557 | $73,170(-35.6k)#74 | $75,149(-37.6k)#2,902 |
| 75. | Everett Borough | $37,708 | $73,170(-35.5k)#75 | $75,149(-37.4k)#2,941 |
| 76. | Ursina Borough | $37,708 | $73,170(-35.5k)#76 | $75,149(-37.4k)#2,944 |
| 77. | Uniontown | $37,886 | $73,170(-35.3k)#77 | $75,149(-37.3k)#2,989 |
| 78. | Newry Borough | $37,917 | $73,170(-35.3k)#78 | $75,149(-37.2k)#2,996 |
| 79. | Ohiopyle Borough | $38,000 | $73,170(-35.2k)#79 | $75,149(-37.1k)#3,013 |
| 80. | Arnold | $38,150 | $73,170(-35.0k)#80 | $75,149(-37.0k)#3,061 |
| 81. | Frizzleburg | $38,188 | $73,170(-35.0k)#81 | $75,149(-37.0k)#3,071 |
| 82. | West Waynesburg | $38,268 | $73,170(-34.9k)#82 | $75,149(-36.9k)#3,092 |
| 83. | Eldred Borough | $38,345 | $73,170(-34.8k)#83 | $75,149(-36.8k)#3,119 |
| 84. | Mount Union Borough | $38,382 | $73,170(-34.8k)#84 | $75,149(-36.8k)#3,131 |
| 85. | Star Junction | $38,478 | $73,170(-34.7k)#85 | $75,149(-36.7k)#3,161 |
| 86. | Orrtanna | $38,750 | $73,170(-34.4k)#86 | $75,149(-36.4k)#3,282 |
| 87. | Belle Vernon Borough | $39,007 | $73,170(-34.2k)#87 | $75,149(-36.1k)#3,363 |
| 88. | Franklin Borough | $39,044 | $73,170(-34.1k)#88 | $75,149(-36.1k)#3,374 |
| 89. | East Conemaugh Borough | $39,063 | $73,170(-34.1k)#89 | $75,149(-36.1k)#3,378 |
| 90. | Wyalusing Borough | $39,063 | $73,170(-34.1k)#90 | $75,149(-36.1k)#3,379 |
| 91. | Edinboro Borough | $39,102 | $73,170(-34.1k)#91 | $75,149(-36.0k)#3,401 |
| 92. | Chester | $39,193 | $73,170(-34.0k)#92 | $75,149(-36.0k)#3,431 |
| 93. | Beaver Falls | $39,194 | $73,170(-34.0k)#93 | $75,149(-36.0k)#3,432 |
| 94. | Ashley Borough | $39,234 | $73,170(-33.9k)#94 | $75,149(-35.9k)#3,449 |
| 95. | Nanty Glo Borough | $39,242 | $73,170(-33.9k)#95 | $75,149(-35.9k)#3,453 |
| 96. | Cokeburg Borough | $39,250 | $73,170(-33.9k)#96 | $75,149(-35.9k)#3,455 |
| 97. | Mill Creek Borough | $39,250 | $73,170(-33.9k)#97 | $75,149(-35.9k)#3,456 |
| 98. | Van Voorhis | $39,294 | $73,170(-33.9k)#98 | $75,149(-35.9k)#3,470 |
| 99. | Inkerman | $39,324 | $73,170(-33.8k)#99 | $75,149(-35.8k)#3,481 |
| 100. | Hazleton | $39,362 | $73,170(-33.8k)#100 | $75,149(-35.8k)#3,489 |
Common Questions
What are the Top 10 Cities with the Lowest Median Household Income in Pennsylvania?
Top 10 Cities with the Lowest Median Household Income in Pennsylvania are:
#1
$19,375
#2
$20,833
#3
$23,000
#4
$24,659
#5
$25,000
#6
$28,558
#7
$29,063
#8
$29,643
#9
$31,319
#10
$31,635
What city has the Lowest Median Household Income in Pennsylvania?
Nemacolin has the Lowest Median Household Income in Pennsylvania with $19,375.
What is the Median Household Income in the State of Pennsylvania?
Median Household Income in Pennsylvania is $73,170.
What is the Median Household Income in the United States?
Median Household Income in the United States is $75,149.