Shippensburg University, PA Map & Demographics
Shippensburg University Map
Shippensburg University Overview
$16,091
PER CAPITA INCOME
$20,833
AVG HOUSEHOLD INCOME
23.0%
WAGE / INCOME GAP [ % ]
77.0¢/ $1
WAGE / INCOME GAP [ $ ]
0.23
INEQUALITY / GINI INDEX
1,924
TOTAL POPULATION
1,051
MALE POPULATION
873
FEMALE POPULATION
120.39
MALES / 100 FEMALES
83.06
FEMALES / 100 MALES
19.6
MEDIAN AGE
2.2
AVG FAMILY SIZE
2.6
AVG HOUSEHOLD SIZE
1,262
LABOR FORCE [ PEOPLE ]
65.6%
PERCENT IN LABOR FORCE
16.5%
UNEMPLOYMENT RATE
Income in Shippensburg University
Income Overview in Shippensburg University
| Characteristic | Number | Measure |
| Per Capita Income | 1,924 | $16,091 |
| Median Family Income | 4 | $0 |
| Mean Family Income | 4 | $0 |
| Median Household Income | 26 | $20,833 |
| Mean Household Income | 26 | $26,600 |
| Income Deficit | 4 | $0 |
| Wage / Income Gap (%) | 1,924 | 22.96% |
| Wage / Income Gap ($) | 1,924 | 77.04¢ per $1 |
| Gini / Inequality Index | 1,924 | 0.23 |
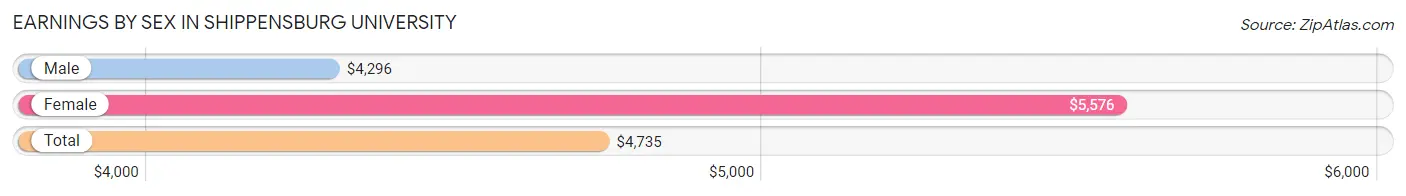
Earnings by Sex in Shippensburg University
Average Earnings in Shippensburg University are $4,735, $4,296 for men and $5,576 for women, a difference of 23.0%.
| Sex | Number | Average Earnings |
| Male | 960 (54.0%) | $4,296 |
| Female | 818 (46.0%) | $5,576 |
| Total | 1,778 (100.0%) | $4,735 |
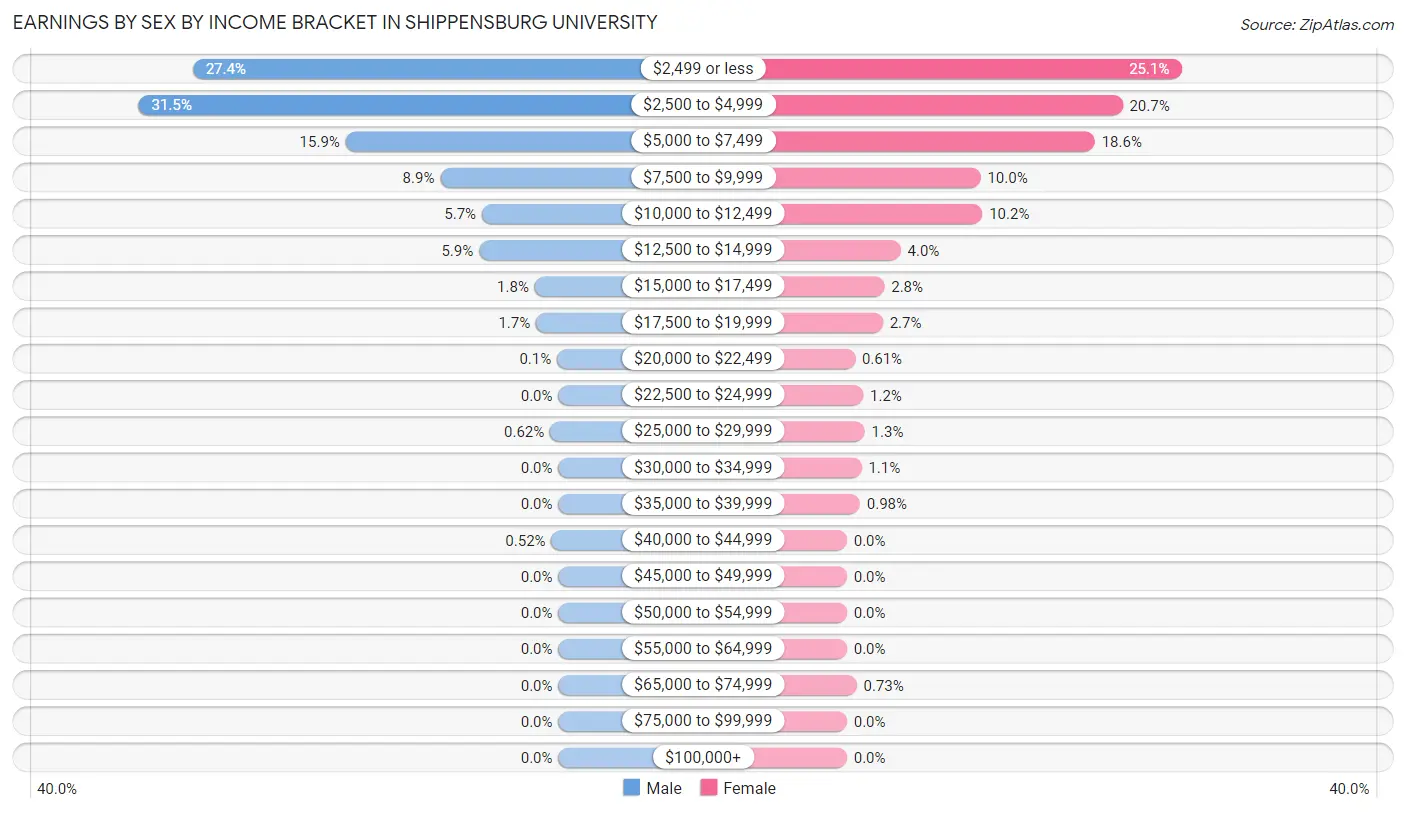
Earnings by Sex by Income Bracket in Shippensburg University
The most common earnings brackets in Shippensburg University are $2,500 to $4,999 for men (302 | 31.5%) and $2,499 or less for women (205 | 25.1%).
| Income | Male | Female |
| $2,499 or less | 263 (27.4%) | 205 (25.1%) |
| $2,500 to $4,999 | 302 (31.5%) | 169 (20.7%) |
| $5,000 to $7,499 | 153 (15.9%) | 152 (18.6%) |
| $7,500 to $9,999 | 85 (8.8%) | 82 (10.0%) |
| $10,000 to $12,499 | 55 (5.7%) | 83 (10.2%) |
| $12,500 to $14,999 | 57 (5.9%) | 33 (4.0%) |
| $15,000 to $17,499 | 17 (1.8%) | 23 (2.8%) |
| $17,500 to $19,999 | 16 (1.7%) | 22 (2.7%) |
| $20,000 to $22,499 | 1 (0.1%) | 5 (0.6%) |
| $22,500 to $24,999 | 0 (0.0%) | 10 (1.2%) |
| $25,000 to $29,999 | 6 (0.6%) | 11 (1.3%) |
| $30,000 to $34,999 | 0 (0.0%) | 9 (1.1%) |
| $35,000 to $39,999 | 0 (0.0%) | 8 (1.0%) |
| $40,000 to $44,999 | 5 (0.5%) | 0 (0.0%) |
| $45,000 to $49,999 | 0 (0.0%) | 0 (0.0%) |
| $50,000 to $54,999 | 0 (0.0%) | 0 (0.0%) |
| $55,000 to $64,999 | 0 (0.0%) | 0 (0.0%) |
| $65,000 to $74,999 | 0 (0.0%) | 6 (0.7%) |
| $75,000 to $99,999 | 0 (0.0%) | 0 (0.0%) |
| $100,000+ | 0 (0.0%) | 0 (0.0%) |
| Total | 960 (100.0%) | 818 (100.0%) |
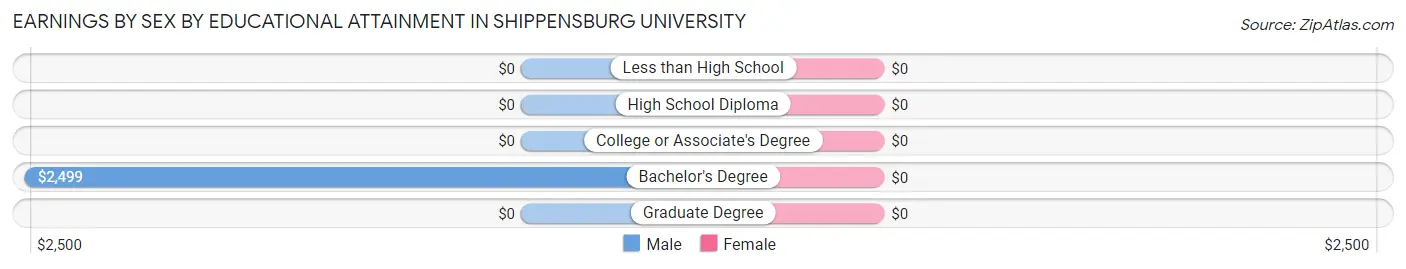
Earnings by Sex by Educational Attainment in Shippensburg University
| Educational Attainment | Male Income | Female Income |
| Less than High School | - | - |
| High School Diploma | - | - |
| College or Associate's Degree | - | - |
| Bachelor's Degree | $2,499 | $0 |
| Graduate Degree | - | - |
| Total | $2,499 | $0 |
Family Income in Shippensburg University
Family Income Brackets in Shippensburg University
According to the Shippensburg University family income data, there are 4 families falling into the $25,000 to $34,999 income range, which is the most common income bracket and makes up 100.0% of all families.
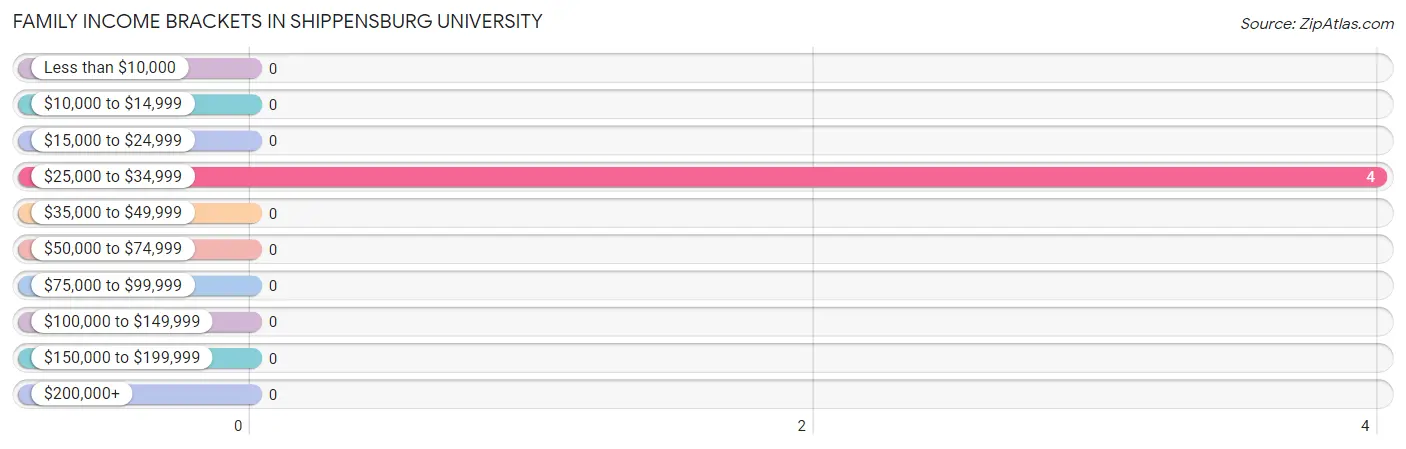
| Income Bracket | # Families | % Families |
| Less than $10,000 | 0 | 0.0% |
| $10,000 to $14,999 | 0 | 0.0% |
| $15,000 to $24,999 | 0 | 0.0% |
| $25,000 to $34,999 | 4 | 100.0% |
| $35,000 to $49,999 | 0 | 0.0% |
| $50,000 to $74,999 | 0 | 0.0% |
| $75,000 to $99,999 | 0 | 0.0% |
| $100,000 to $149,999 | 0 | 0.0% |
| $150,000 to $199,999 | 0 | 0.0% |
| $200,000+ | 0 | 0.0% |
Family Income by Famaliy Size in Shippensburg University
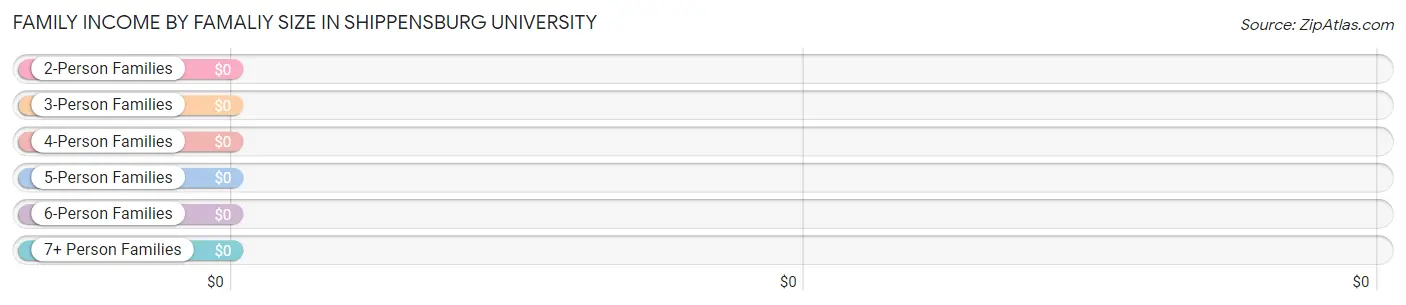
| Income Bracket | # Families | Median Income |
| 2-Person Families | 4 (100.0%) | $0 |
| 3-Person Families | 0 (0.0%) | $0 |
| 4-Person Families | 0 (0.0%) | $0 |
| 5-Person Families | 0 (0.0%) | $0 |
| 6-Person Families | 0 (0.0%) | $0 |
| 7+ Person Families | 0 (0.0%) | $0 |
| Total | 4 (100.0%) | $0 |
Family Income by Number of Earners in Shippensburg University
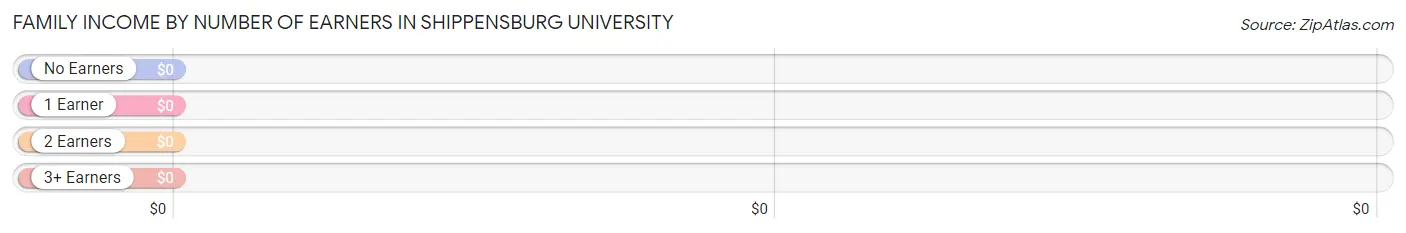
| Number of Earners | # Families | Median Income |
| No Earners | 0 (0.0%) | $0 |
| 1 Earner | 0 (0.0%) | $0 |
| 2 Earners | 4 (100.0%) | $0 |
| 3+ Earners | 0 (0.0%) | $0 |
| Total | 4 (100.0%) | $0 |
Household Income in Shippensburg University
Household Income Brackets in Shippensburg University
With 17 households falling in the category, the $15,000 to $24,999 income range is the most frequent in Shippensburg University, accounting for 65.4% of all households.
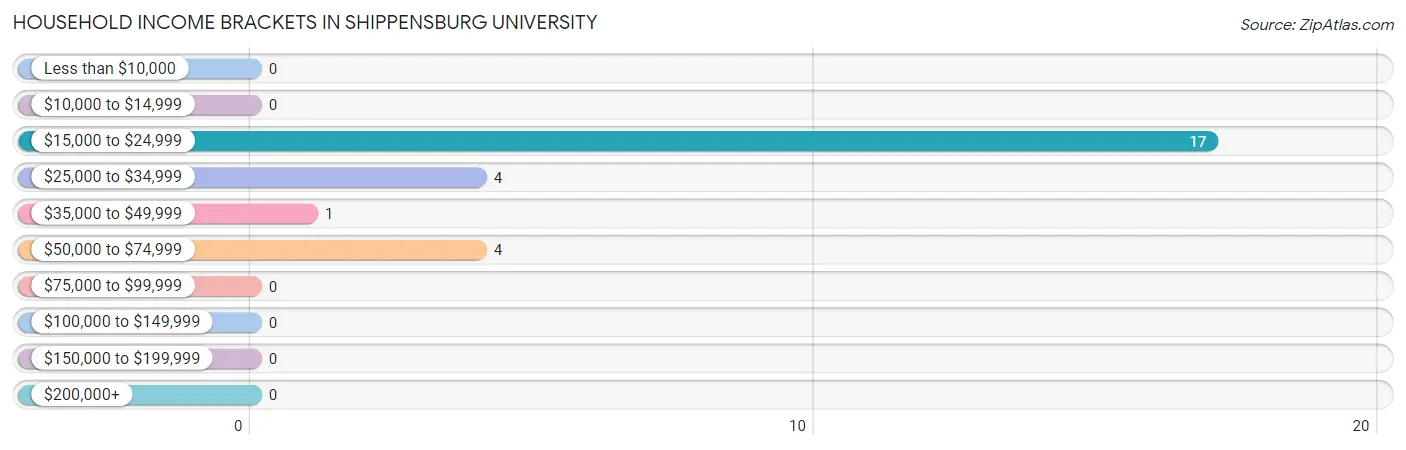
| Income Bracket | # Households | % Households |
| Less than $10,000 | 0 | 0.0% |
| $10,000 to $14,999 | 0 | 0.0% |
| $15,000 to $24,999 | 17 | 65.4% |
| $25,000 to $34,999 | 4 | 15.4% |
| $35,000 to $49,999 | 1 | 3.8% |
| $50,000 to $74,999 | 4 | 15.4% |
| $75,000 to $99,999 | 0 | 0.0% |
| $100,000 to $149,999 | 0 | 0.0% |
| $150,000 to $199,999 | 0 | 0.0% |
| $200,000+ | 0 | 0.0% |
Household Income by Householder Age in Shippensburg University
The median household income in Shippensburg University is $20,833, with the highest median household income of $41,250 found in the 25 to 44 years age bracket for the primary householder. A total of 9 households (34.6%) fall into this category. Meanwhile, the 15 to 24 years age bracket for the primary householder has the lowest median household income of $0, with 17 households (65.4%) in this group.
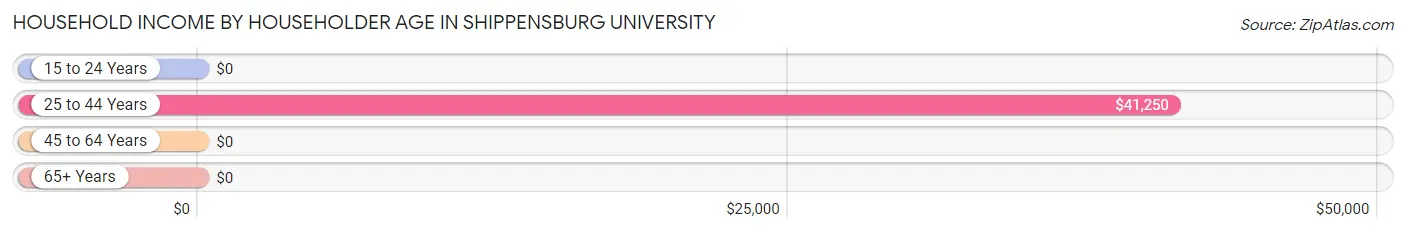
| Income Bracket | # Households | Median Income |
| 15 to 24 Years | 17 (65.4%) | $0 |
| 25 to 44 Years | 9 (34.6%) | $41,250 |
| 45 to 64 Years | 0 (0.0%) | $0 |
| 65+ Years | 0 (0.0%) | $0 |
| Total | 26 (100.0%) | $20,833 |
Poverty in Shippensburg University
Income Below Poverty by Sex and Age in Shippensburg University
With 85.7% poverty level for males and 20.0% for females among the residents of Shippensburg University, 18 to 24 year old males and 18 to 24 year old females are the most vulnerable to poverty, with 36 males (100.0%) and 5 females (29.4%) in their respective age groups living below the poverty level.
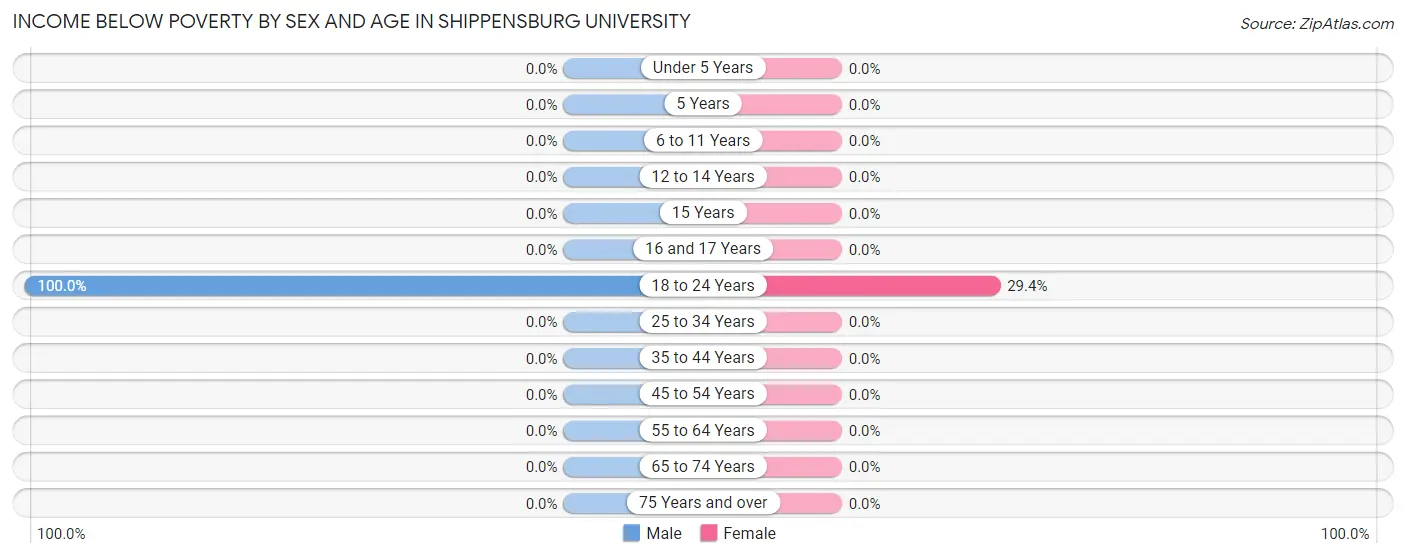
| Age Bracket | Male | Female |
| Under 5 Years | 0 (0.0%) | 0 (0.0%) |
| 5 Years | 0 (0.0%) | 0 (0.0%) |
| 6 to 11 Years | 0 (0.0%) | 0 (0.0%) |
| 12 to 14 Years | 0 (0.0%) | 0 (0.0%) |
| 15 Years | 0 (0.0%) | 0 (0.0%) |
| 16 and 17 Years | 0 (0.0%) | 0 (0.0%) |
| 18 to 24 Years | 36 (100.0%) | 5 (29.4%) |
| 25 to 34 Years | 0 (0.0%) | 0 (0.0%) |
| 35 to 44 Years | 0 (0.0%) | 0 (0.0%) |
| 45 to 54 Years | 0 (0.0%) | 0 (0.0%) |
| 55 to 64 Years | 0 (0.0%) | 0 (0.0%) |
| 65 to 74 Years | 0 (0.0%) | 0 (0.0%) |
| 75 Years and over | 0 (0.0%) | 0 (0.0%) |
| Total | 36 (85.7%) | 5 (20.0%) |
Income Above Poverty by Sex and Age in Shippensburg University
According to the poverty statistics in Shippensburg University, males aged 25 to 34 years and females aged 25 to 34 years are the age groups that are most secure financially, with 100.0% of males and 100.0% of females in these age groups living above the poverty line.
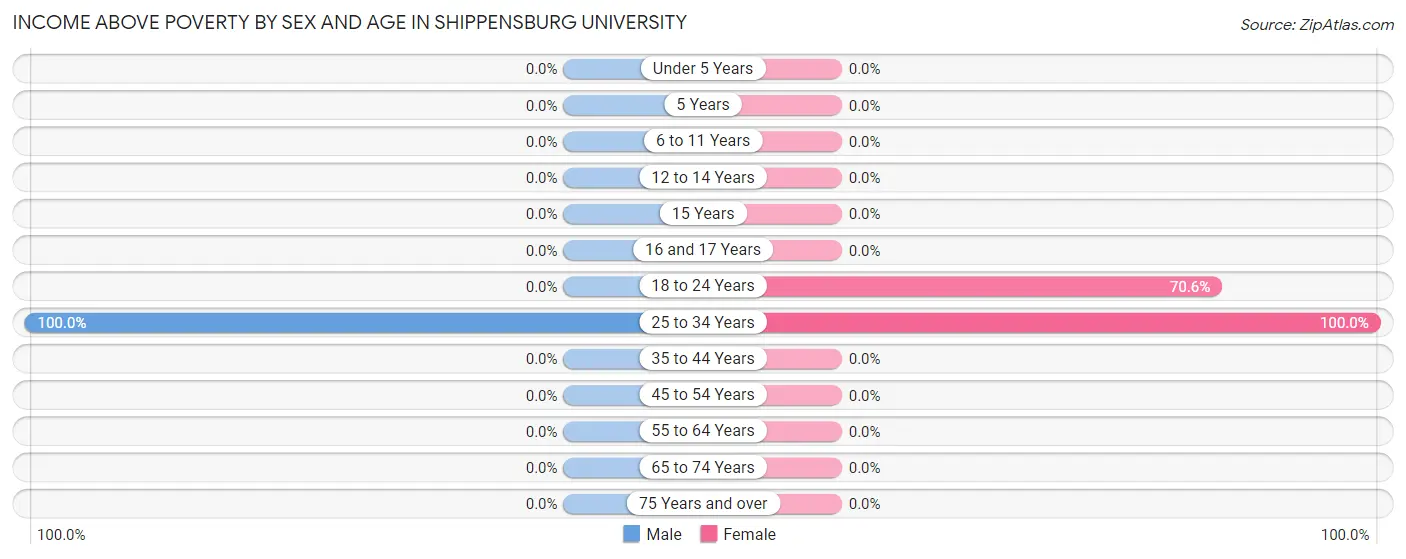
| Age Bracket | Male | Female |
| Under 5 Years | 0 (0.0%) | 0 (0.0%) |
| 5 Years | 0 (0.0%) | 0 (0.0%) |
| 6 to 11 Years | 0 (0.0%) | 0 (0.0%) |
| 12 to 14 Years | 0 (0.0%) | 0 (0.0%) |
| 15 Years | 0 (0.0%) | 0 (0.0%) |
| 16 and 17 Years | 0 (0.0%) | 0 (0.0%) |
| 18 to 24 Years | 0 (0.0%) | 12 (70.6%) |
| 25 to 34 Years | 6 (100.0%) | 8 (100.0%) |
| 35 to 44 Years | 0 (0.0%) | 0 (0.0%) |
| 45 to 54 Years | 0 (0.0%) | 0 (0.0%) |
| 55 to 64 Years | 0 (0.0%) | 0 (0.0%) |
| 65 to 74 Years | 0 (0.0%) | 0 (0.0%) |
| 75 Years and over | 0 (0.0%) | 0 (0.0%) |
| Total | 6 (14.3%) | 20 (80.0%) |
Income Below Poverty Among Married-Couple Families in Shippensburg University
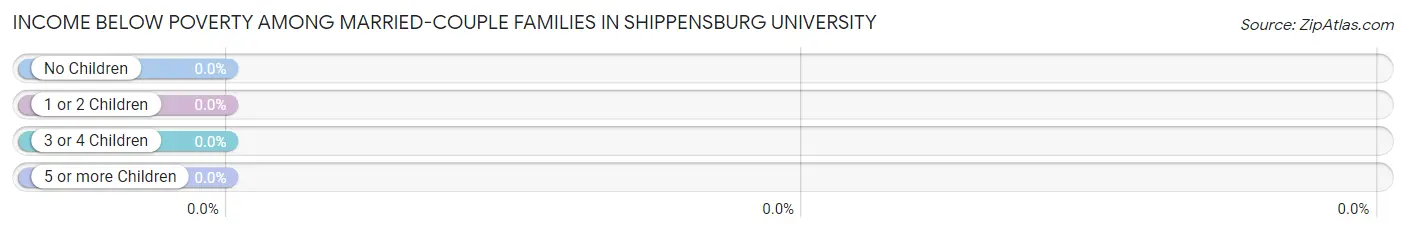
| Children | Above Poverty | Below Poverty |
| No Children | 4 (100.0%) | 0 (0.0%) |
| 1 or 2 Children | 0 (0.0%) | 0 (0.0%) |
| 3 or 4 Children | 0 (0.0%) | 0 (0.0%) |
| 5 or more Children | 0 (0.0%) | 0 (0.0%) |
| Total | 4 (100.0%) | 0 (0.0%) |
Income Below Poverty Among Single-Parent Households in Shippensburg University
| Children | Single Father | Single Mother |
| No Children | 0 (0.0%) | 0 (0.0%) |
| 1 or 2 Children | 0 (0.0%) | 0 (0.0%) |
| 3 or 4 Children | 0 (0.0%) | 0 (0.0%) |
| 5 or more Children | 0 (0.0%) | 0 (0.0%) |
| Total | 0 (0.0%) | 0 (0.0%) |
Income Below Poverty Among Married-Couple vs Single-Parent Households in Shippensburg University
| Children | Married-Couple Families | Single-Parent Households |
| No Children | 0 (0.0%) | 0 (0.0%) |
| 1 or 2 Children | 0 (0.0%) | 0 (0.0%) |
| 3 or 4 Children | 0 (0.0%) | 0 (0.0%) |
| 5 or more Children | 0 (0.0%) | 0 (0.0%) |
| Total | 0 (0.0%) | 0 (0.0%) |
Race in Shippensburg University
The most populous races in Shippensburg University are White / Caucasian (1,373 | 71.4%), Black / African American (307 | 16.0%), and Two or more Races (151 | 7.9%).
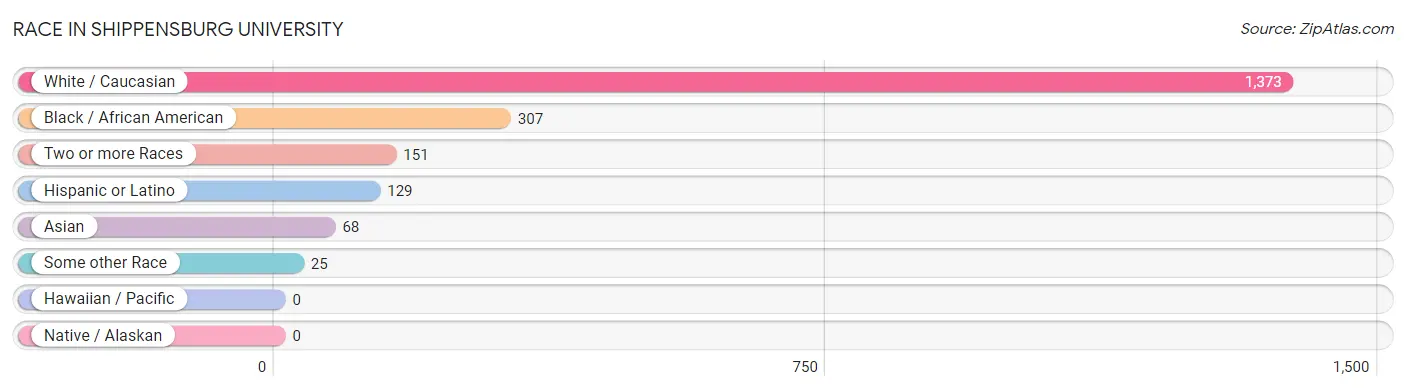
| Race | # Population | % Population |
| Asian | 68 | 3.5% |
| Black / African American | 307 | 16.0% |
| Hawaiian / Pacific | 0 | 0.0% |
| Hispanic or Latino | 129 | 6.7% |
| Native / Alaskan | 0 | 0.0% |
| White / Caucasian | 1,373 | 71.4% |
| Two or more Races | 151 | 7.9% |
| Some other Race | 25 | 1.3% |
| Total | 1,924 | 100.0% |
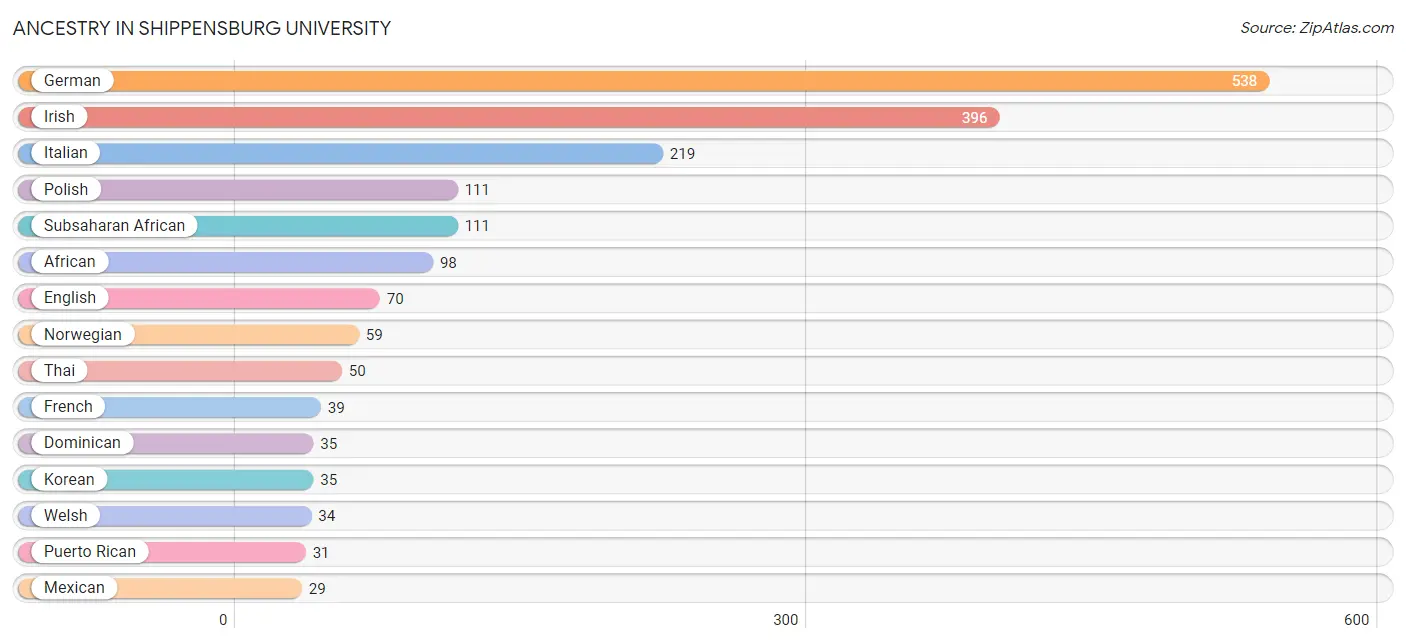
Ancestry in Shippensburg University
The most populous ancestries reported in Shippensburg University are German (538 | 28.0%), Irish (396 | 20.6%), Italian (219 | 11.4%), Polish (111 | 5.8%), and Subsaharan African (111 | 5.8%), together accounting for 71.5% of all Shippensburg University residents.
| Ancestry | # Population | % Population |
| African | 98 | 5.1% |
| American | 6 | 0.3% |
| Arab | 5 | 0.3% |
| Austrian | 4 | 0.2% |
| Brazilian | 4 | 0.2% |
| British | 9 | 0.5% |
| Burmese | 3 | 0.2% |
| Central American | 12 | 0.6% |
| Cherokee | 5 | 0.3% |
| Croatian | 11 | 0.6% |
| Danish | 12 | 0.6% |
| Dominican | 35 | 1.8% |
| English | 70 | 3.6% |
| Ethiopian | 8 | 0.4% |
| French | 39 | 2.0% |
| German | 538 | 28.0% |
| Greek | 19 | 1.0% |
| Guatemalan | 6 | 0.3% |
| Haitian | 15 | 0.8% |
| Indian (Asian) | 17 | 0.9% |
| Irish | 396 | 20.6% |
| Iroquois | 1 | 0.1% |
| Italian | 219 | 11.4% |
| Jamaican | 7 | 0.4% |
| Korean | 35 | 1.8% |
| Lebanese | 5 | 0.3% |
| Lithuanian | 8 | 0.4% |
| Mexican | 29 | 1.5% |
| Norwegian | 59 | 3.1% |
| Pakistani | 16 | 0.8% |
| Pennsylvania German | 6 | 0.3% |
| Peruvian | 5 | 0.3% |
| Polish | 111 | 5.8% |
| Portuguese | 6 | 0.3% |
| Puerto Rican | 31 | 1.6% |
| Romanian | 11 | 0.6% |
| Russian | 23 | 1.2% |
| Salvadoran | 6 | 0.3% |
| Scandinavian | 5 | 0.3% |
| Scotch-Irish | 13 | 0.7% |
| Scottish | 21 | 1.1% |
| Serbian | 11 | 0.6% |
| Slovak | 16 | 0.8% |
| South American | 10 | 0.5% |
| Sri Lankan | 6 | 0.3% |
| Subsaharan African | 111 | 5.8% |
| Swedish | 5 | 0.3% |
| Swiss | 6 | 0.3% |
| Thai | 50 | 2.6% |
| Trinidadian and Tobagonian | 9 | 0.5% |
| Ukrainian | 18 | 0.9% |
| Venezuelan | 5 | 0.3% |
| Welsh | 34 | 1.8% | View All 53 Rows |
Immigrants in Shippensburg University
The most numerous immigrant groups reported in Shippensburg University came from Asia (15 | 0.8%), Africa (9 | 0.5%), Eastern Africa (9 | 0.5%), Ethiopia (9 | 0.5%), and Australia (7 | 0.4%), together accounting for 2.5% of all Shippensburg University residents.
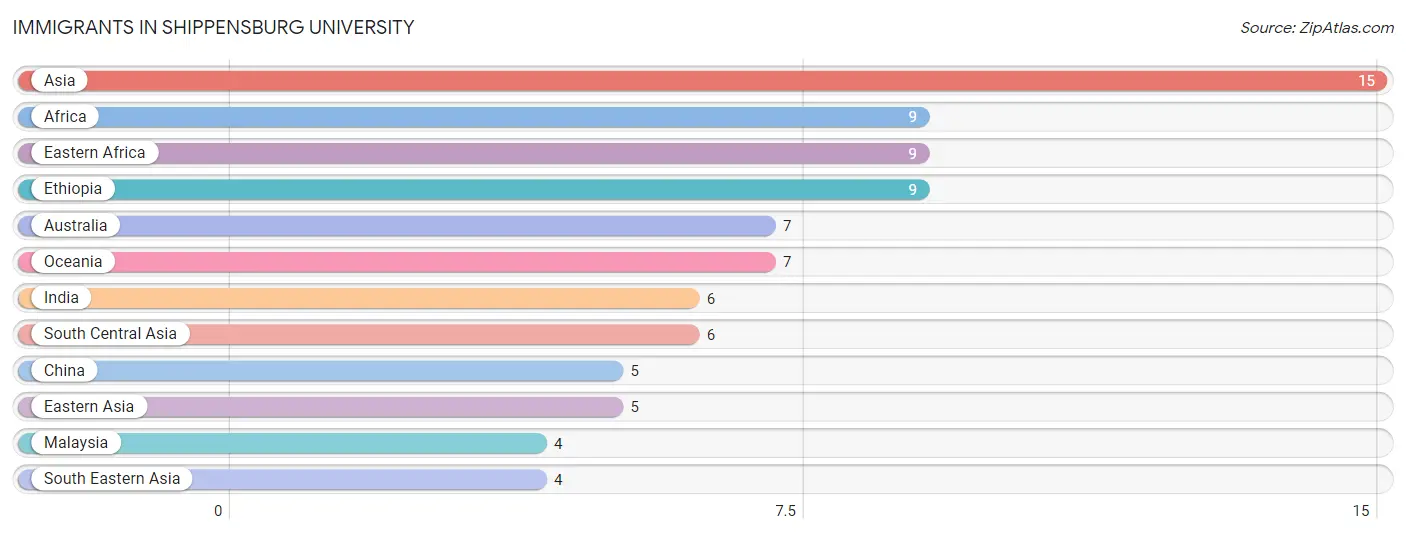
| Immigration Origin | # Population | % Population |
| Africa | 9 | 0.5% |
| Asia | 15 | 0.8% |
| Australia | 7 | 0.4% |
| China | 5 | 0.3% |
| Eastern Africa | 9 | 0.5% |
| Eastern Asia | 5 | 0.3% |
| Ethiopia | 9 | 0.5% |
| India | 6 | 0.3% |
| Malaysia | 4 | 0.2% |
| Oceania | 7 | 0.4% |
| South Central Asia | 6 | 0.3% |
| South Eastern Asia | 4 | 0.2% | View All 12 Rows |
Sex and Age in Shippensburg University
Sex and Age in Shippensburg University
The most populous age groups in Shippensburg University are 15 to 19 Years (656 | 62.4%) for men and 15 to 19 Years (547 | 62.7%) for women.
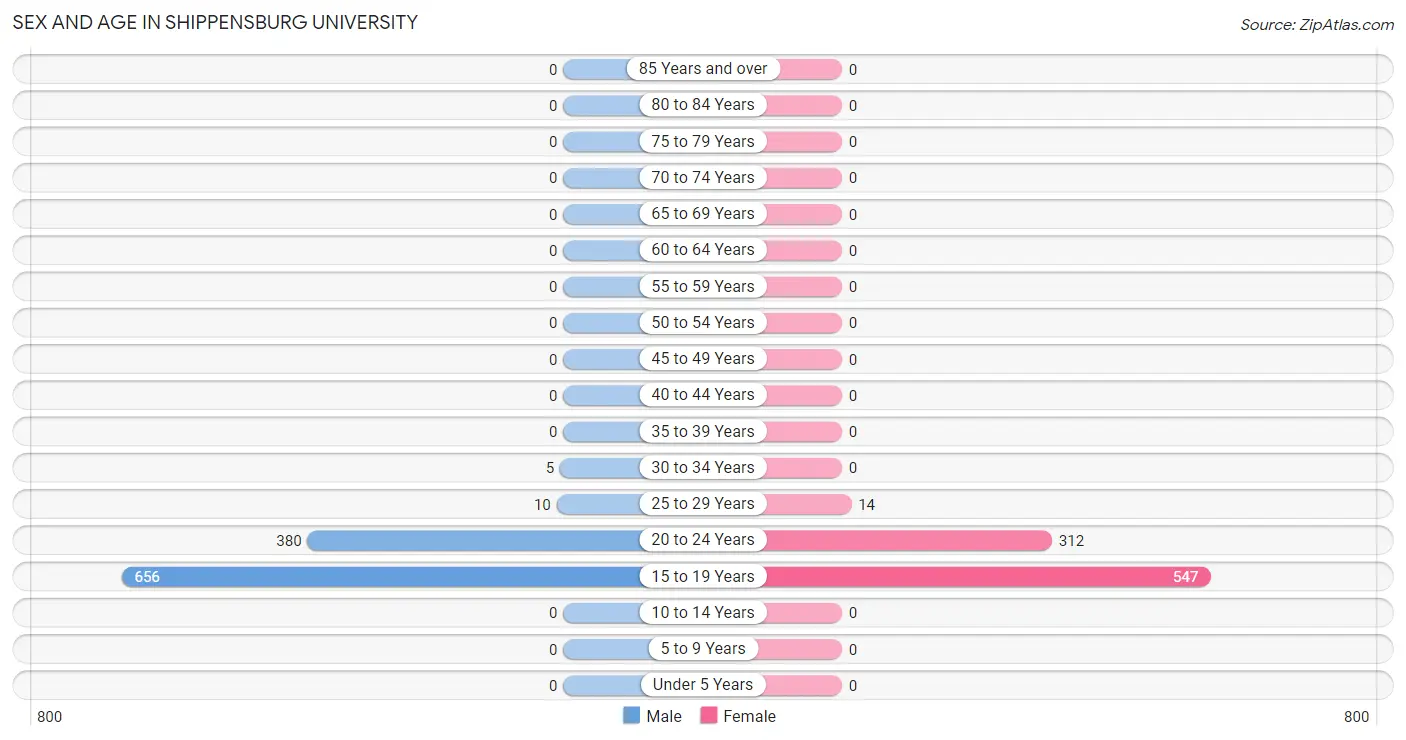
| Age Bracket | Male | Female |
| Under 5 Years | 0 (0.0%) | 0 (0.0%) |
| 5 to 9 Years | 0 (0.0%) | 0 (0.0%) |
| 10 to 14 Years | 0 (0.0%) | 0 (0.0%) |
| 15 to 19 Years | 656 (62.4%) | 547 (62.7%) |
| 20 to 24 Years | 380 (36.2%) | 312 (35.7%) |
| 25 to 29 Years | 10 (0.9%) | 14 (1.6%) |
| 30 to 34 Years | 5 (0.5%) | 0 (0.0%) |
| 35 to 39 Years | 0 (0.0%) | 0 (0.0%) |
| 40 to 44 Years | 0 (0.0%) | 0 (0.0%) |
| 45 to 49 Years | 0 (0.0%) | 0 (0.0%) |
| 50 to 54 Years | 0 (0.0%) | 0 (0.0%) |
| 55 to 59 Years | 0 (0.0%) | 0 (0.0%) |
| 60 to 64 Years | 0 (0.0%) | 0 (0.0%) |
| 65 to 69 Years | 0 (0.0%) | 0 (0.0%) |
| 70 to 74 Years | 0 (0.0%) | 0 (0.0%) |
| 75 to 79 Years | 0 (0.0%) | 0 (0.0%) |
| 80 to 84 Years | 0 (0.0%) | 0 (0.0%) |
| 85 Years and over | 0 (0.0%) | 0 (0.0%) |
| Total | 1,051 (100.0%) | 873 (100.0%) |
Families and Households in Shippensburg University
Median Family Size in Shippensburg University
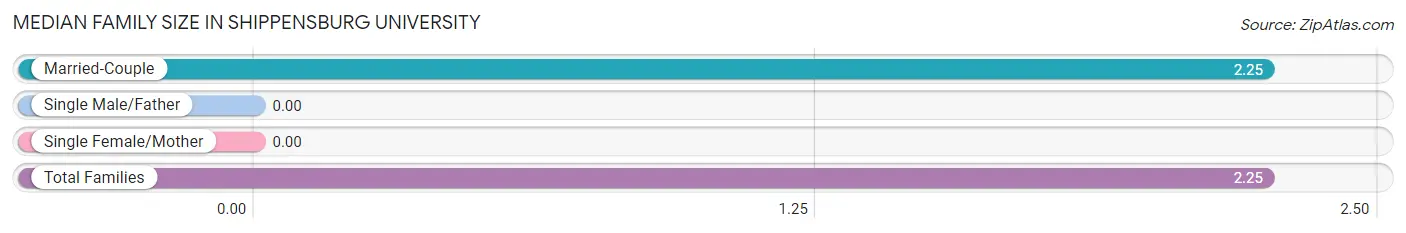
| Family Type | # Families | Family Size |
| Married-Couple | 4 (100.0%) | 2.25 |
| Single Male/Father | 0 (0.0%) | - |
| Single Female/Mother | 0 (0.0%) | - |
| Total Families | 4 (100.0%) | 2.25 |
Median Household Size in Shippensburg University
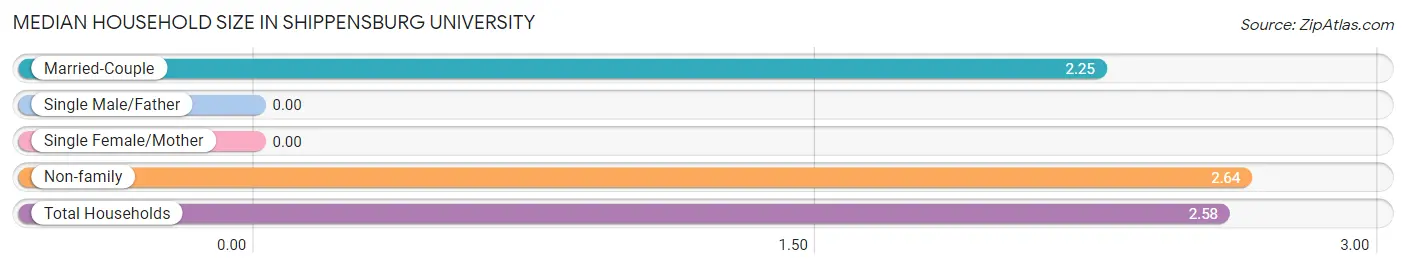
| Household Type | # Households | Household Size |
| Married-Couple | 4 (15.4%) | 2.25 |
| Single Male/Father | 0 (0.0%) | - |
| Single Female/Mother | 0 (0.0%) | - |
| Non-family | 22 (84.6%) | 2.64 |
| Total Households | 26 (100.0%) | 2.58 |
Household Size by Marriage Status in Shippensburg University
Out of a total of 26 households in Shippensburg University, 4 (15.4%) are family households, while 22 (84.6%) are nonfamily households. The most numerous type of family households are 2-person households, comprising 4, and the most common type of nonfamily households are 3-person households, comprising 11.
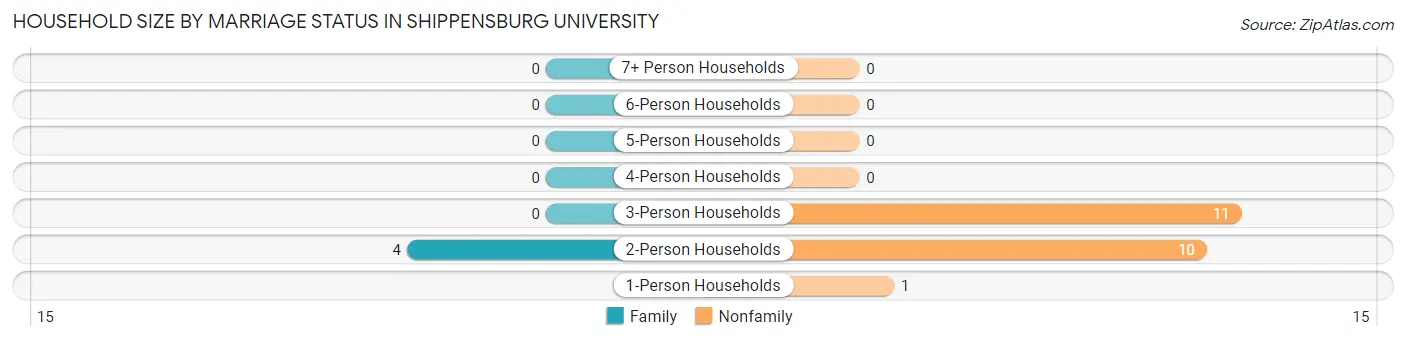
| Household Size | Family Households | Nonfamily Households |
| 1-Person Households | - | 1 (3.8%) |
| 2-Person Households | 4 (15.4%) | 10 (38.5%) |
| 3-Person Households | 0 (0.0%) | 11 (42.3%) |
| 4-Person Households | 0 (0.0%) | 0 (0.0%) |
| 5-Person Households | 0 (0.0%) | 0 (0.0%) |
| 6-Person Households | 0 (0.0%) | 0 (0.0%) |
| 7+ Person Households | 0 (0.0%) | 0 (0.0%) |
| Total | 4 (15.4%) | 22 (84.6%) |
Female Fertility in Shippensburg University
Fertility by Age in Shippensburg University
Average fertility rate in Shippensburg University is 7.0 births per 1,000 women. Women in the age bracket of 20 to 34 years have the highest fertility rate with 18.0 births per 1,000 women. Women in the age bracket of 20 to 34 years acount for 100.0% of all women with births.
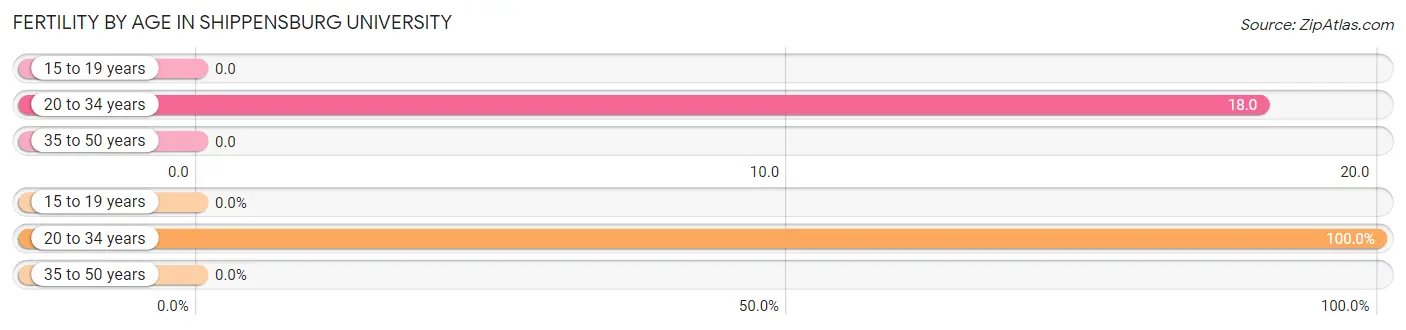
| Age Bracket | Women with Births | Births / 1,000 Women |
| 15 to 19 years | 0 (0.0%) | 0.0 |
| 20 to 34 years | 6 (100.0%) | 18.0 |
| 35 to 50 years | 0 (0.0%) | 0.0 |
| Total | 6 (100.0%) | 7.0 |
Fertility by Age by Marriage Status in Shippensburg University
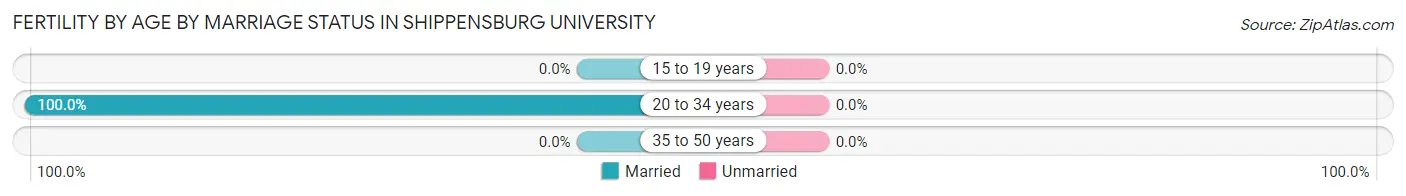
| Age Bracket | Married | Unmarried |
| 15 to 19 years | 0 (0.0%) | 0 (0.0%) |
| 20 to 34 years | 6 (100.0%) | 0 (0.0%) |
| 35 to 50 years | 0 (0.0%) | 0 (0.0%) |
| Total | 6 (100.0%) | 0 (0.0%) |
Fertility by Education in Shippensburg University
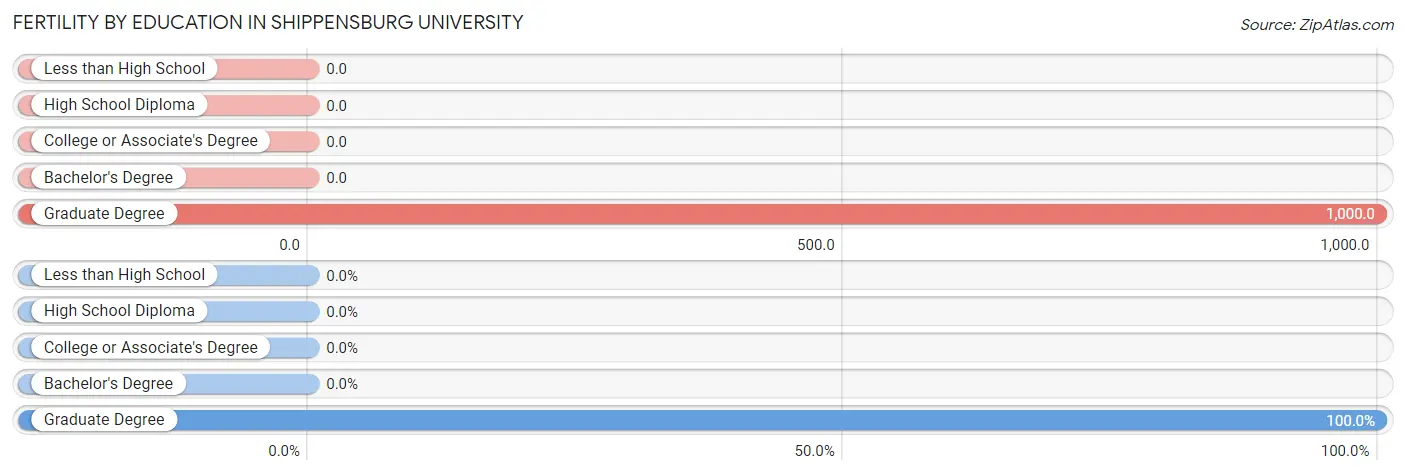
| Educational Attainment | Women with Births | Births / 1,000 Women |
| Less than High School | 0 (0.0%) | 0.0 |
| High School Diploma | 0 (0.0%) | 0.0 |
| College or Associate's Degree | 0 (0.0%) | 0.0 |
| Bachelor's Degree | 0 (0.0%) | 0.0 |
| Graduate Degree | 6 (100.0%) | 1,000.0 |
| Total | 6 (100.0%) | 7.0 |
Fertility by Education by Marriage Status in Shippensburg University
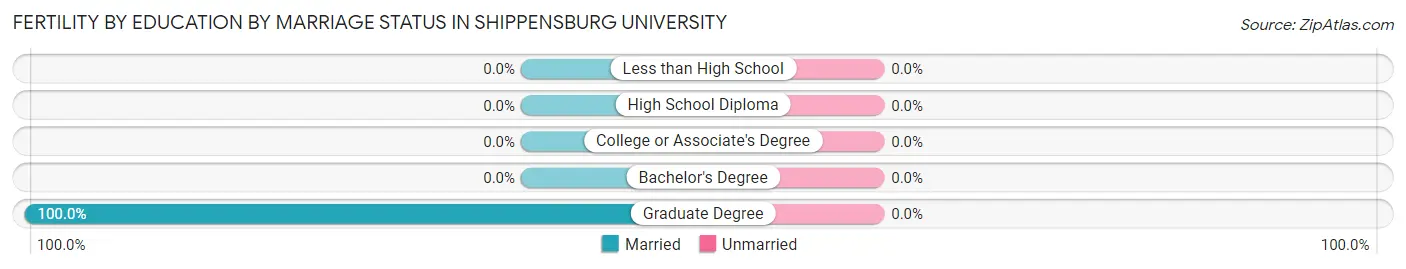
| Educational Attainment | Married | Unmarried |
| Less than High School | 0 (0.0%) | 0 (0.0%) |
| High School Diploma | 0 (0.0%) | 0 (0.0%) |
| College or Associate's Degree | 0 (0.0%) | 0 (0.0%) |
| Bachelor's Degree | 0 (0.0%) | 0 (0.0%) |
| Graduate Degree | 6 (100.0%) | 0 (0.0%) |
| Total | 6 (100.0%) | 0 (0.0%) |
Employment Characteristics in Shippensburg University
Employment by Class of Employer in Shippensburg University
Among the 653 employed individuals in Shippensburg University, private company employees (454 | 69.5%), state government employees (165 | 25.3%), and local government employees (20 | 3.1%) make up the most common classes of employment.
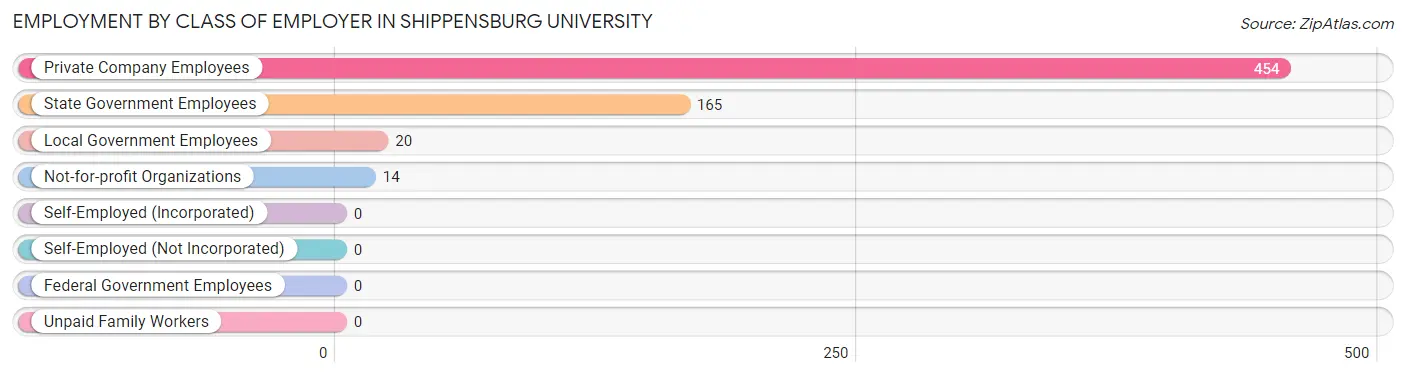
| Employer Class | # Employees | % Employees |
| Private Company Employees | 454 | 69.5% |
| Self-Employed (Incorporated) | 0 | 0.0% |
| Self-Employed (Not Incorporated) | 0 | 0.0% |
| Not-for-profit Organizations | 14 | 2.1% |
| Local Government Employees | 20 | 3.1% |
| State Government Employees | 165 | 25.3% |
| Federal Government Employees | 0 | 0.0% |
| Unpaid Family Workers | 0 | 0.0% |
| Total | 653 | 100.0% |
Employment Status by Age in Shippensburg University
According to the labor force statistics for Shippensburg University, out of the total population over 16 years of age (1,924), 65.6% or 1,262 individuals are in the labor force, with 16.5% or 208 of them unemployed. The age group with the highest labor force participation rate is 30 to 34 years, with 100.0% or 5 individuals in the labor force. Within the labor force, the 16 to 19 years age range has the highest percentage of unemployed individuals, with 22.7% or 166 of them being unemployed.
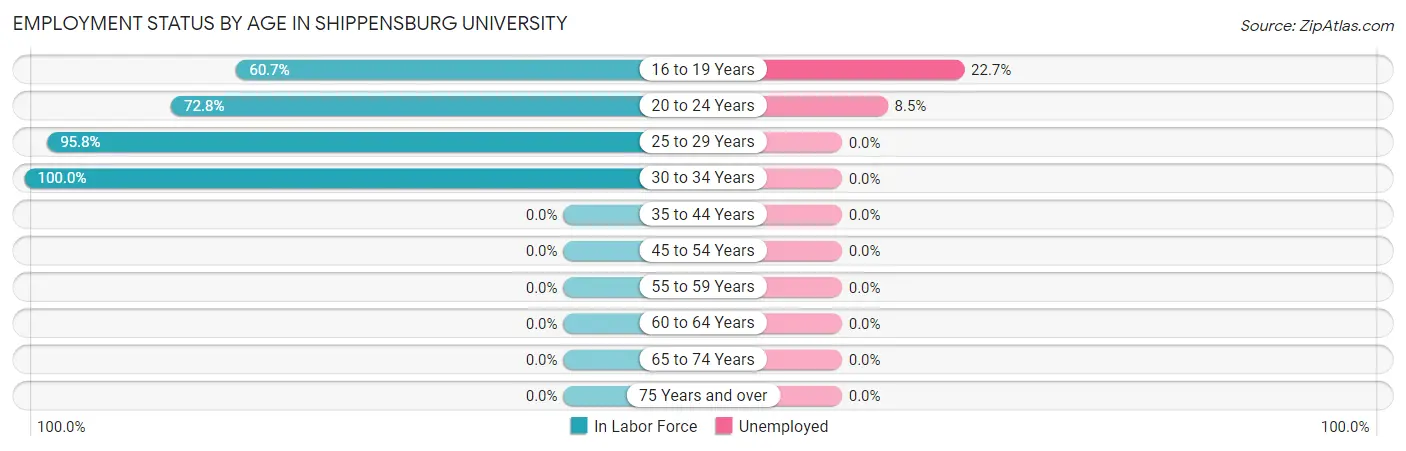
| Age Bracket | In Labor Force | Unemployed |
| 16 to 19 Years | 730 (60.7%) | 166 (22.7%) |
| 20 to 24 Years | 504 (72.8%) | 43 (8.5%) |
| 25 to 29 Years | 23 (95.8%) | 0 (0.0%) |
| 30 to 34 Years | 5 (100.0%) | 0 (0.0%) |
| 35 to 44 Years | 0 (0.0%) | 0 (0.0%) |
| 45 to 54 Years | 0 (0.0%) | 0 (0.0%) |
| 55 to 59 Years | 0 (0.0%) | 0 (0.0%) |
| 60 to 64 Years | 0 (0.0%) | 0 (0.0%) |
| 65 to 74 Years | 0 (0.0%) | 0 (0.0%) |
| 75 Years and over | 0 (0.0%) | 0 (0.0%) |
| Total | 1,262 (65.6%) | 208 (16.5%) |
Employment Status by Educational Attainment in Shippensburg University
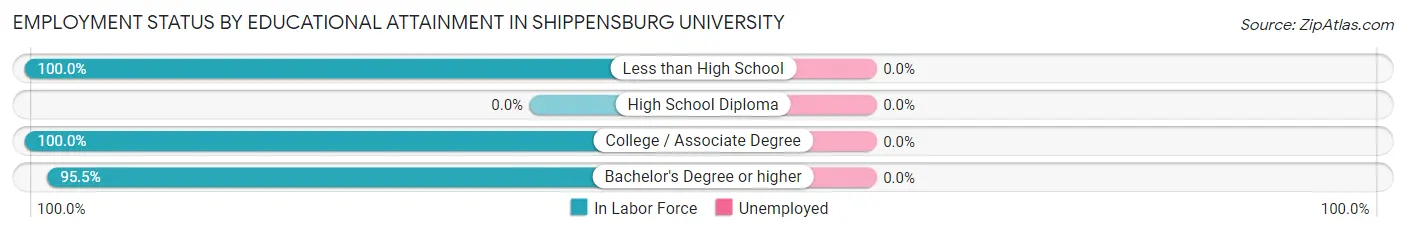
| Educational Attainment | In Labor Force | Unemployed |
| Less than High School | 4 (100.0%) | 0 (0.0%) |
| High School Diploma | 0 (0.0%) | 0 (0.0%) |
| College / Associate Degree | 3 (100.0%) | 0 (0.0%) |
| Bachelor's Degree or higher | 21 (95.5%) | 0 (0.0%) |
| Total | 28 (96.6%) | 0 (0.0%) |
Employment Occupations by Sex in Shippensburg University
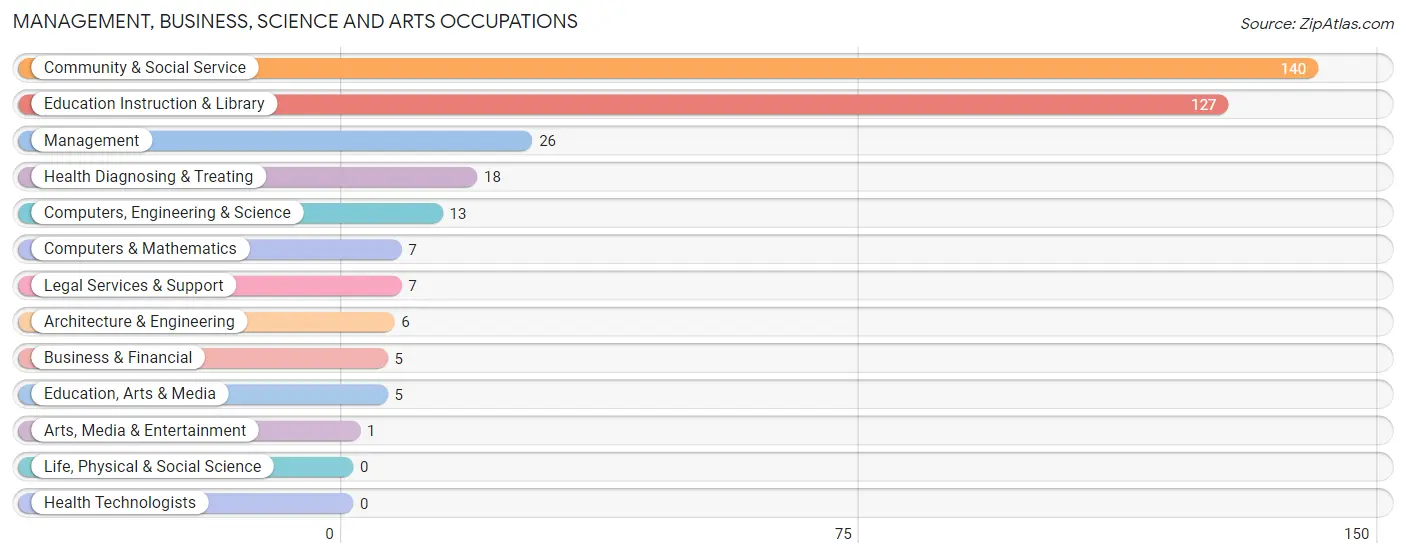
Management, Business, Science and Arts Occupations
The most common Management, Business, Science and Arts occupations in Shippensburg University are Community & Social Service (140 | 13.4%), Education Instruction & Library (127 | 12.1%), Management (26 | 2.5%), Health Diagnosing & Treating (18 | 1.7%), and Computers, Engineering & Science (13 | 1.2%).
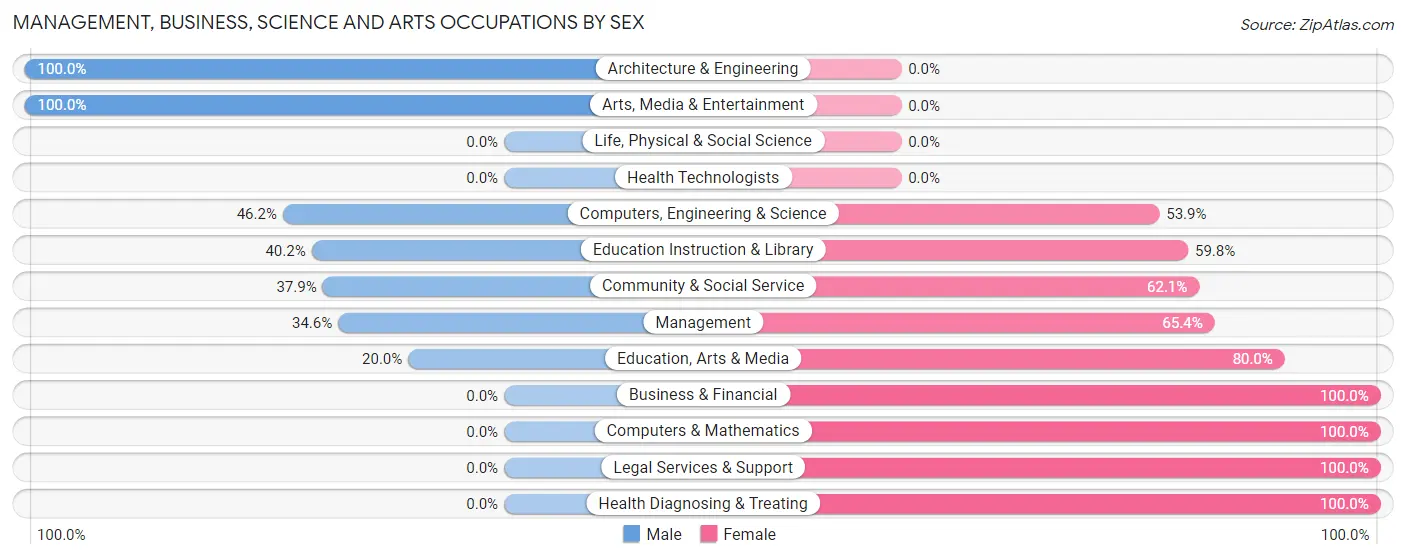
Management, Business, Science and Arts Occupations by Sex
Within the Management, Business, Science and Arts occupations in Shippensburg University, the most male-oriented occupations are Architecture & Engineering (100.0%), Arts, Media & Entertainment (100.0%), and Computers, Engineering & Science (46.2%), while the most female-oriented occupations are Business & Financial (100.0%), Computers & Mathematics (100.0%), and Legal Services & Support (100.0%).
| Occupation | Male | Female |
| Management | 9 (34.6%) | 17 (65.4%) |
| Business & Financial | 0 (0.0%) | 5 (100.0%) |
| Computers, Engineering & Science | 6 (46.2%) | 7 (53.8%) |
| Computers & Mathematics | 0 (0.0%) | 7 (100.0%) |
| Architecture & Engineering | 6 (100.0%) | 0 (0.0%) |
| Life, Physical & Social Science | 0 (0.0%) | 0 (0.0%) |
| Community & Social Service | 53 (37.9%) | 87 (62.1%) |
| Education, Arts & Media | 1 (20.0%) | 4 (80.0%) |
| Legal Services & Support | 0 (0.0%) | 7 (100.0%) |
| Education Instruction & Library | 51 (40.2%) | 76 (59.8%) |
| Arts, Media & Entertainment | 1 (100.0%) | 0 (0.0%) |
| Health Diagnosing & Treating | 0 (0.0%) | 18 (100.0%) |
| Health Technologists | 0 (0.0%) | 0 (0.0%) |
| Total (Category) | 68 (33.7%) | 134 (66.3%) |
| Total (Overall) | 466 (44.4%) | 583 (55.6%) |
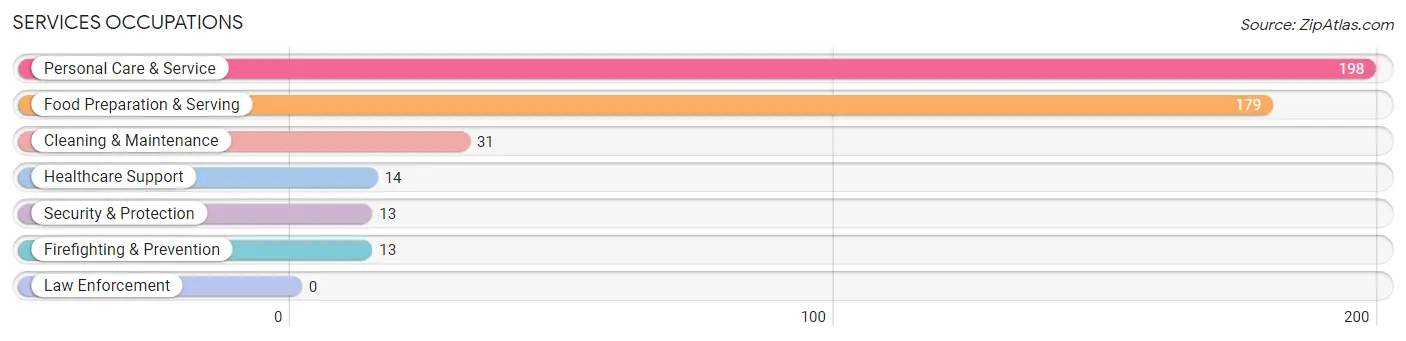
Services Occupations
The most common Services occupations in Shippensburg University are Personal Care & Service (198 | 18.9%), Food Preparation & Serving (179 | 17.1%), Cleaning & Maintenance (31 | 3.0%), Healthcare Support (14 | 1.3%), and Security & Protection (13 | 1.2%).
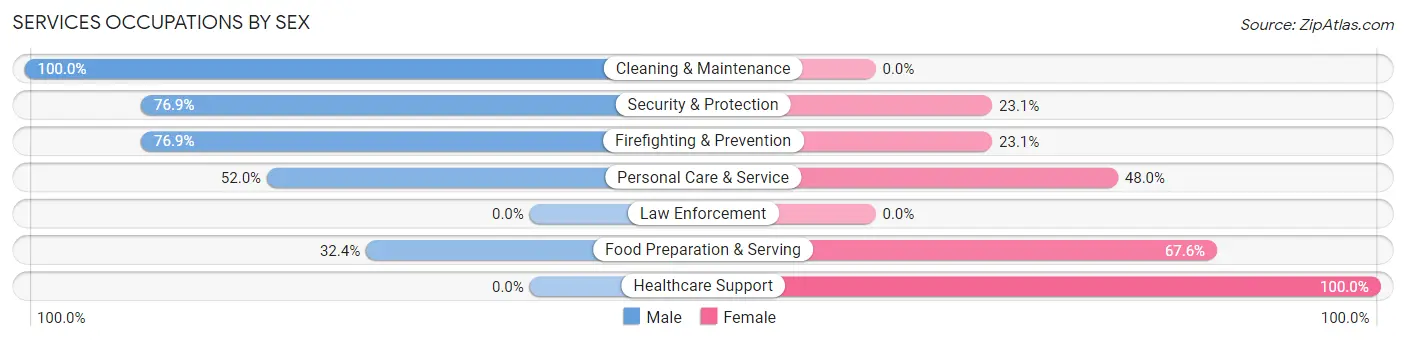
Services Occupations by Sex
Within the Services occupations in Shippensburg University, the most male-oriented occupations are Cleaning & Maintenance (100.0%), Security & Protection (76.9%), and Firefighting & Prevention (76.9%), while the most female-oriented occupations are Healthcare Support (100.0%), Food Preparation & Serving (67.6%), and Personal Care & Service (48.0%).
| Occupation | Male | Female |
| Healthcare Support | 0 (0.0%) | 14 (100.0%) |
| Security & Protection | 10 (76.9%) | 3 (23.1%) |
| Firefighting & Prevention | 10 (76.9%) | 3 (23.1%) |
| Law Enforcement | 0 (0.0%) | 0 (0.0%) |
| Food Preparation & Serving | 58 (32.4%) | 121 (67.6%) |
| Cleaning & Maintenance | 31 (100.0%) | 0 (0.0%) |
| Personal Care & Service | 103 (52.0%) | 95 (48.0%) |
| Total (Category) | 202 (46.4%) | 233 (53.6%) |
| Total (Overall) | 466 (44.4%) | 583 (55.6%) |
Sales and Office Occupations
The most common Sales and Office occupations in Shippensburg University are Office & Administration (166 | 15.8%), and Sales & Related (140 | 13.4%).
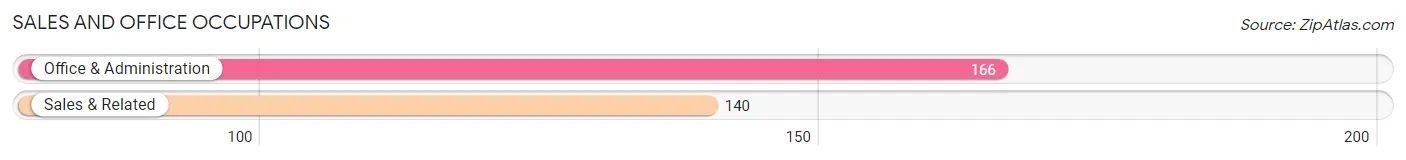
Sales and Office Occupations by Sex

| Occupation | Male | Female |
| Sales & Related | 95 (67.9%) | 45 (32.1%) |
| Office & Administration | 28 (16.9%) | 138 (83.1%) |
| Total (Category) | 123 (40.2%) | 183 (59.8%) |
| Total (Overall) | 466 (44.4%) | 583 (55.6%) |
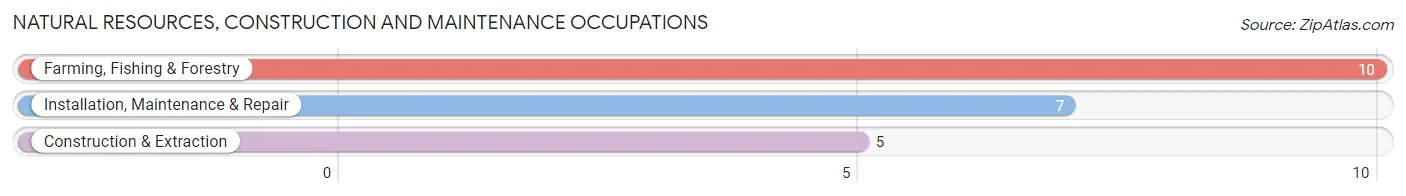
Natural Resources, Construction and Maintenance Occupations
The most common Natural Resources, Construction and Maintenance occupations in Shippensburg University are Farming, Fishing & Forestry (10 | 0.9%), Installation, Maintenance & Repair (7 | 0.7%), and Construction & Extraction (5 | 0.5%).
Natural Resources, Construction and Maintenance Occupations by Sex
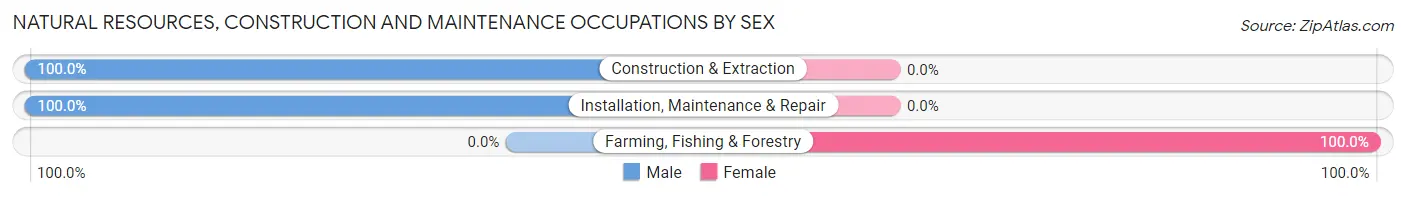
| Occupation | Male | Female |
| Farming, Fishing & Forestry | 0 (0.0%) | 10 (100.0%) |
| Construction & Extraction | 5 (100.0%) | 0 (0.0%) |
| Installation, Maintenance & Repair | 7 (100.0%) | 0 (0.0%) |
| Total (Category) | 12 (54.5%) | 10 (45.5%) |
| Total (Overall) | 466 (44.4%) | 583 (55.6%) |
Production, Transportation and Moving Occupations
The most common Production, Transportation and Moving occupations in Shippensburg University are Material Moving (74 | 7.0%), and Transportation (10 | 0.9%).
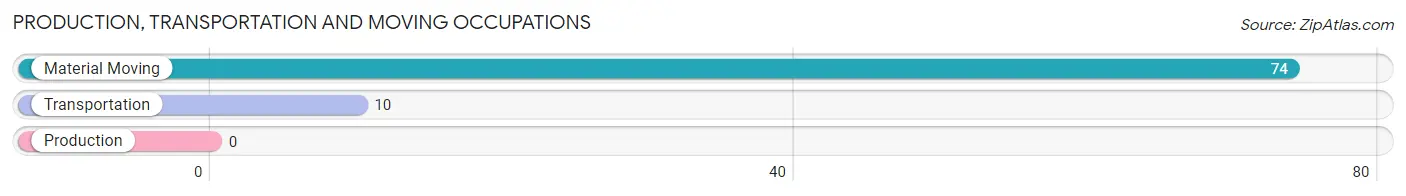
Production, Transportation and Moving Occupations by Sex
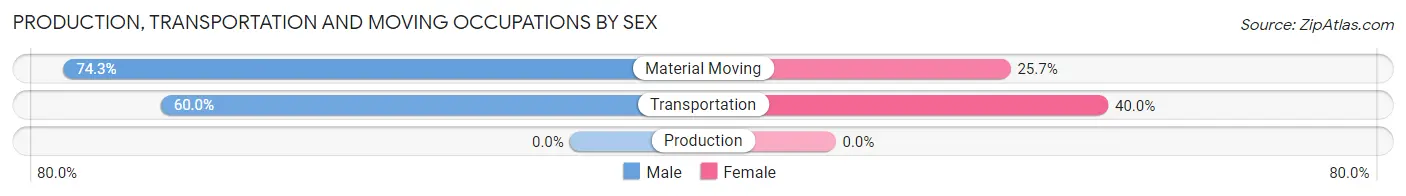
| Occupation | Male | Female |
| Production | 0 (0.0%) | 0 (0.0%) |
| Transportation | 6 (60.0%) | 4 (40.0%) |
| Material Moving | 55 (74.3%) | 19 (25.7%) |
| Total (Category) | 61 (72.6%) | 23 (27.4%) |
| Total (Overall) | 466 (44.4%) | 583 (55.6%) |
Employment Industries by Sex in Shippensburg University
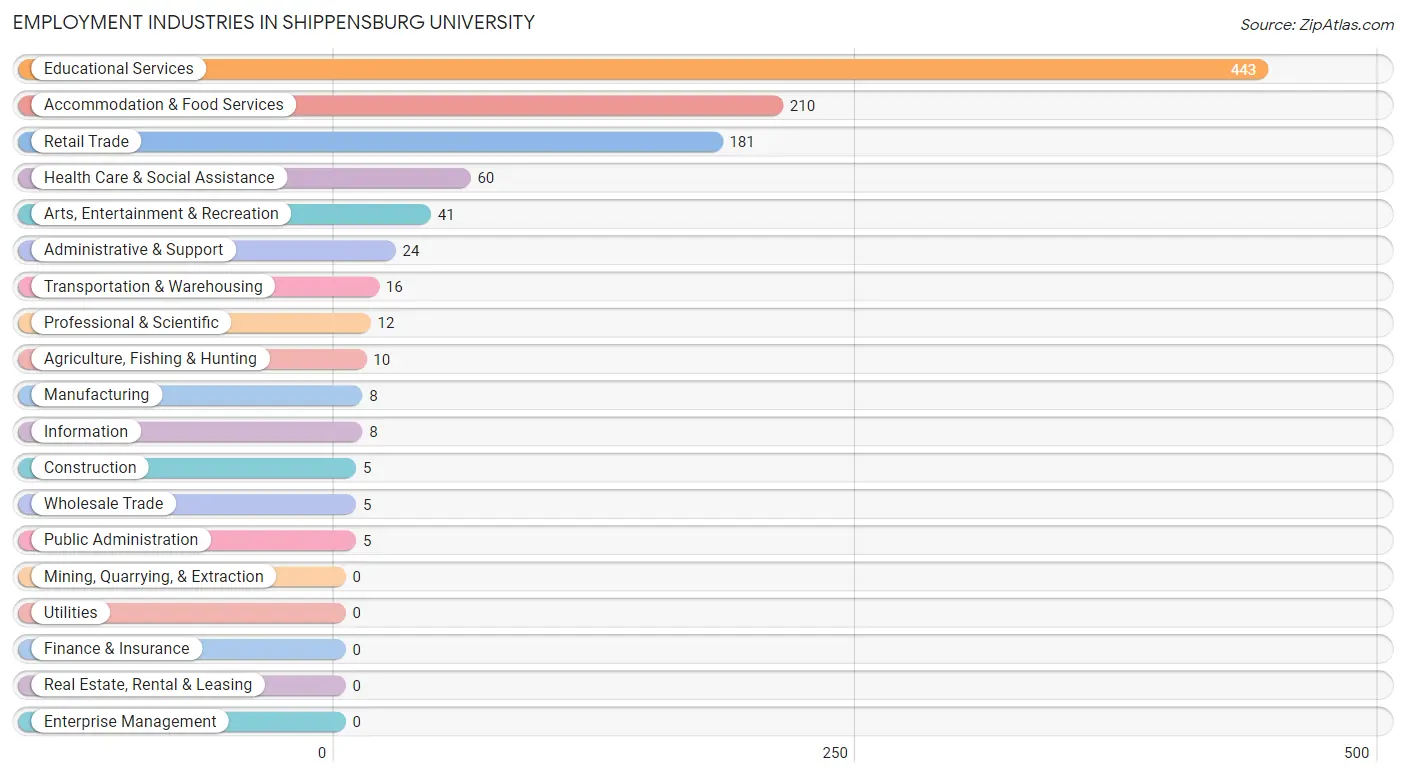
Employment Industries in Shippensburg University
The major employment industries in Shippensburg University include Educational Services (443 | 42.2%), Accommodation & Food Services (210 | 20.0%), Retail Trade (181 | 17.2%), Health Care & Social Assistance (60 | 5.7%), and Arts, Entertainment & Recreation (41 | 3.9%).
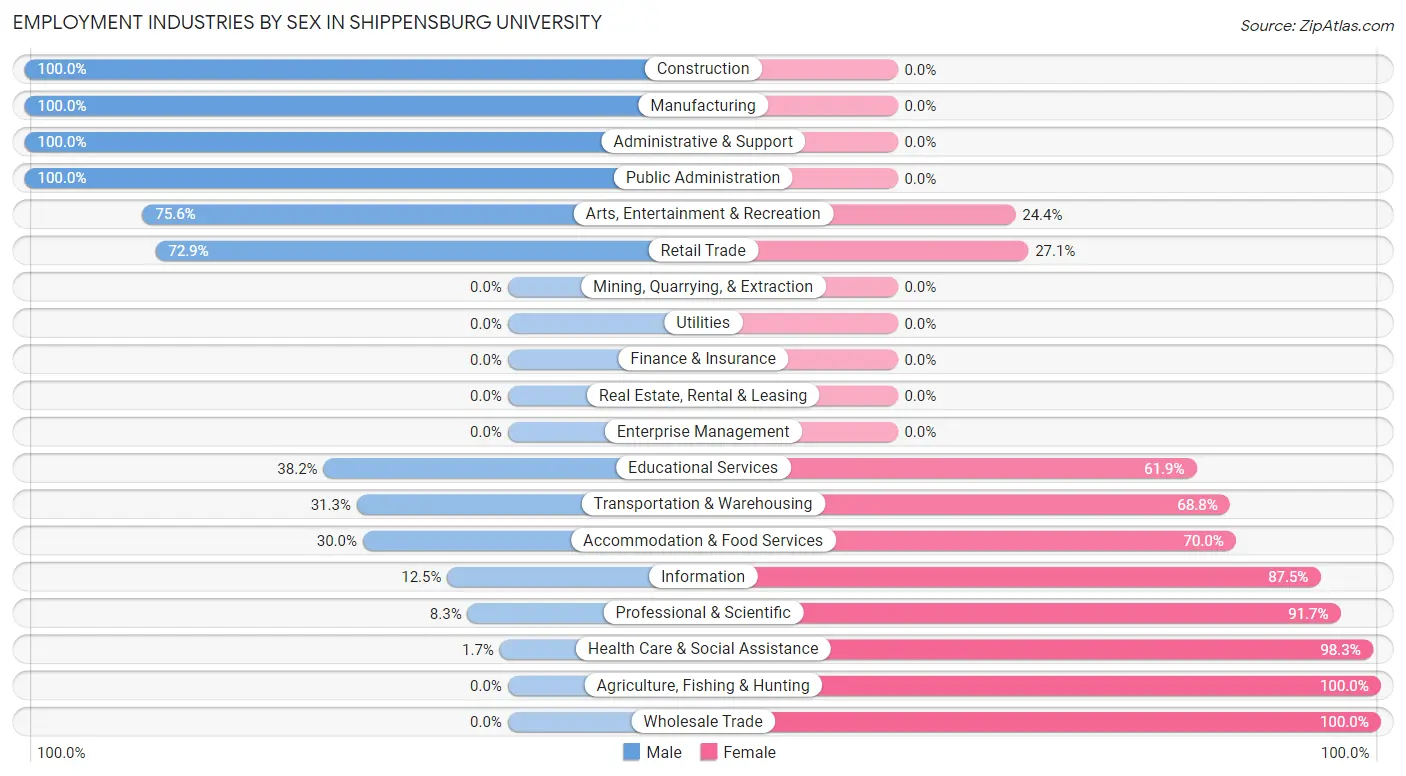
Employment Industries by Sex in Shippensburg University
The Shippensburg University industries that see more men than women are Construction (100.0%), Manufacturing (100.0%), and Administrative & Support (100.0%), whereas the industries that tend to have a higher number of women are Agriculture, Fishing & Hunting (100.0%), Wholesale Trade (100.0%), and Health Care & Social Assistance (98.3%).
| Industry | Male | Female |
| Agriculture, Fishing & Hunting | 0 (0.0%) | 10 (100.0%) |
| Mining, Quarrying, & Extraction | 0 (0.0%) | 0 (0.0%) |
| Construction | 5 (100.0%) | 0 (0.0%) |
| Manufacturing | 8 (100.0%) | 0 (0.0%) |
| Wholesale Trade | 0 (0.0%) | 5 (100.0%) |
| Retail Trade | 132 (72.9%) | 49 (27.1%) |
| Transportation & Warehousing | 5 (31.2%) | 11 (68.8%) |
| Utilities | 0 (0.0%) | 0 (0.0%) |
| Information | 1 (12.5%) | 7 (87.5%) |
| Finance & Insurance | 0 (0.0%) | 0 (0.0%) |
| Real Estate, Rental & Leasing | 0 (0.0%) | 0 (0.0%) |
| Professional & Scientific | 1 (8.3%) | 11 (91.7%) |
| Enterprise Management | 0 (0.0%) | 0 (0.0%) |
| Administrative & Support | 24 (100.0%) | 0 (0.0%) |
| Educational Services | 169 (38.2%) | 274 (61.9%) |
| Health Care & Social Assistance | 1 (1.7%) | 59 (98.3%) |
| Arts, Entertainment & Recreation | 31 (75.6%) | 10 (24.4%) |
| Accommodation & Food Services | 63 (30.0%) | 147 (70.0%) |
| Public Administration | 5 (100.0%) | 0 (0.0%) |
| Total | 466 (44.4%) | 583 (55.6%) |
Education in Shippensburg University
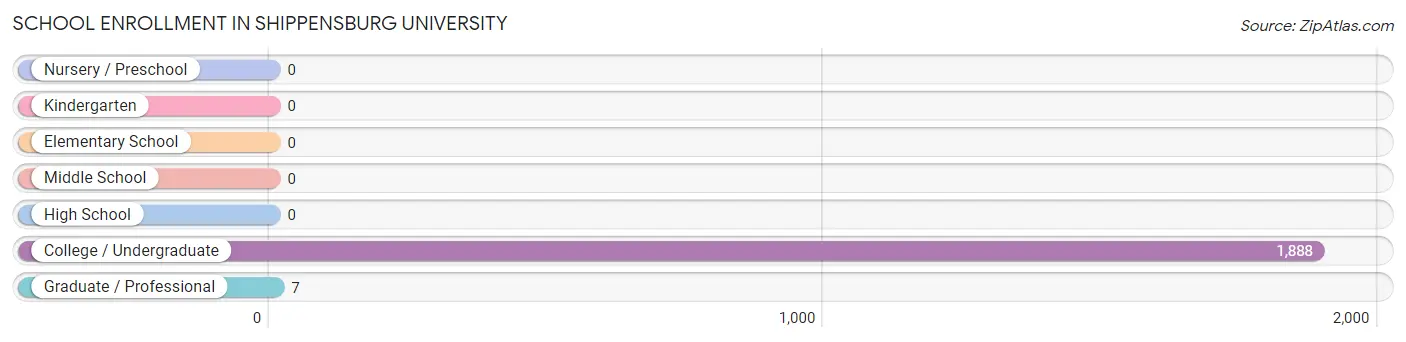
School Enrollment in Shippensburg University
The most common levels of schooling among the 1,895 students in Shippensburg University are college / undergraduate (1,888 | 99.6%), and graduate / professional (7 | 0.4%).
| School Level | # Students | % Students |
| Nursery / Preschool | 0 | 0.0% |
| Kindergarten | 0 | 0.0% |
| Elementary School | 0 | 0.0% |
| Middle School | 0 | 0.0% |
| High School | 0 | 0.0% |
| College / Undergraduate | 1,888 | 99.6% |
| Graduate / Professional | 7 | 0.4% |
| Total | 1,895 | 100.0% |
School Enrollment by Age by Funding Source in Shippensburg University
Out of a total of 1,895 students who are enrolled in schools in Shippensburg University, 576 (30.4%) attend a private institution, while the remaining 1,319 (69.6%) are enrolled in public schools. The age group of 20 to 24 year olds has the highest likelihood of being enrolled in private schools, with 247 (36.0% in the age bracket) enrolled. Conversely, the age group of 25 to 34 year olds has the lowest likelihood of being enrolled in a private school, with 6 (100.0% in the age bracket) attending a public institution.
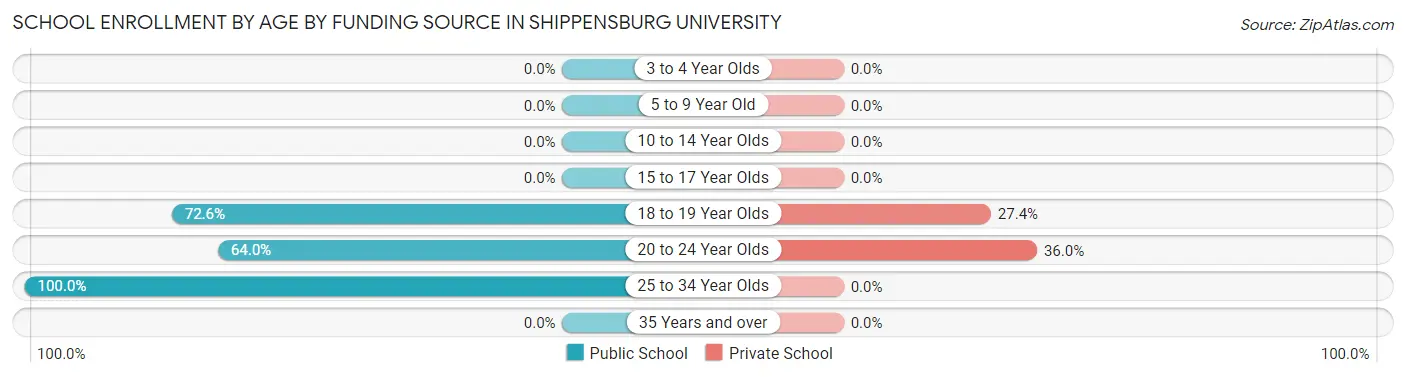
| Age Bracket | Public School | Private School |
| 3 to 4 Year Olds | 0 (0.0%) | 0 (0.0%) |
| 5 to 9 Year Old | 0 (0.0%) | 0 (0.0%) |
| 10 to 14 Year Olds | 0 (0.0%) | 0 (0.0%) |
| 15 to 17 Year Olds | 0 (0.0%) | 0 (0.0%) |
| 18 to 19 Year Olds | 873 (72.6%) | 330 (27.4%) |
| 20 to 24 Year Olds | 439 (64.0%) | 247 (36.0%) |
| 25 to 34 Year Olds | 6 (100.0%) | 0 (0.0%) |
| 35 Years and over | 0 (0.0%) | 0 (0.0%) |
| Total | 1,319 (69.6%) | 576 (30.4%) |
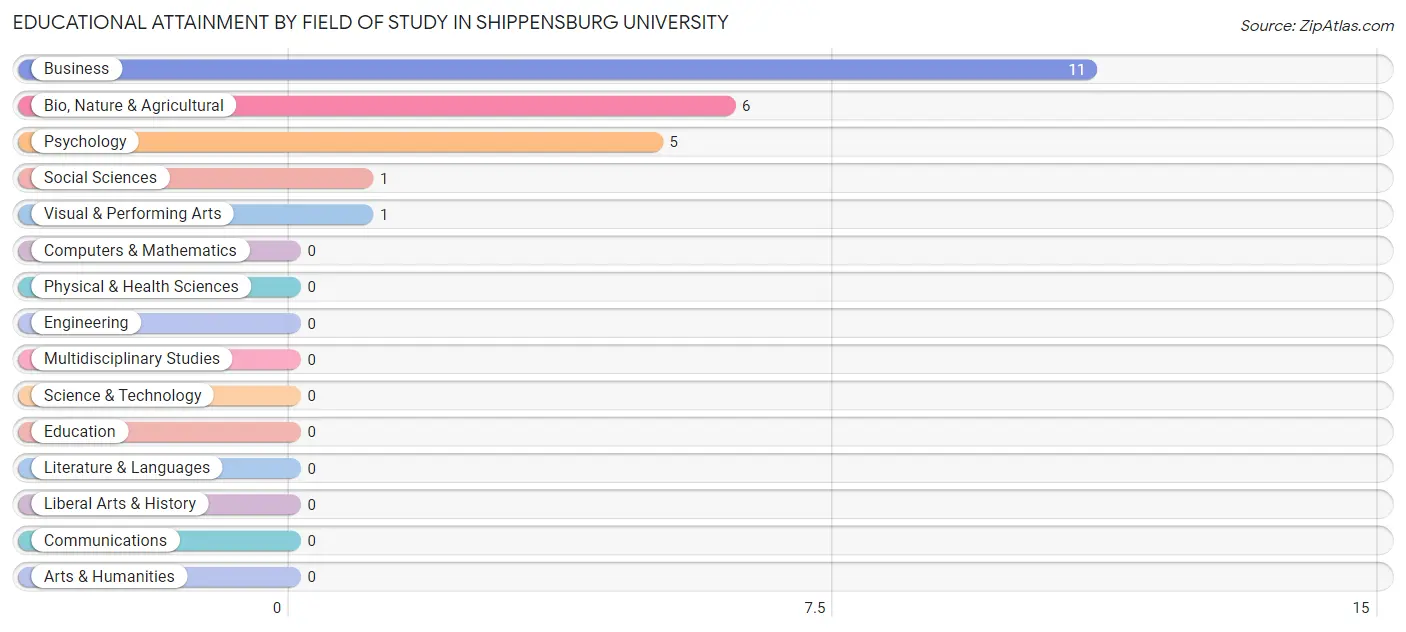
Educational Attainment by Field of Study in Shippensburg University
Business (11 | 45.8%), bio, nature & agricultural (6 | 25.0%), psychology (5 | 20.8%), social sciences (1 | 4.2%), and visual & performing arts (1 | 4.2%) are the most common fields of study among 24 individuals in Shippensburg University who have obtained a bachelor's degree or higher.
| Field of Study | # Graduates | % Graduates |
| Computers & Mathematics | 0 | 0.0% |
| Bio, Nature & Agricultural | 6 | 25.0% |
| Physical & Health Sciences | 0 | 0.0% |
| Psychology | 5 | 20.8% |
| Social Sciences | 1 | 4.2% |
| Engineering | 0 | 0.0% |
| Multidisciplinary Studies | 0 | 0.0% |
| Science & Technology | 0 | 0.0% |
| Business | 11 | 45.8% |
| Education | 0 | 0.0% |
| Literature & Languages | 0 | 0.0% |
| Liberal Arts & History | 0 | 0.0% |
| Visual & Performing Arts | 1 | 4.2% |
| Communications | 0 | 0.0% |
| Arts & Humanities | 0 | 0.0% |
| Total | 24 | 100.0% |
Transportation & Commute in Shippensburg University
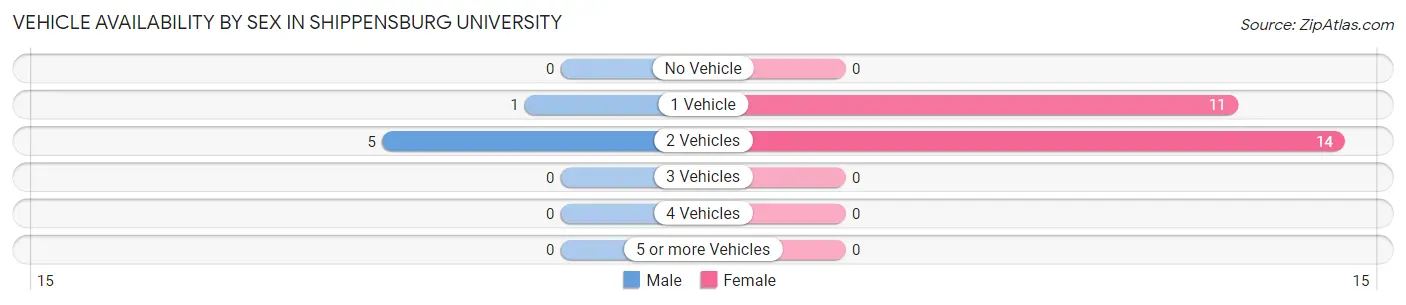
Vehicle Availability by Sex in Shippensburg University
The most prevalent vehicle ownership categories in Shippensburg University are males with 2 vehicles (5, accounting for 83.3%) and females with 2 vehicles (14, making up 20.0%).
| Vehicles Available | Male | Female |
| No Vehicle | 0 (0.0%) | 0 (0.0%) |
| 1 Vehicle | 1 (16.7%) | 11 (44.0%) |
| 2 Vehicles | 5 (83.3%) | 14 (56.0%) |
| 3 Vehicles | 0 (0.0%) | 0 (0.0%) |
| 4 Vehicles | 0 (0.0%) | 0 (0.0%) |
| 5 or more Vehicles | 0 (0.0%) | 0 (0.0%) |
| Total | 6 (100.0%) | 25 (100.0%) |
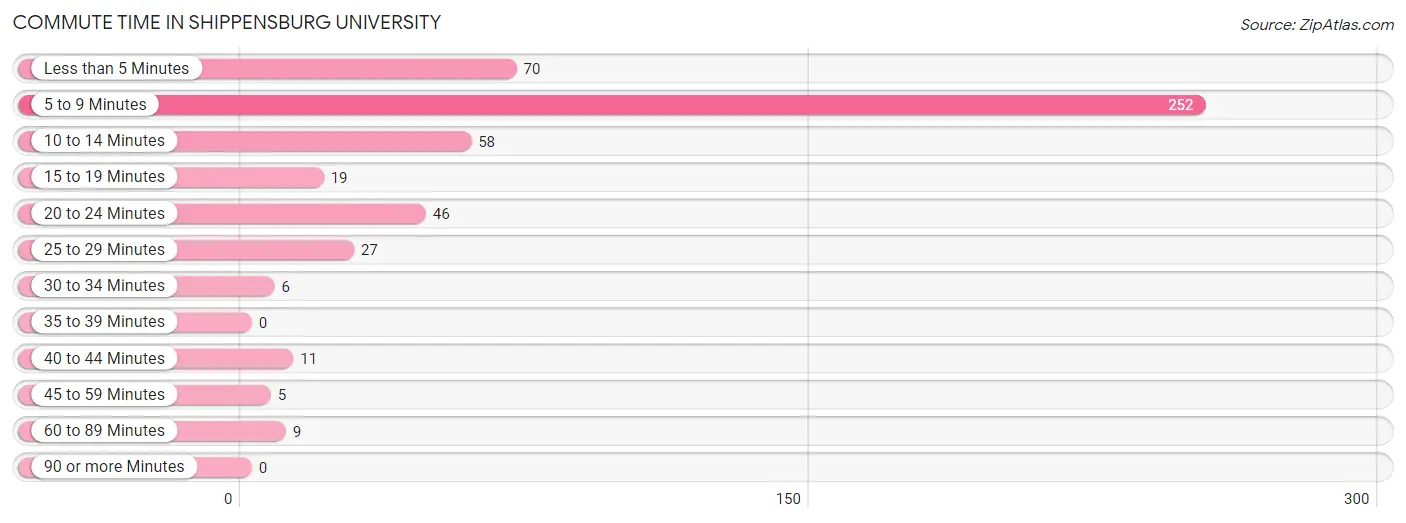
Commute Time in Shippensburg University
The most frequently occuring commute durations in Shippensburg University are 5 to 9 minutes (252 commuters, 50.1%), less than 5 minutes (70 commuters, 13.9%), and 10 to 14 minutes (58 commuters, 11.5%).
| Commute Time | # Commuters | % Commuters |
| Less than 5 Minutes | 70 | 13.9% |
| 5 to 9 Minutes | 252 | 50.1% |
| 10 to 14 Minutes | 58 | 11.5% |
| 15 to 19 Minutes | 19 | 3.8% |
| 20 to 24 Minutes | 46 | 9.1% |
| 25 to 29 Minutes | 27 | 5.4% |
| 30 to 34 Minutes | 6 | 1.2% |
| 35 to 39 Minutes | 0 | 0.0% |
| 40 to 44 Minutes | 11 | 2.2% |
| 45 to 59 Minutes | 5 | 1.0% |
| 60 to 89 Minutes | 9 | 1.8% |
| 90 or more Minutes | 0 | 0.0% |
Commute Time by Sex in Shippensburg University
The most common commute times in Shippensburg University are 5 to 9 minutes (71 commuters, 42.8%) for males and 5 to 9 minutes (181 commuters, 53.7%) for females.
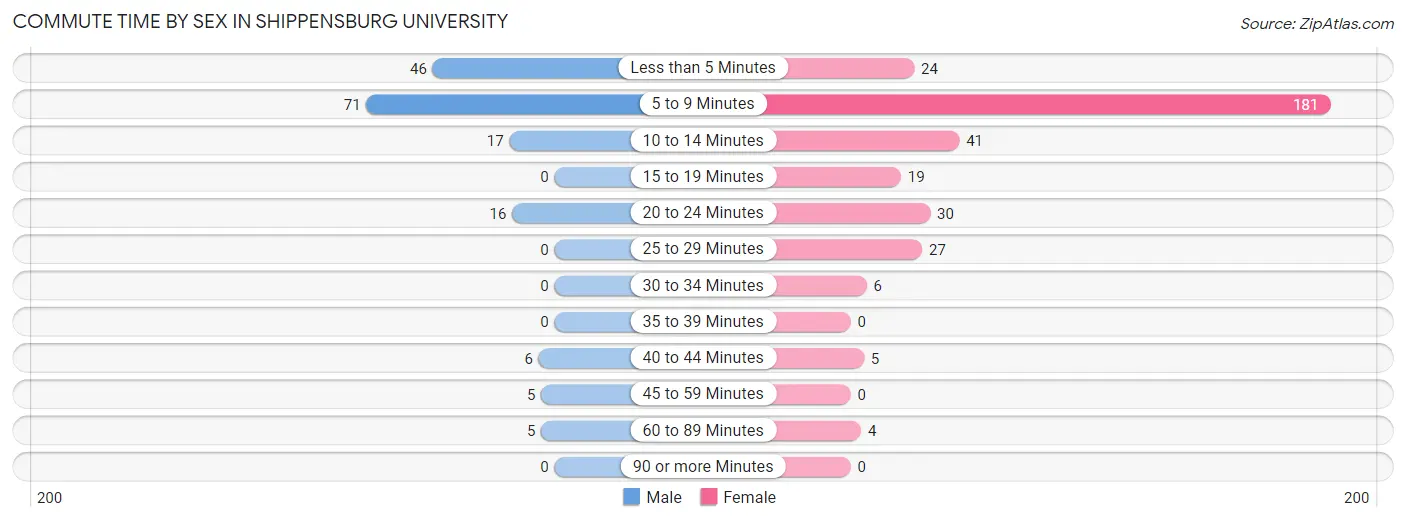
| Commute Time | Male | Female |
| Less than 5 Minutes | 46 (27.7%) | 24 (7.1%) |
| 5 to 9 Minutes | 71 (42.8%) | 181 (53.7%) |
| 10 to 14 Minutes | 17 (10.2%) | 41 (12.2%) |
| 15 to 19 Minutes | 0 (0.0%) | 19 (5.6%) |
| 20 to 24 Minutes | 16 (9.6%) | 30 (8.9%) |
| 25 to 29 Minutes | 0 (0.0%) | 27 (8.0%) |
| 30 to 34 Minutes | 0 (0.0%) | 6 (1.8%) |
| 35 to 39 Minutes | 0 (0.0%) | 0 (0.0%) |
| 40 to 44 Minutes | 6 (3.6%) | 5 (1.5%) |
| 45 to 59 Minutes | 5 (3.0%) | 0 (0.0%) |
| 60 to 89 Minutes | 5 (3.0%) | 4 (1.2%) |
| 90 or more Minutes | 0 (0.0%) | 0 (0.0%) |
Time of Departure to Work by Sex in Shippensburg University
The most frequent times of departure to work in Shippensburg University are 4:00 PM to 11:59 PM (79, 47.6%) for males and 12:00 PM to 3:59 PM (143, 42.4%) for females.
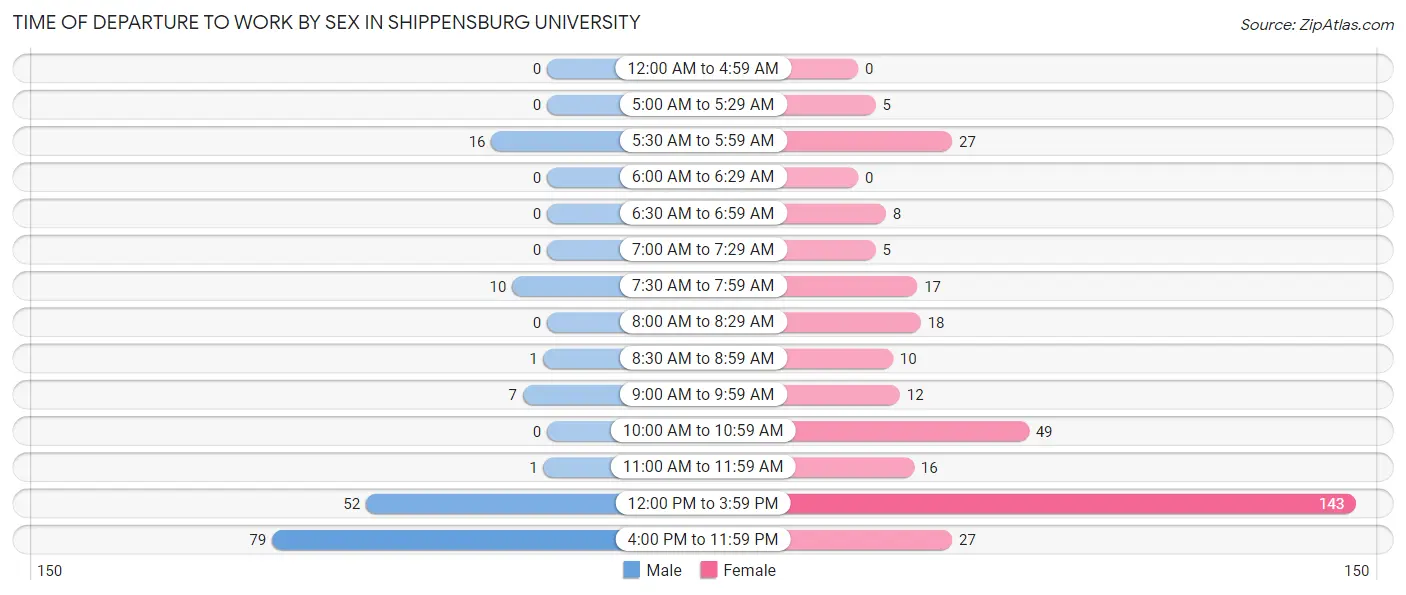
| Time of Departure | Male | Female |
| 12:00 AM to 4:59 AM | 0 (0.0%) | 0 (0.0%) |
| 5:00 AM to 5:29 AM | 0 (0.0%) | 5 (1.5%) |
| 5:30 AM to 5:59 AM | 16 (9.6%) | 27 (8.0%) |
| 6:00 AM to 6:29 AM | 0 (0.0%) | 0 (0.0%) |
| 6:30 AM to 6:59 AM | 0 (0.0%) | 8 (2.4%) |
| 7:00 AM to 7:29 AM | 0 (0.0%) | 5 (1.5%) |
| 7:30 AM to 7:59 AM | 10 (6.0%) | 17 (5.0%) |
| 8:00 AM to 8:29 AM | 0 (0.0%) | 18 (5.3%) |
| 8:30 AM to 8:59 AM | 1 (0.6%) | 10 (3.0%) |
| 9:00 AM to 9:59 AM | 7 (4.2%) | 12 (3.6%) |
| 10:00 AM to 10:59 AM | 0 (0.0%) | 49 (14.5%) |
| 11:00 AM to 11:59 AM | 1 (0.6%) | 16 (4.8%) |
| 12:00 PM to 3:59 PM | 52 (31.3%) | 143 (42.4%) |
| 4:00 PM to 11:59 PM | 79 (47.6%) | 27 (8.0%) |
| Total | 166 (100.0%) | 337 (100.0%) |
Housing Occupancy in Shippensburg University
Occupancy by Ownership in Shippensburg University
Of the total 26 dwellings in Shippensburg University, owner-occupied units account for 0 (0.0%), while renter-occupied units make up 26 (100.0%).
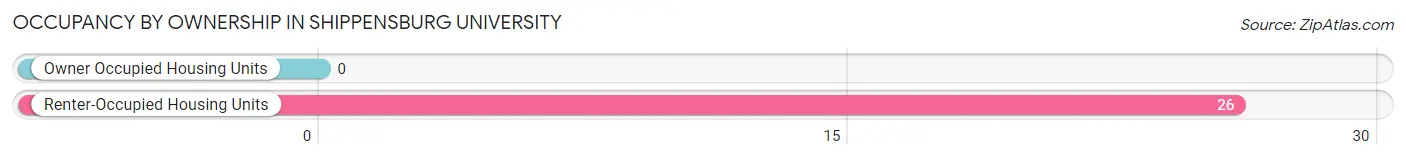
| Occupancy | # Housing Units | % Housing Units |
| Owner Occupied Housing Units | 0 | 0.0% |
| Renter-Occupied Housing Units | 26 | 100.0% |
| Total Occupied Housing Units | 26 | 100.0% |
Occupancy by Household Size in Shippensburg University
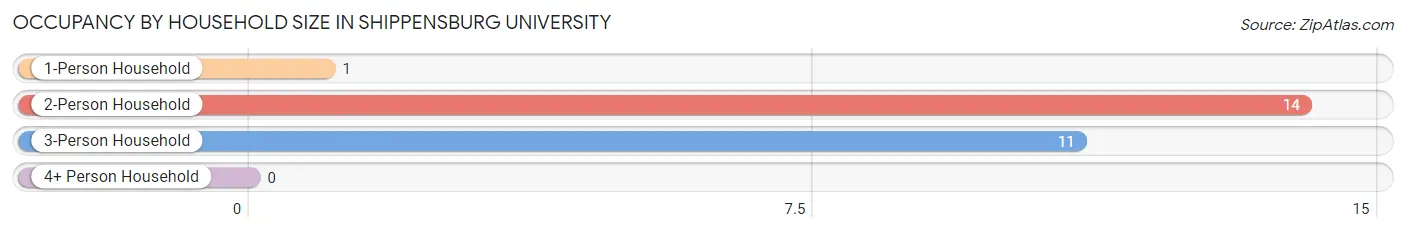
| Household Size | # Housing Units | % Housing Units |
| 1-Person Household | 1 | 3.8% |
| 2-Person Household | 14 | 53.8% |
| 3-Person Household | 11 | 42.3% |
| 4+ Person Household | 0 | 0.0% |
| Total Housing Units | 26 | 100.0% |
Occupancy by Ownership by Household Size in Shippensburg University
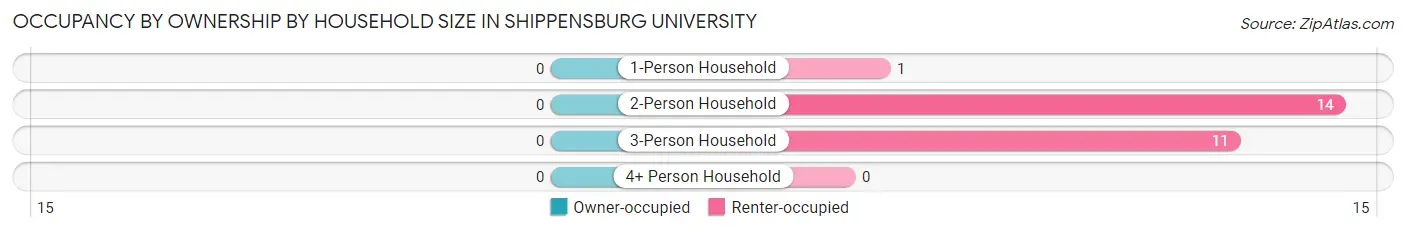
| Household Size | Owner-occupied | Renter-occupied |
| 1-Person Household | 0 (0.0%) | 1 (100.0%) |
| 2-Person Household | 0 (0.0%) | 14 (100.0%) |
| 3-Person Household | 0 (0.0%) | 11 (100.0%) |
| 4+ Person Household | 0 (0.0%) | 0 (0.0%) |
| Total Housing Units | 0 (0.0%) | 26 (100.0%) |
Occupancy by Educational Attainment in Shippensburg University
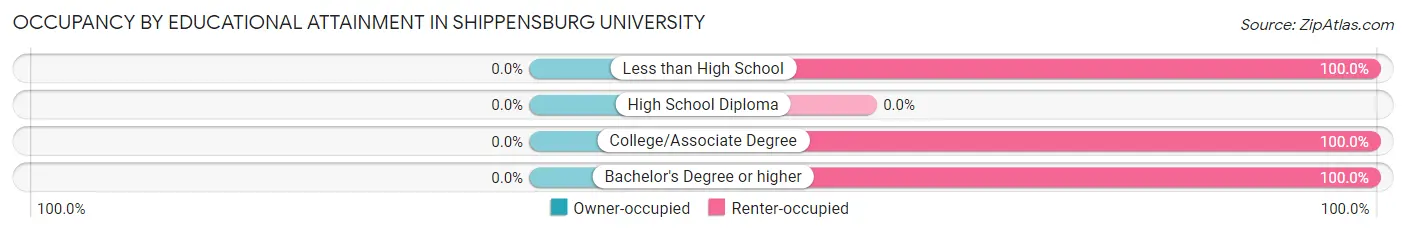
| Household Size | Owner-occupied | Renter-occupied |
| Less than High School | 0 (0.0%) | 4 (100.0%) |
| High School Diploma | 0 (0.0%) | 0 (0.0%) |
| College/Associate Degree | 0 (0.0%) | 17 (100.0%) |
| Bachelor's Degree or higher | 0 (0.0%) | 5 (100.0%) |
Occupancy by Age of Householder in Shippensburg University
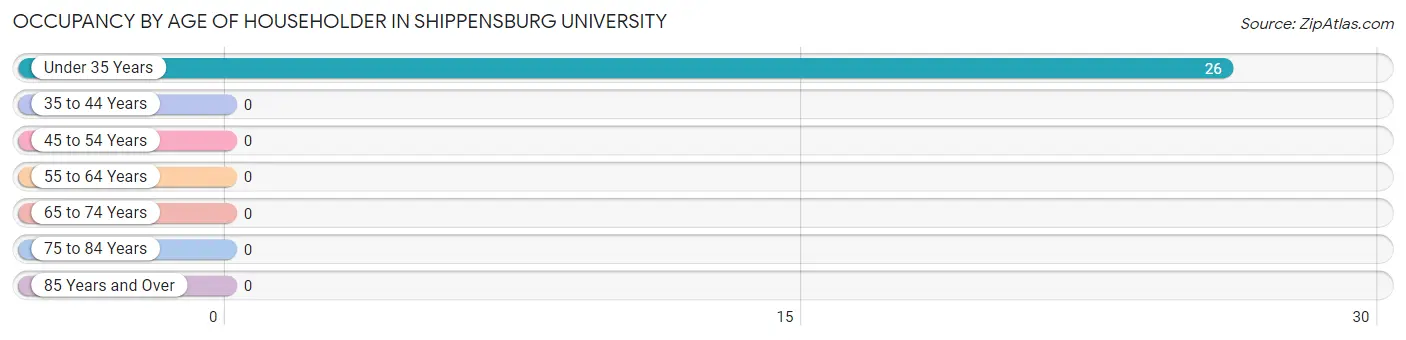
| Age Bracket | # Households | % Households |
| Under 35 Years | 26 | 100.0% |
| 35 to 44 Years | 0 | 0.0% |
| 45 to 54 Years | 0 | 0.0% |
| 55 to 64 Years | 0 | 0.0% |
| 65 to 74 Years | 0 | 0.0% |
| 75 to 84 Years | 0 | 0.0% |
| 85 Years and Over | 0 | 0.0% |
| Total | 26 | 100.0% |
Housing Finances in Shippensburg University
Median Income by Occupancy in Shippensburg University
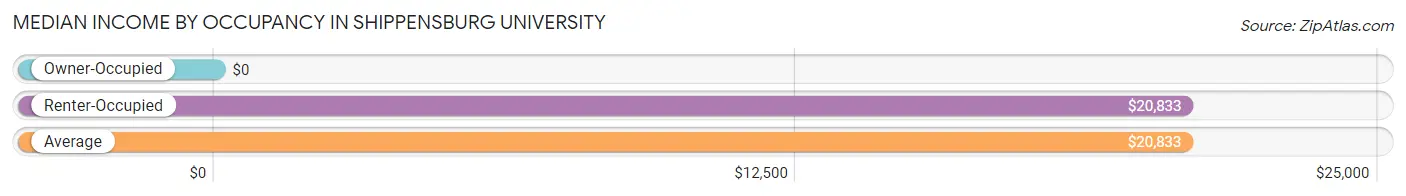
| Occupancy Type | # Households | Median Income |
| Owner-Occupied | 0 (0.0%) | $0 |
| Renter-Occupied | 26 (100.0%) | $20,833 |
| Average | 26 (100.0%) | $20,833 |
Occupancy by Householder Income Bracket in Shippensburg University
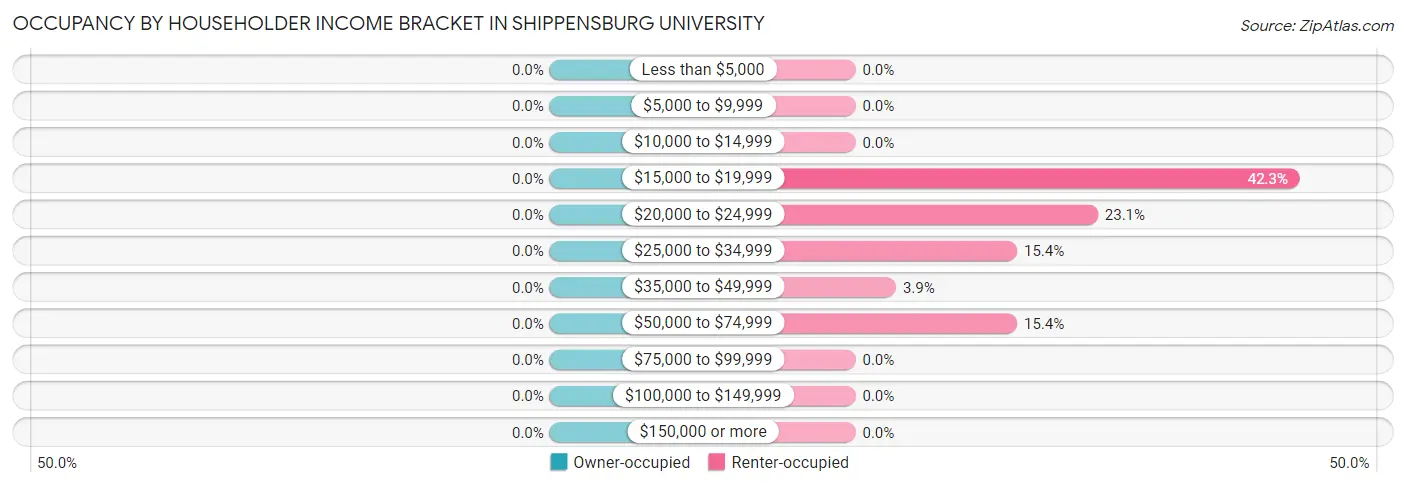
| Income Bracket | Owner-occupied | Renter-occupied |
| Less than $5,000 | 0 (0.0%) | 0 (0.0%) |
| $5,000 to $9,999 | 0 (0.0%) | 0 (0.0%) |
| $10,000 to $14,999 | 0 (0.0%) | 0 (0.0%) |
| $15,000 to $19,999 | 0 (0.0%) | 11 (42.3%) |
| $20,000 to $24,999 | 0 (0.0%) | 6 (23.1%) |
| $25,000 to $34,999 | 0 (0.0%) | 4 (15.4%) |
| $35,000 to $49,999 | 0 (0.0%) | 1 (3.8%) |
| $50,000 to $74,999 | 0 (0.0%) | 4 (15.4%) |
| $75,000 to $99,999 | 0 (0.0%) | 0 (0.0%) |
| $100,000 to $149,999 | 0 (0.0%) | 0 (0.0%) |
| $150,000 or more | 0 (0.0%) | 0 (0.0%) |
| Total | 0 (0.0%) | 26 (100.0%) |
Monthly Housing Cost Tiers in Shippensburg University
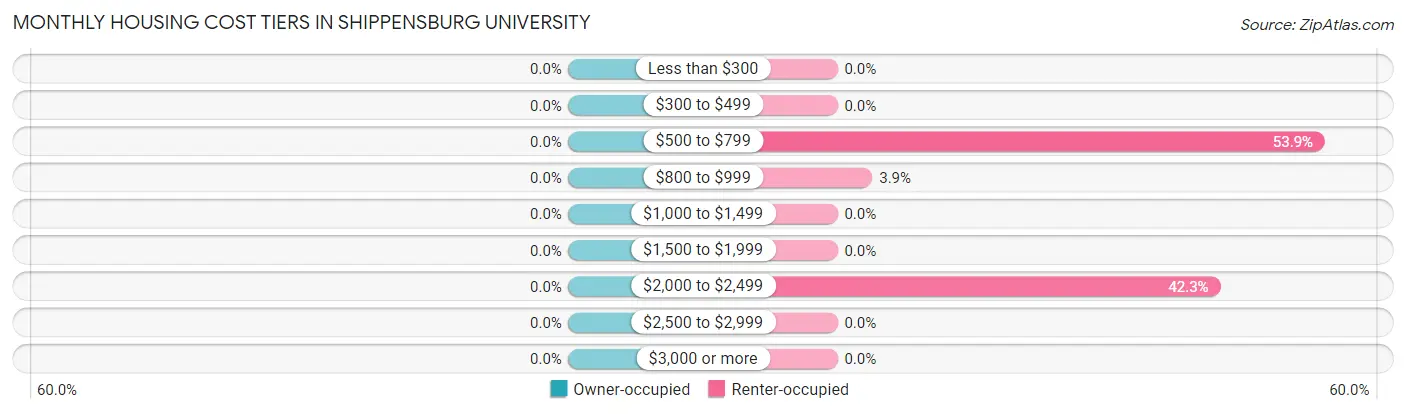
| Monthly Cost | Owner-occupied | Renter-occupied |
| Less than $300 | 0 (0.0%) | 0 (0.0%) |
| $300 to $499 | 0 (0.0%) | 0 (0.0%) |
| $500 to $799 | 0 (0.0%) | 14 (53.8%) |
| $800 to $999 | 0 (0.0%) | 1 (3.8%) |
| $1,000 to $1,499 | 0 (0.0%) | 0 (0.0%) |
| $1,500 to $1,999 | 0 (0.0%) | 0 (0.0%) |
| $2,000 to $2,499 | 0 (0.0%) | 11 (42.3%) |
| $2,500 to $2,999 | 0 (0.0%) | 0 (0.0%) |
| $3,000 or more | 0 (0.0%) | 0 (0.0%) |
| Total | 0 (0.0%) | 26 (100.0%) |
Physical Housing Characteristics in Shippensburg University
Housing Structures in Shippensburg University
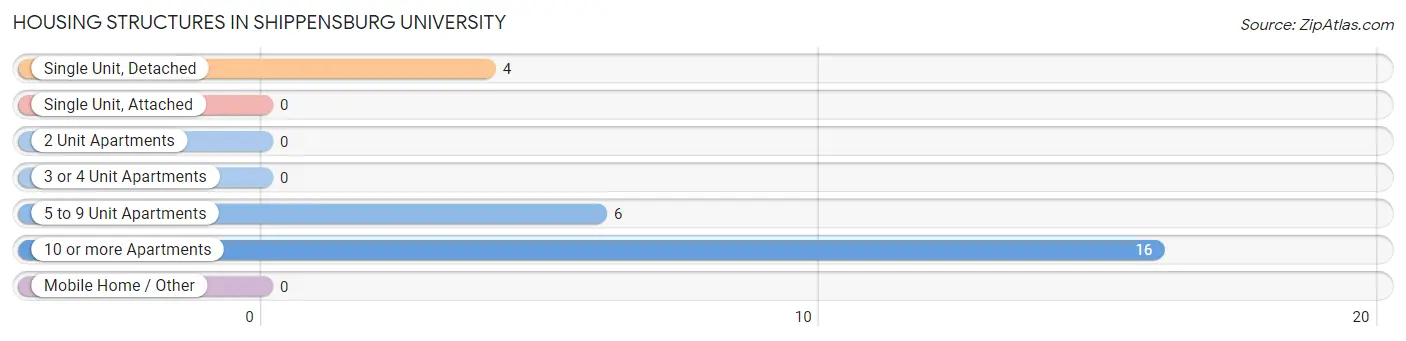
| Structure Type | # Housing Units | % Housing Units |
| Single Unit, Detached | 4 | 15.4% |
| Single Unit, Attached | 0 | 0.0% |
| 2 Unit Apartments | 0 | 0.0% |
| 3 or 4 Unit Apartments | 0 | 0.0% |
| 5 to 9 Unit Apartments | 6 | 23.1% |
| 10 or more Apartments | 16 | 61.5% |
| Mobile Home / Other | 0 | 0.0% |
| Total | 26 | 100.0% |
Housing Structures by Occupancy in Shippensburg University
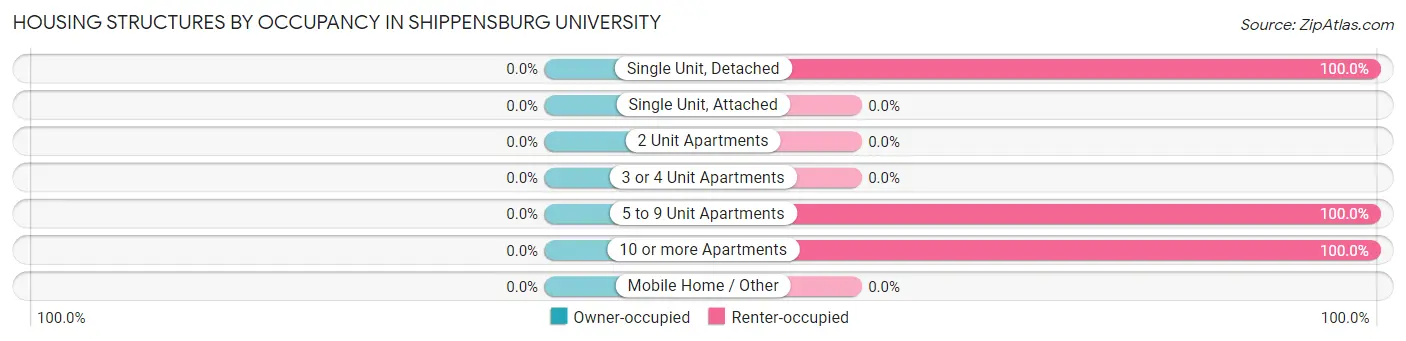
| Structure Type | Owner-occupied | Renter-occupied |
| Single Unit, Detached | 0 (0.0%) | 4 (100.0%) |
| Single Unit, Attached | 0 (0.0%) | 0 (0.0%) |
| 2 Unit Apartments | 0 (0.0%) | 0 (0.0%) |
| 3 or 4 Unit Apartments | 0 (0.0%) | 0 (0.0%) |
| 5 to 9 Unit Apartments | 0 (0.0%) | 6 (100.0%) |
| 10 or more Apartments | 0 (0.0%) | 16 (100.0%) |
| Mobile Home / Other | 0 (0.0%) | 0 (0.0%) |
| Total | 0 (0.0%) | 26 (100.0%) |
Housing Structures by Number of Rooms in Shippensburg University
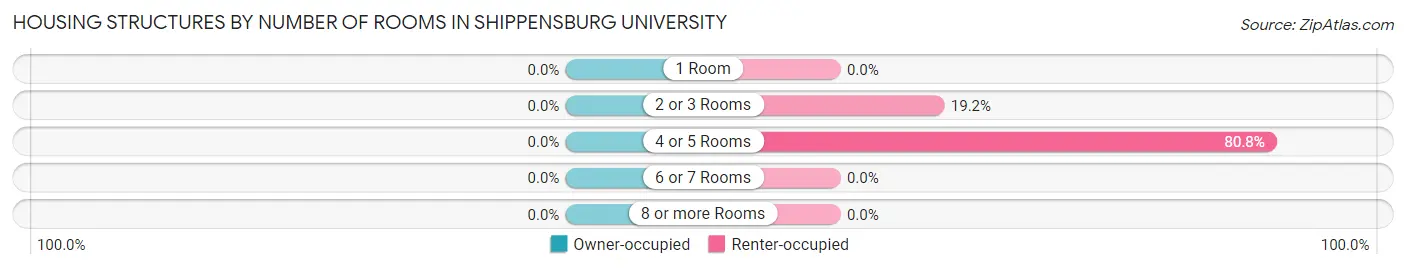
| Number of Rooms | Owner-occupied | Renter-occupied |
| 1 Room | 0 (0.0%) | 0 (0.0%) |
| 2 or 3 Rooms | 0 (0.0%) | 5 (19.2%) |
| 4 or 5 Rooms | 0 (0.0%) | 21 (80.8%) |
| 6 or 7 Rooms | 0 (0.0%) | 0 (0.0%) |
| 8 or more Rooms | 0 (0.0%) | 0 (0.0%) |
| Total | 0 (0.0%) | 26 (100.0%) |
Housing Structure by Heating Type in Shippensburg University
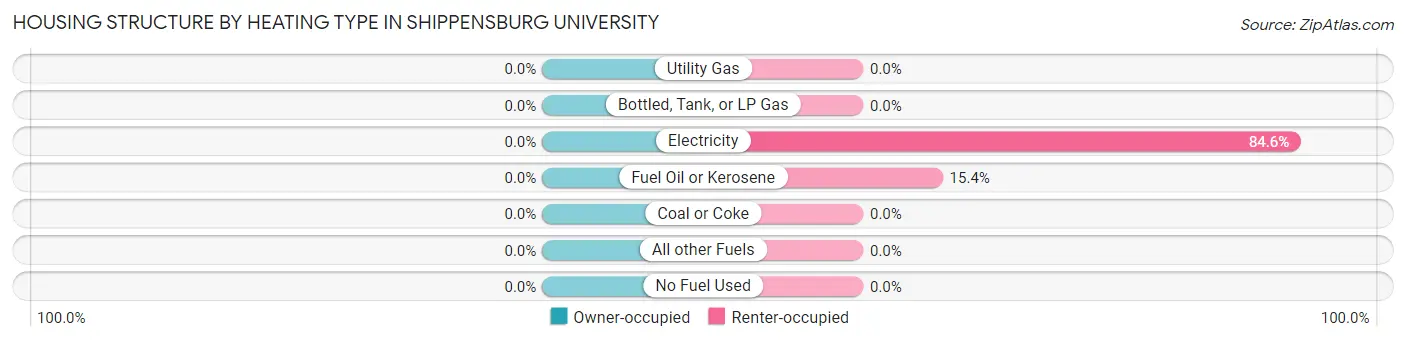
| Heating Type | Owner-occupied | Renter-occupied |
| Utility Gas | 0 (0.0%) | 0 (0.0%) |
| Bottled, Tank, or LP Gas | 0 (0.0%) | 0 (0.0%) |
| Electricity | 0 (0.0%) | 22 (84.6%) |
| Fuel Oil or Kerosene | 0 (0.0%) | 4 (15.4%) |
| Coal or Coke | 0 (0.0%) | 0 (0.0%) |
| All other Fuels | 0 (0.0%) | 0 (0.0%) |
| No Fuel Used | 0 (0.0%) | 0 (0.0%) |
| Total | 0 (0.0%) | 26 (100.0%) |
Household Vehicle Usage in Shippensburg University
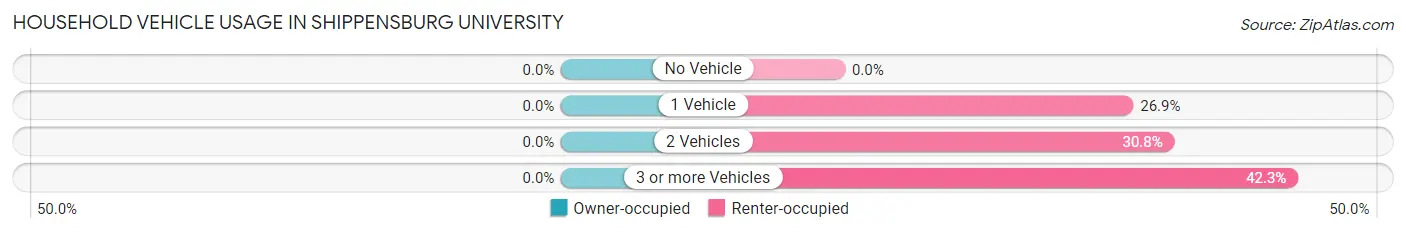
| Vehicles per Household | Owner-occupied | Renter-occupied |
| No Vehicle | 0 (0.0%) | 0 (0.0%) |
| 1 Vehicle | 0 (0.0%) | 7 (26.9%) |
| 2 Vehicles | 0 (0.0%) | 8 (30.8%) |
| 3 or more Vehicles | 0 (0.0%) | 11 (42.3%) |
| Total | 0 (0.0%) | 26 (100.0%) |
Real Estate & Mortgages in Shippensburg University
Real Estate and Mortgage Overview in Shippensburg University
| Characteristic | Without Mortgage | With Mortgage |
| Housing Units | 0 | 0 |
| Median Property Value | - | - |
| Median Household Income | - | - |
| Monthly Housing Costs | - | - |
| Real Estate Taxes | - | - |
Property Value by Mortgage Status in Shippensburg University
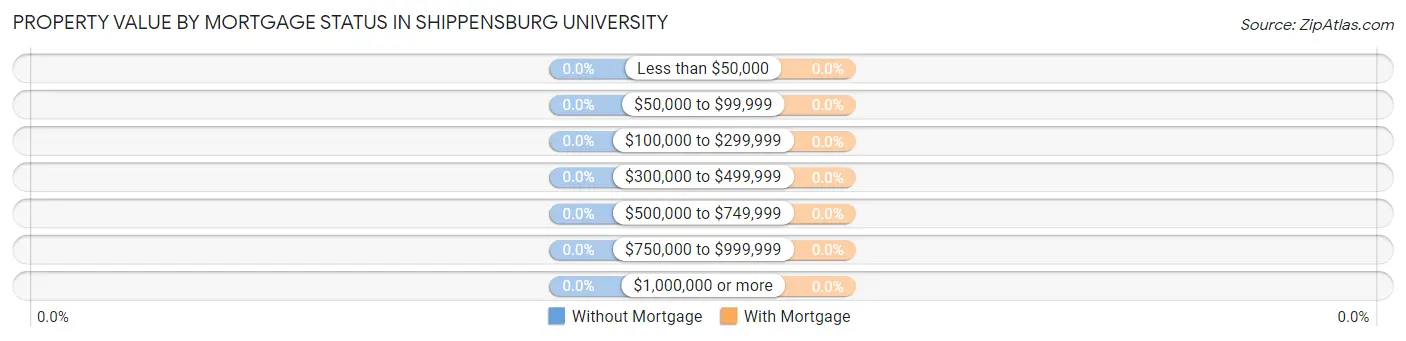
| Property Value | Without Mortgage | With Mortgage |
| Less than $50,000 | 0 (0.0%) | 0 (0.0%) |
| $50,000 to $99,999 | 0 (0.0%) | 0 (0.0%) |
| $100,000 to $299,999 | 0 (0.0%) | 0 (0.0%) |
| $300,000 to $499,999 | 0 (0.0%) | 0 (0.0%) |
| $500,000 to $749,999 | 0 (0.0%) | 0 (0.0%) |
| $750,000 to $999,999 | 0 (0.0%) | 0 (0.0%) |
| $1,000,000 or more | 0 (0.0%) | 0 (0.0%) |
| Total | 0 (0.0%) | 0 (0.0%) |
Household Income by Mortgage Status in Shippensburg University
| Household Income | Without Mortgage | With Mortgage |
| Less than $10,000 | 0 (0.0%) | 0 (0.0%) |
| $10,000 to $24,999 | 0 (0.0%) | 0 (0.0%) |
| $25,000 to $34,999 | 0 (0.0%) | 0 (0.0%) |
| $35,000 to $49,999 | 0 (0.0%) | 0 (0.0%) |
| $50,000 to $74,999 | 0 (0.0%) | 0 (0.0%) |
| $75,000 to $99,999 | 0 (0.0%) | 0 (0.0%) |
| $100,000 to $149,999 | 0 (0.0%) | 0 (0.0%) |
| $150,000 or more | 0 (0.0%) | 0 (0.0%) |
| Total | 0 (0.0%) | 0 (0.0%) |
Property Value to Household Income Ratio in Shippensburg University
| Value-to-Income Ratio | Without Mortgage | With Mortgage |
| Less than 2.0x | 0 (0.0%) | 0 (0.0%) |
| 2.0x to 2.9x | 0 (0.0%) | 0 (0.0%) |
| 3.0x to 3.9x | 0 (0.0%) | 0 (0.0%) |
| 4.0x or more | 0 (0.0%) | 0 (0.0%) |
| Total | 0 (0.0%) | 0 (0.0%) |
Real Estate Taxes by Mortgage Status in Shippensburg University
| Property Taxes | Without Mortgage | With Mortgage |
| Less than $800 | 0 (0.0%) | 0 (0.0%) |
| $800 to $1,499 | 0 (0.0%) | 0 (0.0%) |
| $800 to $1,499 | 0 (0.0%) | 0 (0.0%) |
| Total | 0 (0.0%) | 0 (0.0%) |
Health & Disability in Shippensburg University
Health Insurance Coverage by Age in Shippensburg University
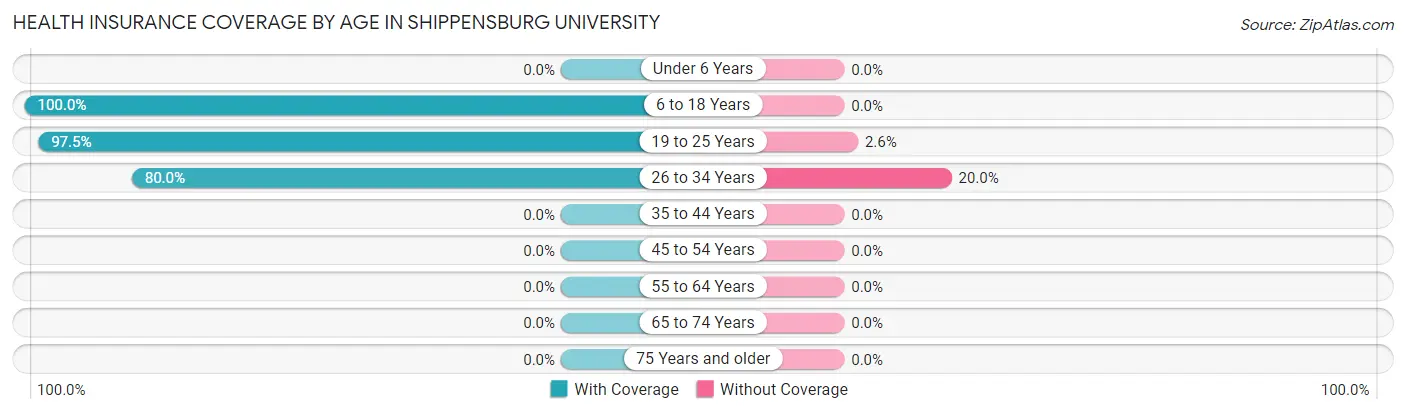
| Age Bracket | With Coverage | Without Coverage |
| Under 6 Years | 0 (0.0%) | 0 (0.0%) |
| 6 to 18 Years | 600 (100.0%) | 0 (0.0%) |
| 19 to 25 Years | 1,260 (97.5%) | 33 (2.5%) |
| 26 to 34 Years | 20 (80.0%) | 5 (20.0%) |
| 35 to 44 Years | 0 (0.0%) | 0 (0.0%) |
| 45 to 54 Years | 0 (0.0%) | 0 (0.0%) |
| 55 to 64 Years | 0 (0.0%) | 0 (0.0%) |
| 65 to 74 Years | 0 (0.0%) | 0 (0.0%) |
| 75 Years and older | 0 (0.0%) | 0 (0.0%) |
| Total | 1,880 (98.0%) | 38 (2.0%) |
Health Insurance Coverage by Citizenship Status in Shippensburg University
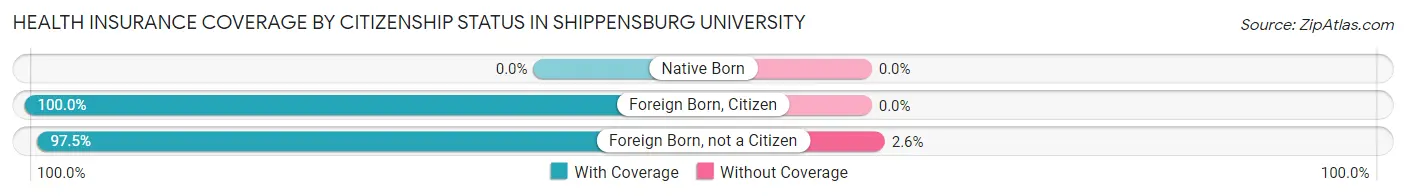
| Citizenship Status | With Coverage | Without Coverage |
| Native Born | 0 (0.0%) | 0 (0.0%) |
| Foreign Born, Citizen | 600 (100.0%) | 0 (0.0%) |
| Foreign Born, not a Citizen | 1,260 (97.5%) | 33 (2.5%) |
Health Insurance Coverage by Household Income in Shippensburg University
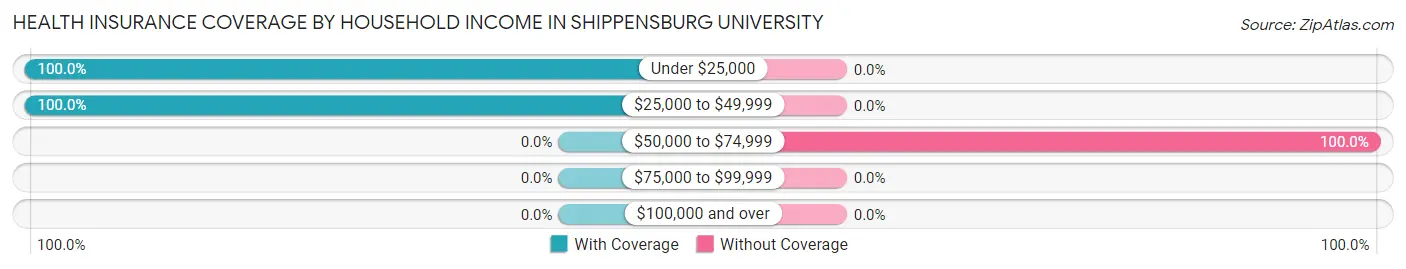
| Household Income | With Coverage | Without Coverage |
| Under $25,000 | 47 (100.0%) | 0 (0.0%) |
| $25,000 to $49,999 | 10 (100.0%) | 0 (0.0%) |
| $50,000 to $74,999 | 0 (0.0%) | 10 (100.0%) |
| $75,000 to $99,999 | 0 (0.0%) | 0 (0.0%) |
| $100,000 and over | 0 (0.0%) | 0 (0.0%) |
Public vs Private Health Insurance Coverage by Age in Shippensburg University
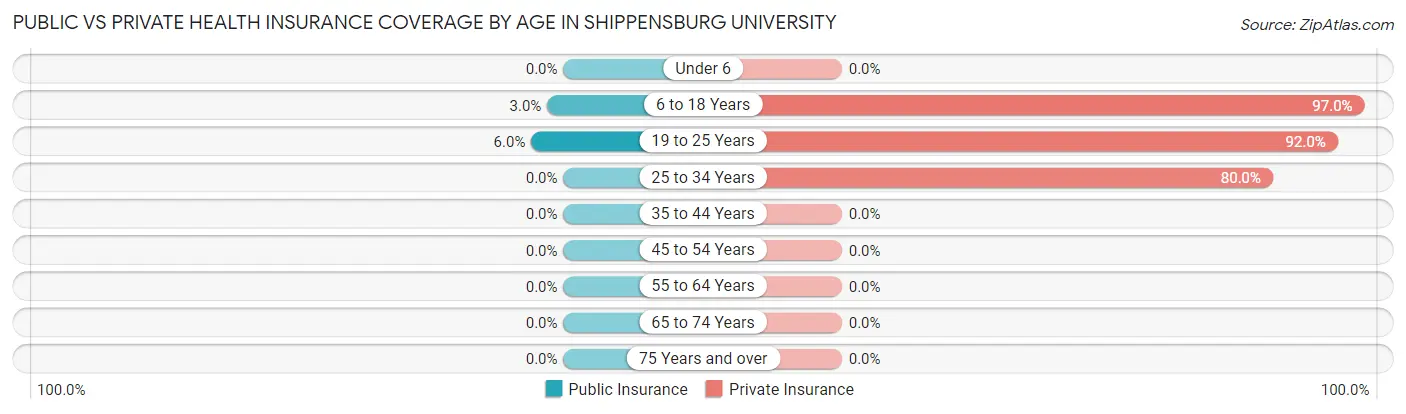
| Age Bracket | Public Insurance | Private Insurance |
| Under 6 | 0 (0.0%) | 0 (0.0%) |
| 6 to 18 Years | 18 (3.0%) | 582 (97.0%) |
| 19 to 25 Years | 77 (6.0%) | 1,190 (92.0%) |
| 25 to 34 Years | 0 (0.0%) | 20 (80.0%) |
| 35 to 44 Years | 0 (0.0%) | 0 (0.0%) |
| 45 to 54 Years | 0 (0.0%) | 0 (0.0%) |
| 55 to 64 Years | 0 (0.0%) | 0 (0.0%) |
| 65 to 74 Years | 0 (0.0%) | 0 (0.0%) |
| 75 Years and over | 0 (0.0%) | 0 (0.0%) |
| Total | 95 (5.0%) | 1,792 (93.4%) |
Disability Status by Sex by Age in Shippensburg University
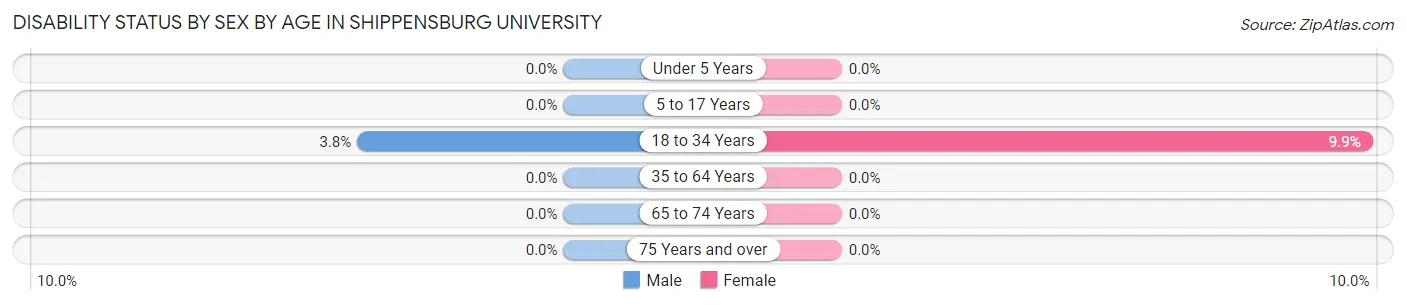
| Age Bracket | Male | Female |
| Under 5 Years | 0 (0.0%) | 0 (0.0%) |
| 5 to 17 Years | 0 (0.0%) | 0 (0.0%) |
| 18 to 34 Years | 40 (3.8%) | 86 (9.9%) |
| 35 to 64 Years | 0 (0.0%) | 0 (0.0%) |
| 65 to 74 Years | 0 (0.0%) | 0 (0.0%) |
| 75 Years and over | 0 (0.0%) | 0 (0.0%) |
Disability Class by Sex by Age in Shippensburg University
Disability Class: Hearing Difficulty
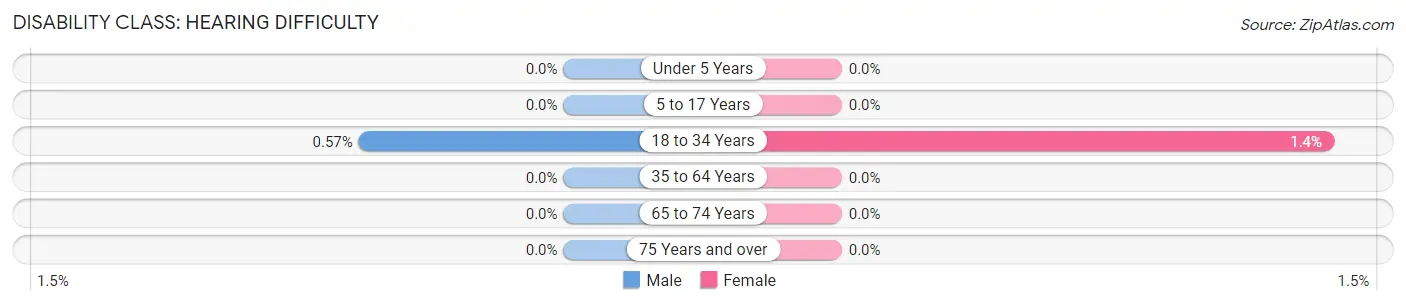
| Age Bracket | Male | Female |
| Under 5 Years | 0 (0.0%) | 0 (0.0%) |
| 5 to 17 Years | 0 (0.0%) | 0 (0.0%) |
| 18 to 34 Years | 6 (0.6%) | 12 (1.4%) |
| 35 to 64 Years | 0 (0.0%) | 0 (0.0%) |
| 65 to 74 Years | 0 (0.0%) | 0 (0.0%) |
| 75 Years and over | 0 (0.0%) | 0 (0.0%) |
Disability Class: Vision Difficulty
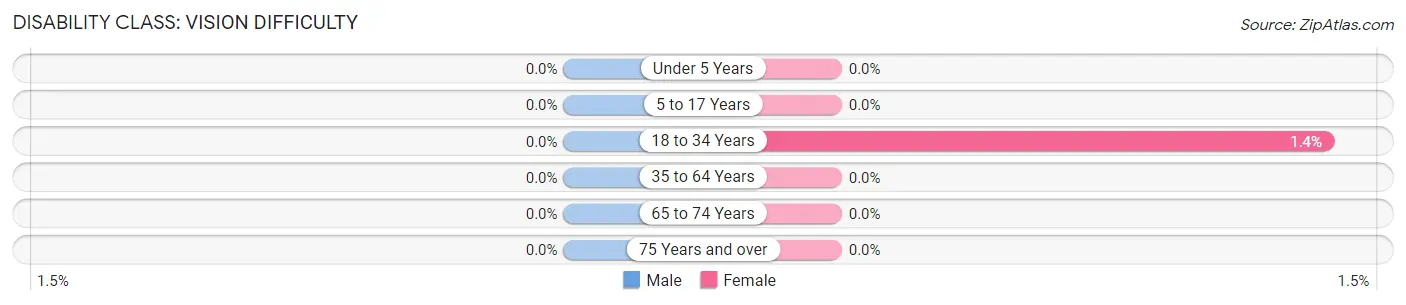
| Age Bracket | Male | Female |
| Under 5 Years | 0 (0.0%) | 0 (0.0%) |
| 5 to 17 Years | 0 (0.0%) | 0 (0.0%) |
| 18 to 34 Years | 0 (0.0%) | 12 (1.4%) |
| 35 to 64 Years | 0 (0.0%) | 0 (0.0%) |
| 65 to 74 Years | 0 (0.0%) | 0 (0.0%) |
| 75 Years and over | 0 (0.0%) | 0 (0.0%) |
Disability Class: Cognitive Difficulty
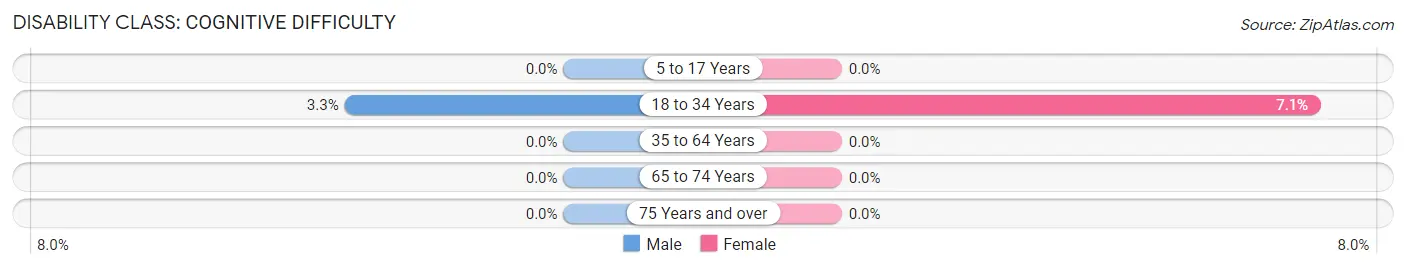
| Age Bracket | Male | Female |
| 5 to 17 Years | 0 (0.0%) | 0 (0.0%) |
| 18 to 34 Years | 34 (3.3%) | 62 (7.1%) |
| 35 to 64 Years | 0 (0.0%) | 0 (0.0%) |
| 65 to 74 Years | 0 (0.0%) | 0 (0.0%) |
| 75 Years and over | 0 (0.0%) | 0 (0.0%) |
Disability Class: Ambulatory Difficulty
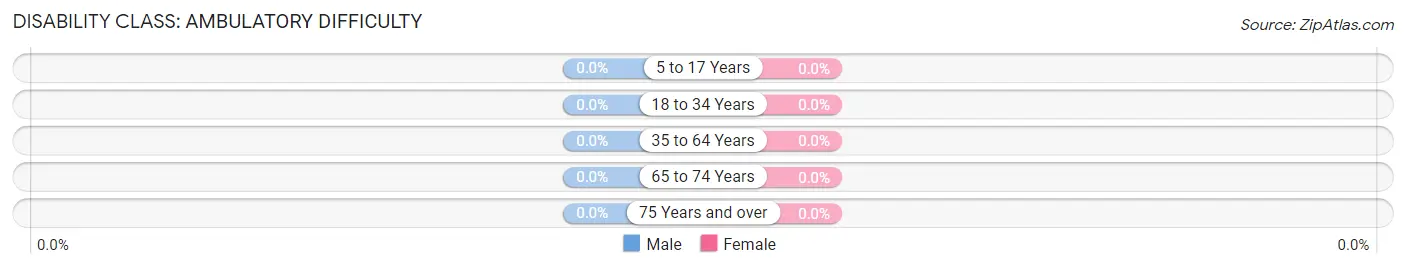
| Age Bracket | Male | Female |
| 5 to 17 Years | 0 (0.0%) | 0 (0.0%) |
| 18 to 34 Years | 0 (0.0%) | 0 (0.0%) |
| 35 to 64 Years | 0 (0.0%) | 0 (0.0%) |
| 65 to 74 Years | 0 (0.0%) | 0 (0.0%) |
| 75 Years and over | 0 (0.0%) | 0 (0.0%) |
Disability Class: Self-Care Difficulty
| Age Bracket | Male | Female |
| 5 to 17 Years | 0 (0.0%) | 0 (0.0%) |
| 18 to 34 Years | 0 (0.0%) | 0 (0.0%) |
| 35 to 64 Years | 0 (0.0%) | 0 (0.0%) |
| 65 to 74 Years | 0 (0.0%) | 0 (0.0%) |
| 75 Years and over | 0 (0.0%) | 0 (0.0%) |
Technology Access in Shippensburg University
Computing Device Access in Shippensburg University
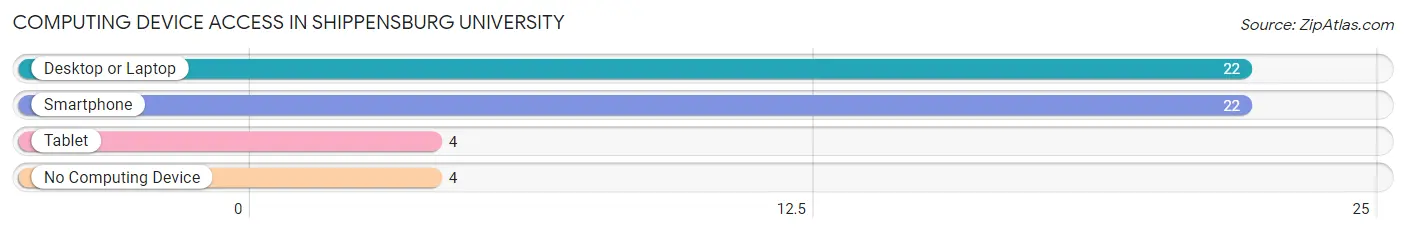
| Device Type | # Households | % Households |
| Desktop or Laptop | 22 | 84.6% |
| Smartphone | 22 | 84.6% |
| Tablet | 4 | 15.4% |
| No Computing Device | 4 | 15.4% |
| Total | 26 | 100.0% |
Internet Access in Shippensburg University
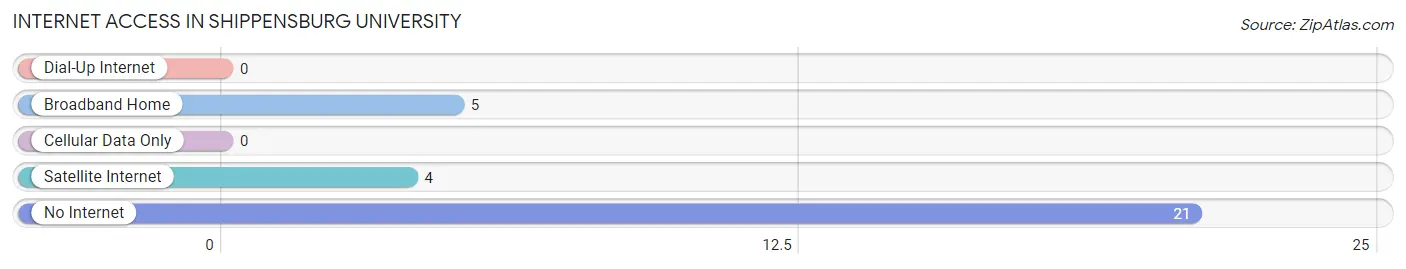
| Internet Type | # Households | % Households |
| Dial-Up Internet | 0 | 0.0% |
| Broadband Home | 5 | 19.2% |
| Cellular Data Only | 0 | 0.0% |
| Satellite Internet | 4 | 15.4% |
| No Internet | 21 | 80.8% |
| Total | 26 | 100.0% |
Shippensburg University Summary
Shippensburg University is located in Shippensburg, Pennsylvania, a small town in Cumberland County. The university was founded in 1871 and is a member of the Pennsylvania State System of Higher Education. It is a public university that offers undergraduate and graduate degrees in a variety of disciplines.
History
Shippensburg University was founded in 1871 as the Cumberland Valley State Normal School. It was established to provide teacher training for the local area. The school was renamed Shippensburg State Normal School in 1926 and Shippensburg State Teachers College in 1927. In 1960, the school was renamed Shippensburg State College and in 1983, it was renamed Shippensburg University of Pennsylvania.
Geography
Shippensburg University is located in the town of Shippensburg, Pennsylvania. The town is situated in the Cumberland Valley, which is part of the Appalachian Mountains. The university is located in the south-central part of the state, about 25 miles southwest of Harrisburg. The town is surrounded by rolling hills and farmland.
Economy
The economy of Shippensburg is largely driven by the university. The university is the largest employer in the town, providing jobs for faculty, staff, and students. The university also contributes to the local economy through its spending on goods and services. In addition, the university attracts visitors to the town, which helps to support local businesses.
Demographics
As of the 2010 census, the population of Shippensburg was 5,492. The population is predominantly white (93.3%), with a small percentage of African Americans (3.2%) and Hispanics (2.2%). The median household income is $41,945 and the median age is 24. The town has a high rate of college-educated residents, with nearly 40% of the population having a bachelor's degree or higher.
Conclusion
Shippensburg University is a public university located in the small town of Shippensburg, Pennsylvania. The university was founded in 1871 and is a member of the Pennsylvania State System of Higher Education. The university is the largest employer in the town and contributes to the local economy through its spending on goods and services. The population of Shippensburg is predominantly white, with a small percentage of African Americans and Hispanics. The median household income is $41,945 and the median age is 24. The town has a high rate of college-educated residents, with nearly 40% of the population having a bachelor's degree or higher.
Common Questions
What is Per Capita Income in Shippensburg University?
Per Capita income in Shippensburg University is $16,091.
What is the Median Household income in Shippensburg University?
Median Household Income in Shippensburg University is $20,833.
What is Income or Wage Gap in Shippensburg University?
Income or Wage Gap in Shippensburg University is 23.0%.
Women in Shippensburg University earn 77.0 cents for every dollar earned by a man.
What is Inequality or Gini Index in Shippensburg University?
Inequality or Gini Index in Shippensburg University is 0.23.
What is the Total Population of Shippensburg University?
Total Population of Shippensburg University is 1,924.
What is the Total Male Population of Shippensburg University?
Total Male Population of Shippensburg University is 1,051.
What is the Total Female Population of Shippensburg University?
Total Female Population of Shippensburg University is 873.
What is the Ratio of Males per 100 Females in Shippensburg University?
There are 120.39 Males per 100 Females in Shippensburg University.
What is the Ratio of Females per 100 Males in Shippensburg University?
There are 83.06 Females per 100 Males in Shippensburg University.
What is the Median Population Age in Shippensburg University?
Median Population Age in Shippensburg University is 19.6 Years.
What is the Average Family Size in Shippensburg University
Average Family Size in Shippensburg University is 2.2 People.
What is the Average Household Size in Shippensburg University
Average Household Size in Shippensburg University is 2.6 People.
How Large is the Labor Force in Shippensburg University?
There are 1,262 People in the Labor Forcein in Shippensburg University.
What is the Percentage of People in the Labor Force in Shippensburg University?
65.6% of People are in the Labor Force in Shippensburg University.
What is the Unemployment Rate in Shippensburg University?
Unemployment Rate in Shippensburg University is 16.5%.