Cities with the Most Immigrants from Nepal in Pennsylvania
RELATED REPORTS & OPTIONS
Nepal
Pennsylvania
Compare Cities
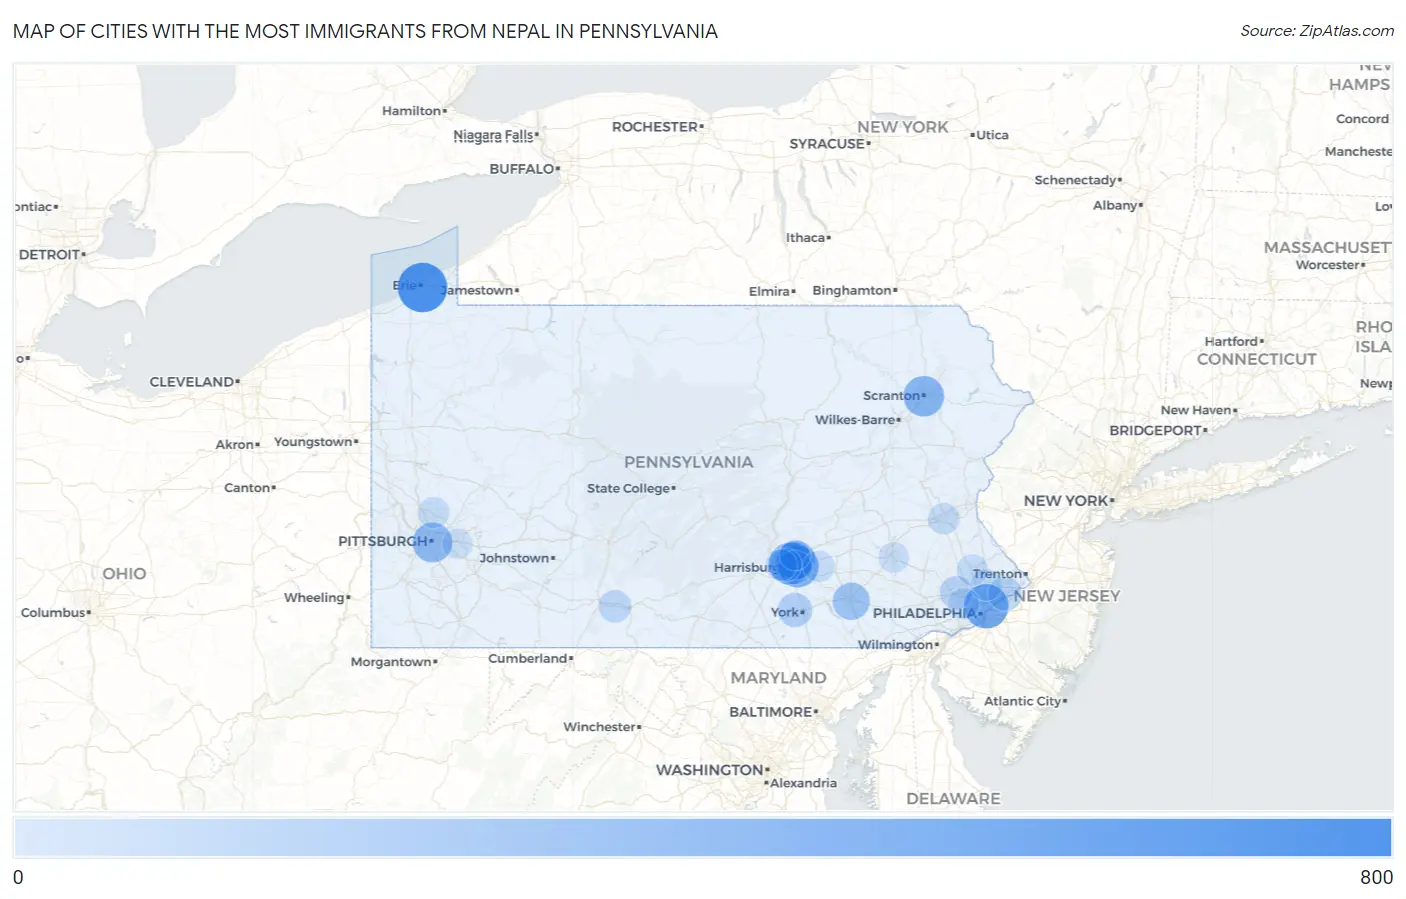
Map of Cities with the Most Immigrants from Nepal in Pennsylvania
0
800
Cities with the Most Immigrants from Nepal in Pennsylvania
| City | Nepal | vs State | vs National | |
| 1. | Erie | 610 | 6,855(8.90%)#1 | 165,080(0.37%)#30 |
| 2. | Baldwin Borough | 470 | 6,855(6.86%)#2 | 165,080(0.28%)#51 |
| 3. | Philadelphia | 447 | 6,855(6.52%)#3 | 165,080(0.27%)#58 |
| 4. | Whitehall Borough | 428 | 6,855(6.24%)#4 | 165,080(0.26%)#61 |
| 5. | Rutherford | 378 | 6,855(5.51%)#5 | 165,080(0.23%)#76 |
| 6. | Progress | 368 | 6,855(5.37%)#6 | 165,080(0.22%)#79 |
| 7. | Scranton | 325 | 6,855(4.74%)#7 | 165,080(0.20%)#86 |
| 8. | Pittsburgh | 298 | 6,855(4.35%)#8 | 165,080(0.18%)#101 |
| 9. | Paxtonia | 256 | 6,855(3.73%)#9 | 165,080(0.16%)#117 |
| 10. | Colonial Park | 248 | 6,855(3.62%)#10 | 165,080(0.15%)#123 |
| 11. | Lancaster | 218 | 6,855(3.18%)#11 | 165,080(0.13%)#149 |
| 12. | Middletown Borough | 156 | 6,855(2.28%)#12 | 165,080(0.09%)#219 |
| 13. | Castle Shannon Borough | 154 | 6,855(2.25%)#13 | 165,080(0.09%)#221 |
| 14. | Shiloh | 125 | 6,855(1.82%)#14 | 165,080(0.08%)#264 |
| 15. | Lawnton | 120 | 6,855(1.75%)#15 | 165,080(0.07%)#276 |
| 16. | Eddington | 112 | 6,855(1.63%)#16 | 165,080(0.07%)#297 |
| 17. | Harrisburg | 95 | 6,855(1.39%)#17 | 165,080(0.06%)#344 |
| 18. | King Of Prussia | 95 | 6,855(1.39%)#18 | 165,080(0.06%)#347 |
| 19. | Pleasant Hills Borough | 87 | 6,855(1.27%)#19 | 165,080(0.05%)#369 |
| 20. | Earlston | 70 | 6,855(1.02%)#20 | 165,080(0.04%)#449 |
| 21. | Phoenixville Borough | 66 | 6,855(0.96%)#21 | 165,080(0.04%)#464 |
| 22. | Jefferson Hills Borough | 65 | 6,855(0.95%)#22 | 165,080(0.04%)#473 |
| 23. | Glenolden Borough | 45 | 6,855(0.66%)#23 | 165,080(0.03%)#596 |
| 24. | Allentown | 42 | 6,855(0.61%)#24 | 165,080(0.03%)#610 |
| 25. | Brentwood Borough | 41 | 6,855(0.60%)#25 | 165,080(0.02%)#627 |
| 26. | Willow Grove | 40 | 6,855(0.58%)#26 | 165,080(0.02%)#630 |
| 27. | Gibsonia | 34 | 6,855(0.50%)#27 | 165,080(0.02%)#692 |
| 28. | Montgomeryville | 33 | 6,855(0.48%)#28 | 165,080(0.02%)#701 |
| 29. | Bryn Mawr | 33 | 6,855(0.48%)#29 | 165,080(0.02%)#703 |
| 30. | Campbelltown | 31 | 6,855(0.45%)#30 | 165,080(0.02%)#722 |
| 31. | West Fairview | 31 | 6,855(0.45%)#31 | 165,080(0.02%)#727 |
| 32. | Chalfont Borough | 27 | 6,855(0.39%)#32 | 165,080(0.02%)#784 |
| 33. | Millbourne Borough | 21 | 6,855(0.31%)#33 | 165,080(0.01%)#865 |
| 34. | Camp Hill Borough | 20 | 6,855(0.29%)#34 | 165,080(0.01%)#879 |
| 35. | Mount Oliver Borough | 20 | 6,855(0.29%)#35 | 165,080(0.01%)#883 |
| 36. | Linglestown | 16 | 6,855(0.23%)#36 | 165,080(0.01%)#955 |
| 37. | Chester Heights Borough | 13 | 6,855(0.19%)#37 | 165,080(0.01%)#1,016 |
| 38. | Blawnox Borough | 13 | 6,855(0.19%)#38 | 165,080(0.01%)#1,019 |
| 39. | Reading | 12 | 6,855(0.18%)#39 | 165,080(0.01%)#1,022 |
| 40. | Wyomissing Borough | 11 | 6,855(0.16%)#40 | 165,080(0.01%)#1,062 |
| 41. | Newville Borough | 10 | 6,855(0.15%)#41 | 165,080(0.01%)#1,088 |
| 42. | Monroeville | 8 | 6,855(0.12%)#42 | 165,080(0.00%)#1,115 |
| 43. | Villanova | 8 | 6,855(0.12%)#43 | 165,080(0.00%)#1,123 |
| 44. | Norristown Borough | 6 | 6,855(0.09%)#44 | 165,080(0.00%)#1,165 |
| 45. | Bessemer Borough | 4 | 6,855(0.06%)#45 | 165,080(0.00%)#1,218 |
| 46. | Paxtang Borough | 1 | 6,855(0.01%)#46 | 165,080(0.00%)#1,265 |
| 47. | Greensboro Borough | 1 | 6,855(0.01%)#47 | 165,080(0.00%)#1,267 |
Common Questions
What are the Top 10 Cities with the Most Immigrants from Nepal in Pennsylvania?
Top 10 Cities with the Most Immigrants from Nepal in Pennsylvania are:
#1
610
#2
447
#3
378
#4
368
#5
325
#6
298
#7
256
#8
248
#9
218
#10
125
What city has the Most Immigrants from Nepal in Pennsylvania?
Erie has the Most Immigrants from Nepal in Pennsylvania with 610.
What is the Total Immigrants from Nepal in the State of Pennsylvania?
Total Immigrants from Nepal in Pennsylvania is 6,855.
What is the Total Immigrants from Nepal in the United States?
Total Immigrants from Nepal in the United States is 165,080.