Zip Codes with the Highest Percentage of Population Employed in Food Preparation & Serving in Carlisle, PA
RELATED REPORTS & OPTIONS
Food Preparation & Serving
Carlisle
Compare Zip Codes
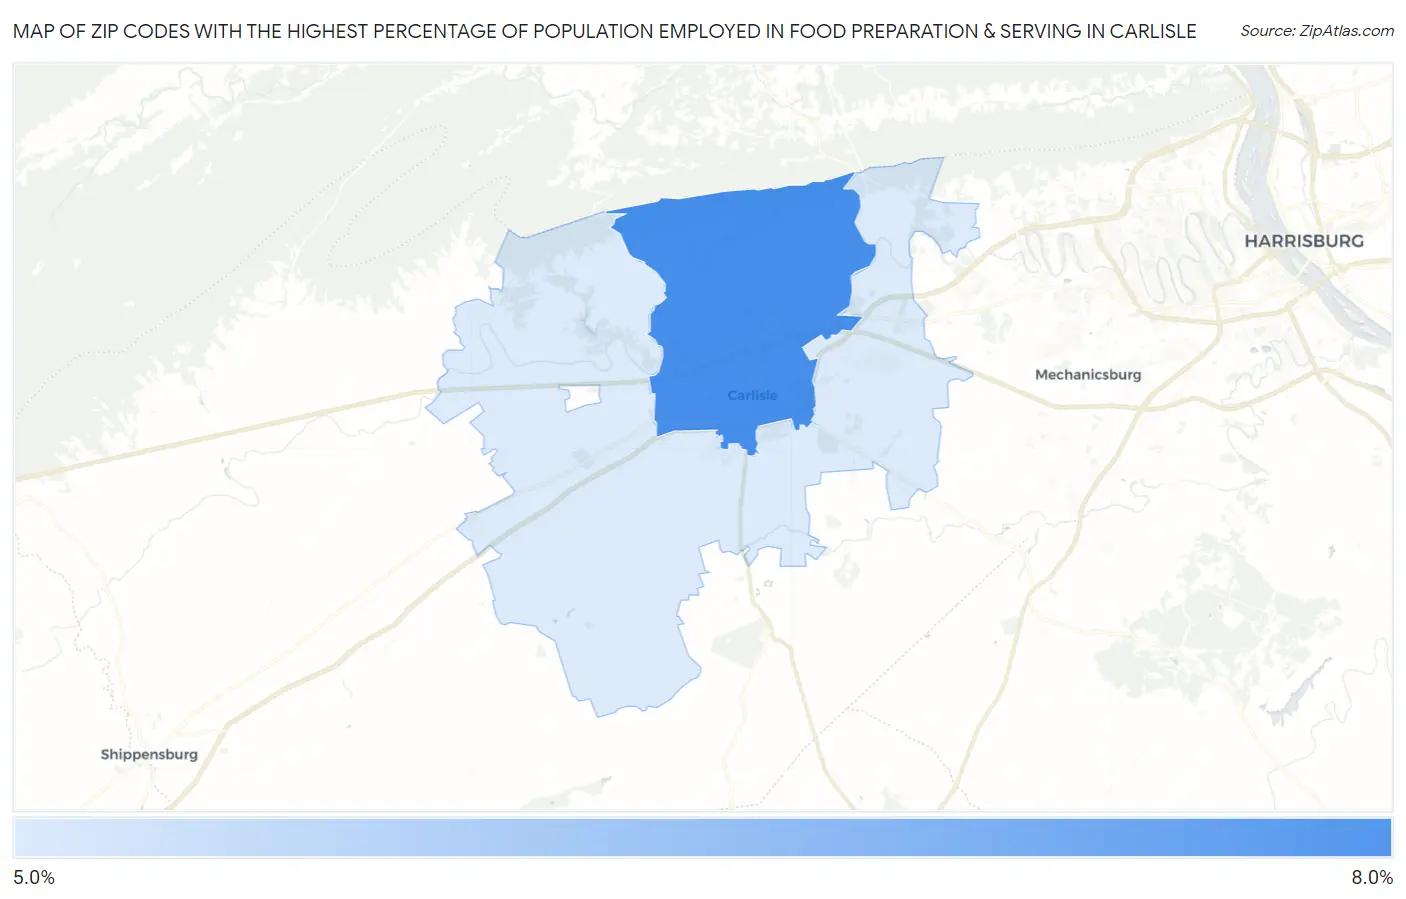
Map of Zip Codes with the Highest Percentage of Population Employed in Food Preparation & Serving in Carlisle
5.6%
6.2%
Zip Codes with the Highest Percentage of Population Employed in Food Preparation & Serving in Carlisle, PA
| Zip Code | % Employed | vs State | vs National | |
| 1. | 17013 | 6.2% | 5.0%(+1.15)#466 | 5.3%(+0.905)#8,763 |
| 2. | 17015 | 5.6% | 5.0%(+0.587)#580 | 5.3%(+0.345)#10,600 |
1
Common Questions
What are the Top Zip Codes with the Highest Percentage of Population Employed in Food Preparation & Serving in Carlisle, PA?
Top Zip Codes with the Highest Percentage of Population Employed in Food Preparation & Serving in Carlisle, PA are:
What zip code has the Highest Percentage of Population Employed in Food Preparation & Serving in Carlisle, PA?
17013 has the Highest Percentage of Population Employed in Food Preparation & Serving in Carlisle, PA with 6.2%.
What is the Percentage of Population Employed in Food Preparation & Serving in Pennsylvania?
Percentage of Population Employed in Food Preparation & Serving in Pennsylvania is 5.0%.
What is the Percentage of Population Employed in Food Preparation & Serving in the United States?
Percentage of Population Employed in Food Preparation & Serving in the United States is 5.3%.