White Mills, PA Map & Demographics
White Mills Map
White Mills Overview
$29,016
PER CAPITA INCOME
$37,679
AVG FAMILY INCOME
$43,707
AVG HOUSEHOLD INCOME
68.5%
WAGE / INCOME GAP [ % ]
31.5¢/ $1
WAGE / INCOME GAP [ $ ]
0.49
INEQUALITY / GINI INDEX
746
TOTAL POPULATION
336
MALE POPULATION
410
FEMALE POPULATION
81.95
MALES / 100 FEMALES
122.02
FEMALES / 100 MALES
44.8
MEDIAN AGE
3.0
AVG FAMILY SIZE
2.1
AVG HOUSEHOLD SIZE
409
LABOR FORCE [ PEOPLE ]
62.7%
PERCENT IN LABOR FORCE
6.6%
UNEMPLOYMENT RATE
White Mills Zip Codes
White Mills Area Codes
Income in White Mills
Income Overview in White Mills
Per Capita Income in White Mills is $29,016, while median incomes of families and households are $37,679 and $43,707 respectively.
| Characteristic | Number | Measure |
| Per Capita Income | 746 | $29,016 |
| Median Family Income | 157 | $37,679 |
| Mean Family Income | 157 | $63,737 |
| Median Household Income | 352 | $43,707 |
| Mean Household Income | 352 | $55,107 |
| Income Deficit | 157 | $0 |
| Wage / Income Gap (%) | 746 | 68.55% |
| Wage / Income Gap ($) | 746 | 31.45¢ per $1 |
| Gini / Inequality Index | 746 | 0.49 |
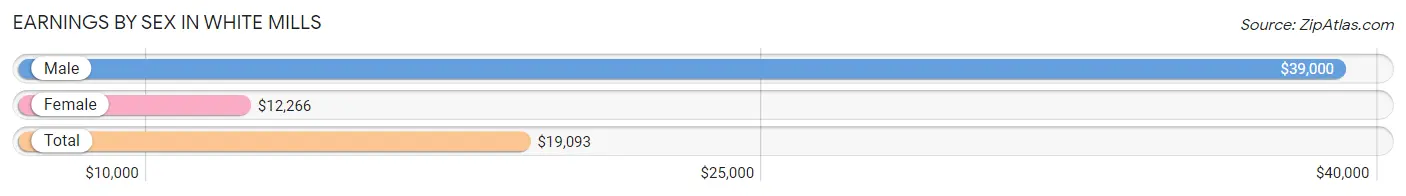
Earnings by Sex in White Mills
Average Earnings in White Mills are $19,093, $39,000 for men and $12,266 for women, a difference of 68.5%.
| Sex | Number | Average Earnings |
| Male | 224 (50.8%) | $39,000 |
| Female | 217 (49.2%) | $12,266 |
| Total | 441 (100.0%) | $19,093 |
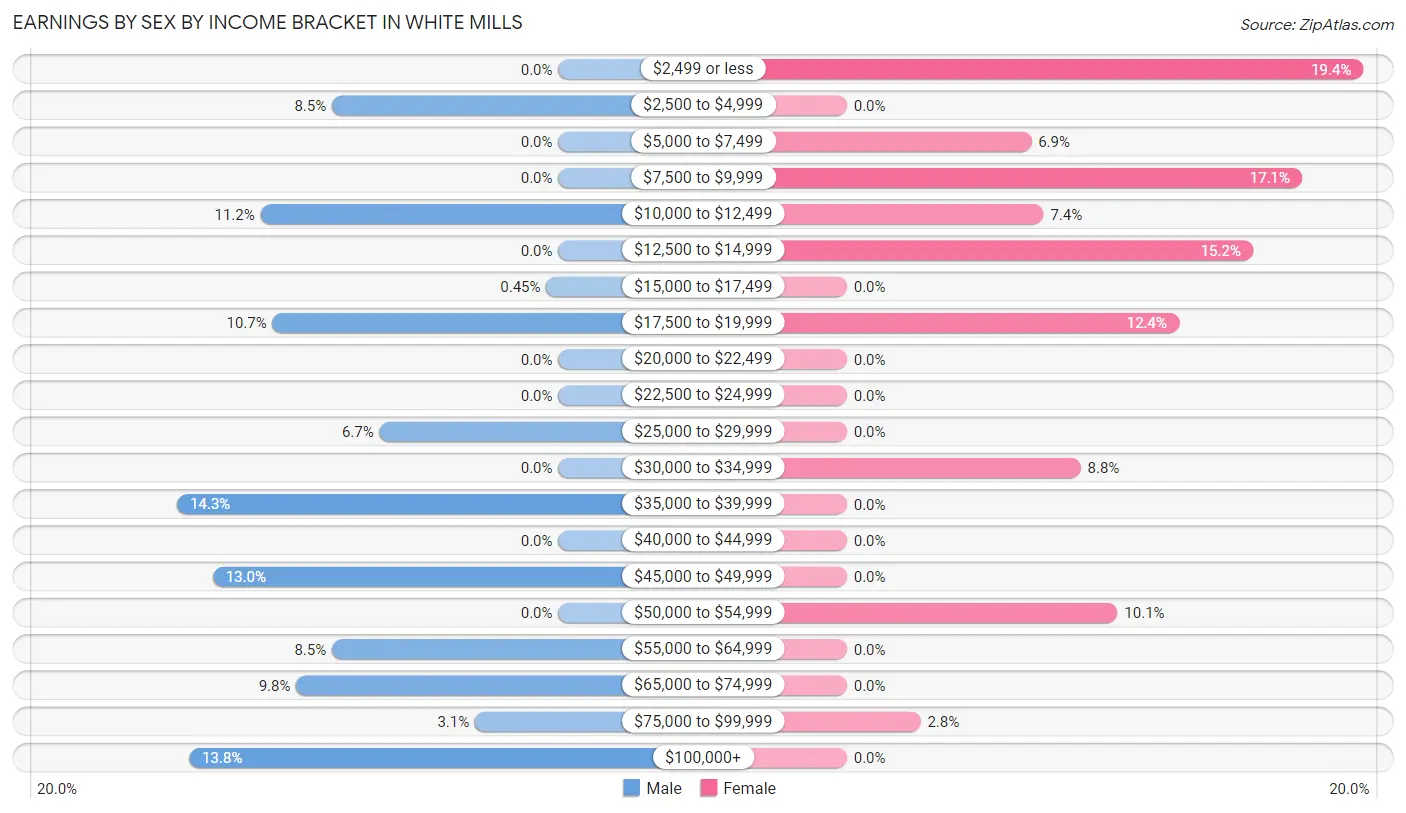
Earnings by Sex by Income Bracket in White Mills
The most common earnings brackets in White Mills are $35,000 to $39,999 for men (32 | 14.3%) and $2,499 or less for women (42 | 19.4%).
| Income | Male | Female |
| $2,499 or less | 0 (0.0%) | 42 (19.4%) |
| $2,500 to $4,999 | 19 (8.5%) | 0 (0.0%) |
| $5,000 to $7,499 | 0 (0.0%) | 15 (6.9%) |
| $7,500 to $9,999 | 0 (0.0%) | 37 (17.1%) |
| $10,000 to $12,499 | 25 (11.2%) | 16 (7.4%) |
| $12,500 to $14,999 | 0 (0.0%) | 33 (15.2%) |
| $15,000 to $17,499 | 1 (0.4%) | 0 (0.0%) |
| $17,500 to $19,999 | 24 (10.7%) | 27 (12.4%) |
| $20,000 to $22,499 | 0 (0.0%) | 0 (0.0%) |
| $22,500 to $24,999 | 0 (0.0%) | 0 (0.0%) |
| $25,000 to $29,999 | 15 (6.7%) | 0 (0.0%) |
| $30,000 to $34,999 | 0 (0.0%) | 19 (8.8%) |
| $35,000 to $39,999 | 32 (14.3%) | 0 (0.0%) |
| $40,000 to $44,999 | 0 (0.0%) | 0 (0.0%) |
| $45,000 to $49,999 | 29 (13.0%) | 0 (0.0%) |
| $50,000 to $54,999 | 0 (0.0%) | 22 (10.1%) |
| $55,000 to $64,999 | 19 (8.5%) | 0 (0.0%) |
| $65,000 to $74,999 | 22 (9.8%) | 0 (0.0%) |
| $75,000 to $99,999 | 7 (3.1%) | 6 (2.8%) |
| $100,000+ | 31 (13.8%) | 0 (0.0%) |
| Total | 224 (100.0%) | 217 (100.0%) |
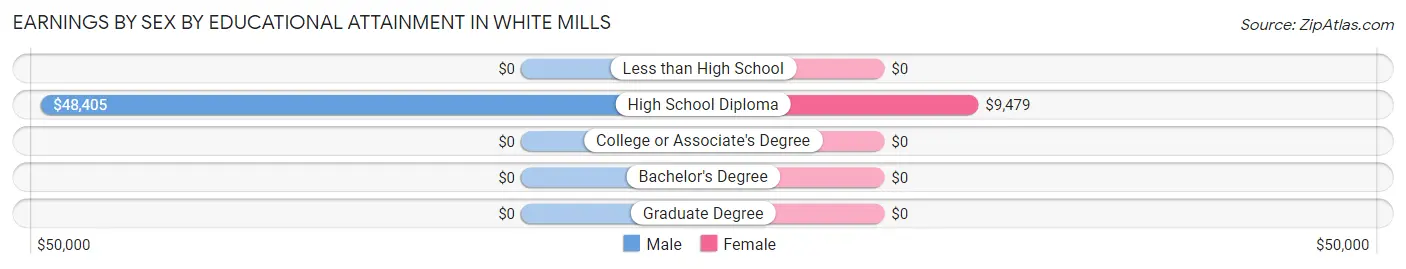
Earnings by Sex by Educational Attainment in White Mills
Average earnings in White Mills are $48,017 for men and $9,155 for women, a difference of 80.9%. Men with an educational attainment of high school diploma enjoy the highest average annual earnings of $48,405, while those with high school diploma education earn the least with $48,405. Women with an educational attainment of high school diploma earn the most with the average annual earnings of $9,479, while those with high school diploma education have the smallest earnings of $9,479.
| Educational Attainment | Male Income | Female Income |
| Less than High School | - | - |
| High School Diploma | $48,405 | $9,479 |
| College or Associate's Degree | - | - |
| Bachelor's Degree | - | - |
| Graduate Degree | - | - |
| Total | $48,017 | $9,155 |
Family Income in White Mills
Family Income Brackets in White Mills
According to the White Mills family income data, there are 37 families falling into the $15,000 to $24,999 income range, which is the most common income bracket and makes up 23.6% of all families.
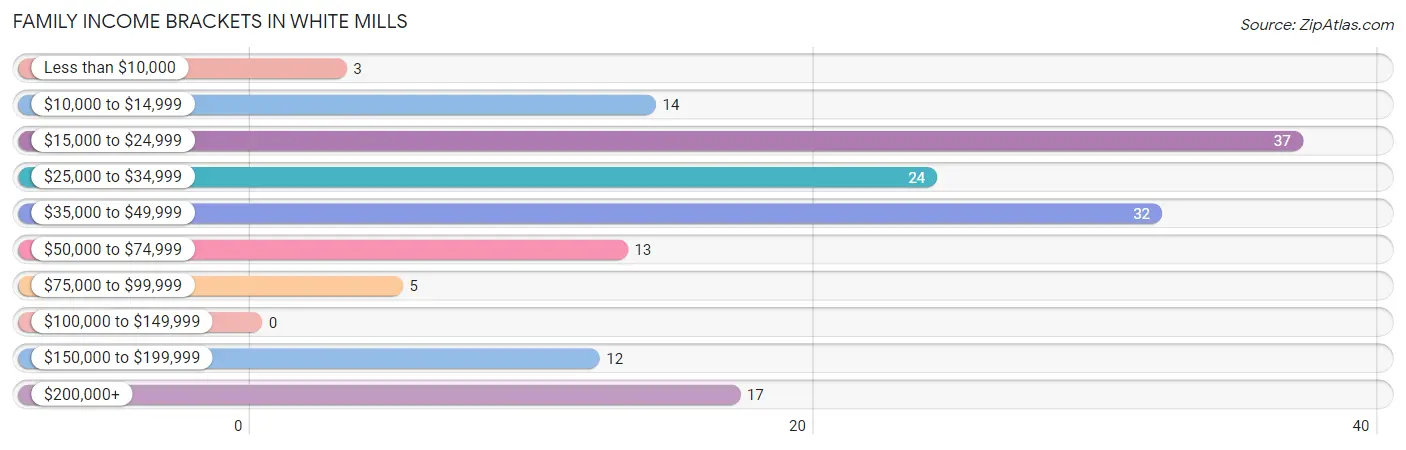
| Income Bracket | # Families | % Families |
| Less than $10,000 | 3 | 1.9% |
| $10,000 to $14,999 | 14 | 8.9% |
| $15,000 to $24,999 | 37 | 23.6% |
| $25,000 to $34,999 | 24 | 15.3% |
| $35,000 to $49,999 | 32 | 20.4% |
| $50,000 to $74,999 | 13 | 8.3% |
| $75,000 to $99,999 | 5 | 3.2% |
| $100,000 to $149,999 | 0 | 0.0% |
| $150,000 to $199,999 | 12 | 7.6% |
| $200,000+ | 17 | 10.8% |
Family Income by Famaliy Size in White Mills
2-person families (64 | 40.8%) account for the highest median family income in White Mills with $41,786 per family, while 2-person families (64 | 40.8%) have the highest median income of $20,893 per family member.
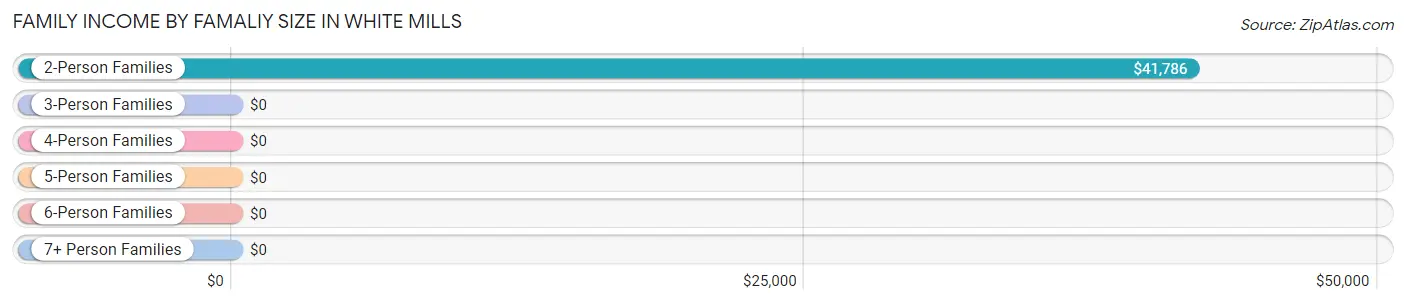
| Income Bracket | # Families | Median Income |
| 2-Person Families | 64 (40.8%) | $41,786 |
| 3-Person Families | 51 (32.5%) | $0 |
| 4-Person Families | 32 (20.4%) | $0 |
| 5-Person Families | 0 (0.0%) | $0 |
| 6-Person Families | 10 (6.4%) | $0 |
| 7+ Person Families | 0 (0.0%) | $0 |
| Total | 157 (100.0%) | $37,679 |
Family Income by Number of Earners in White Mills
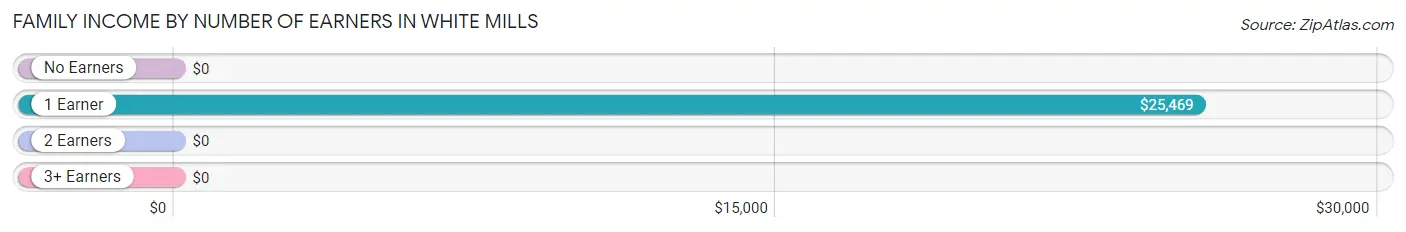
| Number of Earners | # Families | Median Income |
| No Earners | 42 (26.8%) | $0 |
| 1 Earner | 80 (51.0%) | $25,469 |
| 2 Earners | 12 (7.6%) | $0 |
| 3+ Earners | 23 (14.6%) | $0 |
| Total | 157 (100.0%) | $37,679 |
Household Income in White Mills
Household Income Brackets in White Mills
With 79 households falling in the category, the $35,000 to $49,999 income range is the most frequent in White Mills, accounting for 22.4% of all households.
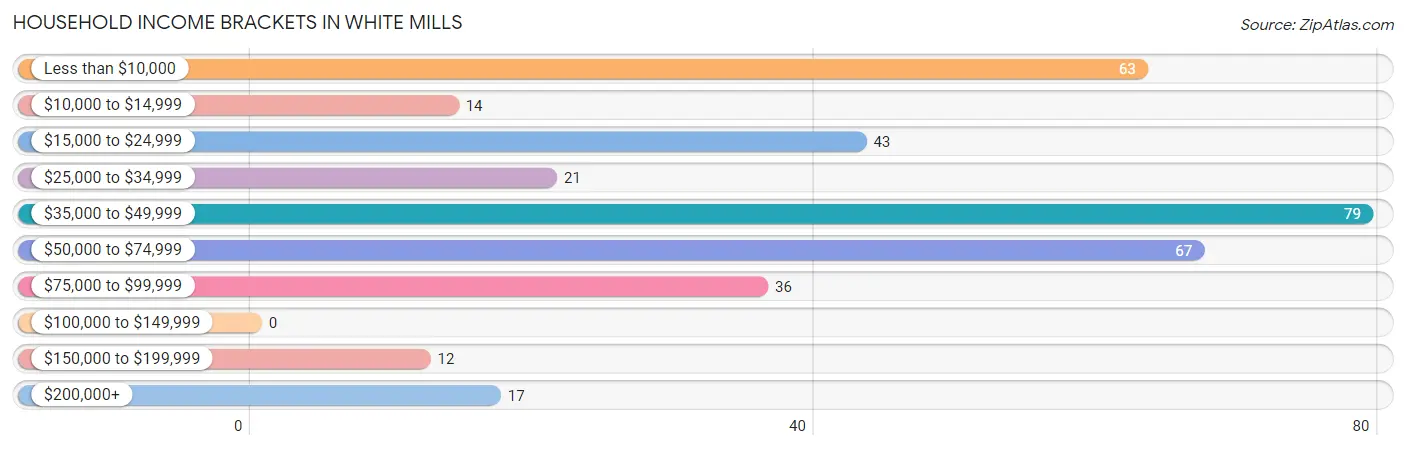
| Income Bracket | # Households | % Households |
| Less than $10,000 | 63 | 17.9% |
| $10,000 to $14,999 | 14 | 4.0% |
| $15,000 to $24,999 | 43 | 12.2% |
| $25,000 to $34,999 | 21 | 6.0% |
| $35,000 to $49,999 | 79 | 22.4% |
| $50,000 to $74,999 | 67 | 19.0% |
| $75,000 to $99,999 | 36 | 10.2% |
| $100,000 to $149,999 | 0 | 0.0% |
| $150,000 to $199,999 | 12 | 3.4% |
| $200,000+ | 17 | 4.8% |
Household Income by Householder Age in White Mills
The median household income in White Mills is $43,707, with the highest median household income of $49,784 found in the 45 to 64 years age bracket for the primary householder. A total of 143 households (40.6%) fall into this category.
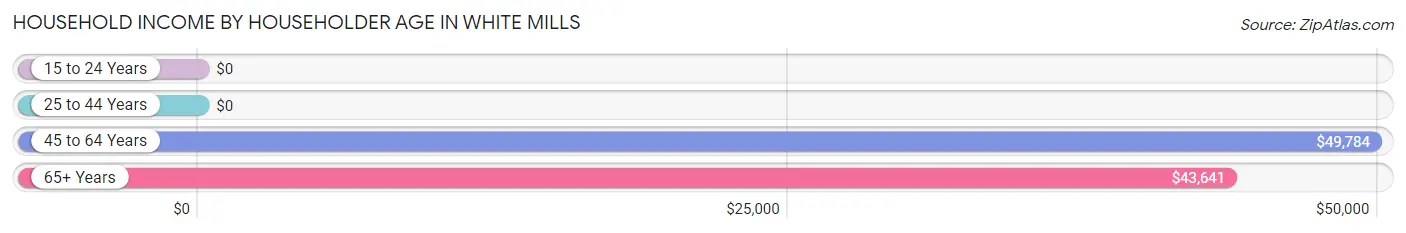
| Income Bracket | # Households | Median Income |
| 15 to 24 Years | 0 (0.0%) | $0 |
| 25 to 44 Years | 90 (25.6%) | $0 |
| 45 to 64 Years | 143 (40.6%) | $49,784 |
| 65+ Years | 119 (33.8%) | $43,641 |
| Total | 352 (100.0%) | $43,707 |
Poverty in White Mills
Income Below Poverty by Sex and Age in White Mills
With 22.9% poverty level for males and 41.2% for females among the residents of White Mills, 6 to 11 year old males and under 5 year old females are the most vulnerable to poverty, with 29 males (100.0%) and 3 females (100.0%) in their respective age groups living below the poverty level.
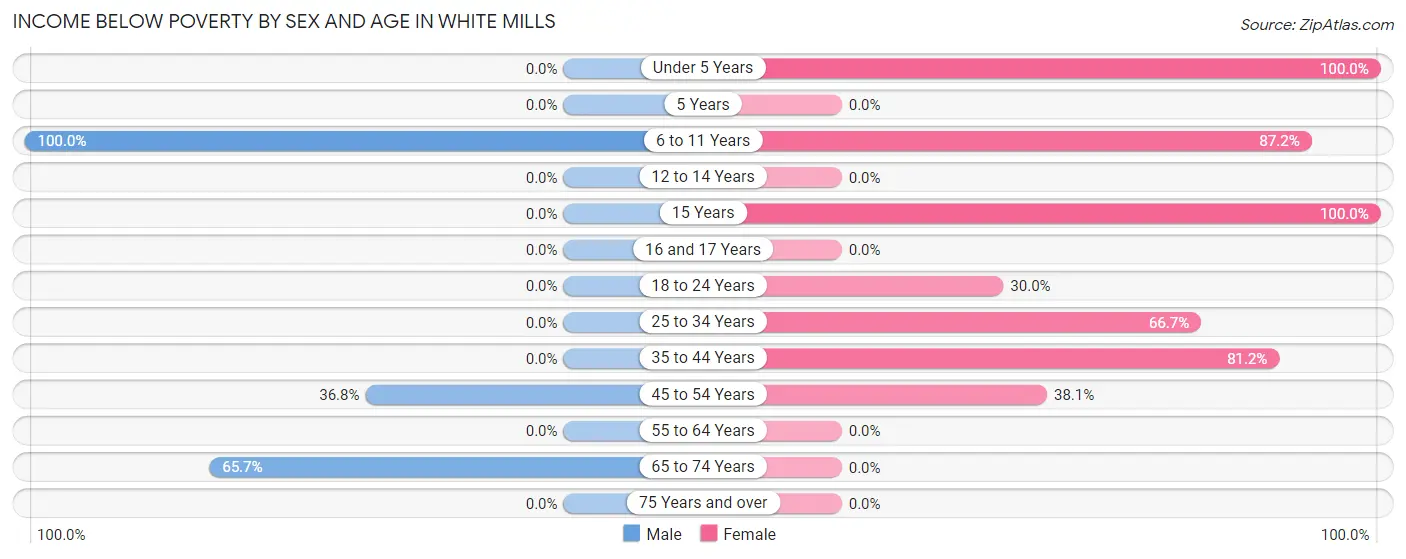
| Age Bracket | Male | Female |
| Under 5 Years | 0 (0.0%) | 3 (100.0%) |
| 5 Years | 0 (0.0%) | 0 (0.0%) |
| 6 to 11 Years | 29 (100.0%) | 34 (87.2%) |
| 12 to 14 Years | 0 (0.0%) | 0 (0.0%) |
| 15 Years | 0 (0.0%) | 4 (100.0%) |
| 16 and 17 Years | 0 (0.0%) | 0 (0.0%) |
| 18 to 24 Years | 0 (0.0%) | 27 (30.0%) |
| 25 to 34 Years | 0 (0.0%) | 24 (66.7%) |
| 35 to 44 Years | 0 (0.0%) | 69 (81.2%) |
| 45 to 54 Years | 25 (36.8%) | 8 (38.1%) |
| 55 to 64 Years | 0 (0.0%) | 0 (0.0%) |
| 65 to 74 Years | 23 (65.7%) | 0 (0.0%) |
| 75 Years and over | 0 (0.0%) | 0 (0.0%) |
| Total | 77 (22.9%) | 169 (41.2%) |
Income Above Poverty by Sex and Age in White Mills
According to the poverty statistics in White Mills, males aged under 5 years and females aged 55 to 64 years are the age groups that are most secure financially, with 100.0% of males and 100.0% of females in these age groups living above the poverty line.
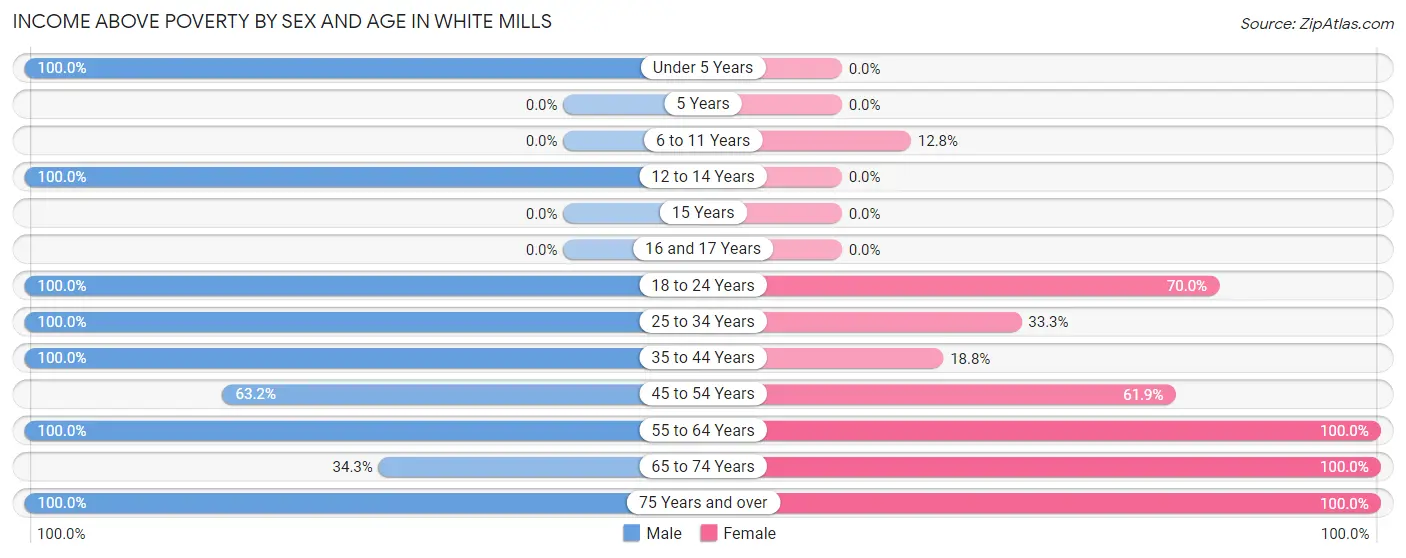
| Age Bracket | Male | Female |
| Under 5 Years | 8 (100.0%) | 0 (0.0%) |
| 5 Years | 0 (0.0%) | 0 (0.0%) |
| 6 to 11 Years | 0 (0.0%) | 5 (12.8%) |
| 12 to 14 Years | 11 (100.0%) | 0 (0.0%) |
| 15 Years | 0 (0.0%) | 0 (0.0%) |
| 16 and 17 Years | 0 (0.0%) | 0 (0.0%) |
| 18 to 24 Years | 20 (100.0%) | 63 (70.0%) |
| 25 to 34 Years | 32 (100.0%) | 12 (33.3%) |
| 35 to 44 Years | 22 (100.0%) | 16 (18.8%) |
| 45 to 54 Years | 43 (63.2%) | 13 (61.9%) |
| 55 to 64 Years | 89 (100.0%) | 48 (100.0%) |
| 65 to 74 Years | 12 (34.3%) | 64 (100.0%) |
| 75 Years and over | 22 (100.0%) | 20 (100.0%) |
| Total | 259 (77.1%) | 241 (58.8%) |
Income Below Poverty Among Married-Couple Families in White Mills
The poverty statistics for married-couple families in White Mills show that 28.7% or 25 of the total 87 families live below the poverty line. Families with no children have the highest poverty rate of 28.7%, comprising of 25 families. On the other hand, families with no children have the lowest poverty rate of 28.7%, which includes 25 families.
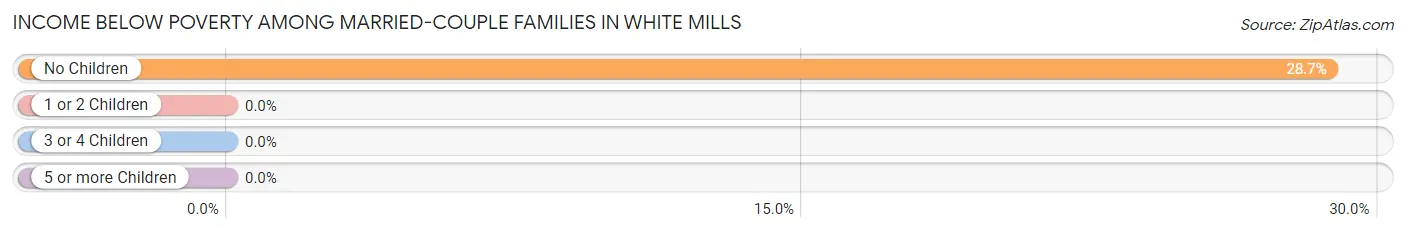
| Children | Above Poverty | Below Poverty |
| No Children | 62 (71.3%) | 25 (28.7%) |
| 1 or 2 Children | 0 (0.0%) | 0 (0.0%) |
| 3 or 4 Children | 0 (0.0%) | 0 (0.0%) |
| 5 or more Children | 0 (0.0%) | 0 (0.0%) |
| Total | 62 (71.3%) | 25 (28.7%) |
Income Below Poverty Among Single-Parent Households in White Mills
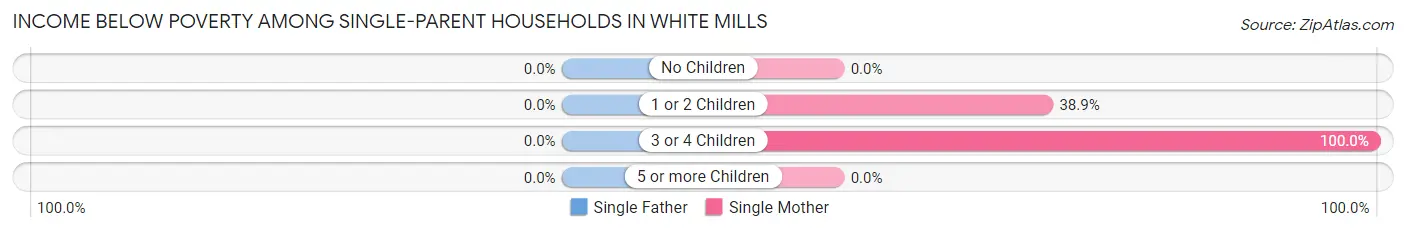
| Children | Single Father | Single Mother |
| No Children | 0 (0.0%) | 0 (0.0%) |
| 1 or 2 Children | 0 (0.0%) | 14 (38.9%) |
| 3 or 4 Children | 0 (0.0%) | 19 (100.0%) |
| 5 or more Children | 0 (0.0%) | 0 (0.0%) |
| Total | 0 (0.0%) | 33 (53.2%) |
Income Below Poverty Among Married-Couple vs Single-Parent Households in White Mills
The poverty data for White Mills shows that 25 of the married-couple family households (28.7%) and 33 of the single-parent households (47.1%) are living below the poverty level. Within the married-couple family households, those with no children have the highest poverty rate, with 25 households (28.7%) falling below the poverty line. Among the single-parent households, those with 3 or 4 children have the highest poverty rate, with 19 household (100.0%) living below poverty.
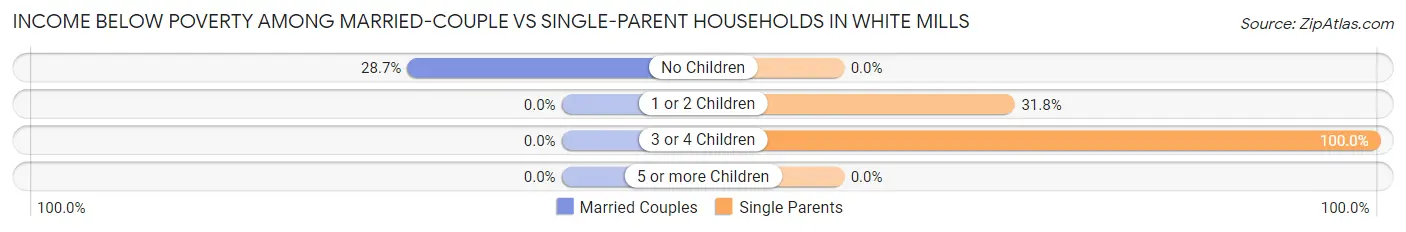
| Children | Married-Couple Families | Single-Parent Households |
| No Children | 25 (28.7%) | 0 (0.0%) |
| 1 or 2 Children | 0 (0.0%) | 14 (31.8%) |
| 3 or 4 Children | 0 (0.0%) | 19 (100.0%) |
| 5 or more Children | 0 (0.0%) | 0 (0.0%) |
| Total | 25 (28.7%) | 33 (47.1%) |
Race in White Mills
The most populous races in White Mills are White / Caucasian (625 | 83.8%), Two or more Races (121 | 16.2%), and Hispanic or Latino (87 | 11.7%).
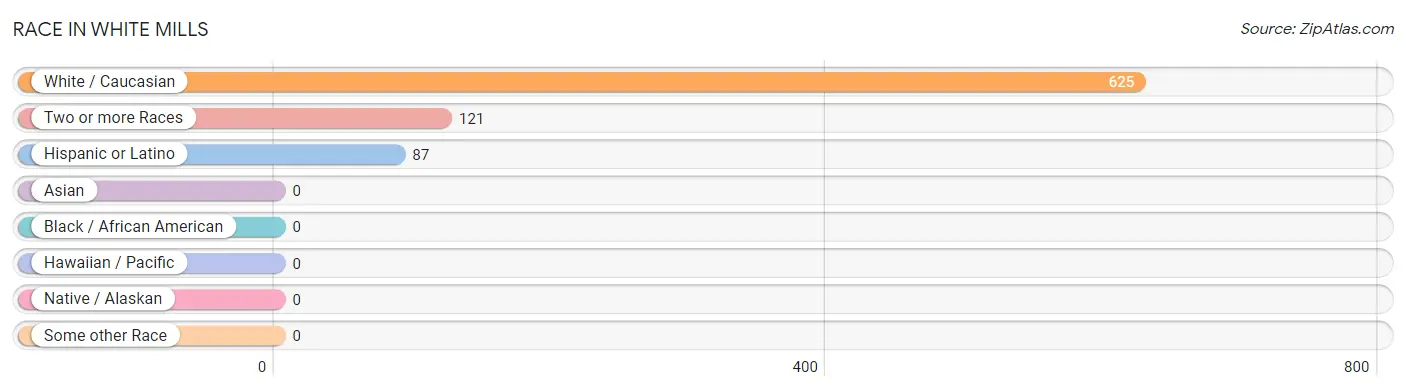
| Race | # Population | % Population |
| Asian | 0 | 0.0% |
| Black / African American | 0 | 0.0% |
| Hawaiian / Pacific | 0 | 0.0% |
| Hispanic or Latino | 87 | 11.7% |
| Native / Alaskan | 0 | 0.0% |
| White / Caucasian | 625 | 83.8% |
| Two or more Races | 121 | 16.2% |
| Some other Race | 0 | 0.0% |
| Total | 746 | 100.0% |
Ancestry in White Mills
The most populous ancestries reported in White Mills are German (153 | 20.5%), Irish (134 | 18.0%), Italian (128 | 17.2%), Polish (50 | 6.7%), and English (44 | 5.9%), together accounting for 68.2% of all White Mills residents.
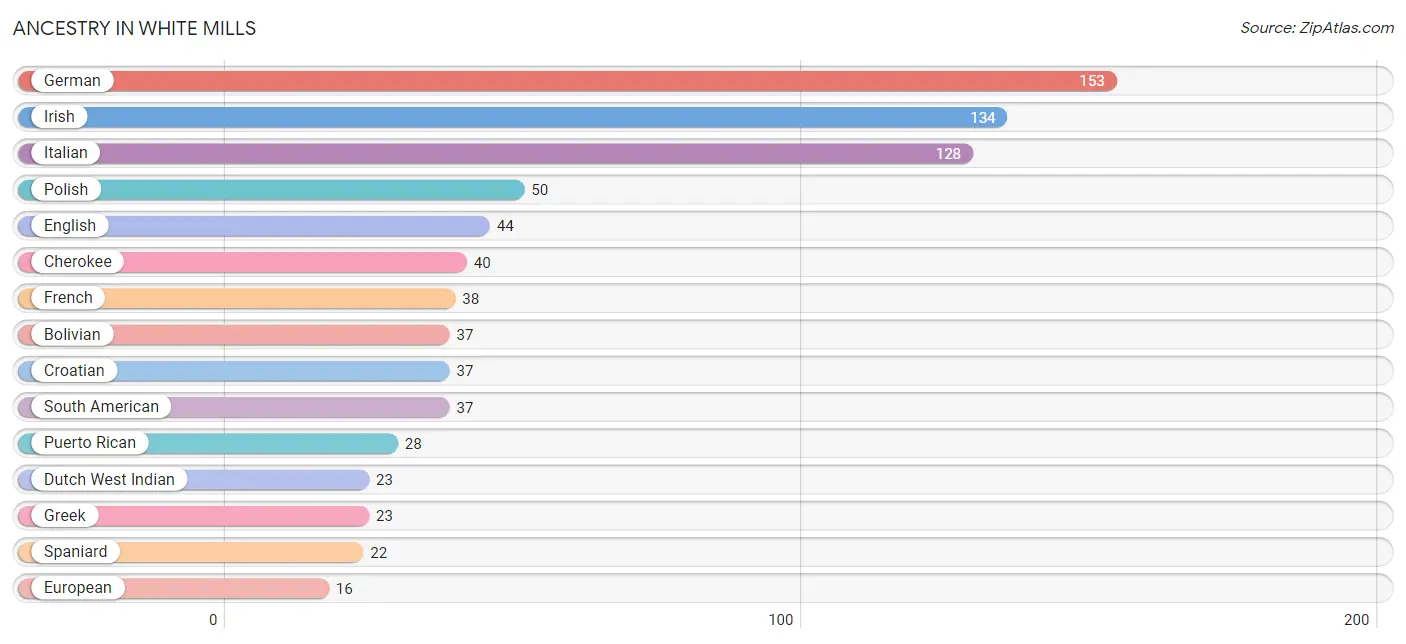
| Ancestry | # Population | % Population |
| American | 8 | 1.1% |
| Blackfeet | 7 | 0.9% |
| Bolivian | 37 | 5.0% |
| Cherokee | 40 | 5.4% |
| Croatian | 37 | 5.0% |
| Dutch | 8 | 1.1% |
| Dutch West Indian | 23 | 3.1% |
| English | 44 | 5.9% |
| European | 16 | 2.1% |
| Finnish | 7 | 0.9% |
| French | 38 | 5.1% |
| French American Indian | 3 | 0.4% |
| German | 153 | 20.5% |
| Greek | 23 | 3.1% |
| Hungarian | 5 | 0.7% |
| Icelander | 11 | 1.5% |
| Irish | 134 | 18.0% |
| Italian | 128 | 17.2% |
| Polish | 50 | 6.7% |
| Puerto Rican | 28 | 3.7% |
| Russian | 5 | 0.7% |
| South American | 37 | 5.0% |
| Spaniard | 22 | 2.9% | View All 23 Rows |
Immigrants in White Mills
The most numerous immigrant groups reported in White Mills came from Europe (49 | 6.6%), Bolivia (37 | 5.0%), Latin America (37 | 5.0%), South America (37 | 5.0%), and Western Europe (36 | 4.8%), together accounting for 26.3% of all White Mills residents.
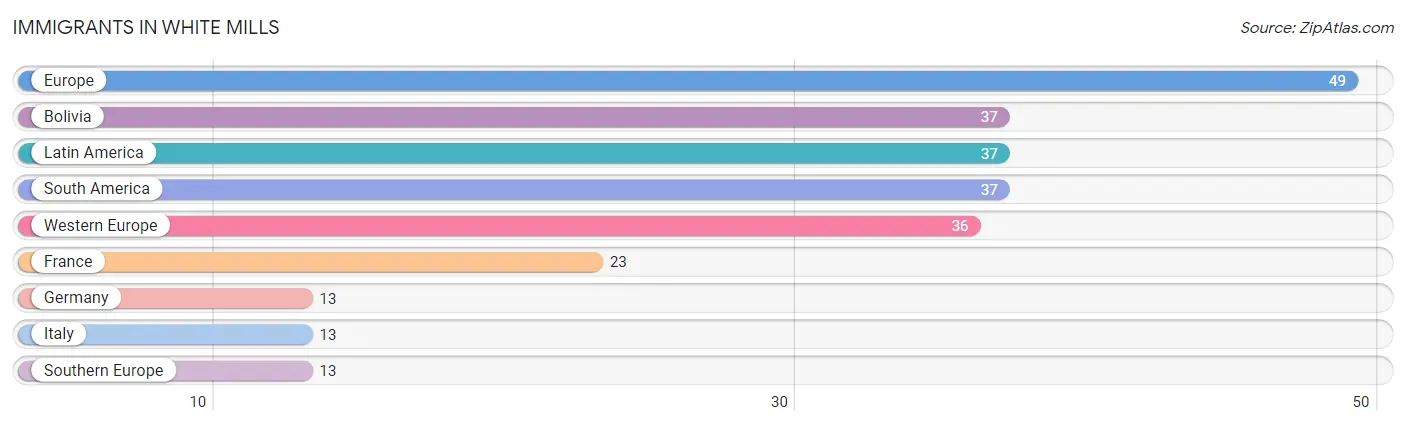
| Immigration Origin | # Population | % Population |
| Bolivia | 37 | 5.0% |
| Europe | 49 | 6.6% |
| France | 23 | 3.1% |
| Germany | 13 | 1.7% |
| Italy | 13 | 1.7% |
| Latin America | 37 | 5.0% |
| South America | 37 | 5.0% |
| Southern Europe | 13 | 1.7% |
| Western Europe | 36 | 4.8% | View All 9 Rows |
Sex and Age in White Mills
Sex and Age in White Mills
The most populous age groups in White Mills are 55 to 59 Years (60 | 17.9%) for men and 20 to 24 Years (82 | 20.0%) for women.
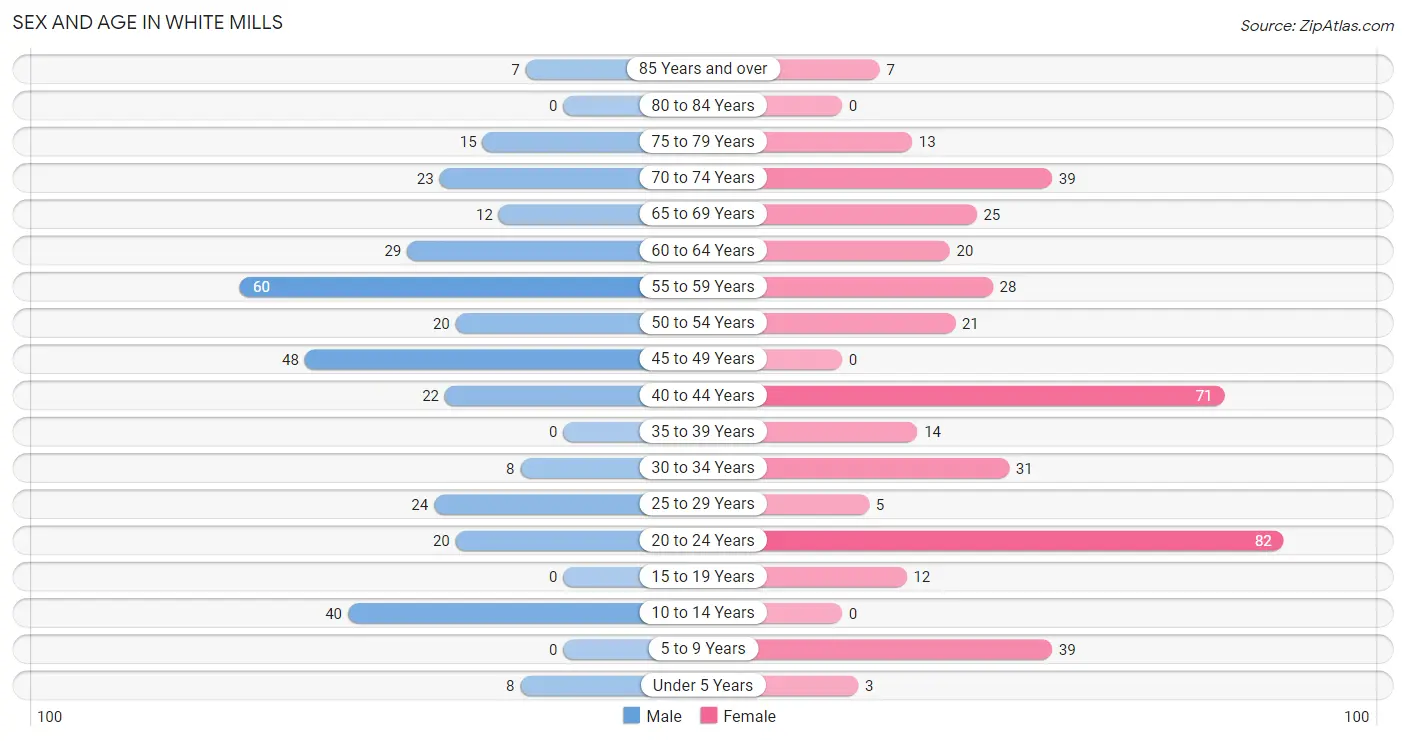
| Age Bracket | Male | Female |
| Under 5 Years | 8 (2.4%) | 3 (0.7%) |
| 5 to 9 Years | 0 (0.0%) | 39 (9.5%) |
| 10 to 14 Years | 40 (11.9%) | 0 (0.0%) |
| 15 to 19 Years | 0 (0.0%) | 12 (2.9%) |
| 20 to 24 Years | 20 (5.9%) | 82 (20.0%) |
| 25 to 29 Years | 24 (7.1%) | 5 (1.2%) |
| 30 to 34 Years | 8 (2.4%) | 31 (7.6%) |
| 35 to 39 Years | 0 (0.0%) | 14 (3.4%) |
| 40 to 44 Years | 22 (6.6%) | 71 (17.3%) |
| 45 to 49 Years | 48 (14.3%) | 0 (0.0%) |
| 50 to 54 Years | 20 (5.9%) | 21 (5.1%) |
| 55 to 59 Years | 60 (17.9%) | 28 (6.8%) |
| 60 to 64 Years | 29 (8.6%) | 20 (4.9%) |
| 65 to 69 Years | 12 (3.6%) | 25 (6.1%) |
| 70 to 74 Years | 23 (6.9%) | 39 (9.5%) |
| 75 to 79 Years | 15 (4.5%) | 13 (3.2%) |
| 80 to 84 Years | 0 (0.0%) | 0 (0.0%) |
| 85 Years and over | 7 (2.1%) | 7 (1.7%) |
| Total | 336 (100.0%) | 410 (100.0%) |
Families and Households in White Mills
Median Family Size in White Mills
The median family size in White Mills is 3.04 persons per family, with single female/mother families (62 | 39.5%) accounting for the largest median family size of 3.63 persons per family. On the other hand, single male/father families (8 | 5.1%) represent the smallest median family size with 1.63 persons per family.
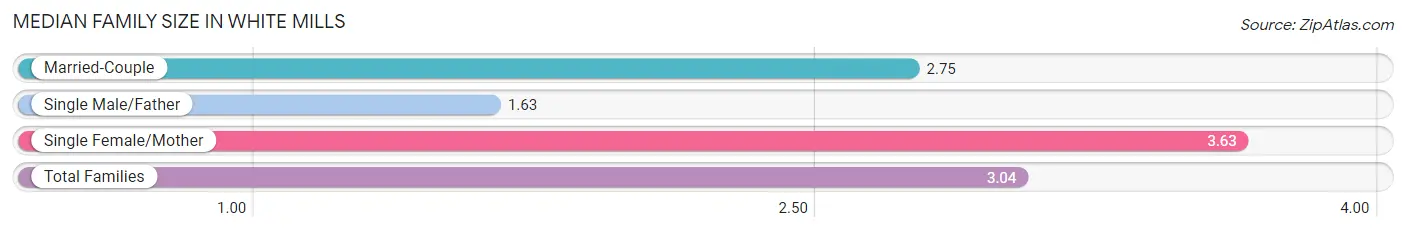
| Family Type | # Families | Family Size |
| Married-Couple | 87 (55.4%) | 2.75 |
| Single Male/Father | 8 (5.1%) | 1.63 |
| Single Female/Mother | 62 (39.5%) | 3.63 |
| Total Families | 157 (100.0%) | 3.04 |
Median Household Size in White Mills
The median household size in White Mills is 2.12 persons per household, with single female/mother households (62 | 17.6%) accounting for the largest median household size of 4.26 persons per household. non-family households (195 | 55.4%) represent the smallest median household size with 1.15 persons per household.
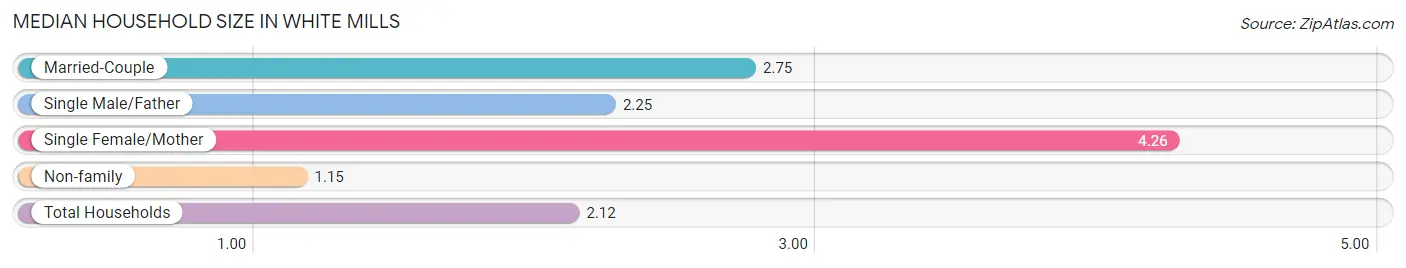
| Household Type | # Households | Household Size |
| Married-Couple | 87 (24.7%) | 2.75 |
| Single Male/Father | 8 (2.3%) | 2.25 |
| Single Female/Mother | 62 (17.6%) | 4.26 |
| Non-family | 195 (55.4%) | 1.15 |
| Total Households | 352 (100.0%) | 2.12 |
Household Size by Marriage Status in White Mills
Out of a total of 352 households in White Mills, 157 (44.6%) are family households, while 195 (55.4%) are nonfamily households. The most numerous type of family households are 3-person households, comprising 59, and the most common type of nonfamily households are 1-person households, comprising 164.
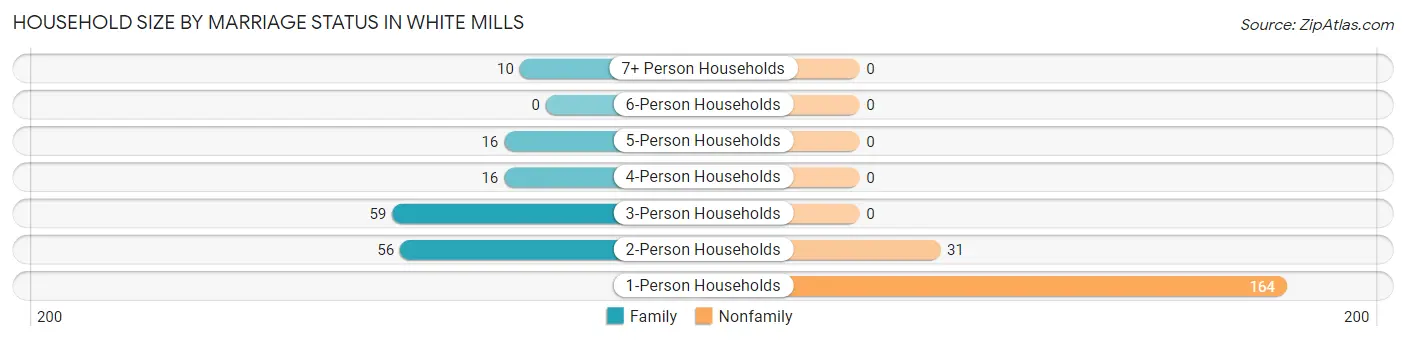
| Household Size | Family Households | Nonfamily Households |
| 1-Person Households | - | 164 (46.6%) |
| 2-Person Households | 56 (15.9%) | 31 (8.8%) |
| 3-Person Households | 59 (16.8%) | 0 (0.0%) |
| 4-Person Households | 16 (4.5%) | 0 (0.0%) |
| 5-Person Households | 16 (4.5%) | 0 (0.0%) |
| 6-Person Households | 0 (0.0%) | 0 (0.0%) |
| 7+ Person Households | 10 (2.8%) | 0 (0.0%) |
| Total | 157 (44.6%) | 195 (55.4%) |
Female Fertility in White Mills
Fertility by Age in White Mills
Average fertility rate in White Mills is 14.0 births per 1,000 women. Women in the age bracket of 20 to 34 years have the highest fertility rate with 25.0 births per 1,000 women. Women in the age bracket of 20 to 34 years acount for 100.0% of all women with births.
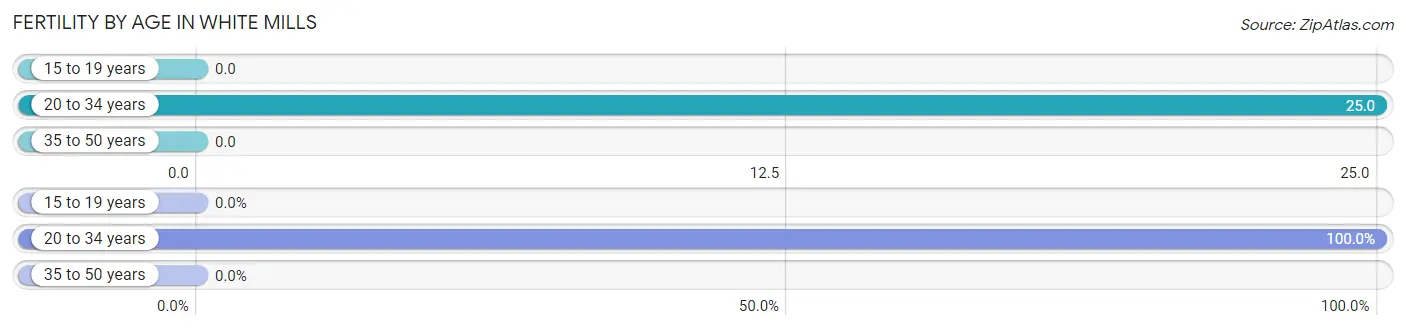
| Age Bracket | Women with Births | Births / 1,000 Women |
| 15 to 19 years | 0 (0.0%) | 0.0 |
| 20 to 34 years | 3 (100.0%) | 25.0 |
| 35 to 50 years | 0 (0.0%) | 0.0 |
| Total | 3 (100.0%) | 14.0 |
Fertility by Age by Marriage Status in White Mills
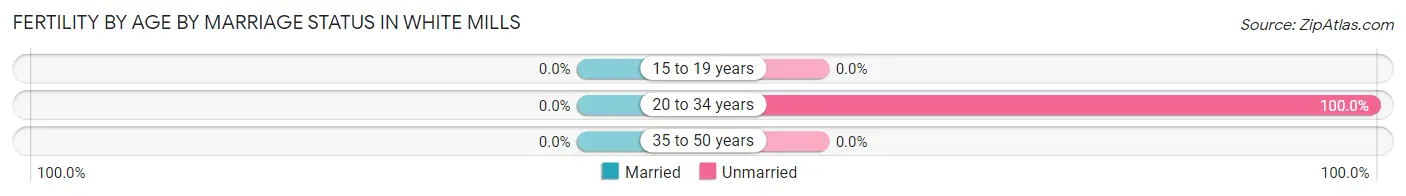
| Age Bracket | Married | Unmarried |
| 15 to 19 years | 0 (0.0%) | 0 (0.0%) |
| 20 to 34 years | 0 (0.0%) | 3 (100.0%) |
| 35 to 50 years | 0 (0.0%) | 0 (0.0%) |
| Total | 0 (0.0%) | 3 (100.0%) |
Fertility by Education in White Mills
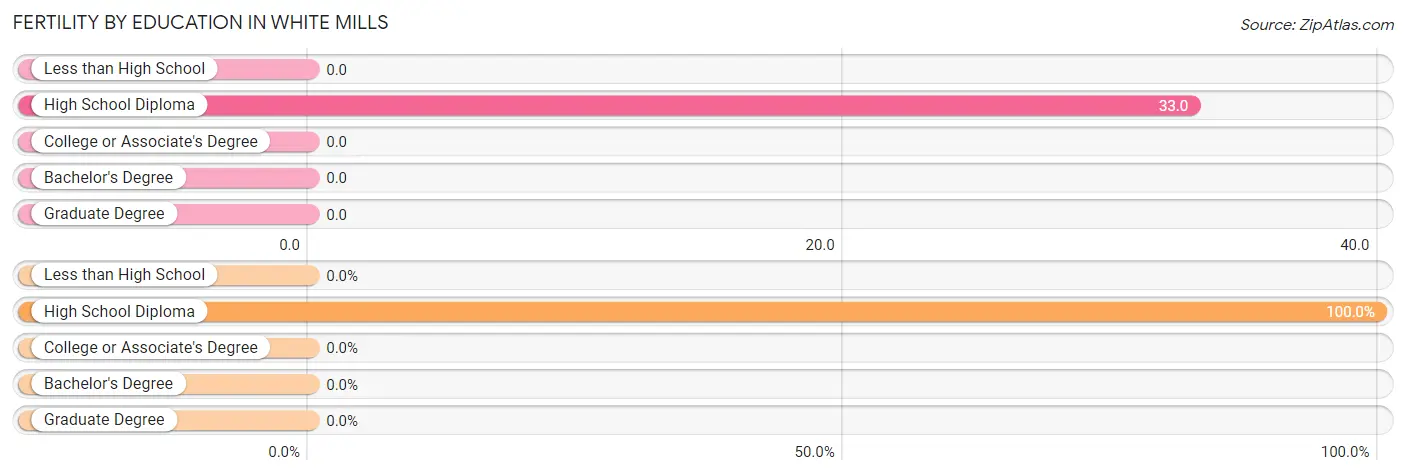
| Educational Attainment | Women with Births | Births / 1,000 Women |
| Less than High School | 0 (0.0%) | 0.0 |
| High School Diploma | 3 (100.0%) | 33.0 |
| College or Associate's Degree | 0 (0.0%) | 0.0 |
| Bachelor's Degree | 0 (0.0%) | 0.0 |
| Graduate Degree | 0 (0.0%) | 0.0 |
| Total | 3 (100.0%) | 14.0 |
Fertility by Education by Marriage Status in White Mills
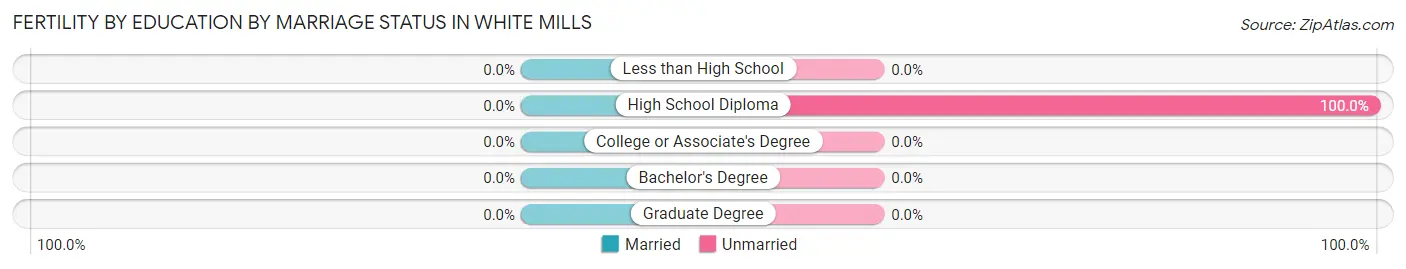
| Educational Attainment | Married | Unmarried |
| Less than High School | 0 (0.0%) | 0 (0.0%) |
| High School Diploma | 0 (0.0%) | 3 (100.0%) |
| College or Associate's Degree | 0 (0.0%) | 0 (0.0%) |
| Bachelor's Degree | 0 (0.0%) | 0 (0.0%) |
| Graduate Degree | 0 (0.0%) | 0 (0.0%) |
| Total | 0 (0.0%) | 3 (100.0%) |
Employment Characteristics in White Mills
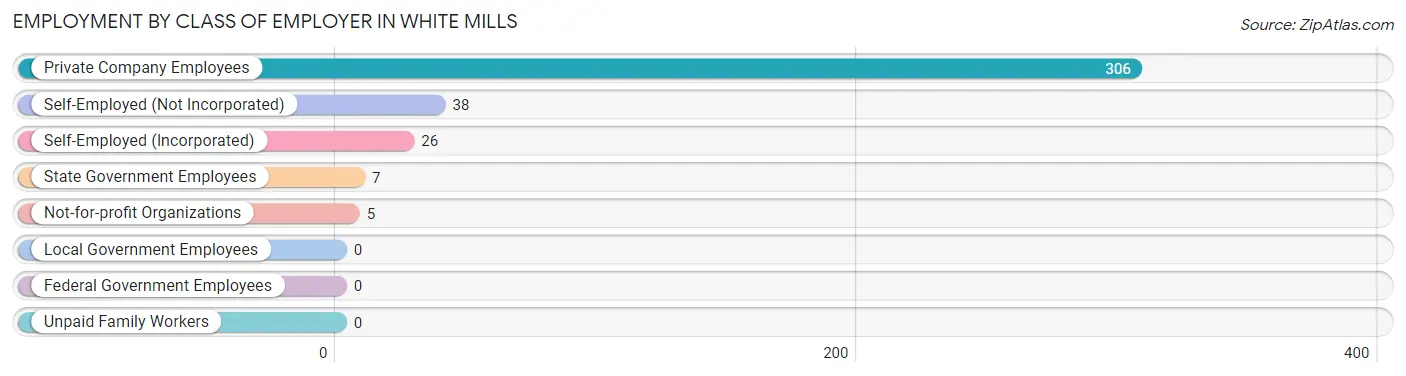
Employment by Class of Employer in White Mills
Among the 382 employed individuals in White Mills, private company employees (306 | 80.1%), self-employed (not incorporated) (38 | 10.0%), and self-employed (incorporated) (26 | 6.8%) make up the most common classes of employment.
| Employer Class | # Employees | % Employees |
| Private Company Employees | 306 | 80.1% |
| Self-Employed (Incorporated) | 26 | 6.8% |
| Self-Employed (Not Incorporated) | 38 | 10.0% |
| Not-for-profit Organizations | 5 | 1.3% |
| Local Government Employees | 0 | 0.0% |
| State Government Employees | 7 | 1.8% |
| Federal Government Employees | 0 | 0.0% |
| Unpaid Family Workers | 0 | 0.0% |
| Total | 382 | 100.0% |
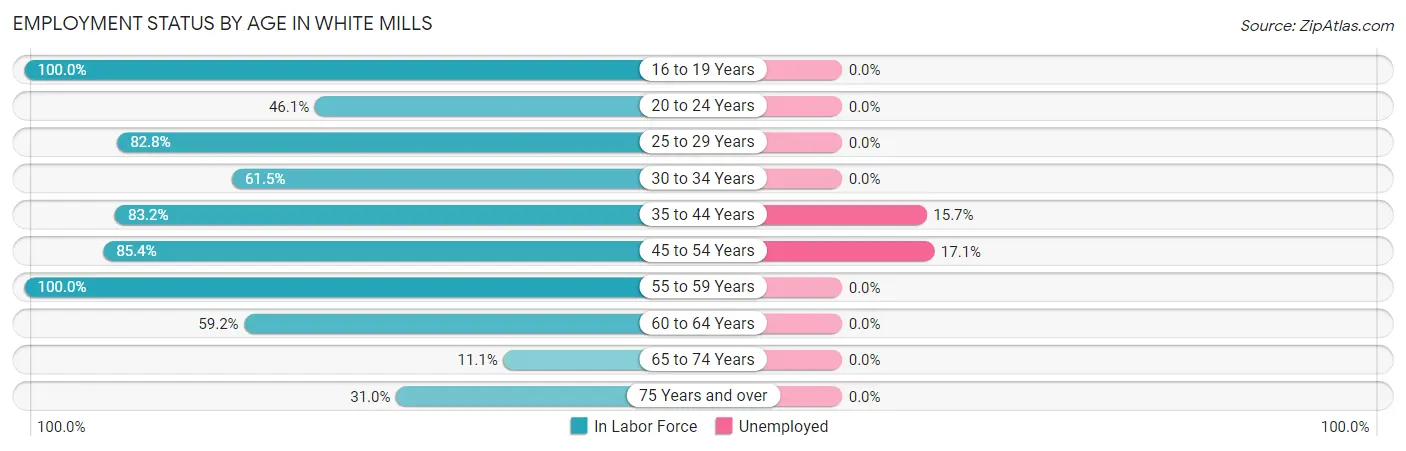
Employment Status by Age in White Mills
According to the labor force statistics for White Mills, out of the total population over 16 years of age (652), 62.7% or 409 individuals are in the labor force, with 6.6% or 27 of them unemployed. The age group with the highest labor force participation rate is 16 to 19 years, with 100.0% or 8 individuals in the labor force. Within the labor force, the 45 to 54 years age range has the highest percentage of unemployed individuals, with 17.1% or 13 of them being unemployed.
| Age Bracket | In Labor Force | Unemployed |
| 16 to 19 Years | 8 (100.0%) | 0 (0.0%) |
| 20 to 24 Years | 47 (46.1%) | 0 (0.0%) |
| 25 to 29 Years | 24 (82.8%) | 0 (0.0%) |
| 30 to 34 Years | 24 (61.5%) | 0 (0.0%) |
| 35 to 44 Years | 89 (83.2%) | 14 (15.7%) |
| 45 to 54 Years | 76 (85.4%) | 13 (17.1%) |
| 55 to 59 Years | 88 (100.0%) | 0 (0.0%) |
| 60 to 64 Years | 29 (59.2%) | 0 (0.0%) |
| 65 to 74 Years | 11 (11.1%) | 0 (0.0%) |
| 75 Years and over | 13 (31.0%) | 0 (0.0%) |
| Total | 409 (62.7%) | 27 (6.6%) |
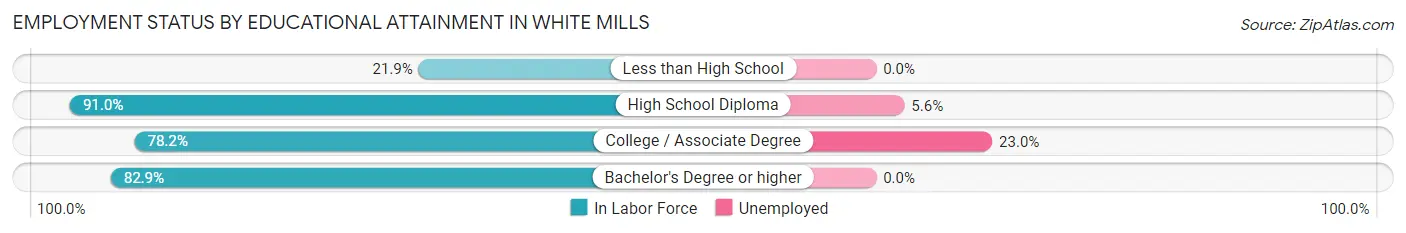
Employment Status by Educational Attainment in White Mills
According to labor force statistics for White Mills, 82.3% of individuals (330) out of the total population between 25 and 64 years of age (401) are in the labor force, with 8.2% or 27 of them being unemployed. The group with the highest labor force participation rate are those with the educational attainment of high school diploma, with 91.0% or 233 individuals in the labor force. Within the labor force, individuals with college / associate degree education have the highest percentage of unemployment, with 23.0% or 14 of them being unemployed.
| Educational Attainment | In Labor Force | Unemployed |
| Less than High School | 7 (21.9%) | 0 (0.0%) |
| High School Diploma | 233 (91.0%) | 14 (5.6%) |
| College / Associate Degree | 61 (78.2%) | 18 (23.0%) |
| Bachelor's Degree or higher | 29 (82.9%) | 0 (0.0%) |
| Total | 330 (82.3%) | 33 (8.2%) |
Employment Occupations by Sex in White Mills
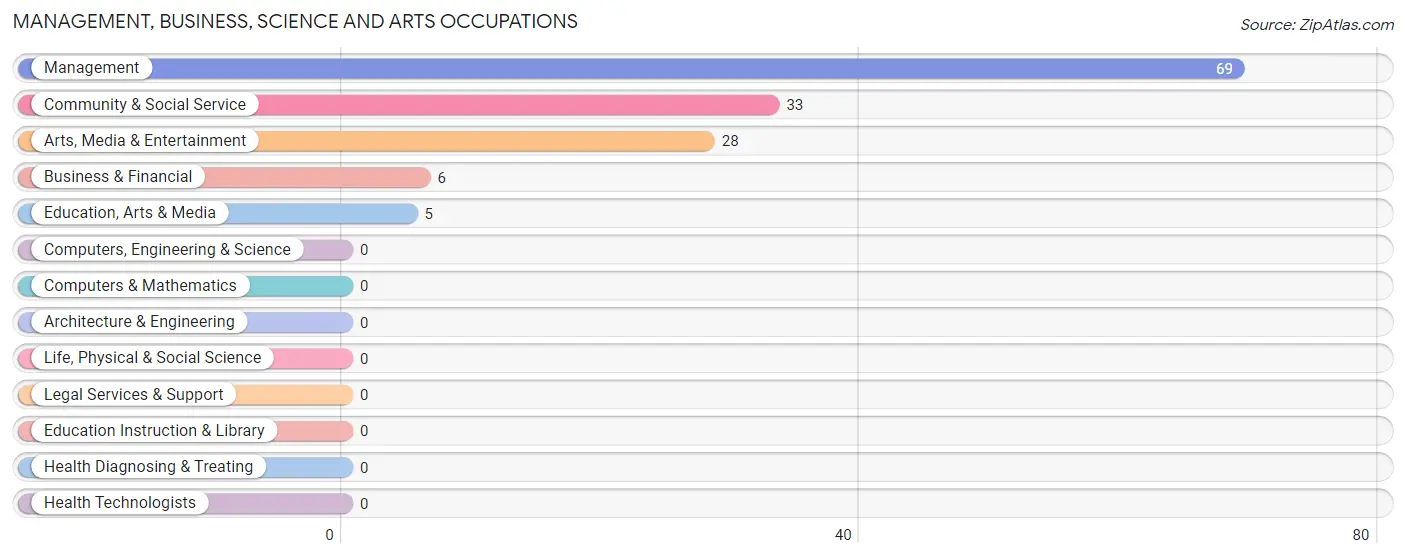
Management, Business, Science and Arts Occupations
The most common Management, Business, Science and Arts occupations in White Mills are Management (69 | 18.1%), Community & Social Service (33 | 8.6%), Arts, Media & Entertainment (28 | 7.3%), Business & Financial (6 | 1.6%), and Education, Arts & Media (5 | 1.3%).
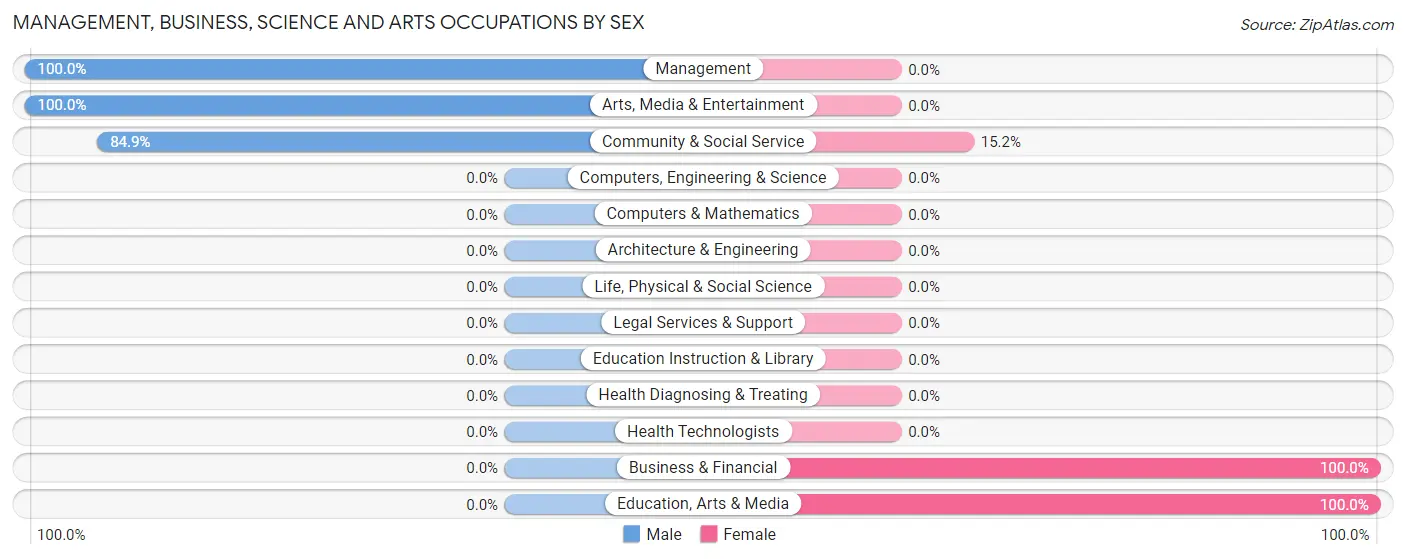
Management, Business, Science and Arts Occupations by Sex
Within the Management, Business, Science and Arts occupations in White Mills, the most male-oriented occupations are Management (100.0%), Arts, Media & Entertainment (100.0%), and Community & Social Service (84.9%), while the most female-oriented occupations are Business & Financial (100.0%), Education, Arts & Media (100.0%), and Community & Social Service (15.1%).
| Occupation | Male | Female |
| Management | 69 (100.0%) | 0 (0.0%) |
| Business & Financial | 0 (0.0%) | 6 (100.0%) |
| Computers, Engineering & Science | 0 (0.0%) | 0 (0.0%) |
| Computers & Mathematics | 0 (0.0%) | 0 (0.0%) |
| Architecture & Engineering | 0 (0.0%) | 0 (0.0%) |
| Life, Physical & Social Science | 0 (0.0%) | 0 (0.0%) |
| Community & Social Service | 28 (84.9%) | 5 (15.1%) |
| Education, Arts & Media | 0 (0.0%) | 5 (100.0%) |
| Legal Services & Support | 0 (0.0%) | 0 (0.0%) |
| Education Instruction & Library | 0 (0.0%) | 0 (0.0%) |
| Arts, Media & Entertainment | 28 (100.0%) | 0 (0.0%) |
| Health Diagnosing & Treating | 0 (0.0%) | 0 (0.0%) |
| Health Technologists | 0 (0.0%) | 0 (0.0%) |
| Total (Category) | 97 (89.8%) | 11 (10.2%) |
| Total (Overall) | 205 (53.7%) | 177 (46.3%) |
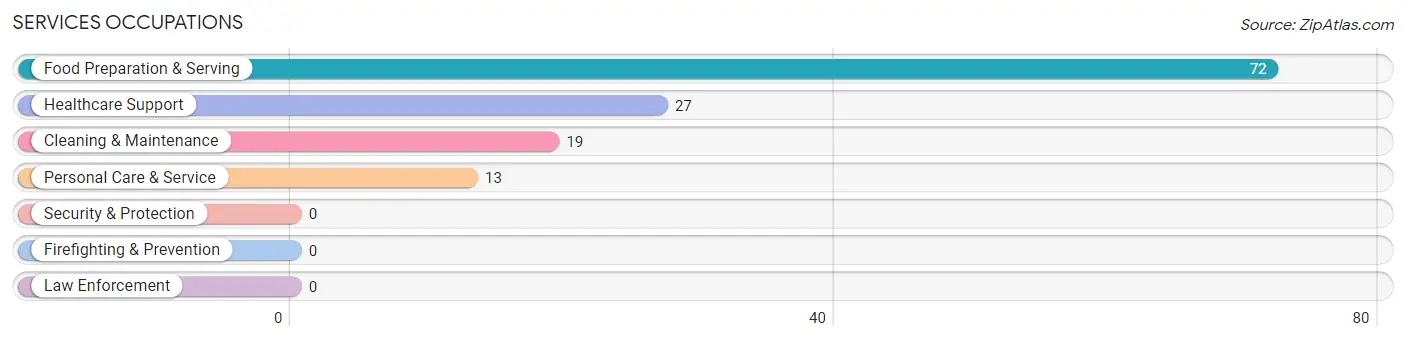
Services Occupations
The most common Services occupations in White Mills are Food Preparation & Serving (72 | 18.9%), Healthcare Support (27 | 7.1%), Cleaning & Maintenance (19 | 5.0%), and Personal Care & Service (13 | 3.4%).
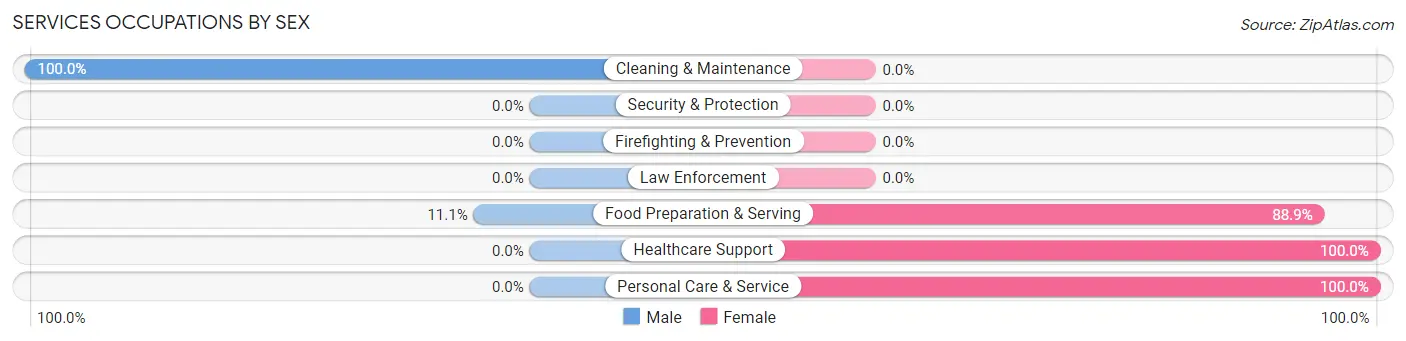
Services Occupations by Sex
Within the Services occupations in White Mills, the most male-oriented occupations are Cleaning & Maintenance (100.0%), and Food Preparation & Serving (11.1%), while the most female-oriented occupations are Healthcare Support (100.0%), Personal Care & Service (100.0%), and Food Preparation & Serving (88.9%).
| Occupation | Male | Female |
| Healthcare Support | 0 (0.0%) | 27 (100.0%) |
| Security & Protection | 0 (0.0%) | 0 (0.0%) |
| Firefighting & Prevention | 0 (0.0%) | 0 (0.0%) |
| Law Enforcement | 0 (0.0%) | 0 (0.0%) |
| Food Preparation & Serving | 8 (11.1%) | 64 (88.9%) |
| Cleaning & Maintenance | 19 (100.0%) | 0 (0.0%) |
| Personal Care & Service | 0 (0.0%) | 13 (100.0%) |
| Total (Category) | 27 (20.6%) | 104 (79.4%) |
| Total (Overall) | 205 (53.7%) | 177 (46.3%) |
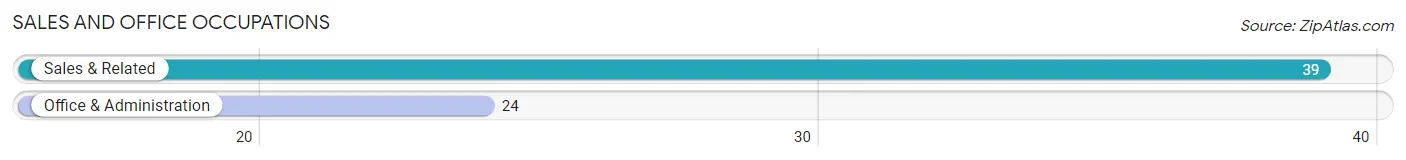
Sales and Office Occupations
The most common Sales and Office occupations in White Mills are Sales & Related (39 | 10.2%), and Office & Administration (24 | 6.3%).
Sales and Office Occupations by Sex
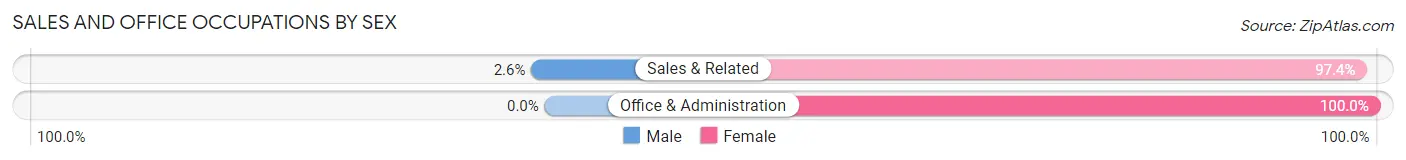
| Occupation | Male | Female |
| Sales & Related | 1 (2.6%) | 38 (97.4%) |
| Office & Administration | 0 (0.0%) | 24 (100.0%) |
| Total (Category) | 1 (1.6%) | 62 (98.4%) |
| Total (Overall) | 205 (53.7%) | 177 (46.3%) |
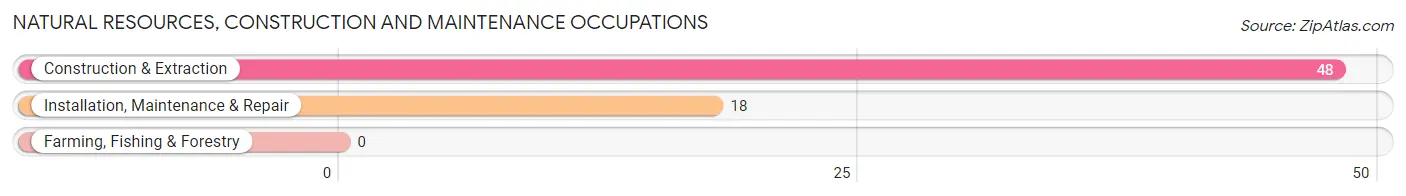
Natural Resources, Construction and Maintenance Occupations
The most common Natural Resources, Construction and Maintenance occupations in White Mills are Construction & Extraction (48 | 12.6%), and Installation, Maintenance & Repair (18 | 4.7%).
Natural Resources, Construction and Maintenance Occupations by Sex
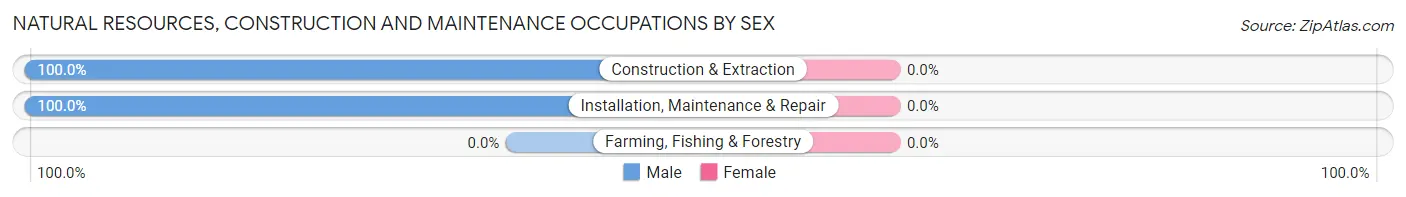
| Occupation | Male | Female |
| Farming, Fishing & Forestry | 0 (0.0%) | 0 (0.0%) |
| Construction & Extraction | 48 (100.0%) | 0 (0.0%) |
| Installation, Maintenance & Repair | 18 (100.0%) | 0 (0.0%) |
| Total (Category) | 66 (100.0%) | 0 (0.0%) |
| Total (Overall) | 205 (53.7%) | 177 (46.3%) |
Production, Transportation and Moving Occupations
The most common Production, Transportation and Moving occupations in White Mills are Transportation (7 | 1.8%), and Material Moving (7 | 1.8%).
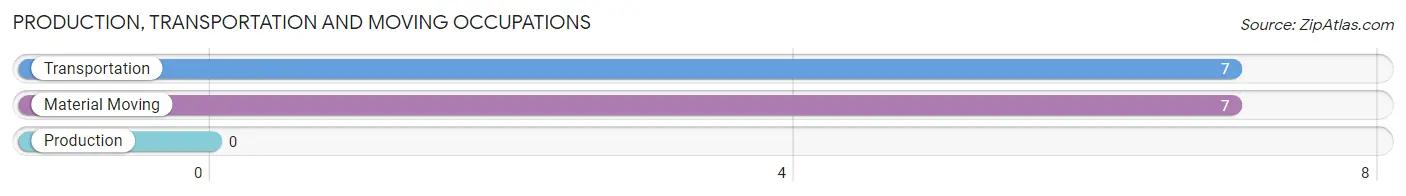
Production, Transportation and Moving Occupations by Sex
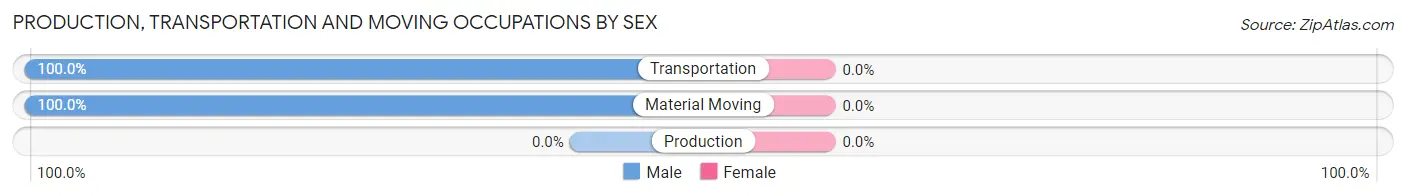
| Occupation | Male | Female |
| Production | 0 (0.0%) | 0 (0.0%) |
| Transportation | 7 (100.0%) | 0 (0.0%) |
| Material Moving | 7 (100.0%) | 0 (0.0%) |
| Total (Category) | 14 (100.0%) | 0 (0.0%) |
| Total (Overall) | 205 (53.7%) | 177 (46.3%) |
Employment Industries by Sex in White Mills
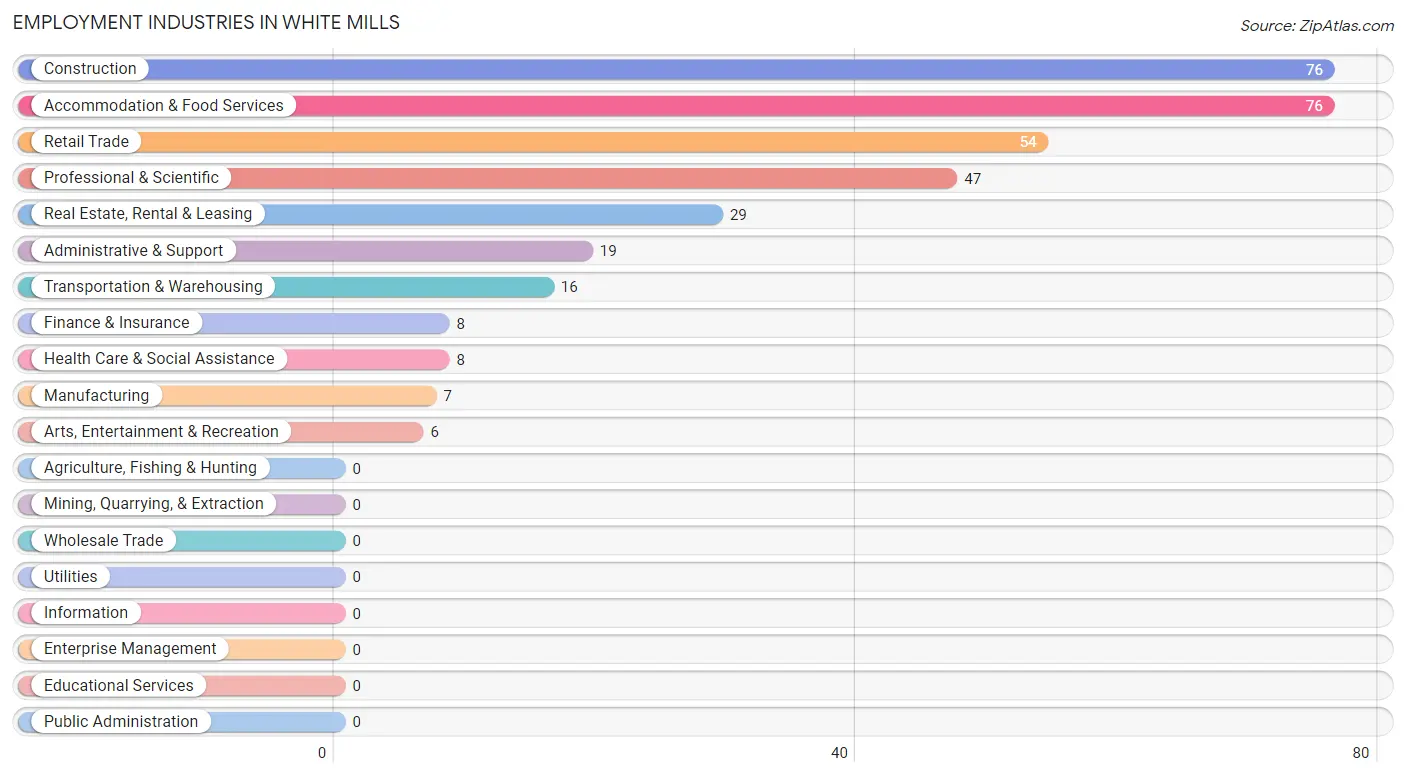
Employment Industries in White Mills
The major employment industries in White Mills include Construction (76 | 19.9%), Accommodation & Food Services (76 | 19.9%), Retail Trade (54 | 14.1%), Professional & Scientific (47 | 12.3%), and Real Estate, Rental & Leasing (29 | 7.6%).
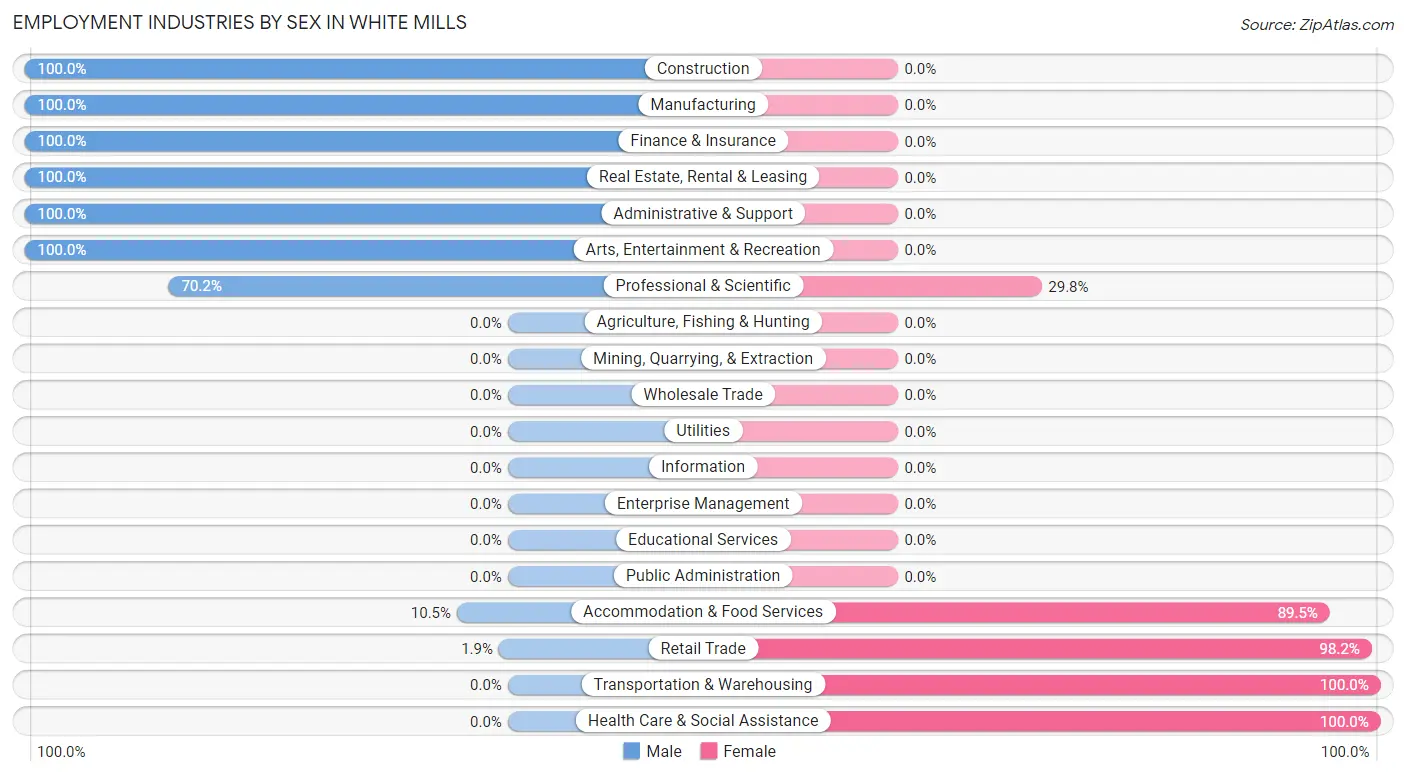
Employment Industries by Sex in White Mills
The White Mills industries that see more men than women are Construction (100.0%), Manufacturing (100.0%), and Finance & Insurance (100.0%), whereas the industries that tend to have a higher number of women are Transportation & Warehousing (100.0%), Health Care & Social Assistance (100.0%), and Retail Trade (98.2%).
| Industry | Male | Female |
| Agriculture, Fishing & Hunting | 0 (0.0%) | 0 (0.0%) |
| Mining, Quarrying, & Extraction | 0 (0.0%) | 0 (0.0%) |
| Construction | 76 (100.0%) | 0 (0.0%) |
| Manufacturing | 7 (100.0%) | 0 (0.0%) |
| Wholesale Trade | 0 (0.0%) | 0 (0.0%) |
| Retail Trade | 1 (1.8%) | 53 (98.2%) |
| Transportation & Warehousing | 0 (0.0%) | 16 (100.0%) |
| Utilities | 0 (0.0%) | 0 (0.0%) |
| Information | 0 (0.0%) | 0 (0.0%) |
| Finance & Insurance | 8 (100.0%) | 0 (0.0%) |
| Real Estate, Rental & Leasing | 29 (100.0%) | 0 (0.0%) |
| Professional & Scientific | 33 (70.2%) | 14 (29.8%) |
| Enterprise Management | 0 (0.0%) | 0 (0.0%) |
| Administrative & Support | 19 (100.0%) | 0 (0.0%) |
| Educational Services | 0 (0.0%) | 0 (0.0%) |
| Health Care & Social Assistance | 0 (0.0%) | 8 (100.0%) |
| Arts, Entertainment & Recreation | 6 (100.0%) | 0 (0.0%) |
| Accommodation & Food Services | 8 (10.5%) | 68 (89.5%) |
| Public Administration | 0 (0.0%) | 0 (0.0%) |
| Total | 205 (53.7%) | 177 (46.3%) |
Education in White Mills
School Enrollment in White Mills
The most common levels of schooling among the 141 students in White Mills are college / undergraduate (50 | 35.5%), elementary school (43 | 30.5%), and kindergarten (22 | 15.6%).
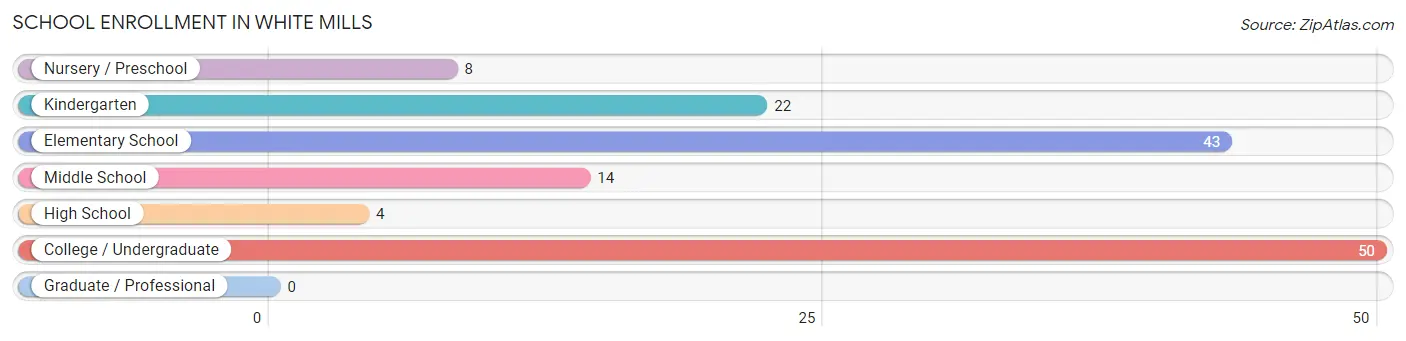
| School Level | # Students | % Students |
| Nursery / Preschool | 8 | 5.7% |
| Kindergarten | 22 | 15.6% |
| Elementary School | 43 | 30.5% |
| Middle School | 14 | 9.9% |
| High School | 4 | 2.8% |
| College / Undergraduate | 50 | 35.5% |
| Graduate / Professional | 0 | 0.0% |
| Total | 141 | 100.0% |
School Enrollment by Age by Funding Source in White Mills
Out of a total of 141 students who are enrolled in schools in White Mills, 63 (44.7%) attend a private institution, while the remaining 78 (55.3%) are enrolled in public schools. The age group of 3 to 4 year olds has the highest likelihood of being enrolled in private schools, with 8 (100.0% in the age bracket) enrolled. Conversely, the age group of 10 to 14 year olds has the lowest likelihood of being enrolled in a private school, with 40 (100.0% in the age bracket) attending a public institution.
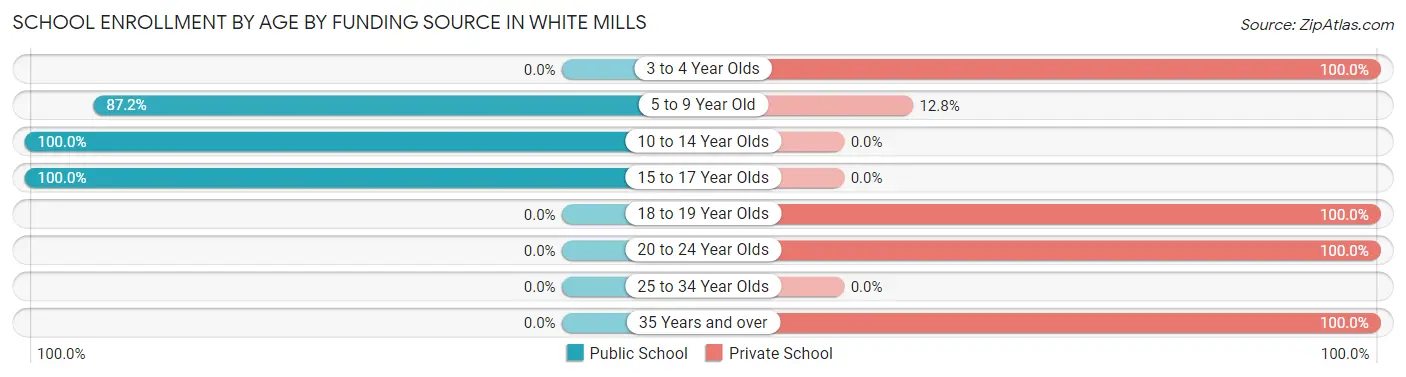
| Age Bracket | Public School | Private School |
| 3 to 4 Year Olds | 0 (0.0%) | 8 (100.0%) |
| 5 to 9 Year Old | 34 (87.2%) | 5 (12.8%) |
| 10 to 14 Year Olds | 40 (100.0%) | 0 (0.0%) |
| 15 to 17 Year Olds | 4 (100.0%) | 0 (0.0%) |
| 18 to 19 Year Olds | 0 (0.0%) | 8 (100.0%) |
| 20 to 24 Year Olds | 0 (0.0%) | 28 (100.0%) |
| 25 to 34 Year Olds | 0 (0.0%) | 0 (0.0%) |
| 35 Years and over | 0 (0.0%) | 14 (100.0%) |
| Total | 78 (55.3%) | 63 (44.7%) |
Educational Attainment by Field of Study in White Mills
Visual & performing arts (15 | 17.6%), arts & humanities (13 | 15.3%), science & technology (12 | 14.1%), social sciences (11 | 12.9%), and business (8 | 9.4%) are the most common fields of study among 85 individuals in White Mills who have obtained a bachelor's degree or higher.
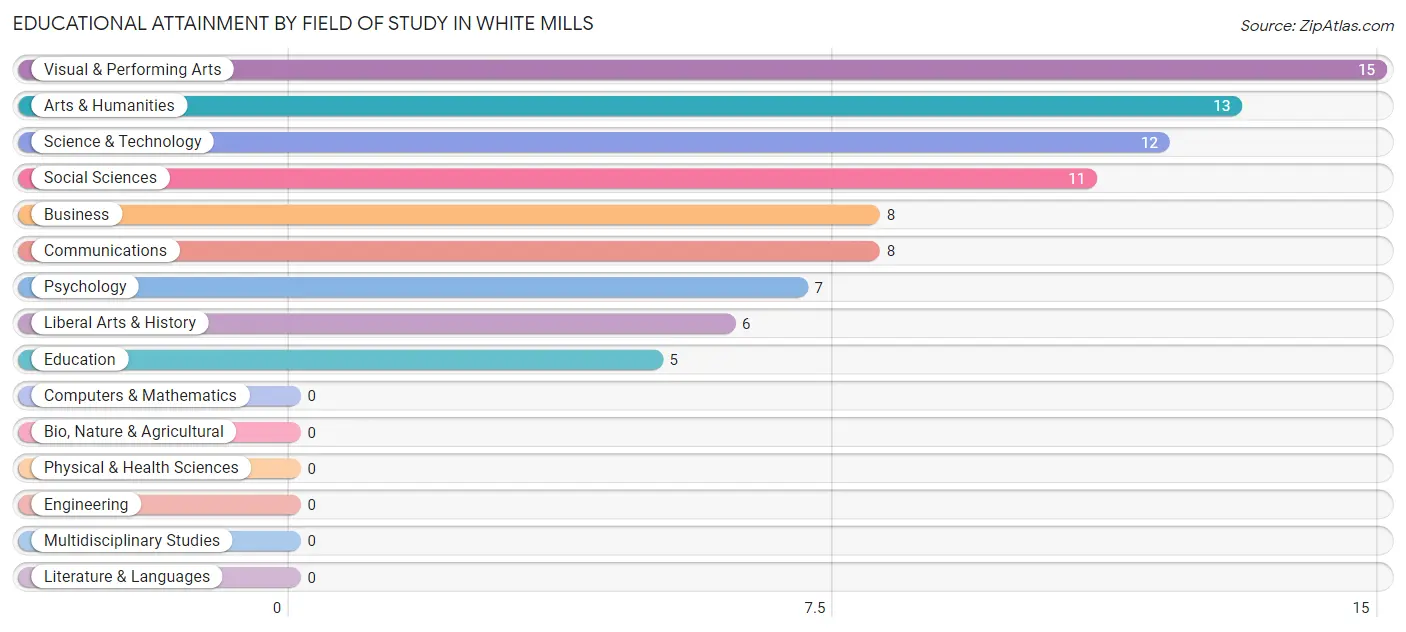
| Field of Study | # Graduates | % Graduates |
| Computers & Mathematics | 0 | 0.0% |
| Bio, Nature & Agricultural | 0 | 0.0% |
| Physical & Health Sciences | 0 | 0.0% |
| Psychology | 7 | 8.2% |
| Social Sciences | 11 | 12.9% |
| Engineering | 0 | 0.0% |
| Multidisciplinary Studies | 0 | 0.0% |
| Science & Technology | 12 | 14.1% |
| Business | 8 | 9.4% |
| Education | 5 | 5.9% |
| Literature & Languages | 0 | 0.0% |
| Liberal Arts & History | 6 | 7.1% |
| Visual & Performing Arts | 15 | 17.6% |
| Communications | 8 | 9.4% |
| Arts & Humanities | 13 | 15.3% |
| Total | 85 | 100.0% |
Transportation & Commute in White Mills
Vehicle Availability by Sex in White Mills
The most prevalent vehicle ownership categories in White Mills are males with 2 vehicles (80, accounting for 39.0%) and females with 2 vehicles (8, making up 45.2%).
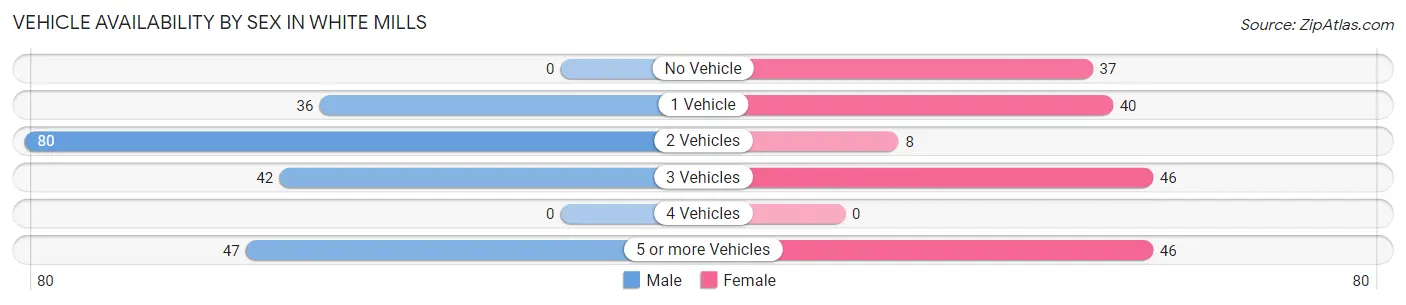
| Vehicles Available | Male | Female |
| No Vehicle | 0 (0.0%) | 37 (20.9%) |
| 1 Vehicle | 36 (17.6%) | 40 (22.6%) |
| 2 Vehicles | 80 (39.0%) | 8 (4.5%) |
| 3 Vehicles | 42 (20.5%) | 46 (26.0%) |
| 4 Vehicles | 0 (0.0%) | 0 (0.0%) |
| 5 or more Vehicles | 47 (22.9%) | 46 (26.0%) |
| Total | 205 (100.0%) | 177 (100.0%) |
Commute Time in White Mills
The most frequently occuring commute durations in White Mills are 30 to 34 minutes (75 commuters, 24.9%), 5 to 9 minutes (49 commuters, 16.3%), and 90 or more minutes (45 commuters, 14.9%).

| Commute Time | # Commuters | % Commuters |
| Less than 5 Minutes | 0 | 0.0% |
| 5 to 9 Minutes | 49 | 16.3% |
| 10 to 14 Minutes | 23 | 7.6% |
| 15 to 19 Minutes | 19 | 6.3% |
| 20 to 24 Minutes | 26 | 8.6% |
| 25 to 29 Minutes | 0 | 0.0% |
| 30 to 34 Minutes | 75 | 24.9% |
| 35 to 39 Minutes | 22 | 7.3% |
| 40 to 44 Minutes | 0 | 0.0% |
| 45 to 59 Minutes | 42 | 14.0% |
| 60 to 89 Minutes | 0 | 0.0% |
| 90 or more Minutes | 45 | 14.9% |
Commute Time by Sex in White Mills
The most common commute times in White Mills are 90 or more minutes (45 commuters, 25.0%) for males and 30 to 34 minutes (32 commuters, 26.5%) for females.
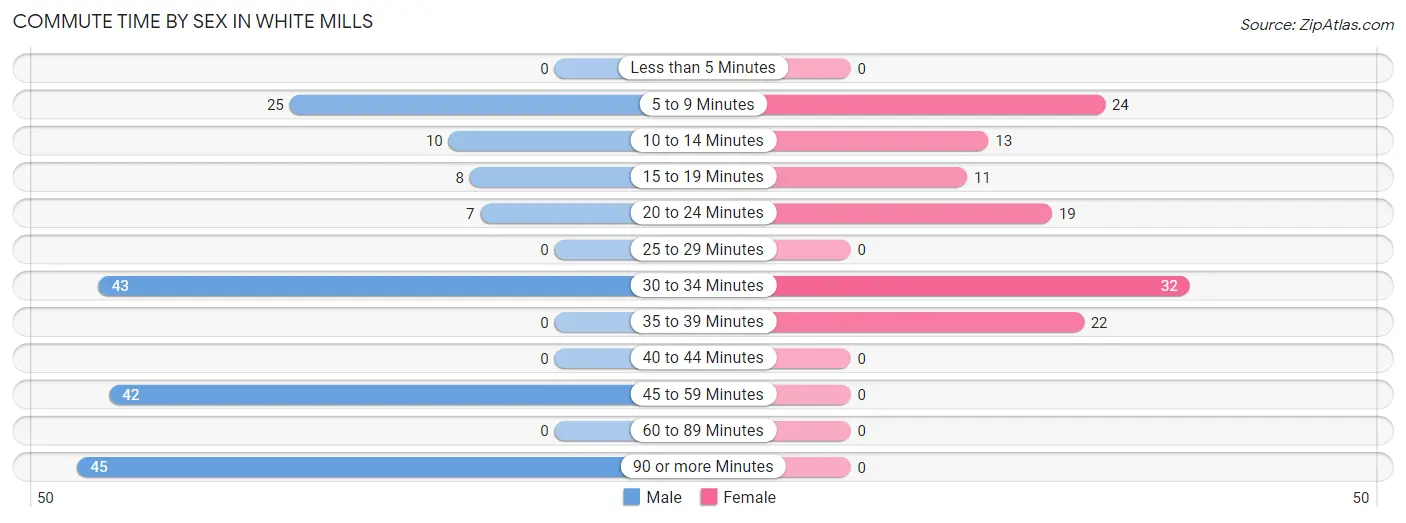
| Commute Time | Male | Female |
| Less than 5 Minutes | 0 (0.0%) | 0 (0.0%) |
| 5 to 9 Minutes | 25 (13.9%) | 24 (19.8%) |
| 10 to 14 Minutes | 10 (5.6%) | 13 (10.7%) |
| 15 to 19 Minutes | 8 (4.4%) | 11 (9.1%) |
| 20 to 24 Minutes | 7 (3.9%) | 19 (15.7%) |
| 25 to 29 Minutes | 0 (0.0%) | 0 (0.0%) |
| 30 to 34 Minutes | 43 (23.9%) | 32 (26.5%) |
| 35 to 39 Minutes | 0 (0.0%) | 22 (18.2%) |
| 40 to 44 Minutes | 0 (0.0%) | 0 (0.0%) |
| 45 to 59 Minutes | 42 (23.3%) | 0 (0.0%) |
| 60 to 89 Minutes | 0 (0.0%) | 0 (0.0%) |
| 90 or more Minutes | 45 (25.0%) | 0 (0.0%) |
Time of Departure to Work by Sex in White Mills
The most frequent times of departure to work in White Mills are 6:30 AM to 6:59 AM (51, 28.3%) for males and 12:00 PM to 3:59 PM (32, 26.5%) for females.
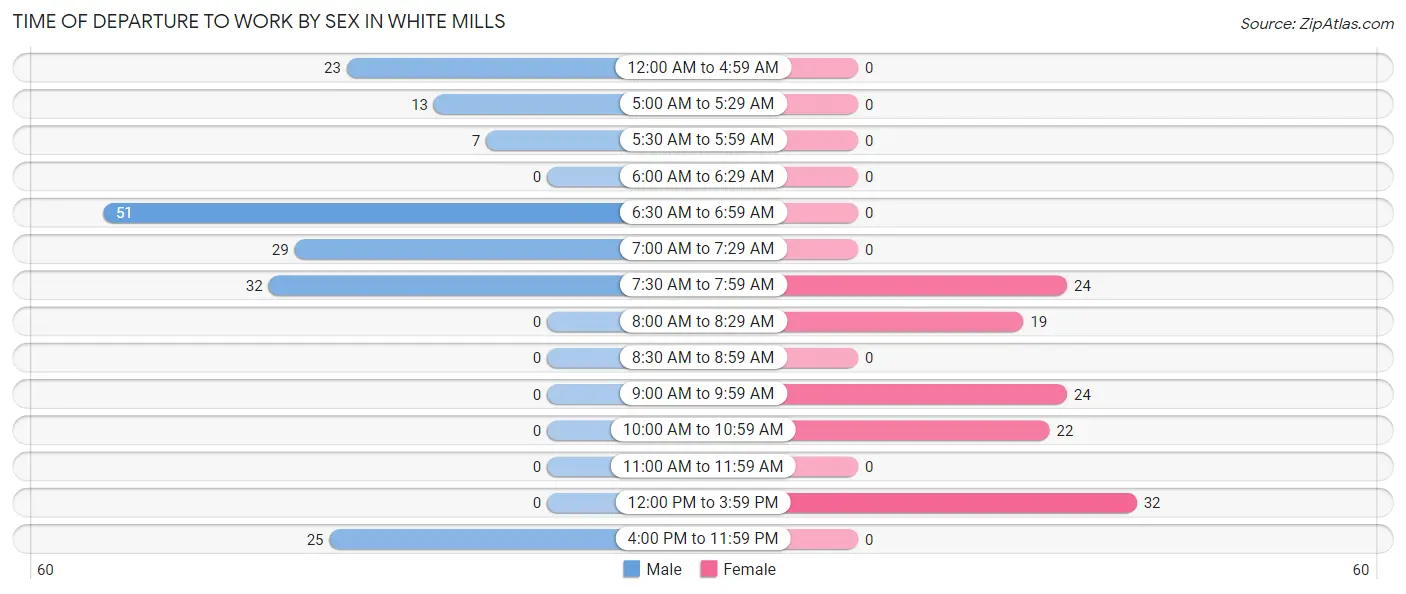
| Time of Departure | Male | Female |
| 12:00 AM to 4:59 AM | 23 (12.8%) | 0 (0.0%) |
| 5:00 AM to 5:29 AM | 13 (7.2%) | 0 (0.0%) |
| 5:30 AM to 5:59 AM | 7 (3.9%) | 0 (0.0%) |
| 6:00 AM to 6:29 AM | 0 (0.0%) | 0 (0.0%) |
| 6:30 AM to 6:59 AM | 51 (28.3%) | 0 (0.0%) |
| 7:00 AM to 7:29 AM | 29 (16.1%) | 0 (0.0%) |
| 7:30 AM to 7:59 AM | 32 (17.8%) | 24 (19.8%) |
| 8:00 AM to 8:29 AM | 0 (0.0%) | 19 (15.7%) |
| 8:30 AM to 8:59 AM | 0 (0.0%) | 0 (0.0%) |
| 9:00 AM to 9:59 AM | 0 (0.0%) | 24 (19.8%) |
| 10:00 AM to 10:59 AM | 0 (0.0%) | 22 (18.2%) |
| 11:00 AM to 11:59 AM | 0 (0.0%) | 0 (0.0%) |
| 12:00 PM to 3:59 PM | 0 (0.0%) | 32 (26.5%) |
| 4:00 PM to 11:59 PM | 25 (13.9%) | 0 (0.0%) |
| Total | 180 (100.0%) | 121 (100.0%) |
Housing Occupancy in White Mills
Occupancy by Ownership in White Mills
Of the total 352 dwellings in White Mills, owner-occupied units account for 307 (87.2%), while renter-occupied units make up 45 (12.8%).
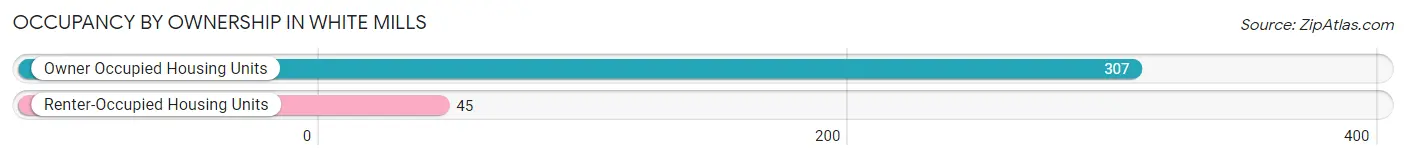
| Occupancy | # Housing Units | % Housing Units |
| Owner Occupied Housing Units | 307 | 87.2% |
| Renter-Occupied Housing Units | 45 | 12.8% |
| Total Occupied Housing Units | 352 | 100.0% |
Occupancy by Household Size in White Mills
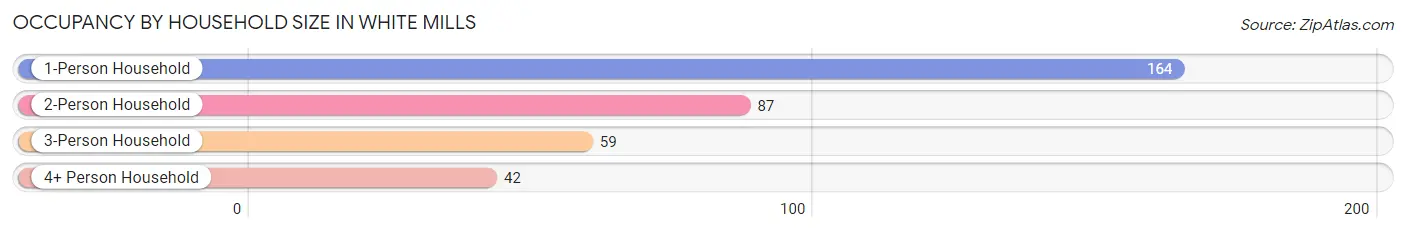
| Household Size | # Housing Units | % Housing Units |
| 1-Person Household | 164 | 46.6% |
| 2-Person Household | 87 | 24.7% |
| 3-Person Household | 59 | 16.8% |
| 4+ Person Household | 42 | 11.9% |
| Total Housing Units | 352 | 100.0% |
Occupancy by Ownership by Household Size in White Mills
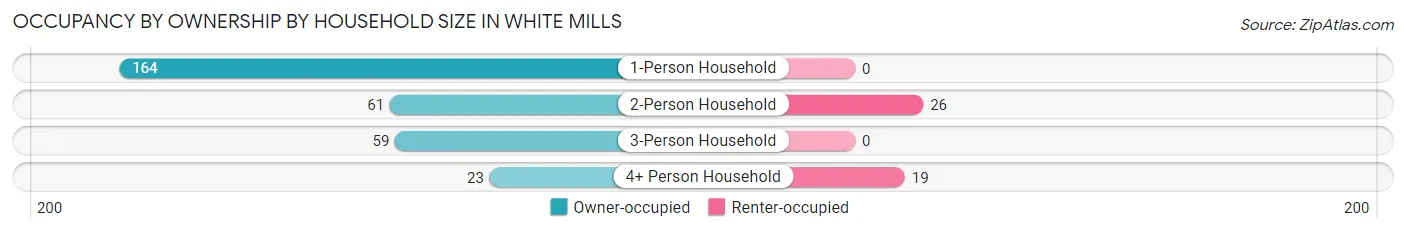
| Household Size | Owner-occupied | Renter-occupied |
| 1-Person Household | 164 (100.0%) | 0 (0.0%) |
| 2-Person Household | 61 (70.1%) | 26 (29.9%) |
| 3-Person Household | 59 (100.0%) | 0 (0.0%) |
| 4+ Person Household | 23 (54.8%) | 19 (45.2%) |
| Total Housing Units | 307 (87.2%) | 45 (12.8%) |
Occupancy by Educational Attainment in White Mills
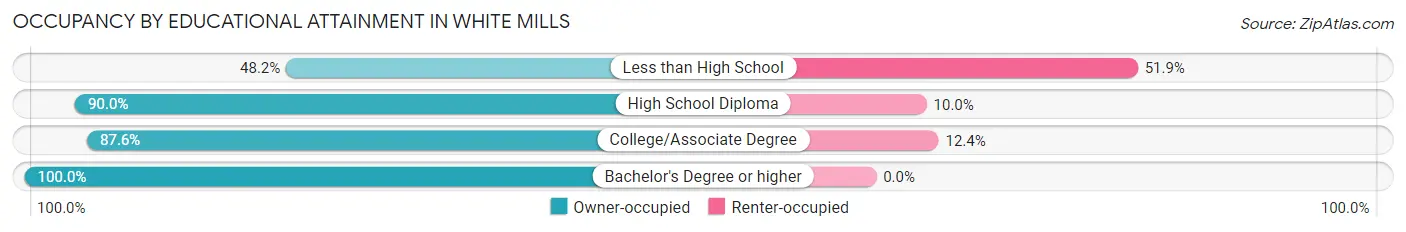
| Household Size | Owner-occupied | Renter-occupied |
| Less than High School | 13 (48.1%) | 14 (51.8%) |
| High School Diploma | 171 (90.0%) | 19 (10.0%) |
| College/Associate Degree | 85 (87.6%) | 12 (12.4%) |
| Bachelor's Degree or higher | 38 (100.0%) | 0 (0.0%) |
Occupancy by Age of Householder in White Mills
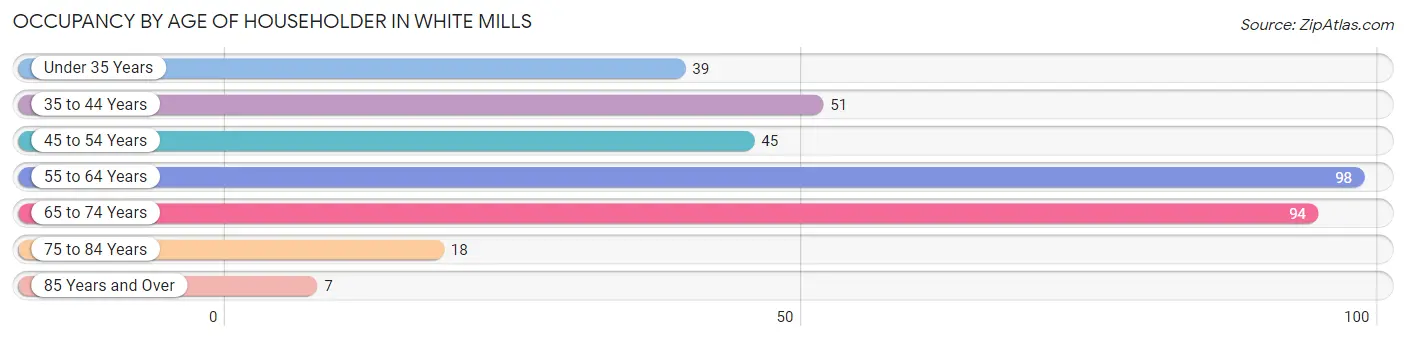
| Age Bracket | # Households | % Households |
| Under 35 Years | 39 | 11.1% |
| 35 to 44 Years | 51 | 14.5% |
| 45 to 54 Years | 45 | 12.8% |
| 55 to 64 Years | 98 | 27.8% |
| 65 to 74 Years | 94 | 26.7% |
| 75 to 84 Years | 18 | 5.1% |
| 85 Years and Over | 7 | 2.0% |
| Total | 352 | 100.0% |
Housing Finances in White Mills
Median Income by Occupancy in White Mills
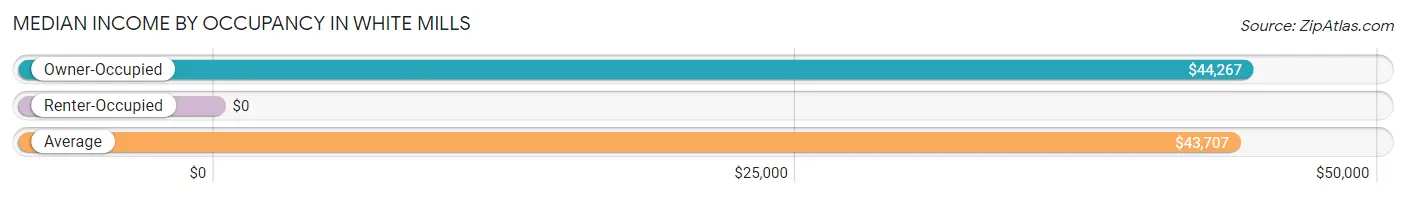
| Occupancy Type | # Households | Median Income |
| Owner-Occupied | 307 (87.2%) | $44,267 |
| Renter-Occupied | 45 (12.8%) | $0 |
| Average | 352 (100.0%) | $43,707 |
Occupancy by Householder Income Bracket in White Mills
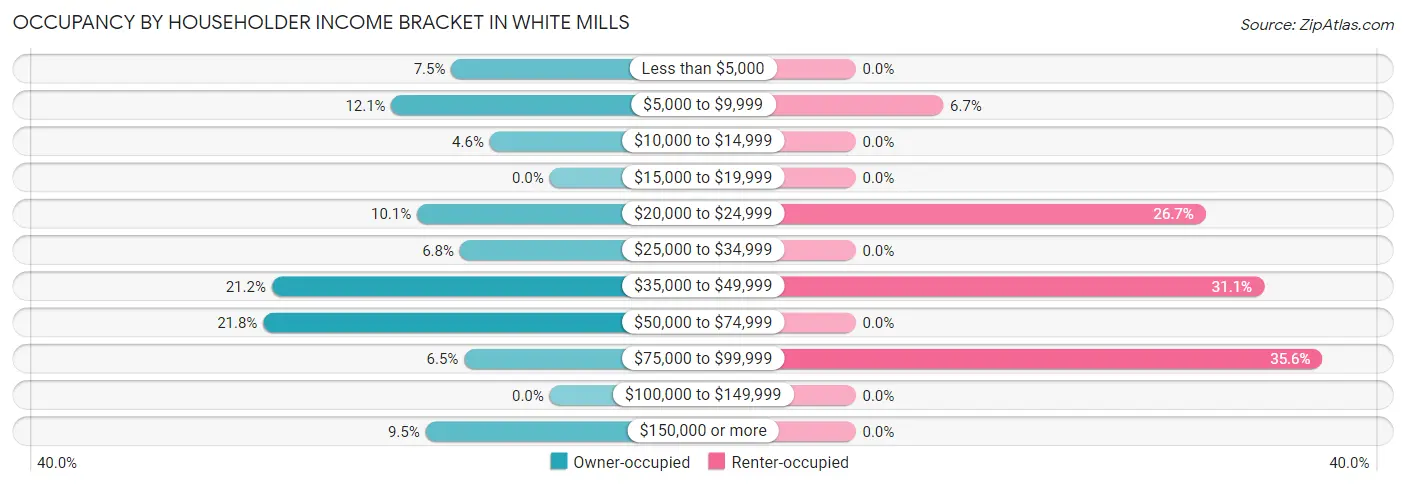
| Income Bracket | Owner-occupied | Renter-occupied |
| Less than $5,000 | 23 (7.5%) | 0 (0.0%) |
| $5,000 to $9,999 | 37 (12.0%) | 3 (6.7%) |
| $10,000 to $14,999 | 14 (4.6%) | 0 (0.0%) |
| $15,000 to $19,999 | 0 (0.0%) | 0 (0.0%) |
| $20,000 to $24,999 | 31 (10.1%) | 12 (26.7%) |
| $25,000 to $34,999 | 21 (6.8%) | 0 (0.0%) |
| $35,000 to $49,999 | 65 (21.2%) | 14 (31.1%) |
| $50,000 to $74,999 | 67 (21.8%) | 0 (0.0%) |
| $75,000 to $99,999 | 20 (6.5%) | 16 (35.6%) |
| $100,000 to $149,999 | 0 (0.0%) | 0 (0.0%) |
| $150,000 or more | 29 (9.5%) | 0 (0.0%) |
| Total | 307 (100.0%) | 45 (100.0%) |
Monthly Housing Cost Tiers in White Mills
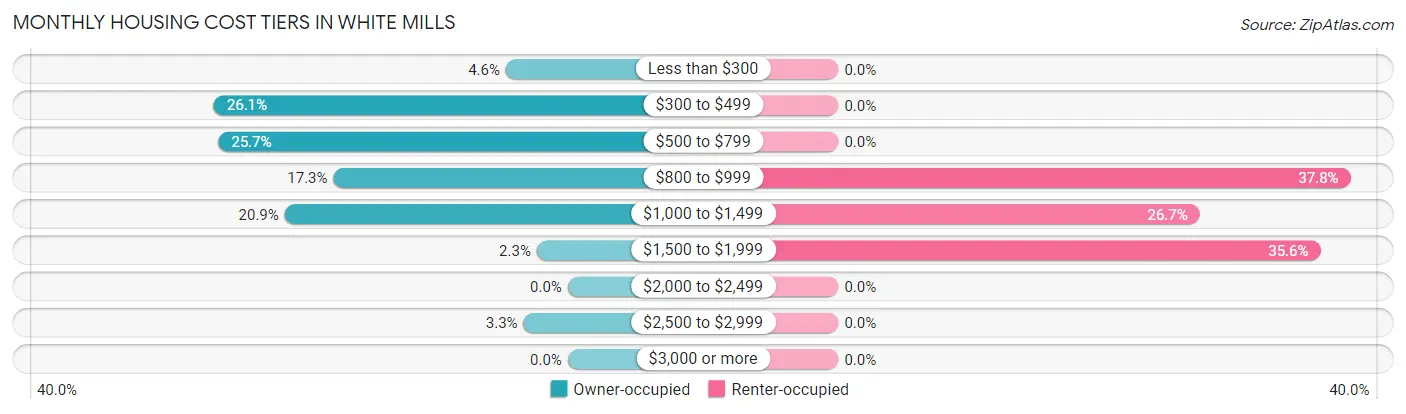
| Monthly Cost | Owner-occupied | Renter-occupied |
| Less than $300 | 14 (4.6%) | 0 (0.0%) |
| $300 to $499 | 80 (26.1%) | 0 (0.0%) |
| $500 to $799 | 79 (25.7%) | 0 (0.0%) |
| $800 to $999 | 53 (17.3%) | 17 (37.8%) |
| $1,000 to $1,499 | 64 (20.8%) | 12 (26.7%) |
| $1,500 to $1,999 | 7 (2.3%) | 16 (35.6%) |
| $2,000 to $2,499 | 0 (0.0%) | 0 (0.0%) |
| $2,500 to $2,999 | 10 (3.3%) | 0 (0.0%) |
| $3,000 or more | 0 (0.0%) | 0 (0.0%) |
| Total | 307 (100.0%) | 45 (100.0%) |
Physical Housing Characteristics in White Mills
Housing Structures in White Mills
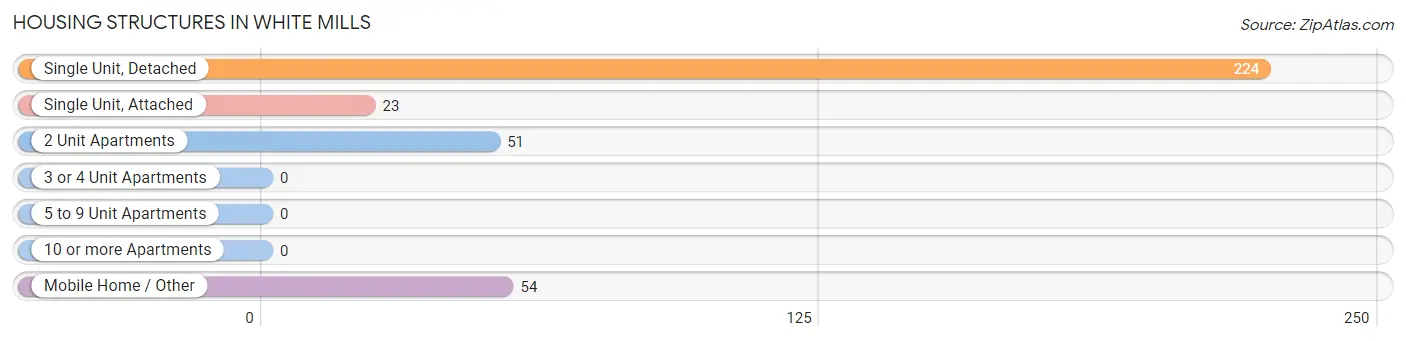
| Structure Type | # Housing Units | % Housing Units |
| Single Unit, Detached | 224 | 63.6% |
| Single Unit, Attached | 23 | 6.5% |
| 2 Unit Apartments | 51 | 14.5% |
| 3 or 4 Unit Apartments | 0 | 0.0% |
| 5 to 9 Unit Apartments | 0 | 0.0% |
| 10 or more Apartments | 0 | 0.0% |
| Mobile Home / Other | 54 | 15.3% |
| Total | 352 | 100.0% |
Housing Structures by Occupancy in White Mills
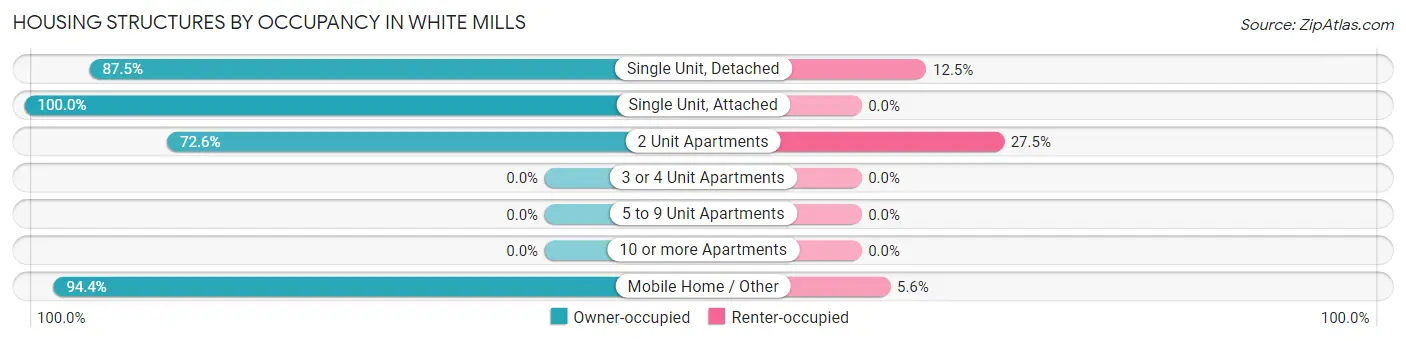
| Structure Type | Owner-occupied | Renter-occupied |
| Single Unit, Detached | 196 (87.5%) | 28 (12.5%) |
| Single Unit, Attached | 23 (100.0%) | 0 (0.0%) |
| 2 Unit Apartments | 37 (72.6%) | 14 (27.5%) |
| 3 or 4 Unit Apartments | 0 (0.0%) | 0 (0.0%) |
| 5 to 9 Unit Apartments | 0 (0.0%) | 0 (0.0%) |
| 10 or more Apartments | 0 (0.0%) | 0 (0.0%) |
| Mobile Home / Other | 51 (94.4%) | 3 (5.6%) |
| Total | 307 (87.2%) | 45 (12.8%) |
Housing Structures by Number of Rooms in White Mills
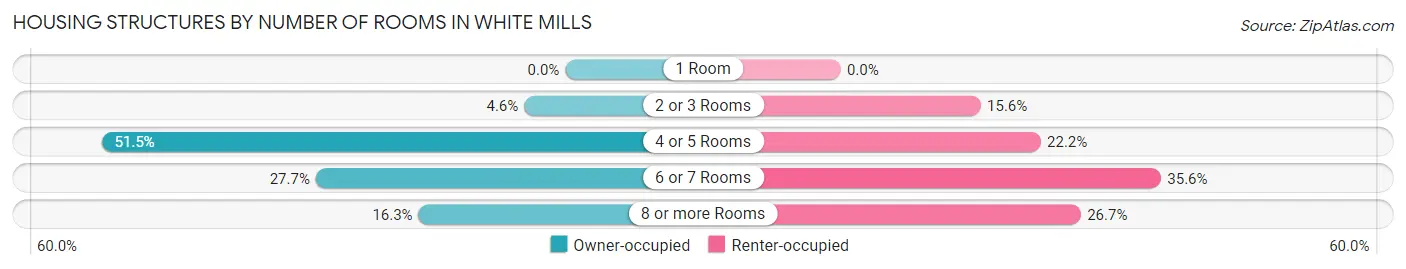
| Number of Rooms | Owner-occupied | Renter-occupied |
| 1 Room | 0 (0.0%) | 0 (0.0%) |
| 2 or 3 Rooms | 14 (4.6%) | 7 (15.6%) |
| 4 or 5 Rooms | 158 (51.5%) | 10 (22.2%) |
| 6 or 7 Rooms | 85 (27.7%) | 16 (35.6%) |
| 8 or more Rooms | 50 (16.3%) | 12 (26.7%) |
| Total | 307 (100.0%) | 45 (100.0%) |
Housing Structure by Heating Type in White Mills
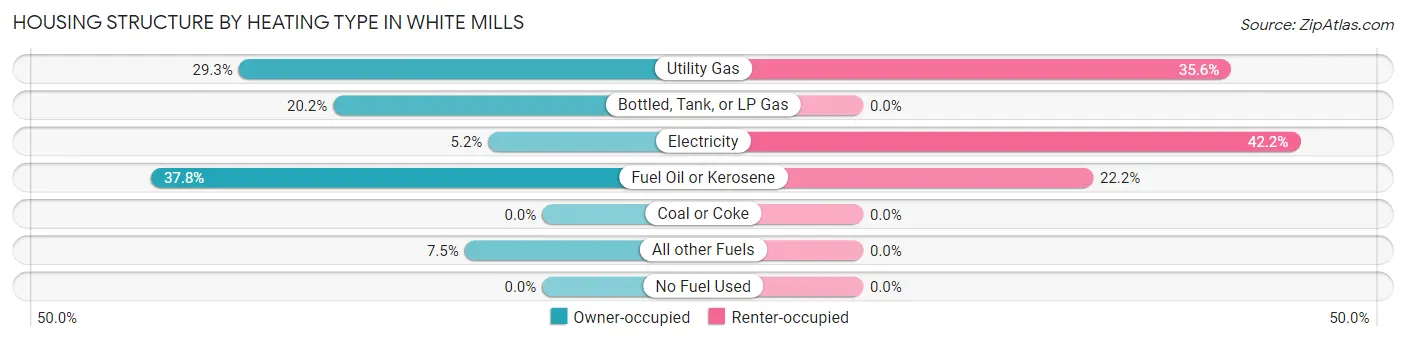
| Heating Type | Owner-occupied | Renter-occupied |
| Utility Gas | 90 (29.3%) | 16 (35.6%) |
| Bottled, Tank, or LP Gas | 62 (20.2%) | 0 (0.0%) |
| Electricity | 16 (5.2%) | 19 (42.2%) |
| Fuel Oil or Kerosene | 116 (37.8%) | 10 (22.2%) |
| Coal or Coke | 0 (0.0%) | 0 (0.0%) |
| All other Fuels | 23 (7.5%) | 0 (0.0%) |
| No Fuel Used | 0 (0.0%) | 0 (0.0%) |
| Total | 307 (100.0%) | 45 (100.0%) |
Household Vehicle Usage in White Mills
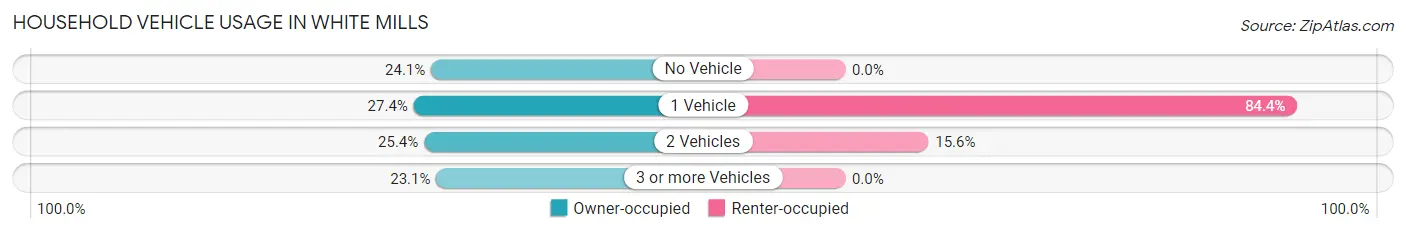
| Vehicles per Household | Owner-occupied | Renter-occupied |
| No Vehicle | 74 (24.1%) | 0 (0.0%) |
| 1 Vehicle | 84 (27.4%) | 38 (84.4%) |
| 2 Vehicles | 78 (25.4%) | 7 (15.6%) |
| 3 or more Vehicles | 71 (23.1%) | 0 (0.0%) |
| Total | 307 (100.0%) | 45 (100.0%) |
Real Estate & Mortgages in White Mills
Real Estate and Mortgage Overview in White Mills
| Characteristic | Without Mortgage | With Mortgage |
| Housing Units | 229 | 78 |
| Median Property Value | $136,200 | $176,000 |
| Median Household Income | $43,060 | $29 |
| Monthly Housing Costs | $573 | $0 |
| Real Estate Taxes | $1,805 | $0 |
Property Value by Mortgage Status in White Mills
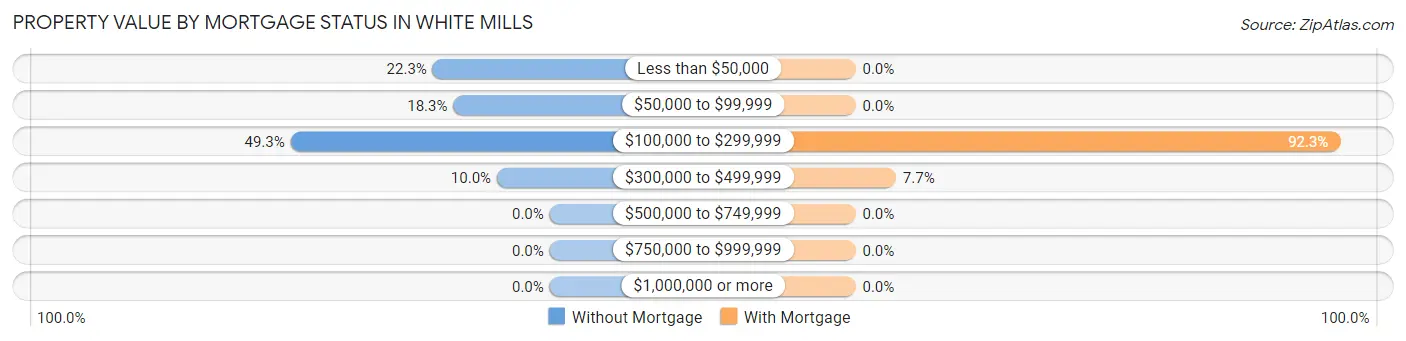
| Property Value | Without Mortgage | With Mortgage |
| Less than $50,000 | 51 (22.3%) | 0 (0.0%) |
| $50,000 to $99,999 | 42 (18.3%) | 0 (0.0%) |
| $100,000 to $299,999 | 113 (49.3%) | 72 (92.3%) |
| $300,000 to $499,999 | 23 (10.0%) | 6 (7.7%) |
| $500,000 to $749,999 | 0 (0.0%) | 0 (0.0%) |
| $750,000 to $999,999 | 0 (0.0%) | 0 (0.0%) |
| $1,000,000 or more | 0 (0.0%) | 0 (0.0%) |
| Total | 229 (100.0%) | 78 (100.0%) |
Household Income by Mortgage Status in White Mills
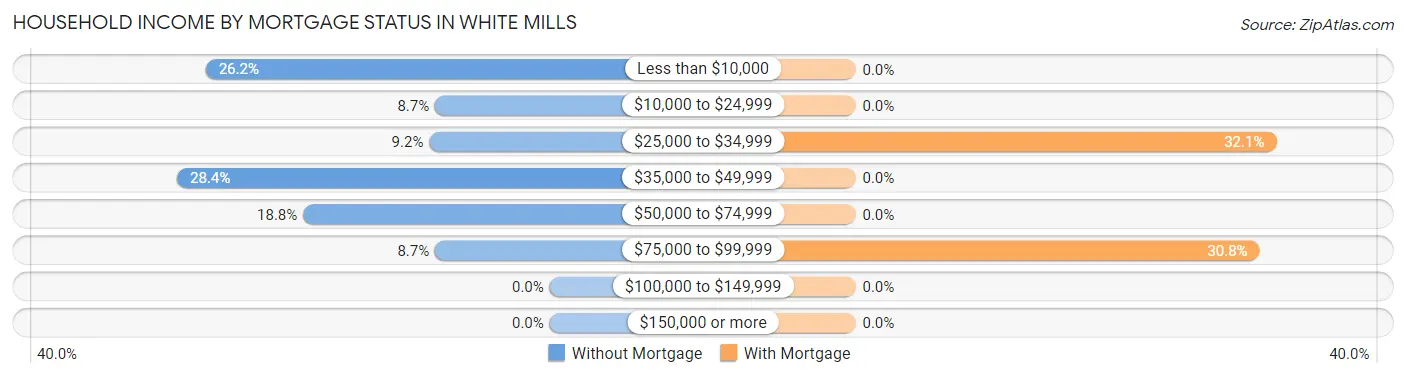
| Household Income | Without Mortgage | With Mortgage |
| Less than $10,000 | 60 (26.2%) | 0 (0.0%) |
| $10,000 to $24,999 | 20 (8.7%) | 0 (0.0%) |
| $25,000 to $34,999 | 21 (9.2%) | 25 (32.1%) |
| $35,000 to $49,999 | 65 (28.4%) | 0 (0.0%) |
| $50,000 to $74,999 | 43 (18.8%) | 0 (0.0%) |
| $75,000 to $99,999 | 20 (8.7%) | 24 (30.8%) |
| $100,000 to $149,999 | 0 (0.0%) | 0 (0.0%) |
| $150,000 or more | 0 (0.0%) | 0 (0.0%) |
| Total | 229 (100.0%) | 78 (100.0%) |
Property Value to Household Income Ratio in White Mills
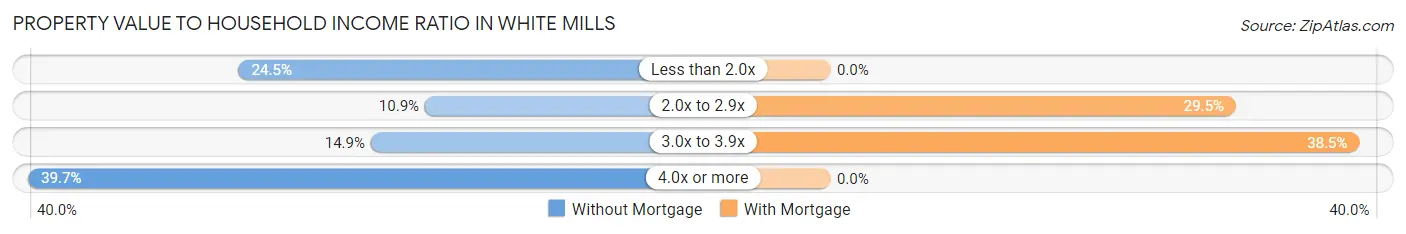
| Value-to-Income Ratio | Without Mortgage | With Mortgage |
| Less than 2.0x | 56 (24.4%) | 0 (0.0%) |
| 2.0x to 2.9x | 25 (10.9%) | 23 (29.5%) |
| 3.0x to 3.9x | 34 (14.8%) | 30 (38.5%) |
| 4.0x or more | 91 (39.7%) | 0 (0.0%) |
| Total | 229 (100.0%) | 78 (100.0%) |
Real Estate Taxes by Mortgage Status in White Mills
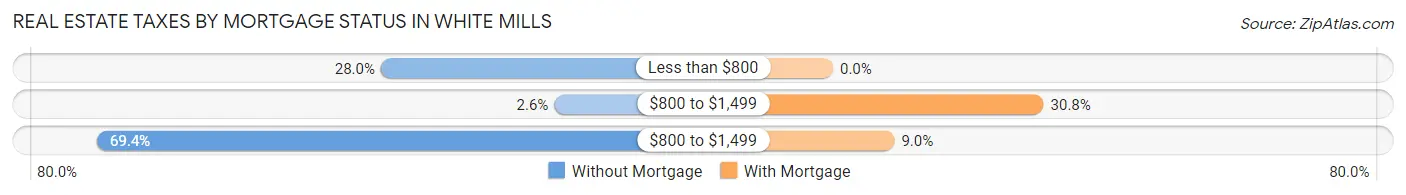
| Property Taxes | Without Mortgage | With Mortgage |
| Less than $800 | 64 (28.0%) | 0 (0.0%) |
| $800 to $1,499 | 6 (2.6%) | 24 (30.8%) |
| $800 to $1,499 | 159 (69.4%) | 7 (9.0%) |
| Total | 229 (100.0%) | 78 (100.0%) |
Health & Disability in White Mills
Health Insurance Coverage by Age in White Mills
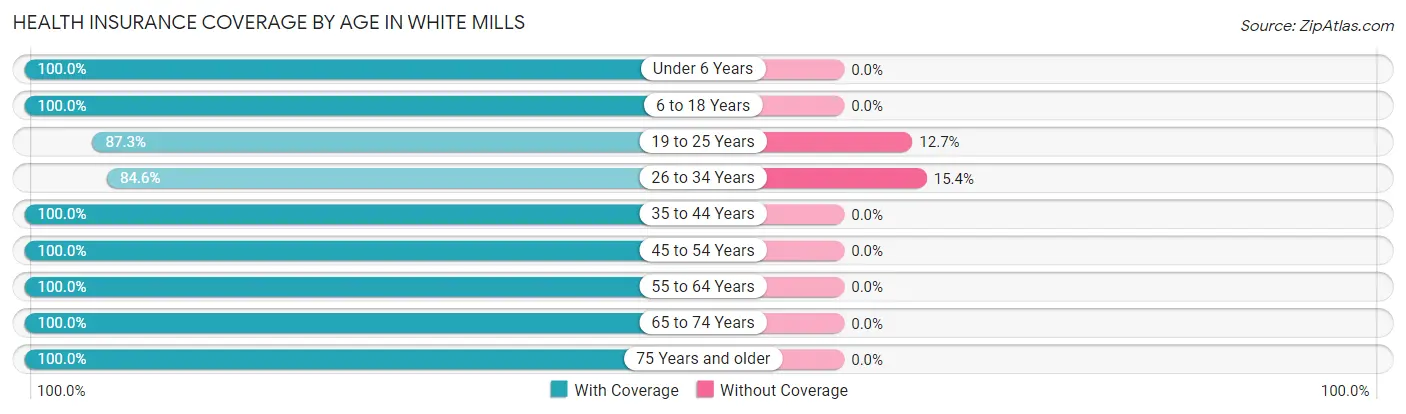
| Age Bracket | With Coverage | Without Coverage |
| Under 6 Years | 11 (100.0%) | 0 (0.0%) |
| 6 to 18 Years | 83 (100.0%) | 0 (0.0%) |
| 19 to 25 Years | 110 (87.3%) | 16 (12.7%) |
| 26 to 34 Years | 44 (84.6%) | 8 (15.4%) |
| 35 to 44 Years | 107 (100.0%) | 0 (0.0%) |
| 45 to 54 Years | 89 (100.0%) | 0 (0.0%) |
| 55 to 64 Years | 137 (100.0%) | 0 (0.0%) |
| 65 to 74 Years | 99 (100.0%) | 0 (0.0%) |
| 75 Years and older | 42 (100.0%) | 0 (0.0%) |
| Total | 722 (96.8%) | 24 (3.2%) |
Health Insurance Coverage by Citizenship Status in White Mills
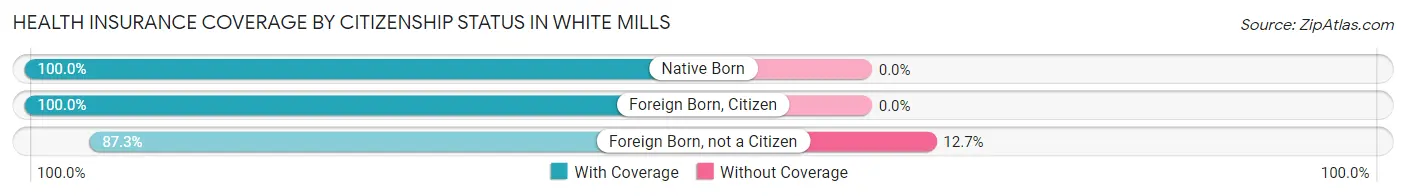
| Citizenship Status | With Coverage | Without Coverage |
| Native Born | 11 (100.0%) | 0 (0.0%) |
| Foreign Born, Citizen | 83 (100.0%) | 0 (0.0%) |
| Foreign Born, not a Citizen | 110 (87.3%) | 16 (12.7%) |
Health Insurance Coverage by Household Income in White Mills
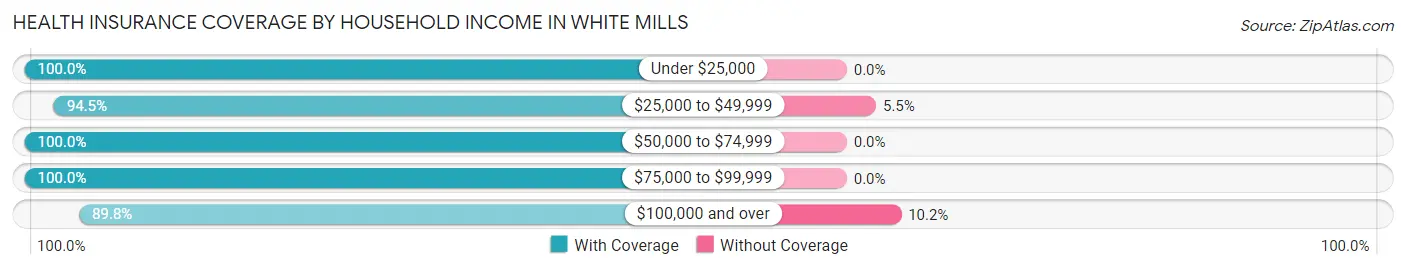
| Household Income | With Coverage | Without Coverage |
| Under $25,000 | 191 (100.0%) | 0 (0.0%) |
| $25,000 to $49,999 | 138 (94.5%) | 8 (5.5%) |
| $50,000 to $74,999 | 140 (100.0%) | 0 (0.0%) |
| $75,000 to $99,999 | 112 (100.0%) | 0 (0.0%) |
| $100,000 and over | 141 (89.8%) | 16 (10.2%) |
Public vs Private Health Insurance Coverage by Age in White Mills
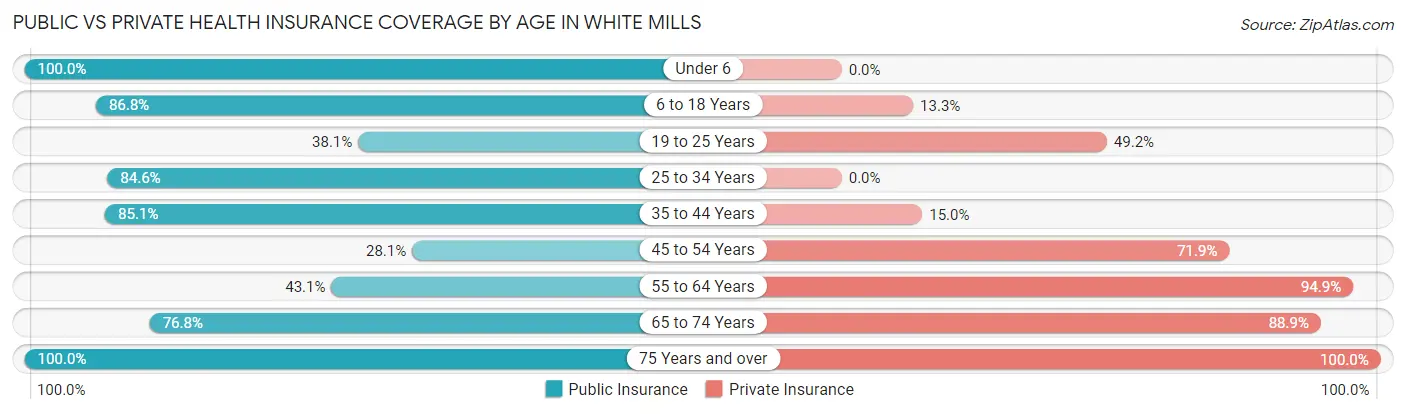
| Age Bracket | Public Insurance | Private Insurance |
| Under 6 | 11 (100.0%) | 0 (0.0%) |
| 6 to 18 Years | 72 (86.8%) | 11 (13.3%) |
| 19 to 25 Years | 48 (38.1%) | 62 (49.2%) |
| 25 to 34 Years | 44 (84.6%) | 0 (0.0%) |
| 35 to 44 Years | 91 (85.1%) | 16 (14.9%) |
| 45 to 54 Years | 25 (28.1%) | 64 (71.9%) |
| 55 to 64 Years | 59 (43.1%) | 130 (94.9%) |
| 65 to 74 Years | 76 (76.8%) | 88 (88.9%) |
| 75 Years and over | 42 (100.0%) | 42 (100.0%) |
| Total | 468 (62.7%) | 413 (55.4%) |
Disability Status by Sex by Age in White Mills
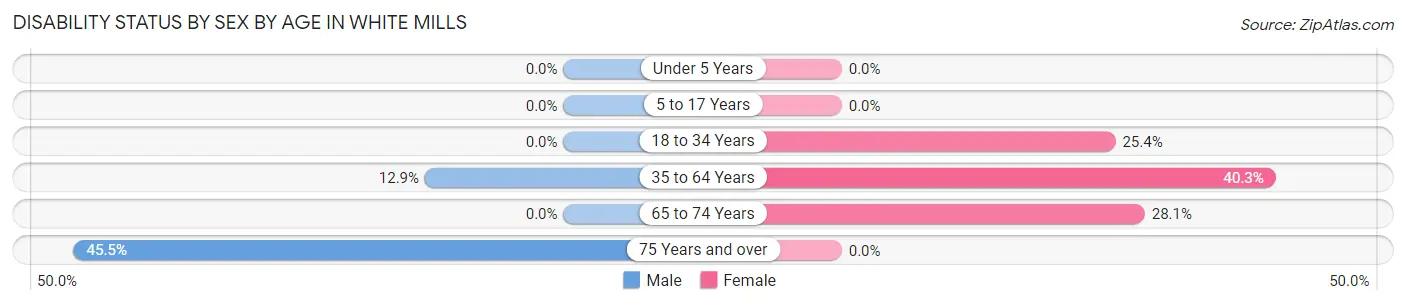
| Age Bracket | Male | Female |
| Under 5 Years | 0 (0.0%) | 0 (0.0%) |
| 5 to 17 Years | 0 (0.0%) | 0 (0.0%) |
| 18 to 34 Years | 0 (0.0%) | 32 (25.4%) |
| 35 to 64 Years | 23 (12.9%) | 62 (40.3%) |
| 65 to 74 Years | 0 (0.0%) | 18 (28.1%) |
| 75 Years and over | 10 (45.5%) | 0 (0.0%) |
Disability Class by Sex by Age in White Mills
Disability Class: Hearing Difficulty
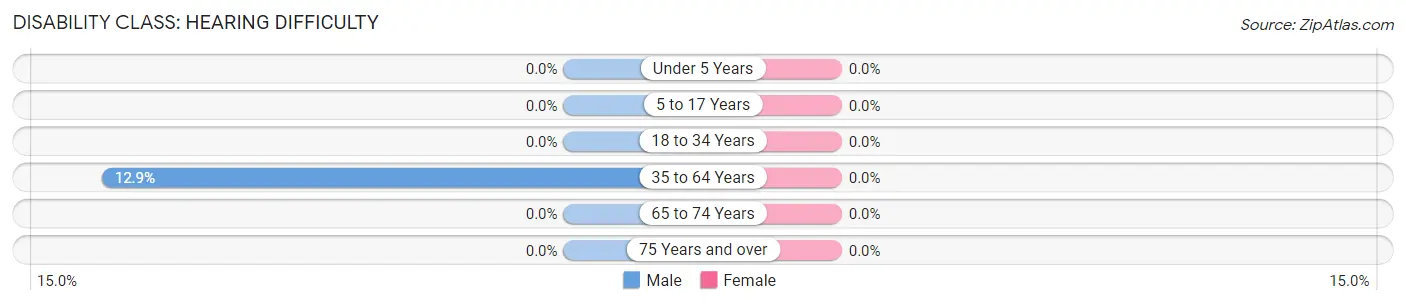
| Age Bracket | Male | Female |
| Under 5 Years | 0 (0.0%) | 0 (0.0%) |
| 5 to 17 Years | 0 (0.0%) | 0 (0.0%) |
| 18 to 34 Years | 0 (0.0%) | 0 (0.0%) |
| 35 to 64 Years | 23 (12.9%) | 0 (0.0%) |
| 65 to 74 Years | 0 (0.0%) | 0 (0.0%) |
| 75 Years and over | 0 (0.0%) | 0 (0.0%) |
Disability Class: Vision Difficulty
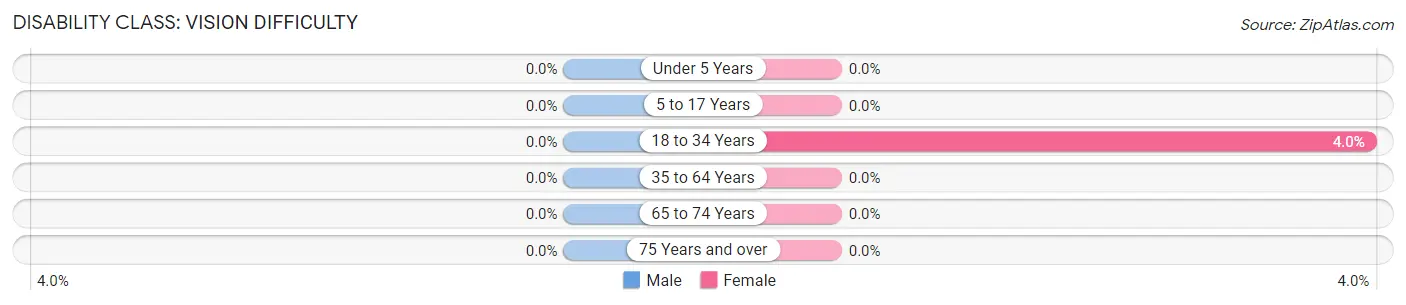
| Age Bracket | Male | Female |
| Under 5 Years | 0 (0.0%) | 0 (0.0%) |
| 5 to 17 Years | 0 (0.0%) | 0 (0.0%) |
| 18 to 34 Years | 0 (0.0%) | 5 (4.0%) |
| 35 to 64 Years | 0 (0.0%) | 0 (0.0%) |
| 65 to 74 Years | 0 (0.0%) | 0 (0.0%) |
| 75 Years and over | 0 (0.0%) | 0 (0.0%) |
Disability Class: Cognitive Difficulty
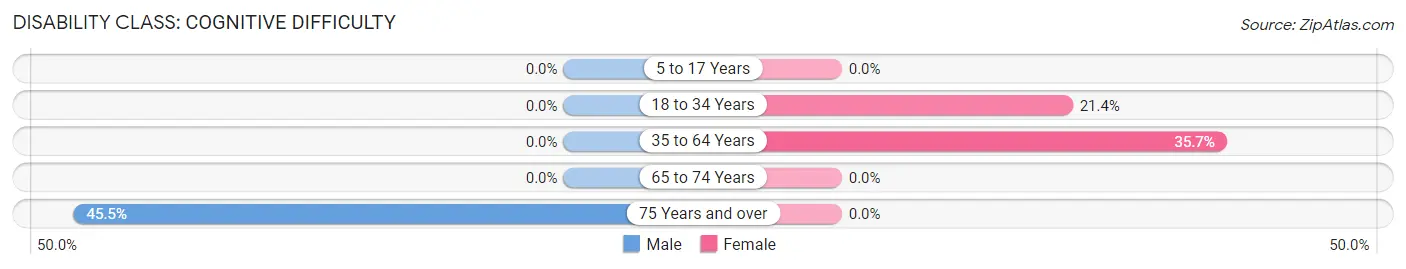
| Age Bracket | Male | Female |
| 5 to 17 Years | 0 (0.0%) | 0 (0.0%) |
| 18 to 34 Years | 0 (0.0%) | 27 (21.4%) |
| 35 to 64 Years | 0 (0.0%) | 55 (35.7%) |
| 65 to 74 Years | 0 (0.0%) | 0 (0.0%) |
| 75 Years and over | 10 (45.5%) | 0 (0.0%) |
Disability Class: Ambulatory Difficulty
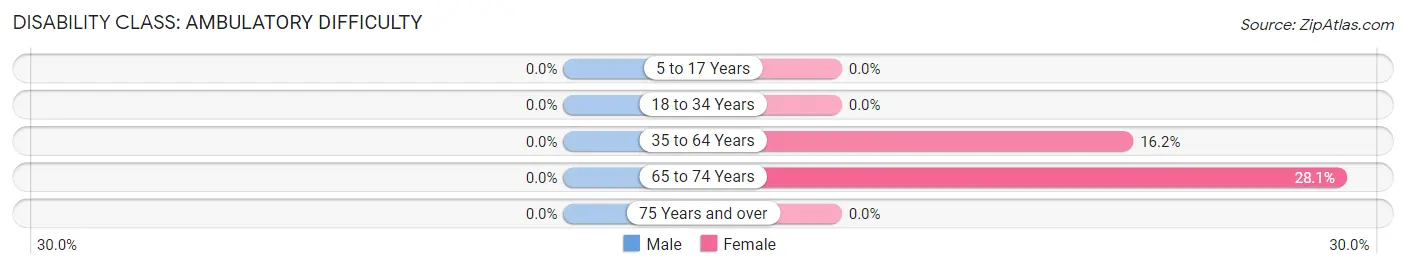
| Age Bracket | Male | Female |
| 5 to 17 Years | 0 (0.0%) | 0 (0.0%) |
| 18 to 34 Years | 0 (0.0%) | 0 (0.0%) |
| 35 to 64 Years | 0 (0.0%) | 25 (16.2%) |
| 65 to 74 Years | 0 (0.0%) | 18 (28.1%) |
| 75 Years and over | 0 (0.0%) | 0 (0.0%) |
Disability Class: Self-Care Difficulty
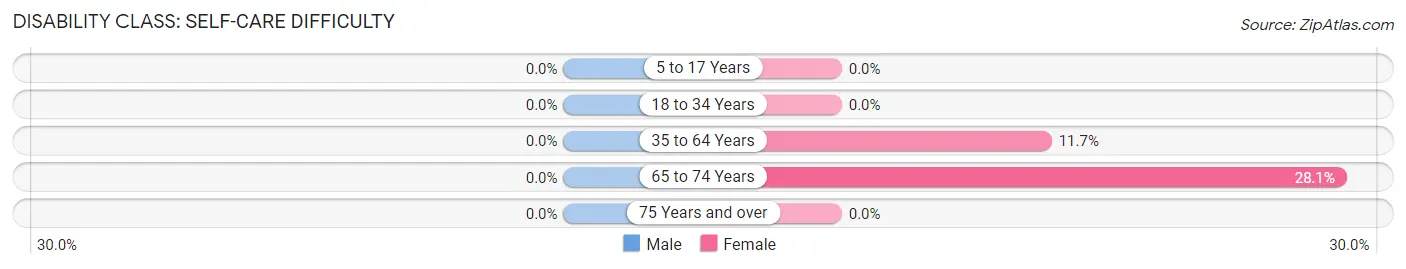
| Age Bracket | Male | Female |
| 5 to 17 Years | 0 (0.0%) | 0 (0.0%) |
| 18 to 34 Years | 0 (0.0%) | 0 (0.0%) |
| 35 to 64 Years | 0 (0.0%) | 18 (11.7%) |
| 65 to 74 Years | 0 (0.0%) | 18 (28.1%) |
| 75 Years and over | 0 (0.0%) | 0 (0.0%) |
Technology Access in White Mills
Computing Device Access in White Mills
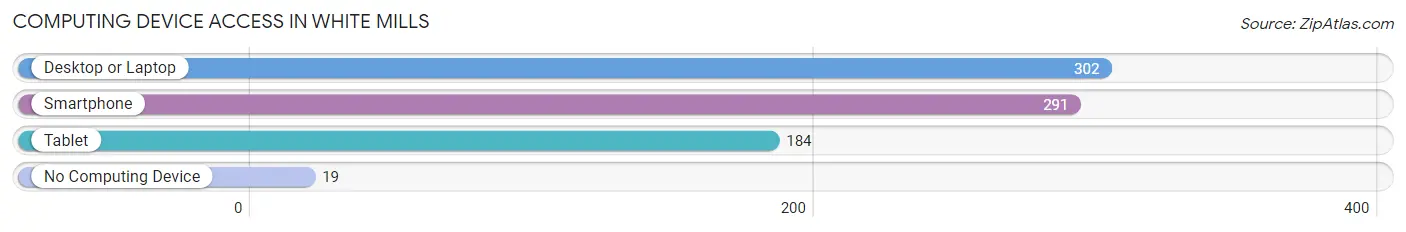
| Device Type | # Households | % Households |
| Desktop or Laptop | 302 | 85.8% |
| Smartphone | 291 | 82.7% |
| Tablet | 184 | 52.3% |
| No Computing Device | 19 | 5.4% |
| Total | 352 | 100.0% |
Internet Access in White Mills
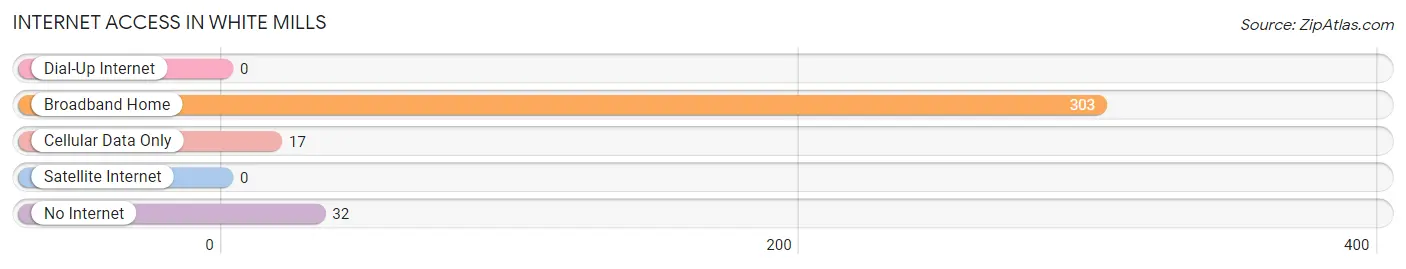
| Internet Type | # Households | % Households |
| Dial-Up Internet | 0 | 0.0% |
| Broadband Home | 303 | 86.1% |
| Cellular Data Only | 17 | 4.8% |
| Satellite Internet | 0 | 0.0% |
| No Internet | 32 | 9.1% |
| Total | 352 | 100.0% |
White Mills Summary
White Mills is a small unincorporated community located in Wayne County, Pennsylvania. It is situated in the Pocono Mountains, approximately two miles south of Honesdale, the county seat. The community is located along the Lackawaxen River, and is home to a variety of businesses, including a general store, a post office, a gas station, and a few restaurants.
History
White Mills was first settled in the late 1700s by a group of German immigrants. The community was originally known as “White’s Mills” after the family who owned the land. The name was eventually shortened to White Mills. The community grew slowly over the years, and by the mid-1800s, it had become a popular destination for tourists. The Lackawaxen River provided a source of power for the mills, and the area was known for its excellent fishing.
In the late 1800s, the community was home to a number of businesses, including a sawmill, a gristmill, a tannery, and a general store. The community also had a post office, which opened in 1883. In the early 1900s, the community was home to a number of resorts, including the White Mills Hotel and the Lackawaxen Inn.
Geography
White Mills is located in the Pocono Mountains of northeastern Pennsylvania. The community is situated along the Lackawaxen River, approximately two miles south of Honesdale, the county seat. The area is characterized by rolling hills and forests, and is home to a variety of wildlife, including deer, bear, and turkey.
Economy
White Mills is a small, rural community with a limited economy. The primary industries in the area are tourism and agriculture. The community is home to a number of businesses, including a general store, a post office, a gas station, and a few restaurants. The area is also home to a number of small farms, which produce a variety of crops, including corn, soybeans, and hay.
Demographics
As of the 2010 census, White Mills had a population of 1,072. The racial makeup of the community was 97.3% White, 0.9% African American, 0.2% Native American, 0.2% Asian, and 1.4% from other races. The median household income was $41,250, and the median family income was $50,000. The per capita income was $20,945.
Conclusion
White Mills is a small, rural community located in the Pocono Mountains of northeastern Pennsylvania. The community is situated along the Lackawaxen River, and is home to a variety of businesses, including a general store, a post office, a gas station, and a few restaurants. The primary industries in the area are tourism and agriculture. As of the 2010 census, White Mills had a population of 1,072, with a median household income of $41,250.
Common Questions
What is Per Capita Income in White Mills?
Per Capita income in White Mills is $29,016.
What is the Median Family Income in White Mills?
Median Family Income in White Mills is $37,679.
What is the Median Household income in White Mills?
Median Household Income in White Mills is $43,707.
What is Income or Wage Gap in White Mills?
Income or Wage Gap in White Mills is 68.5%.
Women in White Mills earn 31.5 cents for every dollar earned by a man.
What is Inequality or Gini Index in White Mills?
Inequality or Gini Index in White Mills is 0.49.
What is the Total Population of White Mills?
Total Population of White Mills is 746.
What is the Total Male Population of White Mills?
Total Male Population of White Mills is 336.
What is the Total Female Population of White Mills?
Total Female Population of White Mills is 410.
What is the Ratio of Males per 100 Females in White Mills?
There are 81.95 Males per 100 Females in White Mills.
What is the Ratio of Females per 100 Males in White Mills?
There are 122.02 Females per 100 Males in White Mills.
What is the Median Population Age in White Mills?
Median Population Age in White Mills is 44.8 Years.
What is the Average Family Size in White Mills
Average Family Size in White Mills is 3.0 People.
What is the Average Household Size in White Mills
Average Household Size in White Mills is 2.1 People.
How Large is the Labor Force in White Mills?
There are 409 People in the Labor Forcein in White Mills.
What is the Percentage of People in the Labor Force in White Mills?
62.7% of People are in the Labor Force in White Mills.
What is the Unemployment Rate in White Mills?
Unemployment Rate in White Mills is 6.6%.