Manorville borough, PA Map & Demographics
Manorville borough Overview
$34,769
PER CAPITA INCOME
$92,000
AVG FAMILY INCOME
$73,843
AVG HOUSEHOLD INCOME
23.1%
WAGE / INCOME GAP [ % ]
76.9¢/ $1
WAGE / INCOME GAP [ $ ]
0.34
INEQUALITY / GINI INDEX
426
TOTAL POPULATION
209
MALE POPULATION
217
FEMALE POPULATION
96.31
MALES / 100 FEMALES
103.83
FEMALES / 100 MALES
46.3
MEDIAN AGE
3.4
AVG FAMILY SIZE
2.4
AVG HOUSEHOLD SIZE
203
LABOR FORCE [ PEOPLE ]
56.9%
PERCENT IN LABOR FORCE
8.5%
UNEMPLOYMENT RATE
Income in Manorville borough
Income Overview in Manorville borough
Per Capita Income in Manorville borough is $34,769, while median incomes of families and households are $92,000 and $73,843 respectively.
| Characteristic | Number | Measure |
| Per Capita Income | 426 | $34,769 |
| Median Family Income | 100 | $92,000 |
| Mean Family Income | 100 | $99,244 |
| Median Household Income | 175 | $73,843 |
| Mean Household Income | 175 | $79,191 |
| Income Deficit | 100 | $0 |
| Wage / Income Gap (%) | 426 | 23.08% |
| Wage / Income Gap ($) | 426 | 76.92¢ per $1 |
| Gini / Inequality Index | 426 | 0.34 |
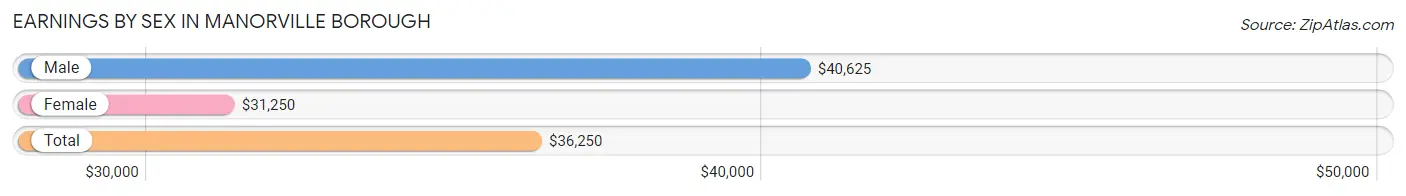
Earnings by Sex in Manorville borough
Average Earnings in Manorville borough are $36,250, $40,625 for men and $31,250 for women, a difference of 23.1%.
| Sex | Number | Average Earnings |
| Male | 97 (46.9%) | $40,625 |
| Female | 110 (53.1%) | $31,250 |
| Total | 207 (100.0%) | $36,250 |
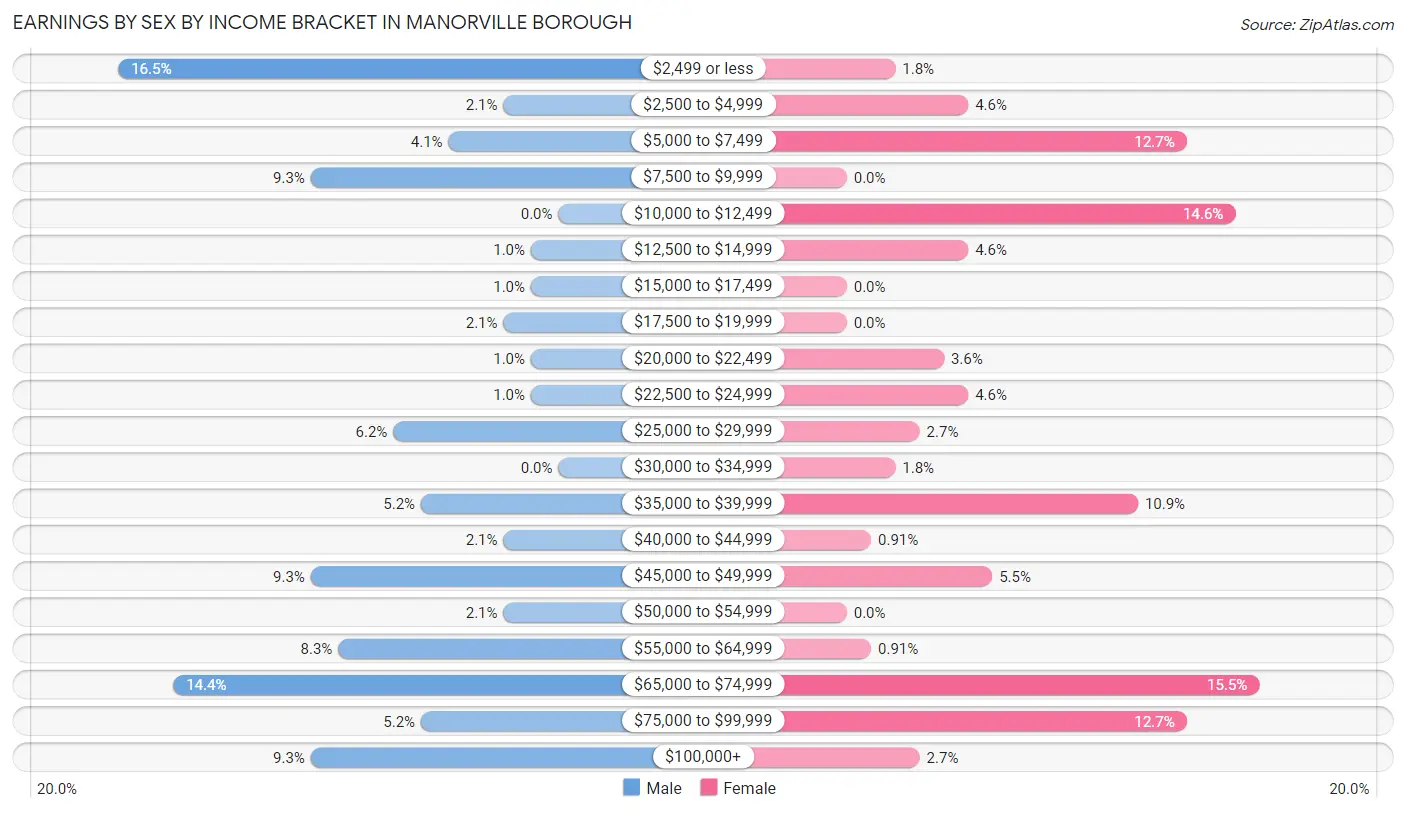
Earnings by Sex by Income Bracket in Manorville borough
The most common earnings brackets in Manorville borough are $2,499 or less for men (16 | 16.5%) and $65,000 to $74,999 for women (17 | 15.4%).
| Income | Male | Female |
| $2,499 or less | 16 (16.5%) | 2 (1.8%) |
| $2,500 to $4,999 | 2 (2.1%) | 5 (4.5%) |
| $5,000 to $7,499 | 4 (4.1%) | 14 (12.7%) |
| $7,500 to $9,999 | 9 (9.3%) | 0 (0.0%) |
| $10,000 to $12,499 | 0 (0.0%) | 16 (14.5%) |
| $12,500 to $14,999 | 1 (1.0%) | 5 (4.5%) |
| $15,000 to $17,499 | 1 (1.0%) | 0 (0.0%) |
| $17,500 to $19,999 | 2 (2.1%) | 0 (0.0%) |
| $20,000 to $22,499 | 1 (1.0%) | 4 (3.6%) |
| $22,500 to $24,999 | 1 (1.0%) | 5 (4.5%) |
| $25,000 to $29,999 | 6 (6.2%) | 3 (2.7%) |
| $30,000 to $34,999 | 0 (0.0%) | 2 (1.8%) |
| $35,000 to $39,999 | 5 (5.1%) | 12 (10.9%) |
| $40,000 to $44,999 | 2 (2.1%) | 1 (0.9%) |
| $45,000 to $49,999 | 9 (9.3%) | 6 (5.4%) |
| $50,000 to $54,999 | 2 (2.1%) | 0 (0.0%) |
| $55,000 to $64,999 | 8 (8.3%) | 1 (0.9%) |
| $65,000 to $74,999 | 14 (14.4%) | 17 (15.4%) |
| $75,000 to $99,999 | 5 (5.1%) | 14 (12.7%) |
| $100,000+ | 9 (9.3%) | 3 (2.7%) |
| Total | 97 (100.0%) | 110 (100.0%) |
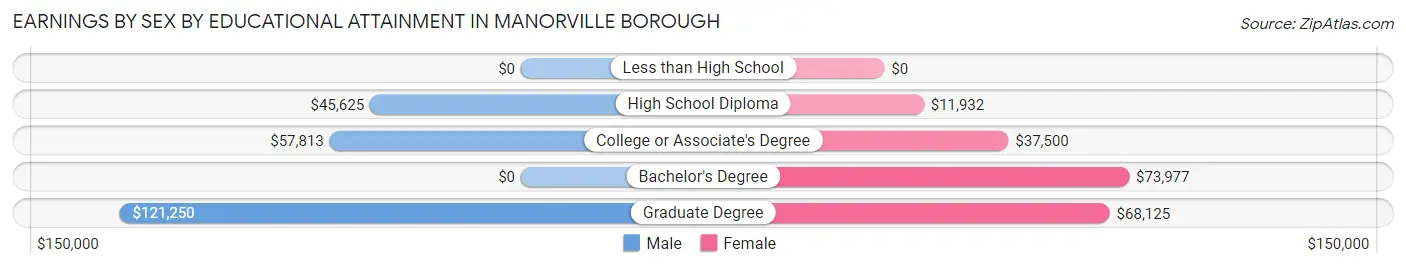
Earnings by Sex by Educational Attainment in Manorville borough
Average earnings in Manorville borough are $54,375 for men and $35,417 for women, a difference of 34.9%. Men with an educational attainment of graduate degree enjoy the highest average annual earnings of $121,250, while those with high school diploma education earn the least with $45,625. Women with an educational attainment of bachelor's degree earn the most with the average annual earnings of $73,977, while those with high school diploma education have the smallest earnings of $11,932.
| Educational Attainment | Male Income | Female Income |
| Less than High School | - | - |
| High School Diploma | $45,625 | $11,932 |
| College or Associate's Degree | $57,813 | $37,500 |
| Bachelor's Degree | - | - |
| Graduate Degree | $121,250 | $68,125 |
| Total | $54,375 | $35,417 |
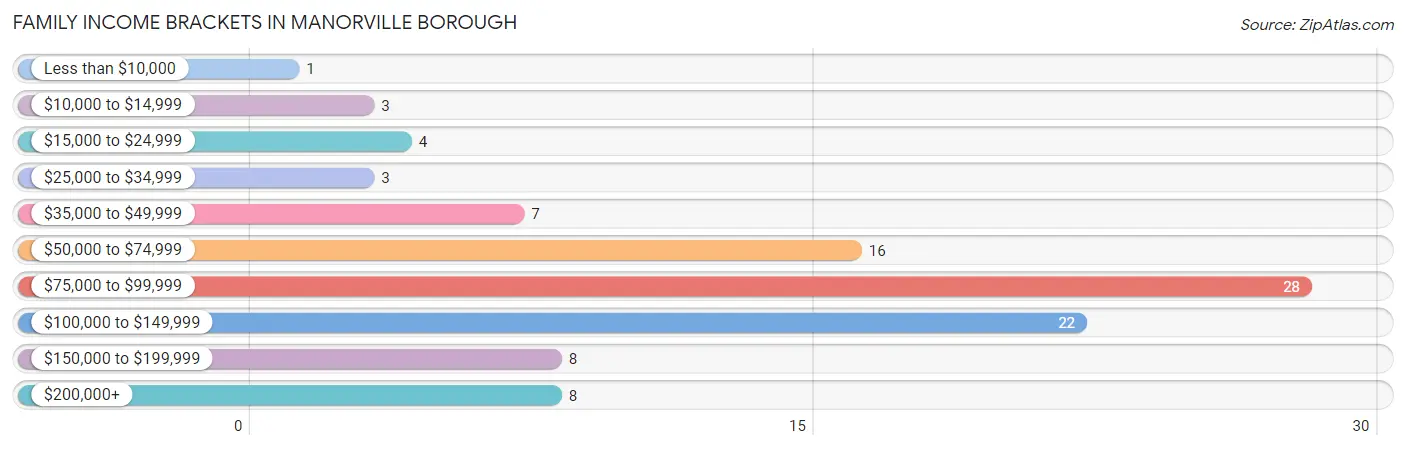
Family Income in Manorville borough
Family Income Brackets in Manorville borough
According to the Manorville borough family income data, there are 28 families falling into the $75,000 to $99,999 income range, which is the most common income bracket and makes up 28.0% of all families. Conversely, the less than $10,000 income bracket is the least frequent group with only 1 families (1.0%) belonging to this category.
| Income Bracket | # Families | % Families |
| Less than $10,000 | 1 | 1.0% |
| $10,000 to $14,999 | 3 | 3.0% |
| $15,000 to $24,999 | 4 | 4.0% |
| $25,000 to $34,999 | 3 | 3.0% |
| $35,000 to $49,999 | 7 | 7.0% |
| $50,000 to $74,999 | 16 | 16.0% |
| $75,000 to $99,999 | 28 | 28.0% |
| $100,000 to $149,999 | 22 | 22.0% |
| $150,000 to $199,999 | 8 | 8.0% |
| $200,000+ | 8 | 8.0% |
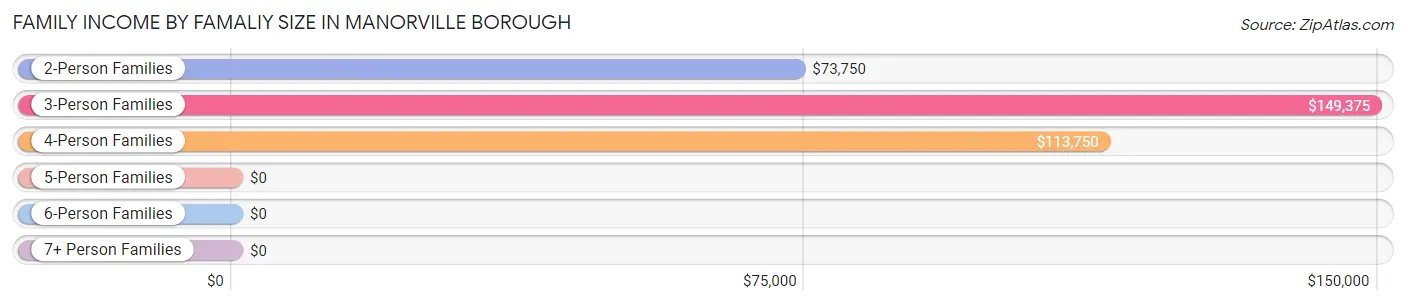
Family Income by Famaliy Size in Manorville borough
3-person families (21 | 21.0%) account for the highest median family income in Manorville borough with $149,375 per family, while 3-person families (21 | 21.0%) have the highest median income of $49,792 per family member.
| Income Bracket | # Families | Median Income |
| 2-Person Families | 54 (54.0%) | $73,750 |
| 3-Person Families | 21 (21.0%) | $149,375 |
| 4-Person Families | 10 (10.0%) | $113,750 |
| 5-Person Families | 5 (5.0%) | $0 |
| 6-Person Families | 10 (10.0%) | $0 |
| 7+ Person Families | 0 (0.0%) | $0 |
| Total | 100 (100.0%) | $92,000 |
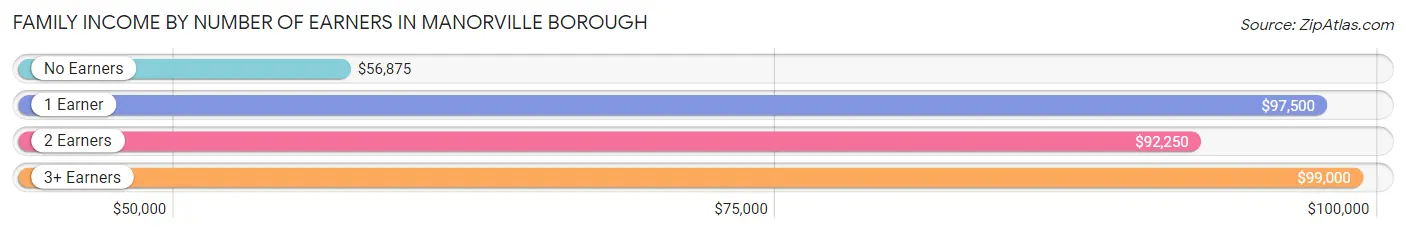
Family Income by Number of Earners in Manorville borough
The median family income in Manorville borough is $92,000, with families comprising 3+ earners (18) having the highest median family income of $99,000, while families with no earners (19) have the lowest median family income of $56,875, accounting for 18.0% and 19.0% of families, respectively.
| Number of Earners | # Families | Median Income |
| No Earners | 19 (19.0%) | $56,875 |
| 1 Earner | 22 (22.0%) | $97,500 |
| 2 Earners | 41 (41.0%) | $92,250 |
| 3+ Earners | 18 (18.0%) | $99,000 |
| Total | 100 (100.0%) | $92,000 |
Household Income in Manorville borough
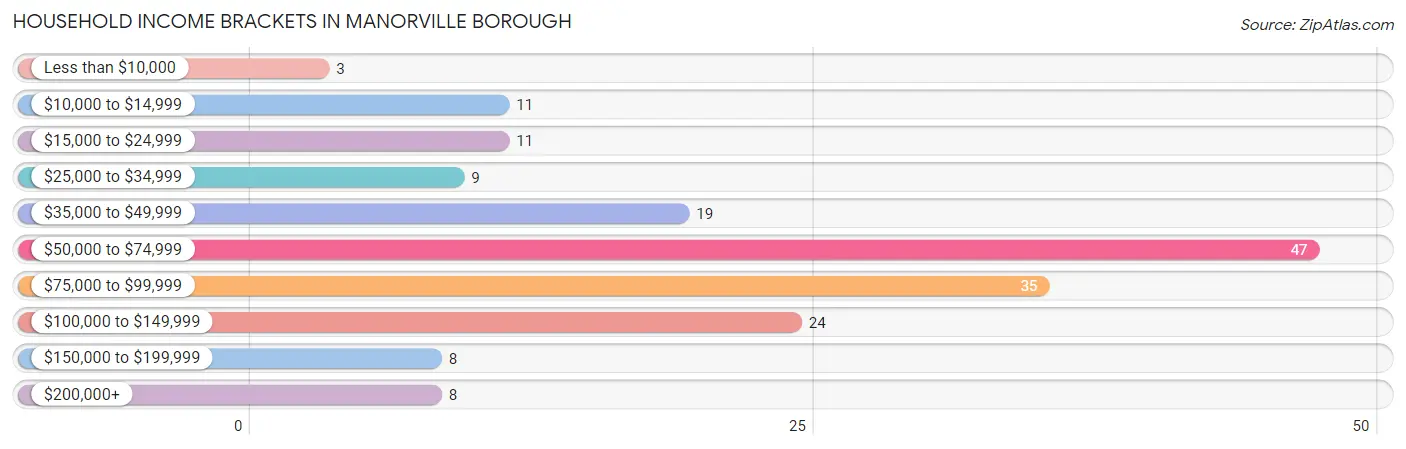
Household Income Brackets in Manorville borough
With 47 households falling in the category, the $50,000 to $74,999 income range is the most frequent in Manorville borough, accounting for 26.9% of all households. In contrast, only 3 households (1.7%) fall into the less than $10,000 income bracket, making it the least populous group.
| Income Bracket | # Households | % Households |
| Less than $10,000 | 3 | 1.7% |
| $10,000 to $14,999 | 11 | 6.3% |
| $15,000 to $24,999 | 11 | 6.3% |
| $25,000 to $34,999 | 9 | 5.1% |
| $35,000 to $49,999 | 19 | 10.9% |
| $50,000 to $74,999 | 47 | 26.9% |
| $75,000 to $99,999 | 35 | 20.0% |
| $100,000 to $149,999 | 24 | 13.7% |
| $150,000 to $199,999 | 8 | 4.6% |
| $200,000+ | 8 | 4.6% |
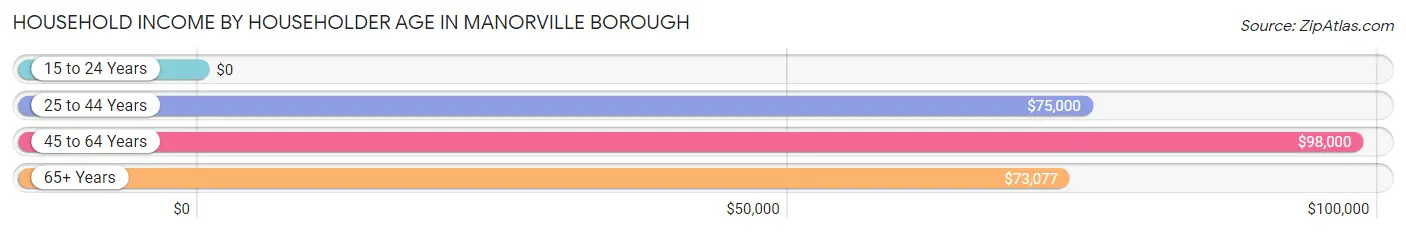
Household Income by Householder Age in Manorville borough
The median household income in Manorville borough is $73,843, with the highest median household income of $98,000 found in the 45 to 64 years age bracket for the primary householder. A total of 78 households (44.6%) fall into this category. Meanwhile, the 15 to 24 years age bracket for the primary householder has the lowest median household income of $0, with 3 households (1.7%) in this group.
| Income Bracket | # Households | Median Income |
| 15 to 24 Years | 3 (1.7%) | $0 |
| 25 to 44 Years | 26 (14.9%) | $75,000 |
| 45 to 64 Years | 78 (44.6%) | $98,000 |
| 65+ Years | 68 (38.9%) | $73,077 |
| Total | 175 (100.0%) | $73,843 |
Poverty in Manorville borough
Income Below Poverty by Sex and Age in Manorville borough
With 1.4% poverty level for males and 7.4% for females among the residents of Manorville borough, 18 to 24 year old males and 5 year old females are the most vulnerable to poverty, with 2 males (8.7%) and 1 females (100.0%) in their respective age groups living below the poverty level.
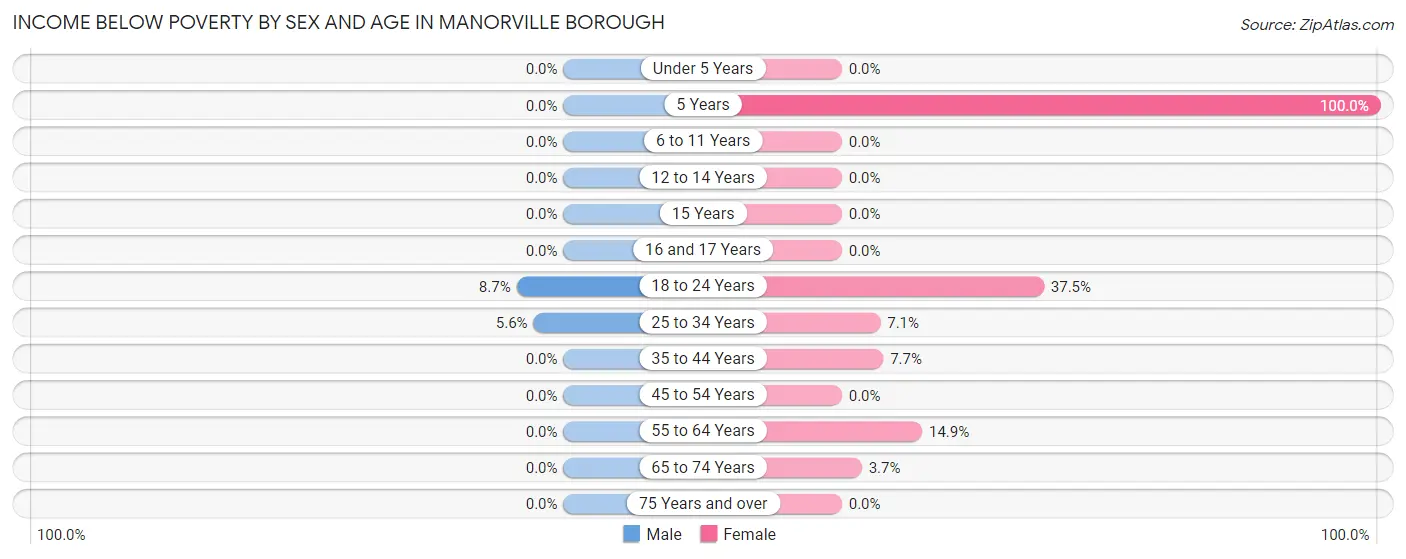
| Age Bracket | Male | Female |
| Under 5 Years | 0 (0.0%) | 0 (0.0%) |
| 5 Years | 0 (0.0%) | 1 (100.0%) |
| 6 to 11 Years | 0 (0.0%) | 0 (0.0%) |
| 12 to 14 Years | 0 (0.0%) | 0 (0.0%) |
| 15 Years | 0 (0.0%) | 0 (0.0%) |
| 16 and 17 Years | 0 (0.0%) | 0 (0.0%) |
| 18 to 24 Years | 2 (8.7%) | 3 (37.5%) |
| 25 to 34 Years | 1 (5.6%) | 1 (7.1%) |
| 35 to 44 Years | 0 (0.0%) | 3 (7.7%) |
| 45 to 54 Years | 0 (0.0%) | 0 (0.0%) |
| 55 to 64 Years | 0 (0.0%) | 7 (14.9%) |
| 65 to 74 Years | 0 (0.0%) | 1 (3.7%) |
| 75 Years and over | 0 (0.0%) | 0 (0.0%) |
| Total | 3 (1.4%) | 16 (7.4%) |
Income Above Poverty by Sex and Age in Manorville borough
According to the poverty statistics in Manorville borough, males aged under 5 years and females aged 6 to 11 years are the age groups that are most secure financially, with 100.0% of males and 100.0% of females in these age groups living above the poverty line.
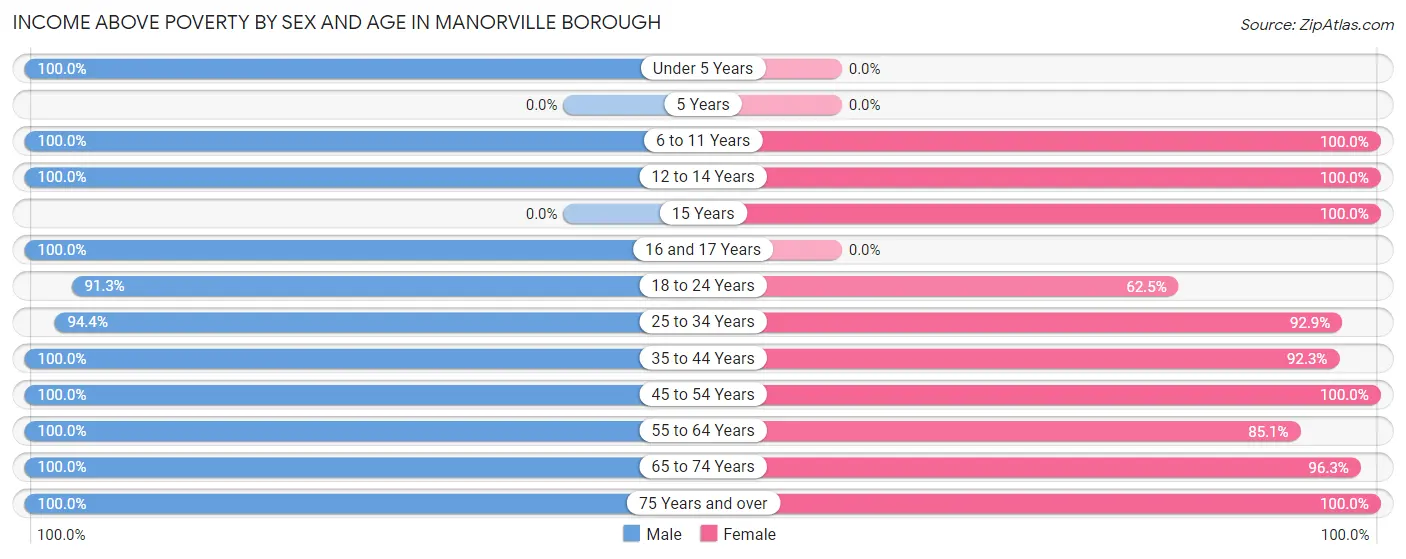
| Age Bracket | Male | Female |
| Under 5 Years | 2 (100.0%) | 0 (0.0%) |
| 5 Years | 0 (0.0%) | 0 (0.0%) |
| 6 to 11 Years | 4 (100.0%) | 6 (100.0%) |
| 12 to 14 Years | 9 (100.0%) | 38 (100.0%) |
| 15 Years | 0 (0.0%) | 9 (100.0%) |
| 16 and 17 Years | 14 (100.0%) | 0 (0.0%) |
| 18 to 24 Years | 21 (91.3%) | 5 (62.5%) |
| 25 to 34 Years | 17 (94.4%) | 13 (92.9%) |
| 35 to 44 Years | 8 (100.0%) | 36 (92.3%) |
| 45 to 54 Years | 23 (100.0%) | 16 (100.0%) |
| 55 to 64 Years | 55 (100.0%) | 40 (85.1%) |
| 65 to 74 Years | 41 (100.0%) | 26 (96.3%) |
| 75 Years and over | 12 (100.0%) | 12 (100.0%) |
| Total | 206 (98.6%) | 201 (92.6%) |
Income Below Poverty Among Married-Couple Families in Manorville borough
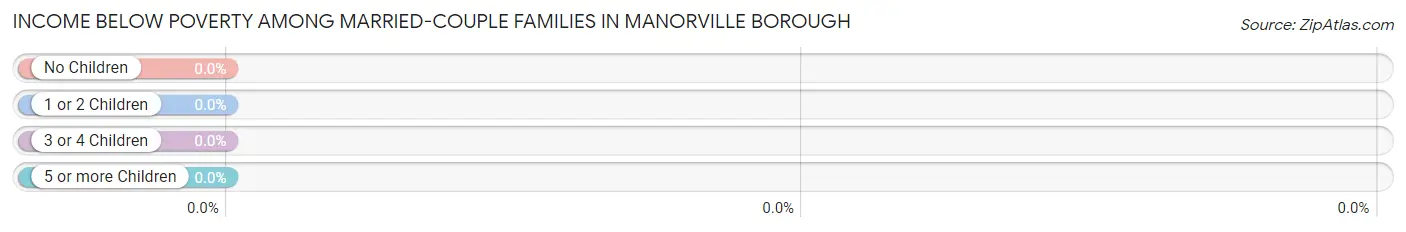
| Children | Above Poverty | Below Poverty |
| No Children | 54 (100.0%) | 0 (0.0%) |
| 1 or 2 Children | 25 (100.0%) | 0 (0.0%) |
| 3 or 4 Children | 10 (100.0%) | 0 (0.0%) |
| 5 or more Children | 0 (0.0%) | 0 (0.0%) |
| Total | 89 (100.0%) | 0 (0.0%) |
Income Below Poverty Among Single-Parent Households in Manorville borough
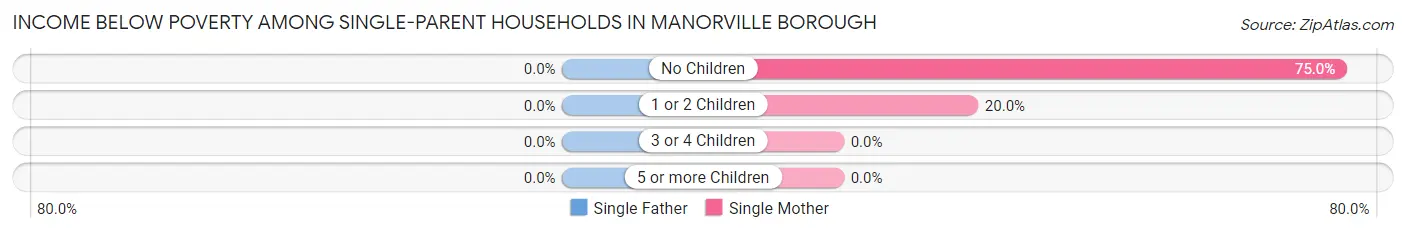
| Children | Single Father | Single Mother |
| No Children | 0 (0.0%) | 3 (75.0%) |
| 1 or 2 Children | 0 (0.0%) | 1 (20.0%) |
| 3 or 4 Children | 0 (0.0%) | 0 (0.0%) |
| 5 or more Children | 0 (0.0%) | 0 (0.0%) |
| Total | 0 (0.0%) | 4 (44.4%) |
Income Below Poverty Among Married-Couple vs Single-Parent Households in Manorville borough
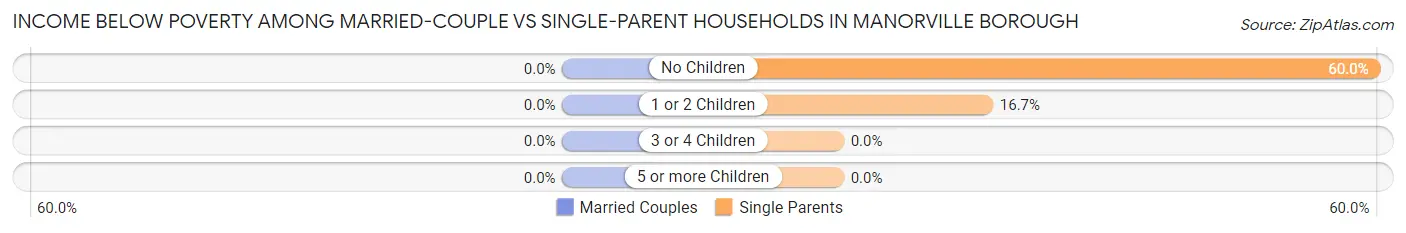
| Children | Married-Couple Families | Single-Parent Households |
| No Children | 0 (0.0%) | 3 (60.0%) |
| 1 or 2 Children | 0 (0.0%) | 1 (16.7%) |
| 3 or 4 Children | 0 (0.0%) | 0 (0.0%) |
| 5 or more Children | 0 (0.0%) | 0 (0.0%) |
| Total | 0 (0.0%) | 4 (36.4%) |
Race in Manorville borough
The most populous races in Manorville borough are White / Caucasian (407 | 95.5%), Two or more Races (17 | 4.0%), and Black / African American (2 | 0.5%).
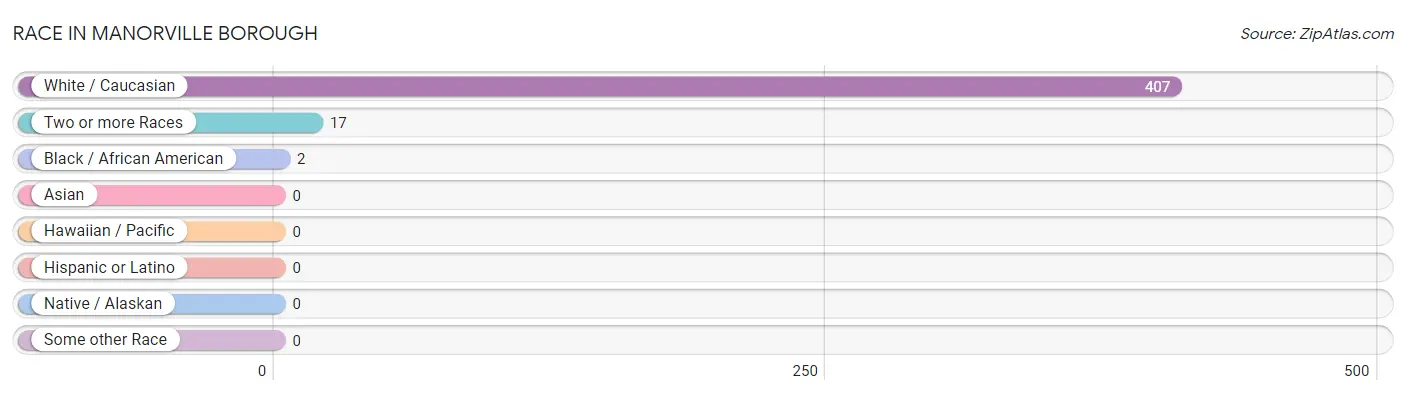
| Race | # Population | % Population |
| Asian | 0 | 0.0% |
| Black / African American | 2 | 0.5% |
| Hawaiian / Pacific | 0 | 0.0% |
| Hispanic or Latino | 0 | 0.0% |
| Native / Alaskan | 0 | 0.0% |
| White / Caucasian | 407 | 95.5% |
| Two or more Races | 17 | 4.0% |
| Some other Race | 0 | 0.0% |
| Total | 426 | 100.0% |
Ancestry in Manorville borough
The most populous ancestries reported in Manorville borough are German (255 | 59.9%), Irish (138 | 32.4%), Italian (76 | 17.8%), English (40 | 9.4%), and Scotch-Irish (39 | 9.1%), together accounting for 128.6% of all Manorville borough residents.
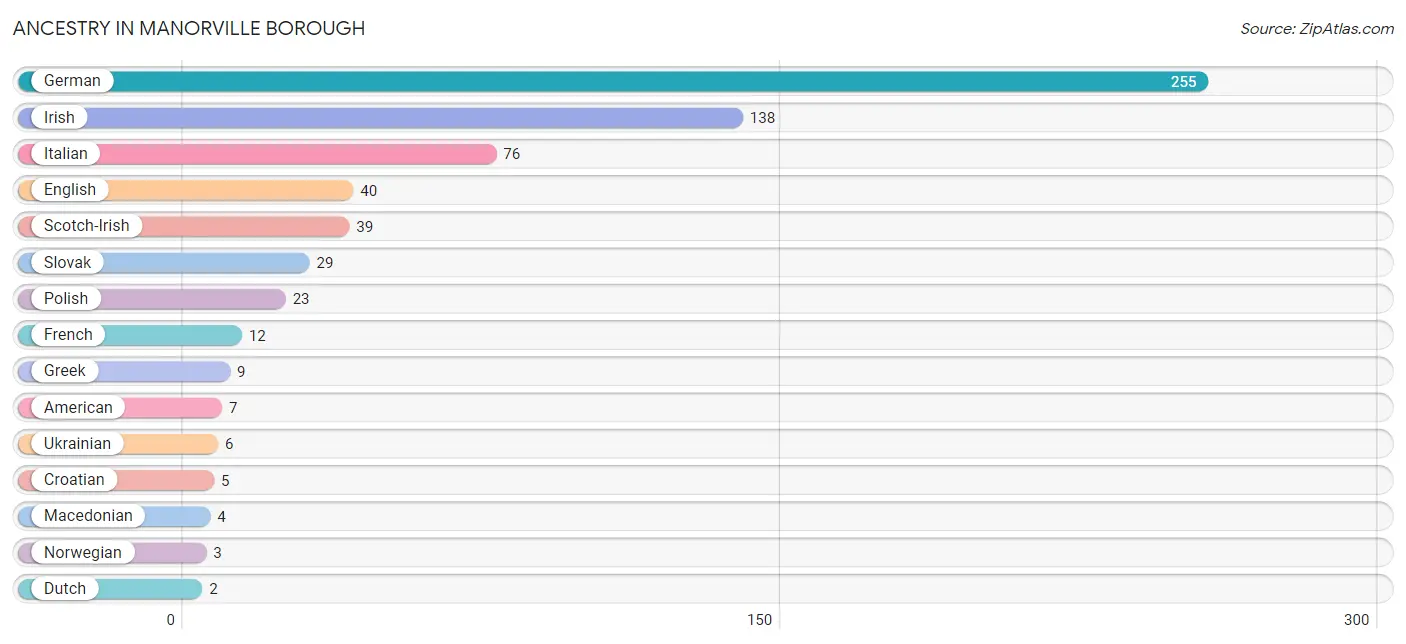
| Ancestry | # Population | % Population |
| American | 7 | 1.6% |
| Croatian | 5 | 1.2% |
| Dutch | 2 | 0.5% |
| English | 40 | 9.4% |
| French | 12 | 2.8% |
| German | 255 | 59.9% |
| Greek | 9 | 2.1% |
| Irish | 138 | 32.4% |
| Italian | 76 | 17.8% |
| Macedonian | 4 | 0.9% |
| Norwegian | 3 | 0.7% |
| Polish | 23 | 5.4% |
| Scotch-Irish | 39 | 9.1% |
| Slovak | 29 | 6.8% |
| Swedish | 1 | 0.2% |
| Ukrainian | 6 | 1.4% | View All 16 Rows |
Immigrants in Manorville borough

| Immigration Origin | # Population | % Population | View All 0 Rows |
Sex and Age in Manorville borough
Sex and Age in Manorville borough
The most populous age groups in Manorville borough are 60 to 64 Years (47 | 22.5%) for men and 10 to 14 Years (40 | 18.4%) for women.
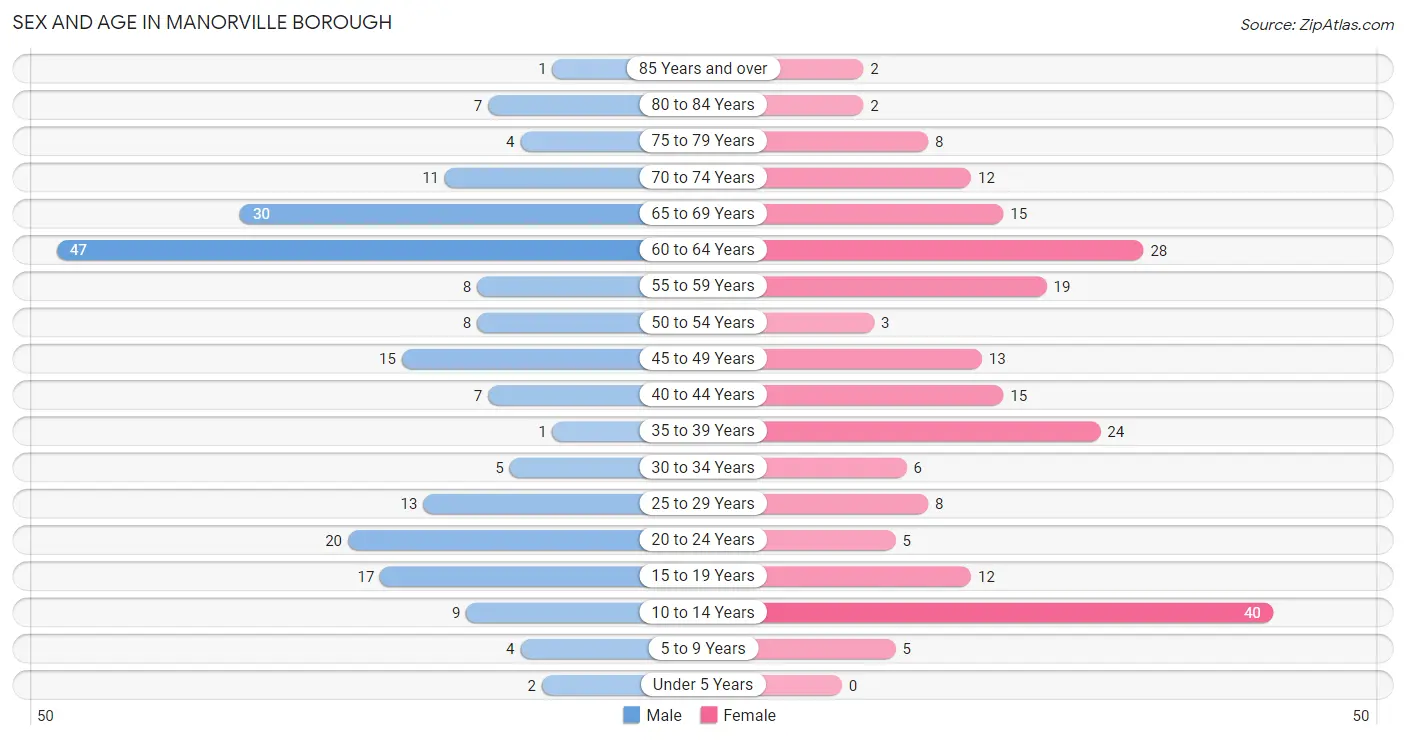
| Age Bracket | Male | Female |
| Under 5 Years | 2 (1.0%) | 0 (0.0%) |
| 5 to 9 Years | 4 (1.9%) | 5 (2.3%) |
| 10 to 14 Years | 9 (4.3%) | 40 (18.4%) |
| 15 to 19 Years | 17 (8.1%) | 12 (5.5%) |
| 20 to 24 Years | 20 (9.6%) | 5 (2.3%) |
| 25 to 29 Years | 13 (6.2%) | 8 (3.7%) |
| 30 to 34 Years | 5 (2.4%) | 6 (2.8%) |
| 35 to 39 Years | 1 (0.5%) | 24 (11.1%) |
| 40 to 44 Years | 7 (3.4%) | 15 (6.9%) |
| 45 to 49 Years | 15 (7.2%) | 13 (6.0%) |
| 50 to 54 Years | 8 (3.8%) | 3 (1.4%) |
| 55 to 59 Years | 8 (3.8%) | 19 (8.8%) |
| 60 to 64 Years | 47 (22.5%) | 28 (12.9%) |
| 65 to 69 Years | 30 (14.3%) | 15 (6.9%) |
| 70 to 74 Years | 11 (5.3%) | 12 (5.5%) |
| 75 to 79 Years | 4 (1.9%) | 8 (3.7%) |
| 80 to 84 Years | 7 (3.4%) | 2 (0.9%) |
| 85 Years and over | 1 (0.5%) | 2 (0.9%) |
| Total | 209 (100.0%) | 217 (100.0%) |
Families and Households in Manorville borough
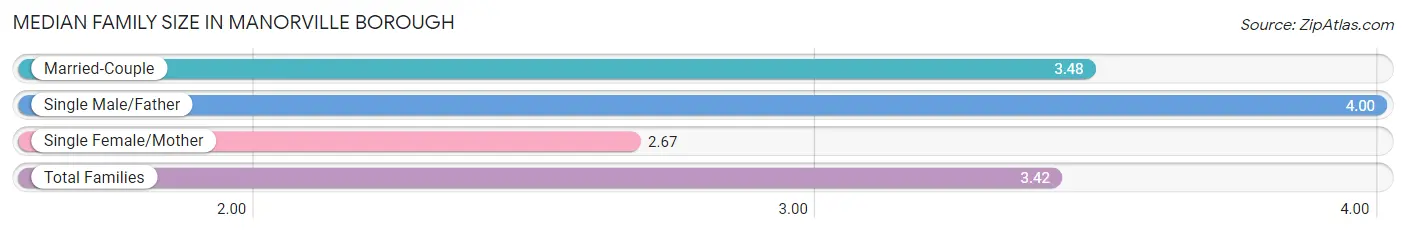
Median Family Size in Manorville borough
The median family size in Manorville borough is 3.42 persons per family, with single male/father families (2 | 2.0%) accounting for the largest median family size of 4 persons per family. On the other hand, single female/mother families (9 | 9.0%) represent the smallest median family size with 2.67 persons per family.
| Family Type | # Families | Family Size |
| Married-Couple | 89 (89.0%) | 3.48 |
| Single Male/Father | 2 (2.0%) | 4.00 |
| Single Female/Mother | 9 (9.0%) | 2.67 |
| Total Families | 100 (100.0%) | 3.42 |
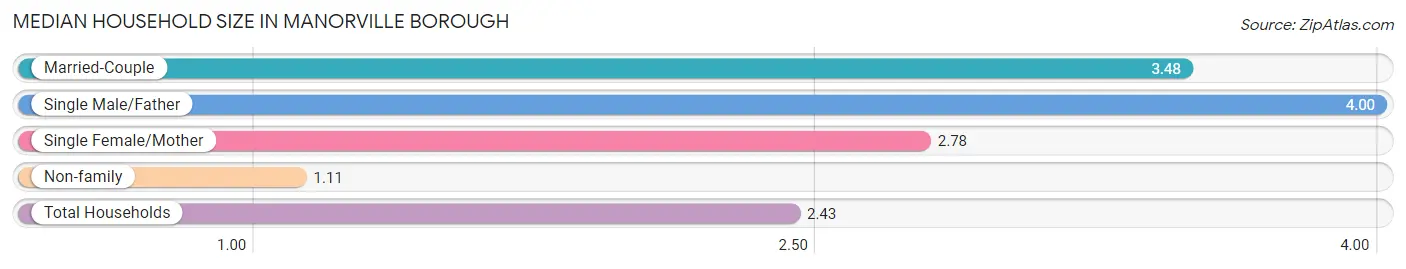
Median Household Size in Manorville borough
The median household size in Manorville borough is 2.43 persons per household, with single male/father households (2 | 1.1%) accounting for the largest median household size of 4 persons per household. non-family households (75 | 42.9%) represent the smallest median household size with 1.11 persons per household.
| Household Type | # Households | Household Size |
| Married-Couple | 89 (50.9%) | 3.48 |
| Single Male/Father | 2 (1.1%) | 4.00 |
| Single Female/Mother | 9 (5.1%) | 2.78 |
| Non-family | 75 (42.9%) | 1.11 |
| Total Households | 175 (100.0%) | 2.43 |
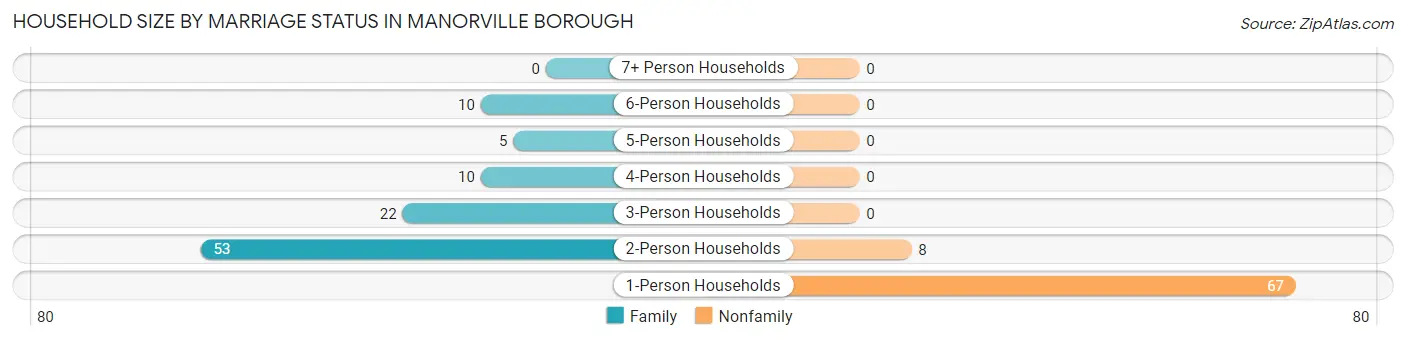
Household Size by Marriage Status in Manorville borough
Out of a total of 175 households in Manorville borough, 100 (57.1%) are family households, while 75 (42.9%) are nonfamily households. The most numerous type of family households are 2-person households, comprising 53, and the most common type of nonfamily households are 1-person households, comprising 67.
| Household Size | Family Households | Nonfamily Households |
| 1-Person Households | - | 67 (38.3%) |
| 2-Person Households | 53 (30.3%) | 8 (4.6%) |
| 3-Person Households | 22 (12.6%) | 0 (0.0%) |
| 4-Person Households | 10 (5.7%) | 0 (0.0%) |
| 5-Person Households | 5 (2.9%) | 0 (0.0%) |
| 6-Person Households | 10 (5.7%) | 0 (0.0%) |
| 7+ Person Households | 0 (0.0%) | 0 (0.0%) |
| Total | 100 (57.1%) | 75 (42.9%) |
Female Fertility in Manorville borough
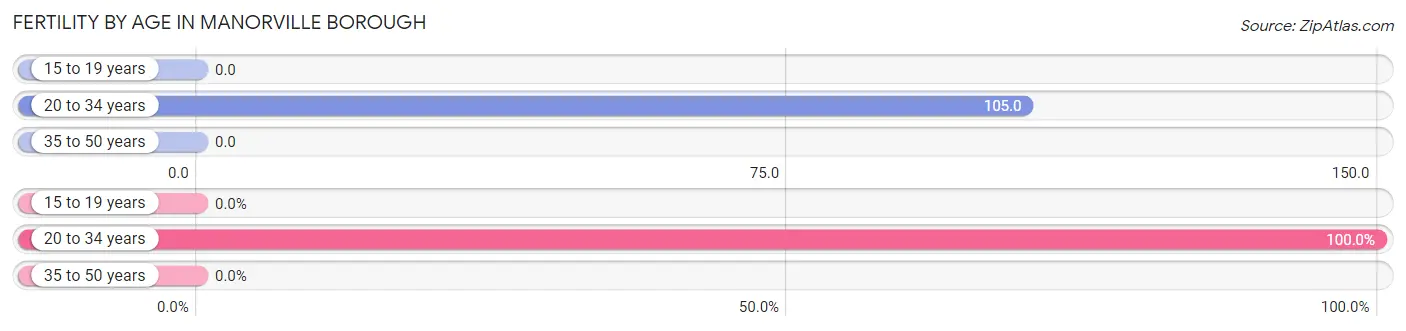
Fertility by Age in Manorville borough
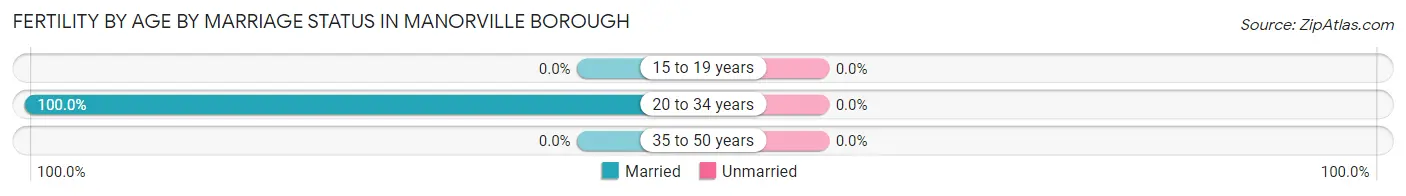
Average fertility rate in Manorville borough is 24.0 births per 1,000 women. Women in the age bracket of 20 to 34 years have the highest fertility rate with 105.0 births per 1,000 women. Women in the age bracket of 20 to 34 years acount for 100.0% of all women with births.
| Age Bracket | Women with Births | Births / 1,000 Women |
| 15 to 19 years | 0 (0.0%) | 0.0 |
| 20 to 34 years | 2 (100.0%) | 105.0 |
| 35 to 50 years | 0 (0.0%) | 0.0 |
| Total | 2 (100.0%) | 24.0 |
Fertility by Age by Marriage Status in Manorville borough
| Age Bracket | Married | Unmarried |
| 15 to 19 years | 0 (0.0%) | 0 (0.0%) |
| 20 to 34 years | 2 (100.0%) | 0 (0.0%) |
| 35 to 50 years | 0 (0.0%) | 0 (0.0%) |
| Total | 2 (100.0%) | 0 (0.0%) |
Fertility by Education in Manorville borough
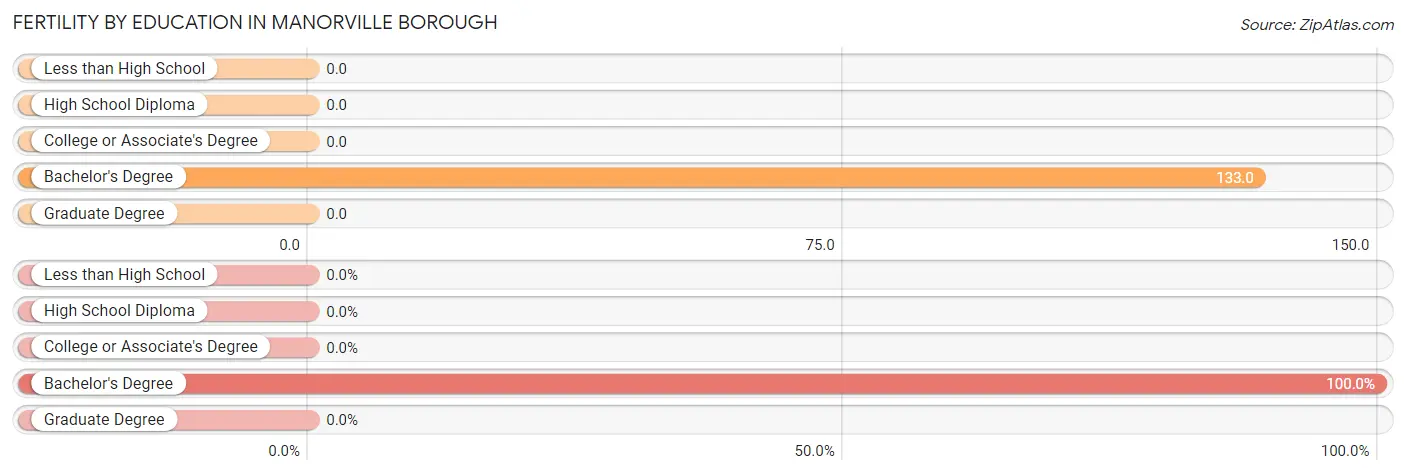
| Educational Attainment | Women with Births | Births / 1,000 Women |
| Less than High School | 0 (0.0%) | 0.0 |
| High School Diploma | 0 (0.0%) | 0.0 |
| College or Associate's Degree | 0 (0.0%) | 0.0 |
| Bachelor's Degree | 2 (100.0%) | 133.0 |
| Graduate Degree | 0 (0.0%) | 0.0 |
| Total | 2 (100.0%) | 24.0 |
Fertility by Education by Marriage Status in Manorville borough
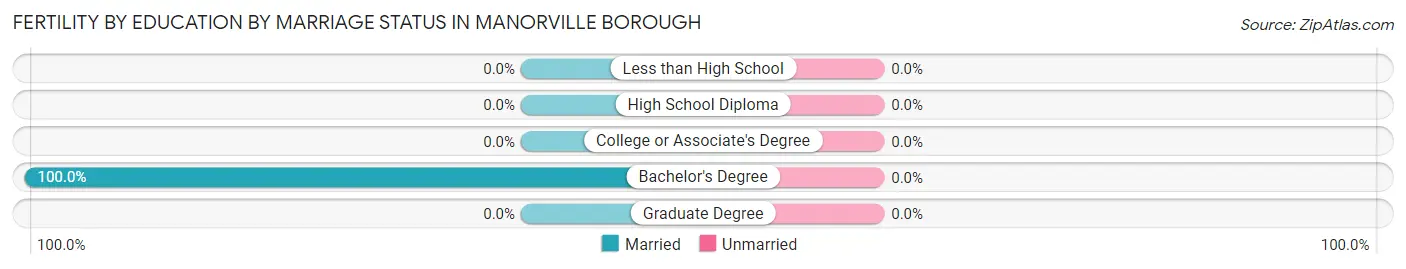
| Educational Attainment | Married | Unmarried |
| Less than High School | 0 (0.0%) | 0 (0.0%) |
| High School Diploma | 0 (0.0%) | 0 (0.0%) |
| College or Associate's Degree | 0 (0.0%) | 0 (0.0%) |
| Bachelor's Degree | 2 (100.0%) | 0 (0.0%) |
| Graduate Degree | 0 (0.0%) | 0 (0.0%) |
| Total | 2 (100.0%) | 0 (0.0%) |
Employment Characteristics in Manorville borough
Employment by Class of Employer in Manorville borough
Among the 186 employed individuals in Manorville borough, private company employees (118 | 63.4%), not-for-profit organizations (47 | 25.3%), and state government employees (8 | 4.3%) make up the most common classes of employment.
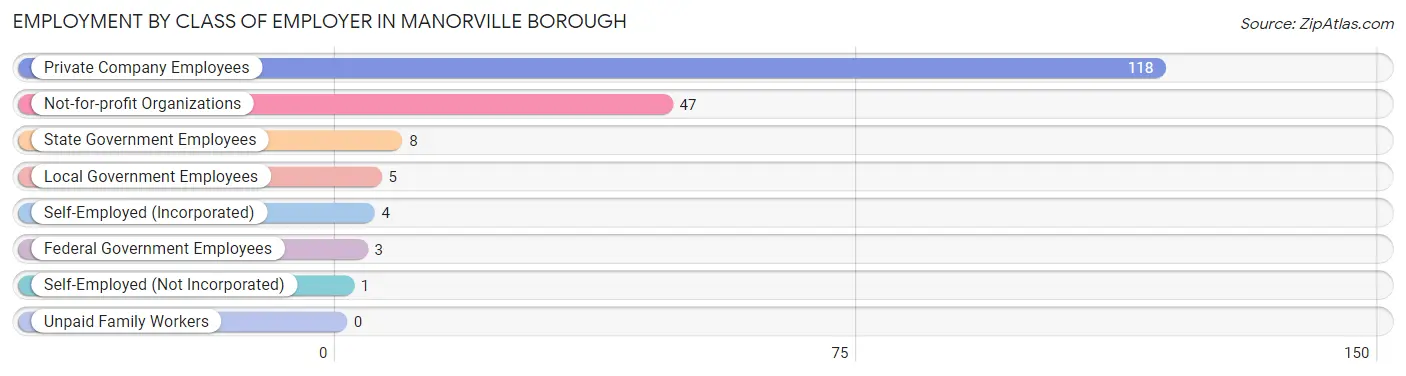
| Employer Class | # Employees | % Employees |
| Private Company Employees | 118 | 63.4% |
| Self-Employed (Incorporated) | 4 | 2.1% |
| Self-Employed (Not Incorporated) | 1 | 0.5% |
| Not-for-profit Organizations | 47 | 25.3% |
| Local Government Employees | 5 | 2.7% |
| State Government Employees | 8 | 4.3% |
| Federal Government Employees | 3 | 1.6% |
| Unpaid Family Workers | 0 | 0.0% |
| Total | 186 | 100.0% |
Employment Status by Age in Manorville borough
According to the labor force statistics for Manorville borough, out of the total population over 16 years of age (357), 56.9% or 203 individuals are in the labor force, with 8.5% or 17 of them unemployed. The age group with the highest labor force participation rate is 30 to 34 years, with 100.0% or 11 individuals in the labor force. Within the labor force, the 35 to 44 years age range has the highest percentage of unemployed individuals, with 26.7% or 13 of them being unemployed.
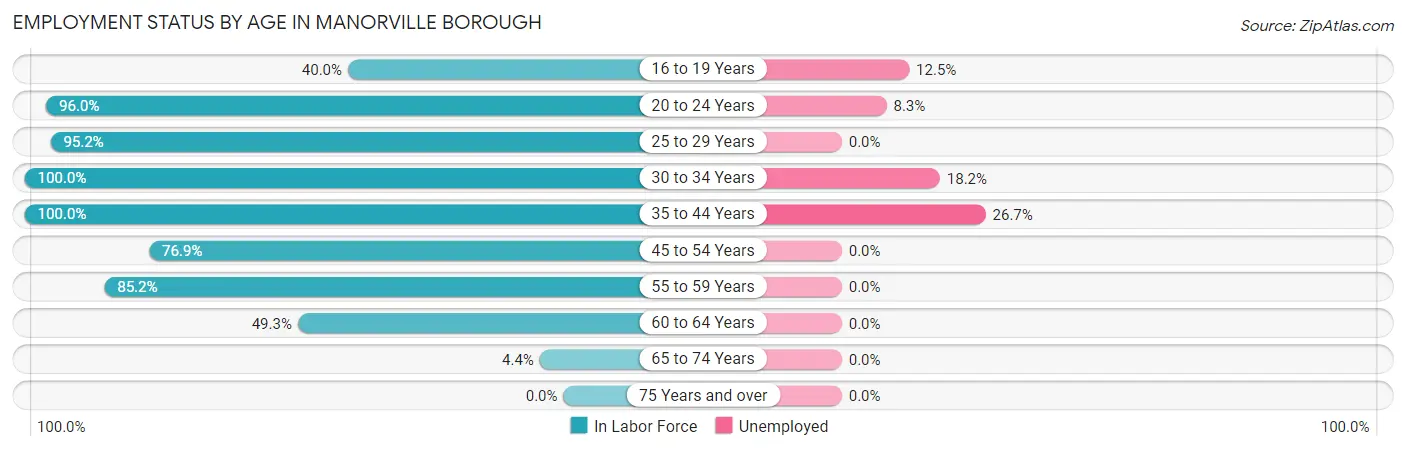
| Age Bracket | In Labor Force | Unemployed |
| 16 to 19 Years | 8 (40.0%) | 1 (12.5%) |
| 20 to 24 Years | 24 (96.0%) | 2 (8.3%) |
| 25 to 29 Years | 20 (95.2%) | 0 (0.0%) |
| 30 to 34 Years | 11 (100.0%) | 2 (18.2%) |
| 35 to 44 Years | 47 (100.0%) | 13 (26.7%) |
| 45 to 54 Years | 30 (76.9%) | 0 (0.0%) |
| 55 to 59 Years | 23 (85.2%) | 0 (0.0%) |
| 60 to 64 Years | 37 (49.3%) | 0 (0.0%) |
| 65 to 74 Years | 3 (4.4%) | 0 (0.0%) |
| 75 Years and over | 0 (0.0%) | 0 (0.0%) |
| Total | 203 (56.9%) | 17 (8.5%) |
Employment Status by Educational Attainment in Manorville borough
According to labor force statistics for Manorville borough, 76.4% of individuals (168) out of the total population between 25 and 64 years of age (220) are in the labor force, with 8.4% or 14 of them being unemployed. The group with the highest labor force participation rate are those with the educational attainment of less than high school, with 100.0% or 6 individuals in the labor force. Within the labor force, individuals with high school diploma education have the highest percentage of unemployment, with 18.8% or 12 of them being unemployed.
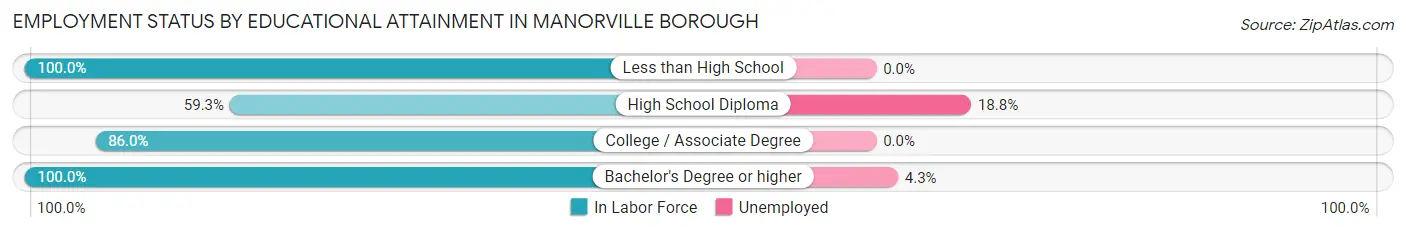
| Educational Attainment | In Labor Force | Unemployed |
| Less than High School | 6 (100.0%) | 0 (0.0%) |
| High School Diploma | 64 (59.3%) | 20 (18.8%) |
| College / Associate Degree | 49 (86.0%) | 0 (0.0%) |
| Bachelor's Degree or higher | 49 (100.0%) | 2 (4.3%) |
| Total | 168 (76.4%) | 18 (8.4%) |
Employment Occupations by Sex in Manorville borough
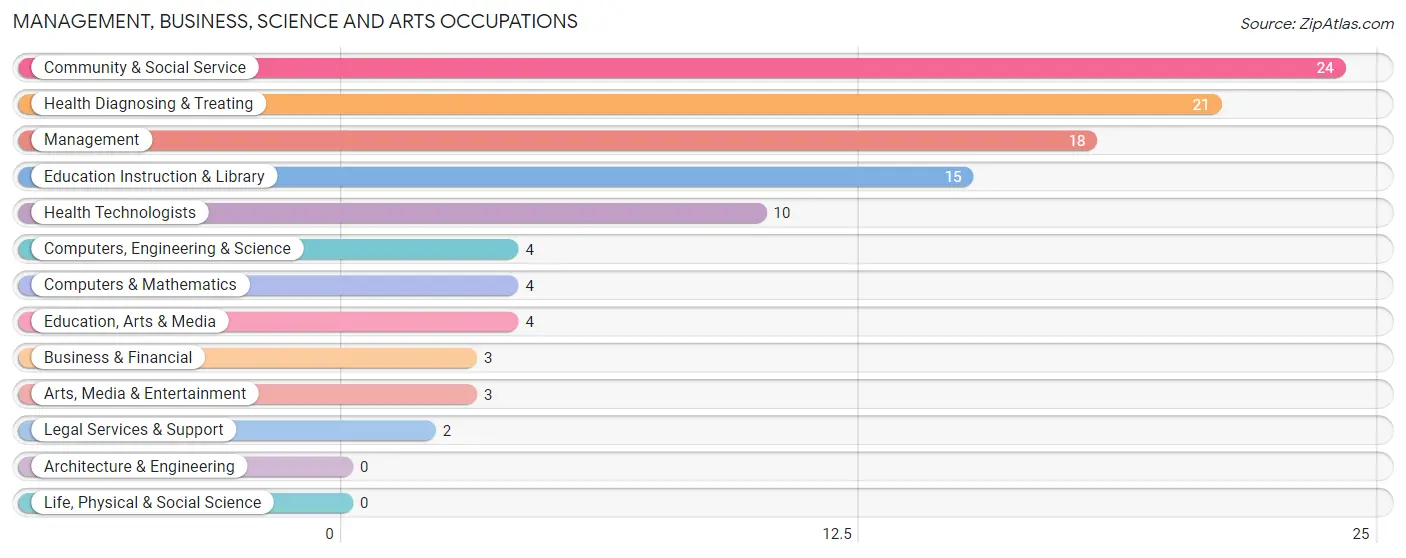
Management, Business, Science and Arts Occupations
The most common Management, Business, Science and Arts occupations in Manorville borough are Community & Social Service (24 | 13.0%), Health Diagnosing & Treating (21 | 11.4%), Management (18 | 9.8%), Education Instruction & Library (15 | 8.2%), and Health Technologists (10 | 5.4%).
Management, Business, Science and Arts Occupations by Sex
Within the Management, Business, Science and Arts occupations in Manorville borough, the most male-oriented occupations are Computers, Engineering & Science (75.0%), Computers & Mathematics (75.0%), and Health Diagnosing & Treating (66.7%), while the most female-oriented occupations are Business & Financial (100.0%), Legal Services & Support (100.0%), and Arts, Media & Entertainment (100.0%).
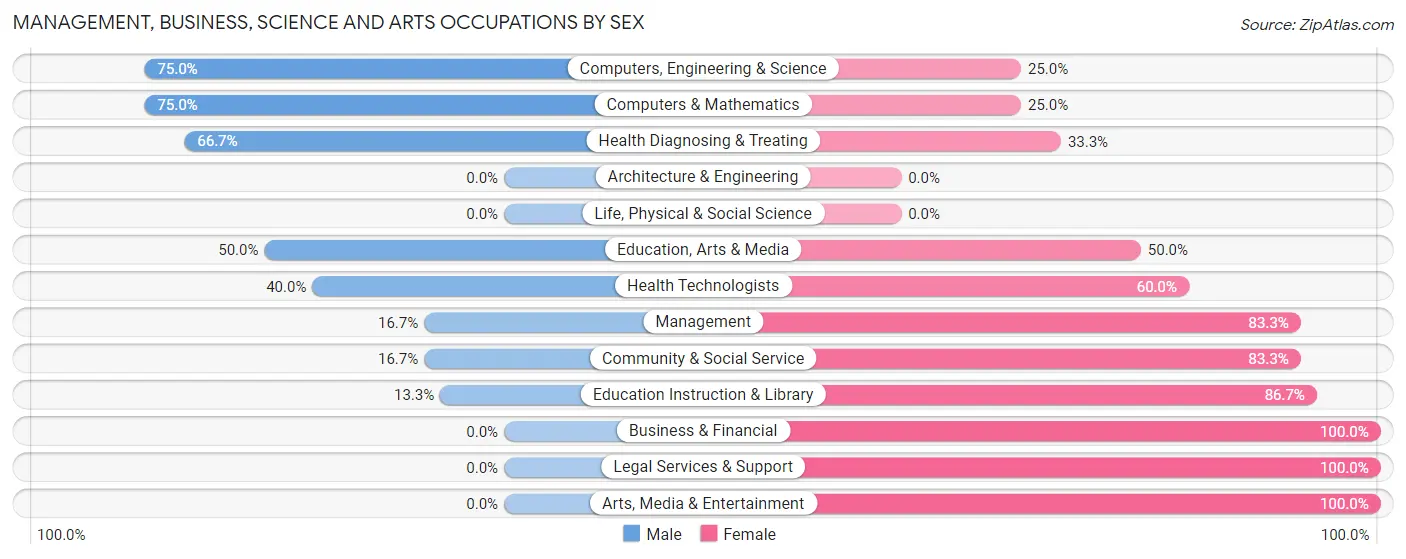
| Occupation | Male | Female |
| Management | 3 (16.7%) | 15 (83.3%) |
| Business & Financial | 0 (0.0%) | 3 (100.0%) |
| Computers, Engineering & Science | 3 (75.0%) | 1 (25.0%) |
| Computers & Mathematics | 3 (75.0%) | 1 (25.0%) |
| Architecture & Engineering | 0 (0.0%) | 0 (0.0%) |
| Life, Physical & Social Science | 0 (0.0%) | 0 (0.0%) |
| Community & Social Service | 4 (16.7%) | 20 (83.3%) |
| Education, Arts & Media | 2 (50.0%) | 2 (50.0%) |
| Legal Services & Support | 0 (0.0%) | 2 (100.0%) |
| Education Instruction & Library | 2 (13.3%) | 13 (86.7%) |
| Arts, Media & Entertainment | 0 (0.0%) | 3 (100.0%) |
| Health Diagnosing & Treating | 14 (66.7%) | 7 (33.3%) |
| Health Technologists | 4 (40.0%) | 6 (60.0%) |
| Total (Category) | 24 (34.3%) | 46 (65.7%) |
| Total (Overall) | 85 (46.2%) | 99 (53.8%) |
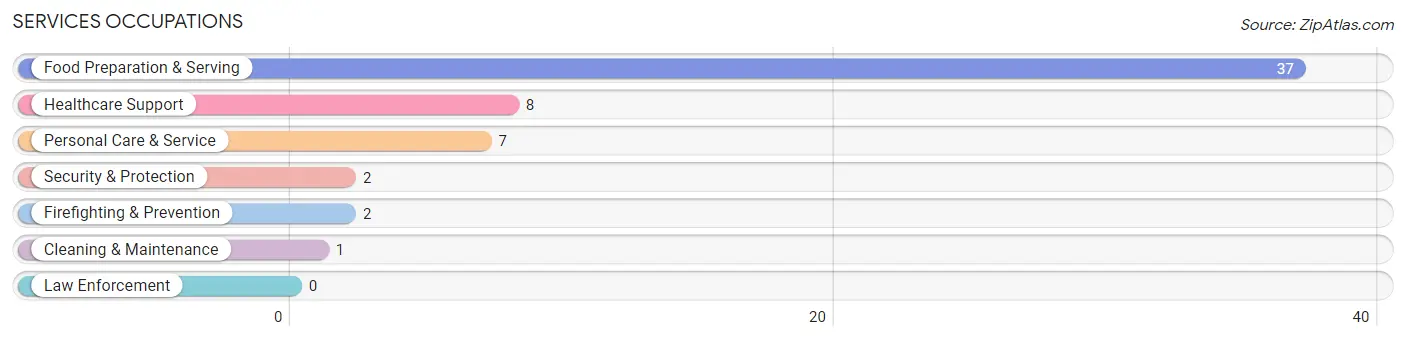
Services Occupations
The most common Services occupations in Manorville borough are Food Preparation & Serving (37 | 20.1%), Healthcare Support (8 | 4.3%), Personal Care & Service (7 | 3.8%), Security & Protection (2 | 1.1%), and Firefighting & Prevention (2 | 1.1%).
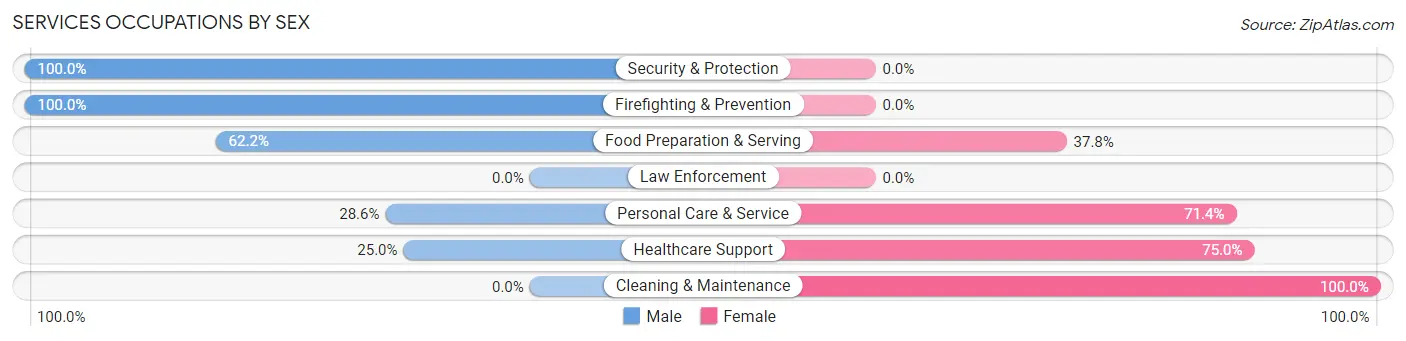
Services Occupations by Sex
Within the Services occupations in Manorville borough, the most male-oriented occupations are Security & Protection (100.0%), Firefighting & Prevention (100.0%), and Food Preparation & Serving (62.2%), while the most female-oriented occupations are Cleaning & Maintenance (100.0%), Healthcare Support (75.0%), and Personal Care & Service (71.4%).
| Occupation | Male | Female |
| Healthcare Support | 2 (25.0%) | 6 (75.0%) |
| Security & Protection | 2 (100.0%) | 0 (0.0%) |
| Firefighting & Prevention | 2 (100.0%) | 0 (0.0%) |
| Law Enforcement | 0 (0.0%) | 0 (0.0%) |
| Food Preparation & Serving | 23 (62.2%) | 14 (37.8%) |
| Cleaning & Maintenance | 0 (0.0%) | 1 (100.0%) |
| Personal Care & Service | 2 (28.6%) | 5 (71.4%) |
| Total (Category) | 29 (52.7%) | 26 (47.3%) |
| Total (Overall) | 85 (46.2%) | 99 (53.8%) |
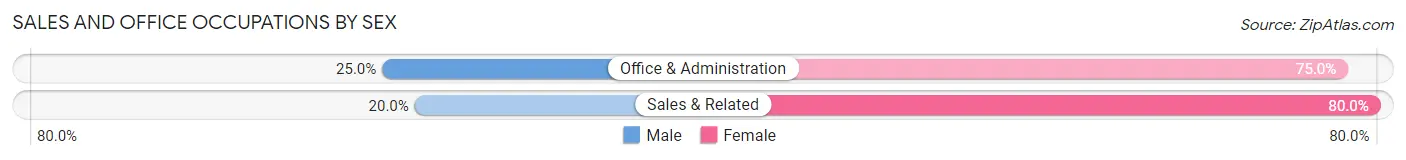
Sales and Office Occupations
The most common Sales and Office occupations in Manorville borough are Sales & Related (10 | 5.4%), and Office & Administration (8 | 4.3%).

Sales and Office Occupations by Sex
| Occupation | Male | Female |
| Sales & Related | 2 (20.0%) | 8 (80.0%) |
| Office & Administration | 2 (25.0%) | 6 (75.0%) |
| Total (Category) | 4 (22.2%) | 14 (77.8%) |
| Total (Overall) | 85 (46.2%) | 99 (53.8%) |
Natural Resources, Construction and Maintenance Occupations
The most common Natural Resources, Construction and Maintenance occupations in Manorville borough are Installation, Maintenance & Repair (11 | 6.0%), Construction & Extraction (2 | 1.1%), and Farming, Fishing & Forestry (1 | 0.5%).

Natural Resources, Construction and Maintenance Occupations by Sex

| Occupation | Male | Female |
| Farming, Fishing & Forestry | 1 (100.0%) | 0 (0.0%) |
| Construction & Extraction | 2 (100.0%) | 0 (0.0%) |
| Installation, Maintenance & Repair | 11 (100.0%) | 0 (0.0%) |
| Total (Category) | 14 (100.0%) | 0 (0.0%) |
| Total (Overall) | 85 (46.2%) | 99 (53.8%) |
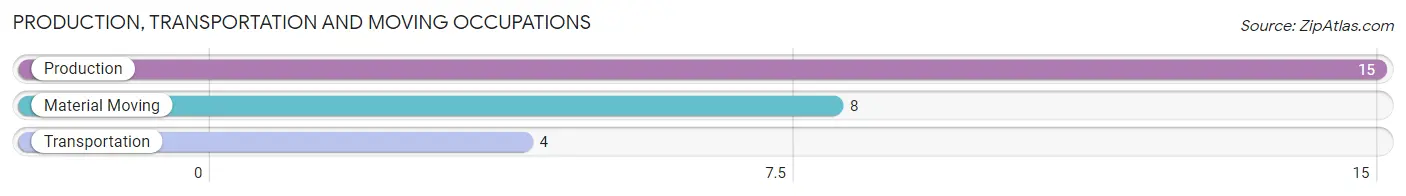
Production, Transportation and Moving Occupations
The most common Production, Transportation and Moving occupations in Manorville borough are Production (15 | 8.2%), Material Moving (8 | 4.3%), and Transportation (4 | 2.2%).
Production, Transportation and Moving Occupations by Sex
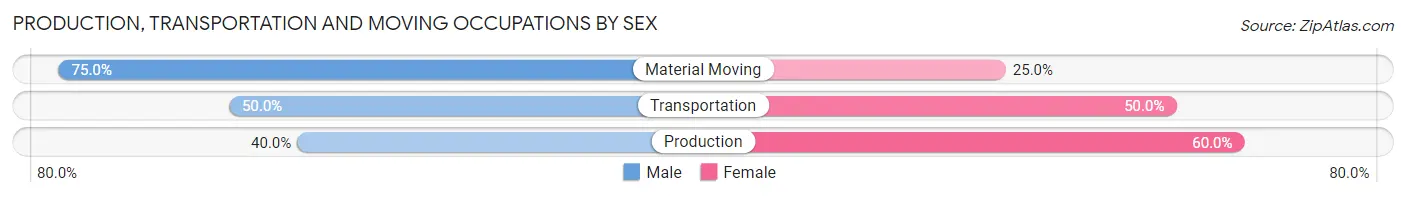
| Occupation | Male | Female |
| Production | 6 (40.0%) | 9 (60.0%) |
| Transportation | 2 (50.0%) | 2 (50.0%) |
| Material Moving | 6 (75.0%) | 2 (25.0%) |
| Total (Category) | 14 (51.8%) | 13 (48.1%) |
| Total (Overall) | 85 (46.2%) | 99 (53.8%) |
Employment Industries by Sex in Manorville borough
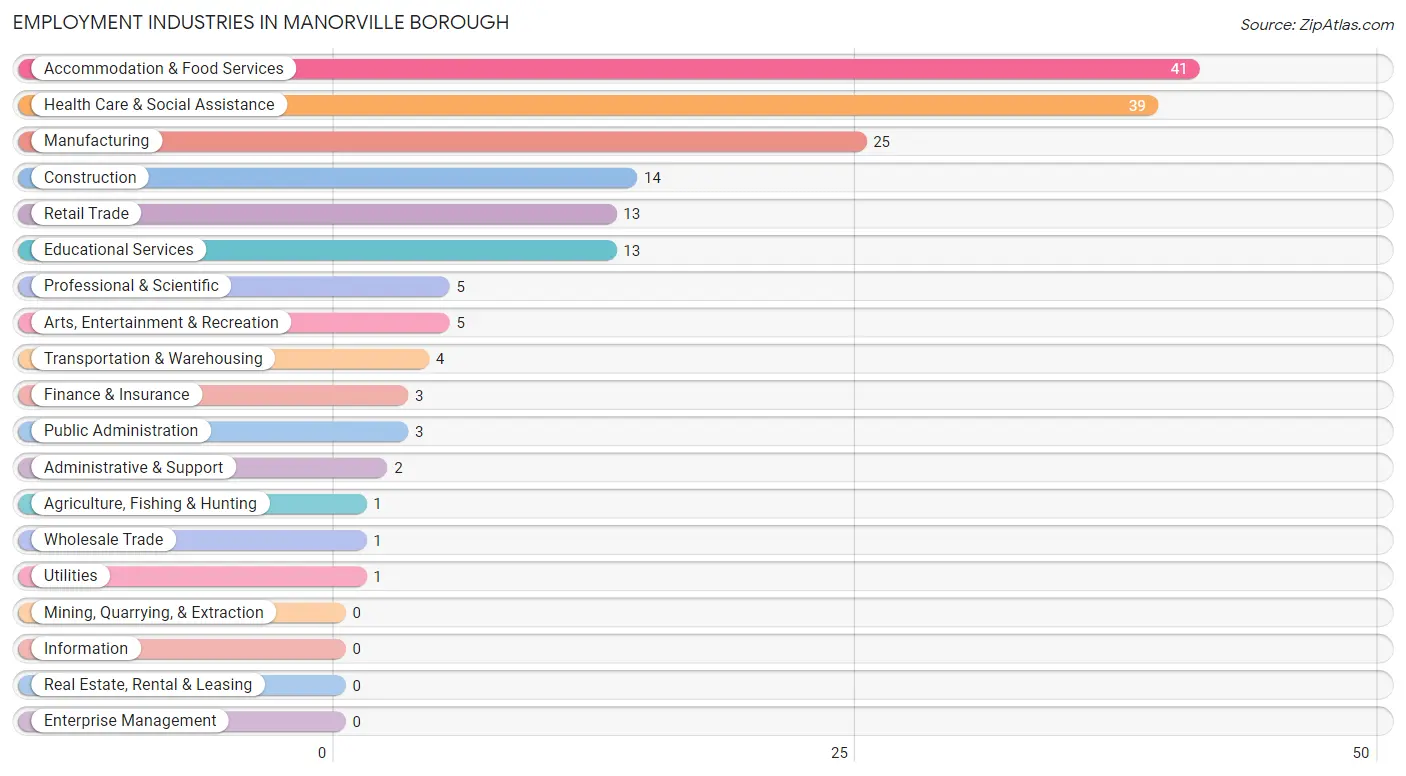
Employment Industries in Manorville borough
The major employment industries in Manorville borough include Accommodation & Food Services (41 | 22.3%), Health Care & Social Assistance (39 | 21.2%), Manufacturing (25 | 13.6%), Construction (14 | 7.6%), and Retail Trade (13 | 7.1%).
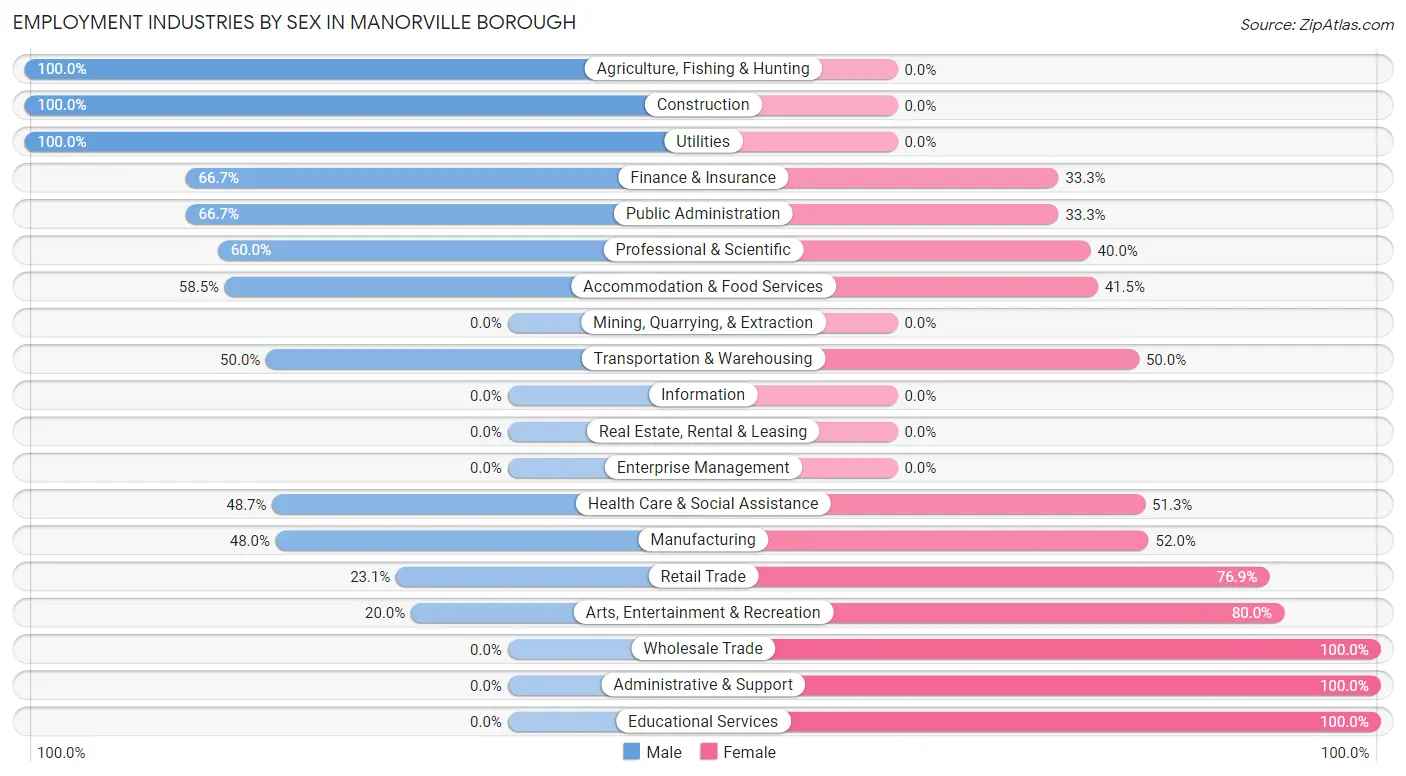
Employment Industries by Sex in Manorville borough
The Manorville borough industries that see more men than women are Agriculture, Fishing & Hunting (100.0%), Construction (100.0%), and Utilities (100.0%), whereas the industries that tend to have a higher number of women are Wholesale Trade (100.0%), Administrative & Support (100.0%), and Educational Services (100.0%).
| Industry | Male | Female |
| Agriculture, Fishing & Hunting | 1 (100.0%) | 0 (0.0%) |
| Mining, Quarrying, & Extraction | 0 (0.0%) | 0 (0.0%) |
| Construction | 14 (100.0%) | 0 (0.0%) |
| Manufacturing | 12 (48.0%) | 13 (52.0%) |
| Wholesale Trade | 0 (0.0%) | 1 (100.0%) |
| Retail Trade | 3 (23.1%) | 10 (76.9%) |
| Transportation & Warehousing | 2 (50.0%) | 2 (50.0%) |
| Utilities | 1 (100.0%) | 0 (0.0%) |
| Information | 0 (0.0%) | 0 (0.0%) |
| Finance & Insurance | 2 (66.7%) | 1 (33.3%) |
| Real Estate, Rental & Leasing | 0 (0.0%) | 0 (0.0%) |
| Professional & Scientific | 3 (60.0%) | 2 (40.0%) |
| Enterprise Management | 0 (0.0%) | 0 (0.0%) |
| Administrative & Support | 0 (0.0%) | 2 (100.0%) |
| Educational Services | 0 (0.0%) | 13 (100.0%) |
| Health Care & Social Assistance | 19 (48.7%) | 20 (51.3%) |
| Arts, Entertainment & Recreation | 1 (20.0%) | 4 (80.0%) |
| Accommodation & Food Services | 24 (58.5%) | 17 (41.5%) |
| Public Administration | 2 (66.7%) | 1 (33.3%) |
| Total | 85 (46.2%) | 99 (53.8%) |
Education in Manorville borough
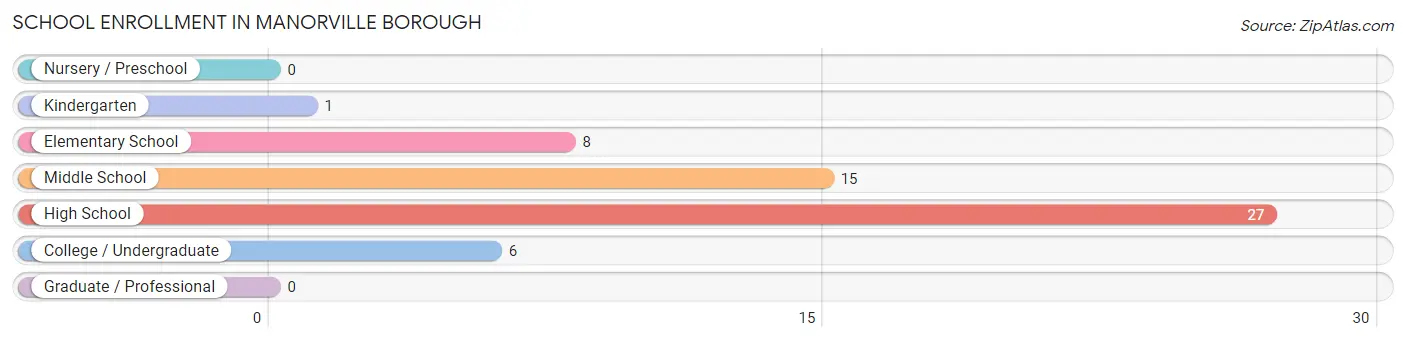
School Enrollment in Manorville borough
The most common levels of schooling among the 57 students in Manorville borough are high school (27 | 47.4%), middle school (15 | 26.3%), and elementary school (8 | 14.0%).
| School Level | # Students | % Students |
| Nursery / Preschool | 0 | 0.0% |
| Kindergarten | 1 | 1.8% |
| Elementary School | 8 | 14.0% |
| Middle School | 15 | 26.3% |
| High School | 27 | 47.4% |
| College / Undergraduate | 6 | 10.5% |
| Graduate / Professional | 0 | 0.0% |
| Total | 57 | 100.0% |
School Enrollment by Age by Funding Source in Manorville borough
Out of a total of 57 students who are enrolled in schools in Manorville borough, 2 (3.5%) attend a private institution, while the remaining 55 (96.5%) are enrolled in public schools. The age group of 5 to 9 year old has the highest likelihood of being enrolled in private schools, with 1 (11.1% in the age bracket) enrolled. Conversely, the age group of 15 to 17 year olds has the lowest likelihood of being enrolled in a private school, with 7 (100.0% in the age bracket) attending a public institution.
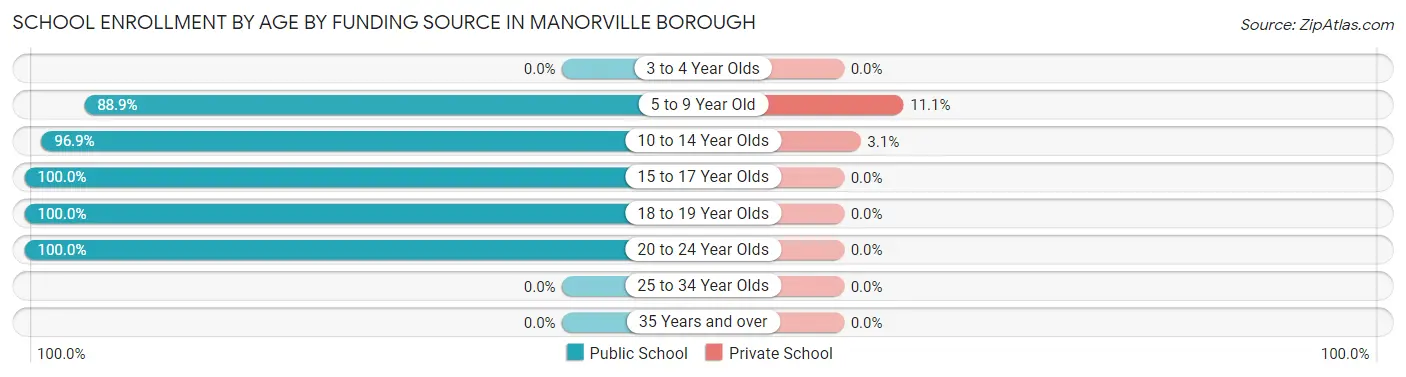
| Age Bracket | Public School | Private School |
| 3 to 4 Year Olds | 0 (0.0%) | 0 (0.0%) |
| 5 to 9 Year Old | 8 (88.9%) | 1 (11.1%) |
| 10 to 14 Year Olds | 31 (96.9%) | 1 (3.1%) |
| 15 to 17 Year Olds | 7 (100.0%) | 0 (0.0%) |
| 18 to 19 Year Olds | 6 (100.0%) | 0 (0.0%) |
| 20 to 24 Year Olds | 3 (100.0%) | 0 (0.0%) |
| 25 to 34 Year Olds | 0 (0.0%) | 0 (0.0%) |
| 35 Years and over | 0 (0.0%) | 0 (0.0%) |
| Total | 55 (96.5%) | 2 (3.5%) |
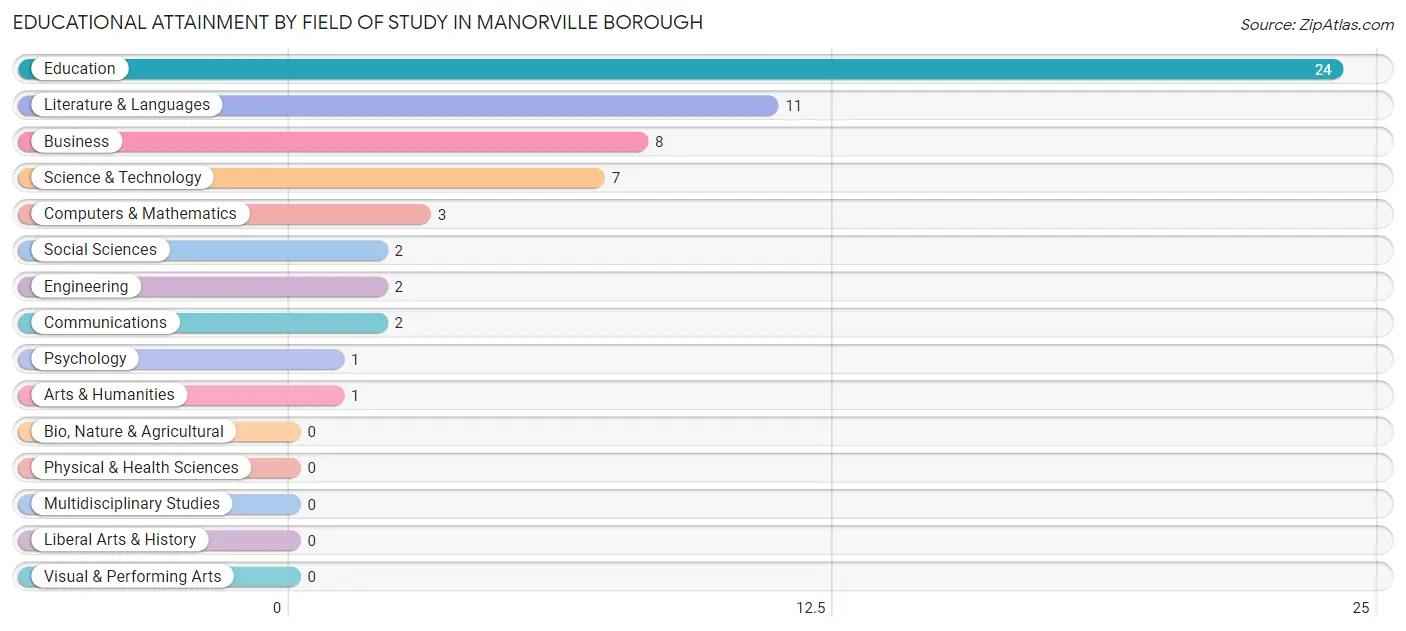
Educational Attainment by Field of Study in Manorville borough
Education (24 | 39.3%), literature & languages (11 | 18.0%), business (8 | 13.1%), science & technology (7 | 11.5%), and computers & mathematics (3 | 4.9%) are the most common fields of study among 61 individuals in Manorville borough who have obtained a bachelor's degree or higher.
| Field of Study | # Graduates | % Graduates |
| Computers & Mathematics | 3 | 4.9% |
| Bio, Nature & Agricultural | 0 | 0.0% |
| Physical & Health Sciences | 0 | 0.0% |
| Psychology | 1 | 1.6% |
| Social Sciences | 2 | 3.3% |
| Engineering | 2 | 3.3% |
| Multidisciplinary Studies | 0 | 0.0% |
| Science & Technology | 7 | 11.5% |
| Business | 8 | 13.1% |
| Education | 24 | 39.3% |
| Literature & Languages | 11 | 18.0% |
| Liberal Arts & History | 0 | 0.0% |
| Visual & Performing Arts | 0 | 0.0% |
| Communications | 2 | 3.3% |
| Arts & Humanities | 1 | 1.6% |
| Total | 61 | 100.0% |
Transportation & Commute in Manorville borough
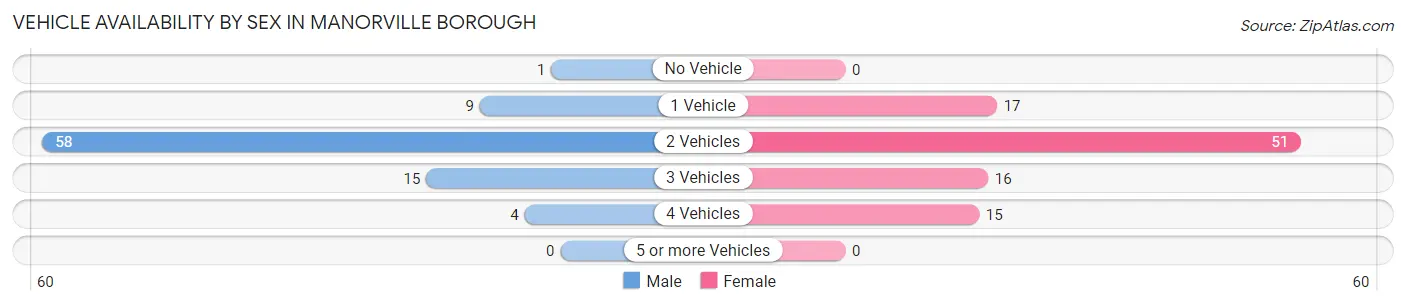
Vehicle Availability by Sex in Manorville borough
The most prevalent vehicle ownership categories in Manorville borough are males with 2 vehicles (58, accounting for 66.7%) and females with 2 vehicles (51, making up 58.6%).
| Vehicles Available | Male | Female |
| No Vehicle | 1 (1.1%) | 0 (0.0%) |
| 1 Vehicle | 9 (10.3%) | 17 (17.2%) |
| 2 Vehicles | 58 (66.7%) | 51 (51.5%) |
| 3 Vehicles | 15 (17.2%) | 16 (16.2%) |
| 4 Vehicles | 4 (4.6%) | 15 (15.1%) |
| 5 or more Vehicles | 0 (0.0%) | 0 (0.0%) |
| Total | 87 (100.0%) | 99 (100.0%) |
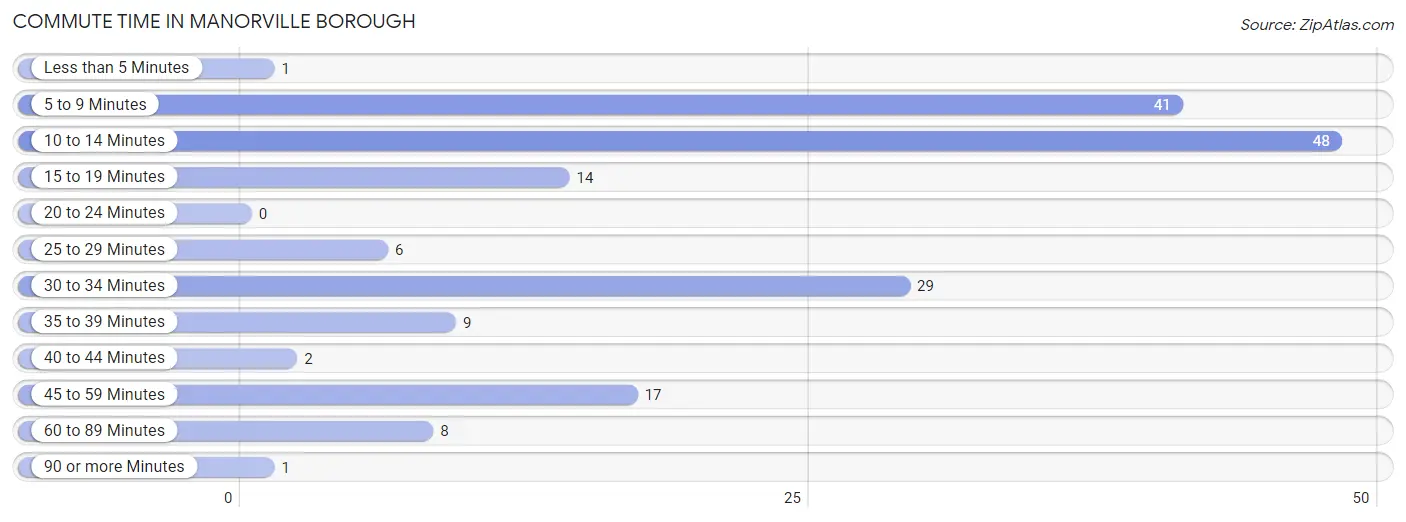
Commute Time in Manorville borough
The most frequently occuring commute durations in Manorville borough are 10 to 14 minutes (48 commuters, 27.3%), 5 to 9 minutes (41 commuters, 23.3%), and 30 to 34 minutes (29 commuters, 16.5%).
| Commute Time | # Commuters | % Commuters |
| Less than 5 Minutes | 1 | 0.6% |
| 5 to 9 Minutes | 41 | 23.3% |
| 10 to 14 Minutes | 48 | 27.3% |
| 15 to 19 Minutes | 14 | 8.0% |
| 20 to 24 Minutes | 0 | 0.0% |
| 25 to 29 Minutes | 6 | 3.4% |
| 30 to 34 Minutes | 29 | 16.5% |
| 35 to 39 Minutes | 9 | 5.1% |
| 40 to 44 Minutes | 2 | 1.1% |
| 45 to 59 Minutes | 17 | 9.7% |
| 60 to 89 Minutes | 8 | 4.5% |
| 90 or more Minutes | 1 | 0.6% |
Commute Time by Sex in Manorville borough
The most common commute times in Manorville borough are 10 to 14 minutes (25 commuters, 31.2%) for males and 5 to 9 minutes (23 commuters, 24.0%) for females.
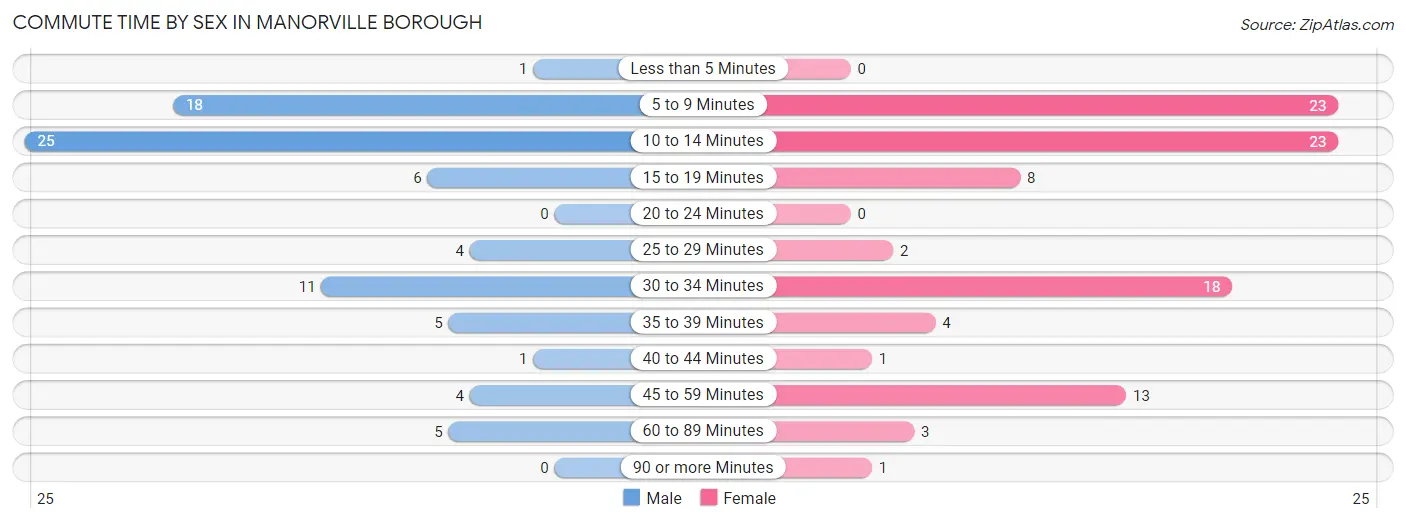
| Commute Time | Male | Female |
| Less than 5 Minutes | 1 (1.3%) | 0 (0.0%) |
| 5 to 9 Minutes | 18 (22.5%) | 23 (24.0%) |
| 10 to 14 Minutes | 25 (31.2%) | 23 (24.0%) |
| 15 to 19 Minutes | 6 (7.5%) | 8 (8.3%) |
| 20 to 24 Minutes | 0 (0.0%) | 0 (0.0%) |
| 25 to 29 Minutes | 4 (5.0%) | 2 (2.1%) |
| 30 to 34 Minutes | 11 (13.8%) | 18 (18.8%) |
| 35 to 39 Minutes | 5 (6.2%) | 4 (4.2%) |
| 40 to 44 Minutes | 1 (1.3%) | 1 (1.0%) |
| 45 to 59 Minutes | 4 (5.0%) | 13 (13.5%) |
| 60 to 89 Minutes | 5 (6.2%) | 3 (3.1%) |
| 90 or more Minutes | 0 (0.0%) | 1 (1.0%) |
Time of Departure to Work by Sex in Manorville borough
The most frequent times of departure to work in Manorville borough are 7:30 AM to 7:59 AM (22, 27.5%) for males and 8:00 AM to 8:29 AM (20, 20.8%) for females.
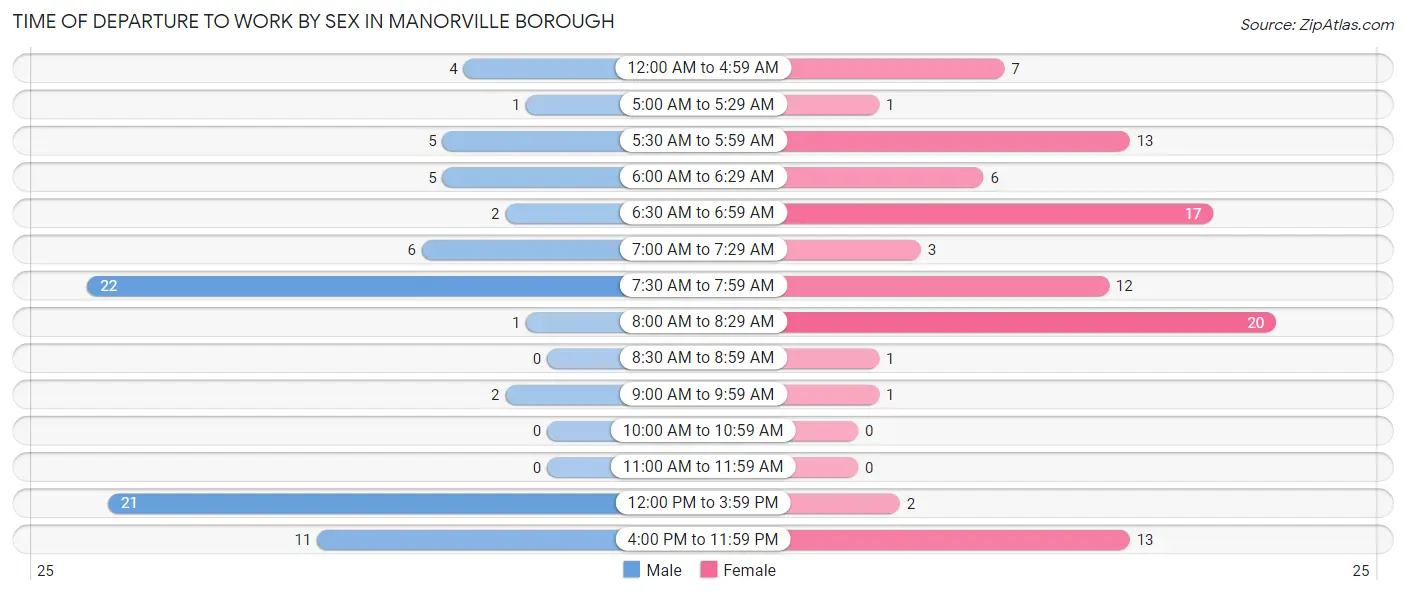
| Time of Departure | Male | Female |
| 12:00 AM to 4:59 AM | 4 (5.0%) | 7 (7.3%) |
| 5:00 AM to 5:29 AM | 1 (1.3%) | 1 (1.0%) |
| 5:30 AM to 5:59 AM | 5 (6.2%) | 13 (13.5%) |
| 6:00 AM to 6:29 AM | 5 (6.2%) | 6 (6.2%) |
| 6:30 AM to 6:59 AM | 2 (2.5%) | 17 (17.7%) |
| 7:00 AM to 7:29 AM | 6 (7.5%) | 3 (3.1%) |
| 7:30 AM to 7:59 AM | 22 (27.5%) | 12 (12.5%) |
| 8:00 AM to 8:29 AM | 1 (1.3%) | 20 (20.8%) |
| 8:30 AM to 8:59 AM | 0 (0.0%) | 1 (1.0%) |
| 9:00 AM to 9:59 AM | 2 (2.5%) | 1 (1.0%) |
| 10:00 AM to 10:59 AM | 0 (0.0%) | 0 (0.0%) |
| 11:00 AM to 11:59 AM | 0 (0.0%) | 0 (0.0%) |
| 12:00 PM to 3:59 PM | 21 (26.3%) | 2 (2.1%) |
| 4:00 PM to 11:59 PM | 11 (13.8%) | 13 (13.5%) |
| Total | 80 (100.0%) | 96 (100.0%) |
Housing Occupancy in Manorville borough
Occupancy by Ownership in Manorville borough
Of the total 175 dwellings in Manorville borough, owner-occupied units account for 140 (80.0%), while renter-occupied units make up 35 (20.0%).
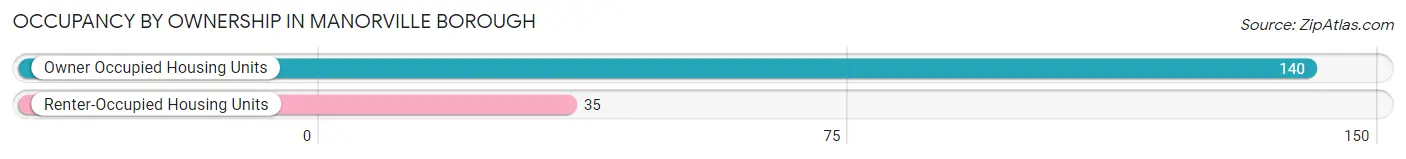
| Occupancy | # Housing Units | % Housing Units |
| Owner Occupied Housing Units | 140 | 80.0% |
| Renter-Occupied Housing Units | 35 | 20.0% |
| Total Occupied Housing Units | 175 | 100.0% |
Occupancy by Household Size in Manorville borough
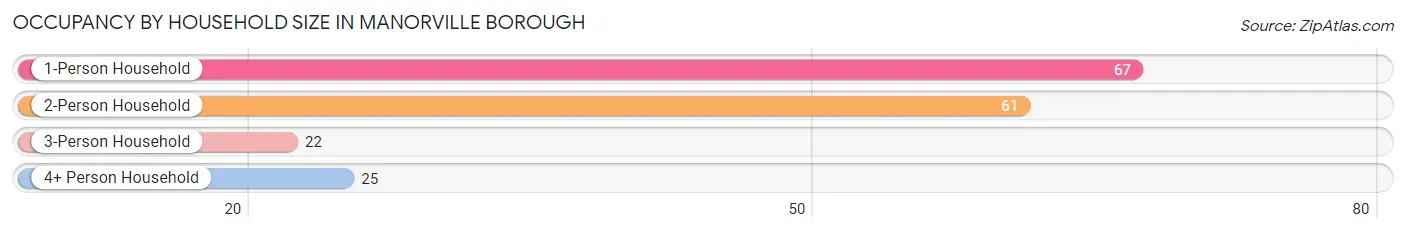
| Household Size | # Housing Units | % Housing Units |
| 1-Person Household | 67 | 38.3% |
| 2-Person Household | 61 | 34.9% |
| 3-Person Household | 22 | 12.6% |
| 4+ Person Household | 25 | 14.3% |
| Total Housing Units | 175 | 100.0% |
Occupancy by Ownership by Household Size in Manorville borough
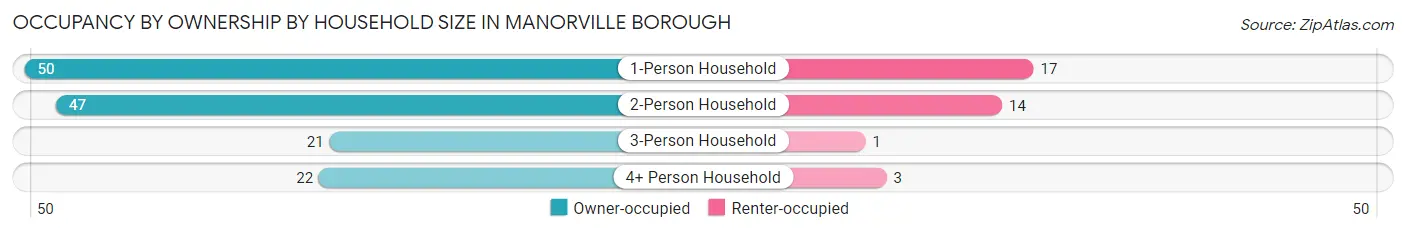
| Household Size | Owner-occupied | Renter-occupied |
| 1-Person Household | 50 (74.6%) | 17 (25.4%) |
| 2-Person Household | 47 (77.0%) | 14 (23.0%) |
| 3-Person Household | 21 (95.5%) | 1 (4.5%) |
| 4+ Person Household | 22 (88.0%) | 3 (12.0%) |
| Total Housing Units | 140 (80.0%) | 35 (20.0%) |
Occupancy by Educational Attainment in Manorville borough
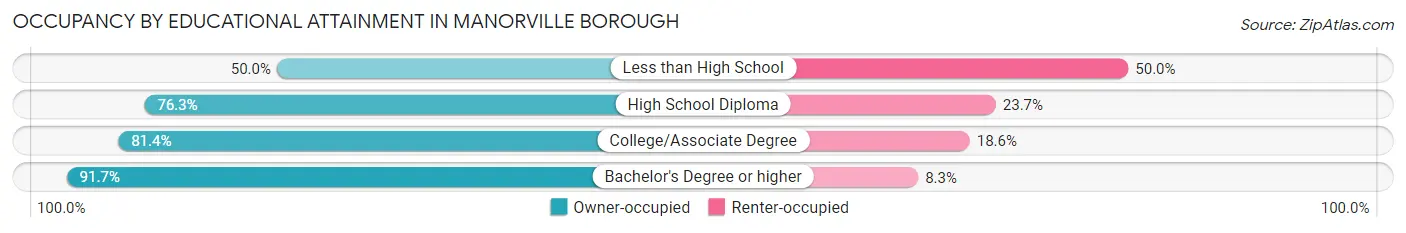
| Household Size | Owner-occupied | Renter-occupied |
| Less than High School | 5 (50.0%) | 5 (50.0%) |
| High School Diploma | 45 (76.3%) | 14 (23.7%) |
| College/Associate Degree | 57 (81.4%) | 13 (18.6%) |
| Bachelor's Degree or higher | 33 (91.7%) | 3 (8.3%) |
Occupancy by Age of Householder in Manorville borough
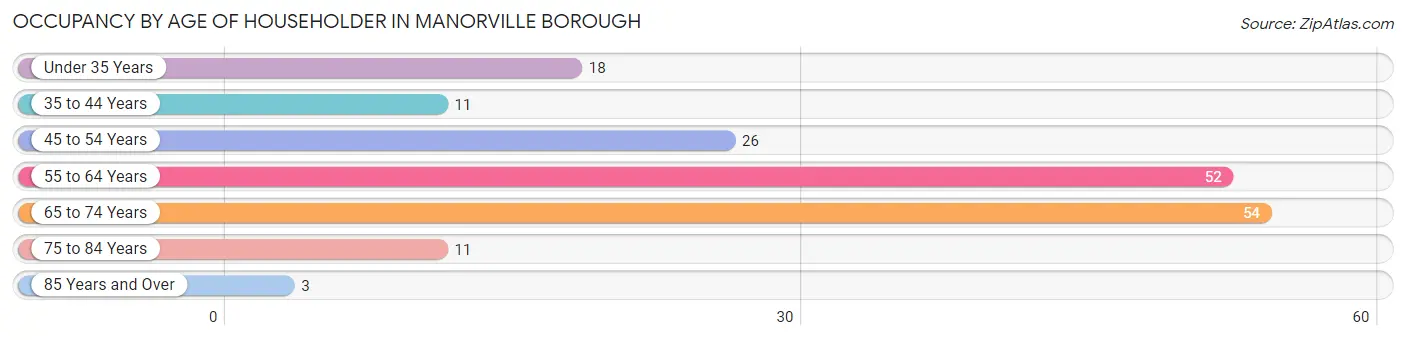
| Age Bracket | # Households | % Households |
| Under 35 Years | 18 | 10.3% |
| 35 to 44 Years | 11 | 6.3% |
| 45 to 54 Years | 26 | 14.9% |
| 55 to 64 Years | 52 | 29.7% |
| 65 to 74 Years | 54 | 30.9% |
| 75 to 84 Years | 11 | 6.3% |
| 85 Years and Over | 3 | 1.7% |
| Total | 175 | 100.0% |
Housing Finances in Manorville borough
Median Income by Occupancy in Manorville borough
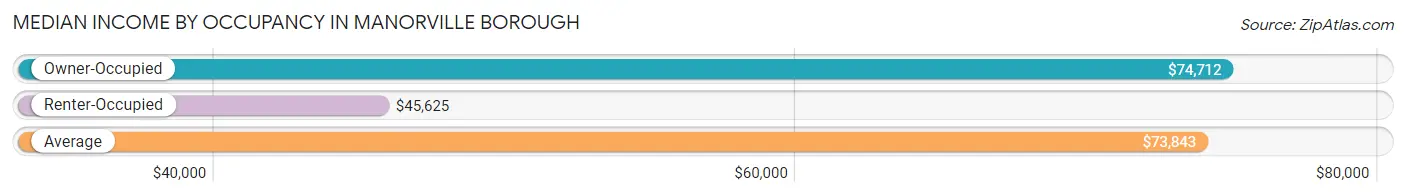
| Occupancy Type | # Households | Median Income |
| Owner-Occupied | 140 (80.0%) | $74,712 |
| Renter-Occupied | 35 (20.0%) | $45,625 |
| Average | 175 (100.0%) | $73,843 |
Occupancy by Householder Income Bracket in Manorville borough
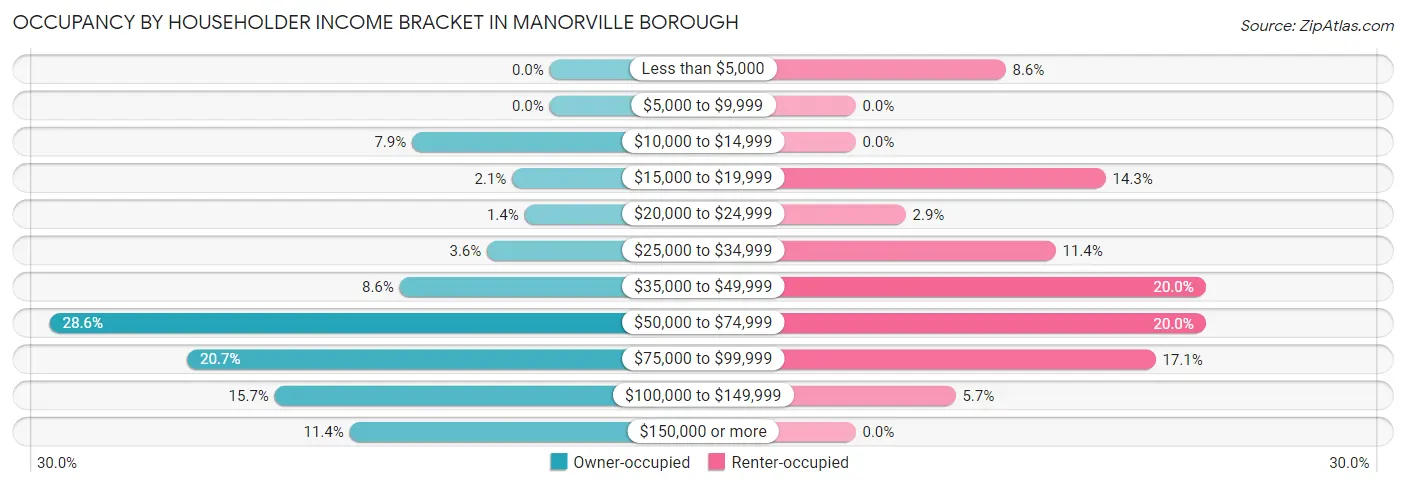
| Income Bracket | Owner-occupied | Renter-occupied |
| Less than $5,000 | 0 (0.0%) | 3 (8.6%) |
| $5,000 to $9,999 | 0 (0.0%) | 0 (0.0%) |
| $10,000 to $14,999 | 11 (7.9%) | 0 (0.0%) |
| $15,000 to $19,999 | 3 (2.1%) | 5 (14.3%) |
| $20,000 to $24,999 | 2 (1.4%) | 1 (2.9%) |
| $25,000 to $34,999 | 5 (3.6%) | 4 (11.4%) |
| $35,000 to $49,999 | 12 (8.6%) | 7 (20.0%) |
| $50,000 to $74,999 | 40 (28.6%) | 7 (20.0%) |
| $75,000 to $99,999 | 29 (20.7%) | 6 (17.1%) |
| $100,000 to $149,999 | 22 (15.7%) | 2 (5.7%) |
| $150,000 or more | 16 (11.4%) | 0 (0.0%) |
| Total | 140 (100.0%) | 35 (100.0%) |
Monthly Housing Cost Tiers in Manorville borough
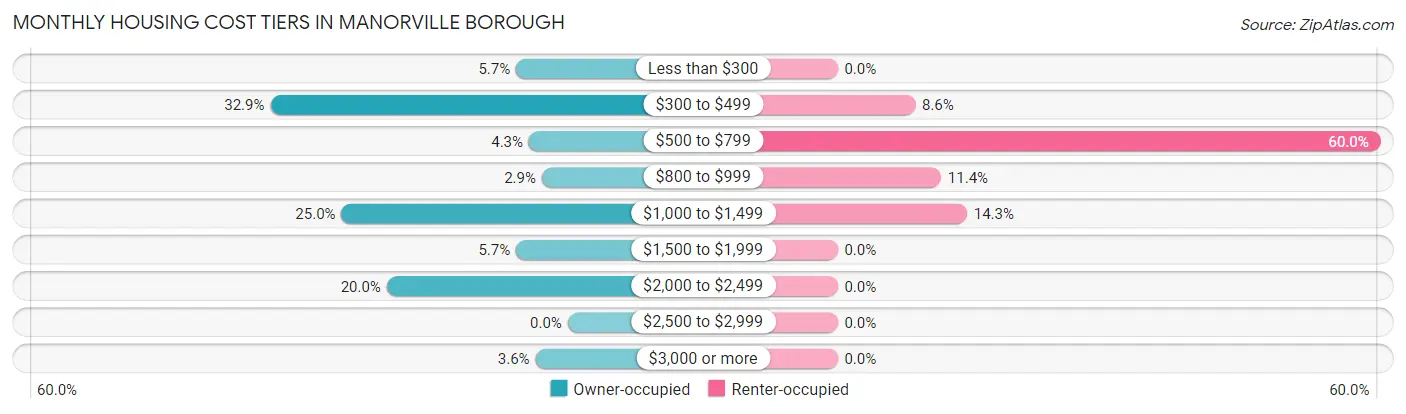
| Monthly Cost | Owner-occupied | Renter-occupied |
| Less than $300 | 8 (5.7%) | 0 (0.0%) |
| $300 to $499 | 46 (32.9%) | 3 (8.6%) |
| $500 to $799 | 6 (4.3%) | 21 (60.0%) |
| $800 to $999 | 4 (2.9%) | 4 (11.4%) |
| $1,000 to $1,499 | 35 (25.0%) | 5 (14.3%) |
| $1,500 to $1,999 | 8 (5.7%) | 0 (0.0%) |
| $2,000 to $2,499 | 28 (20.0%) | 0 (0.0%) |
| $2,500 to $2,999 | 0 (0.0%) | 0 (0.0%) |
| $3,000 or more | 5 (3.6%) | 0 (0.0%) |
| Total | 140 (100.0%) | 35 (100.0%) |
Physical Housing Characteristics in Manorville borough
Housing Structures in Manorville borough
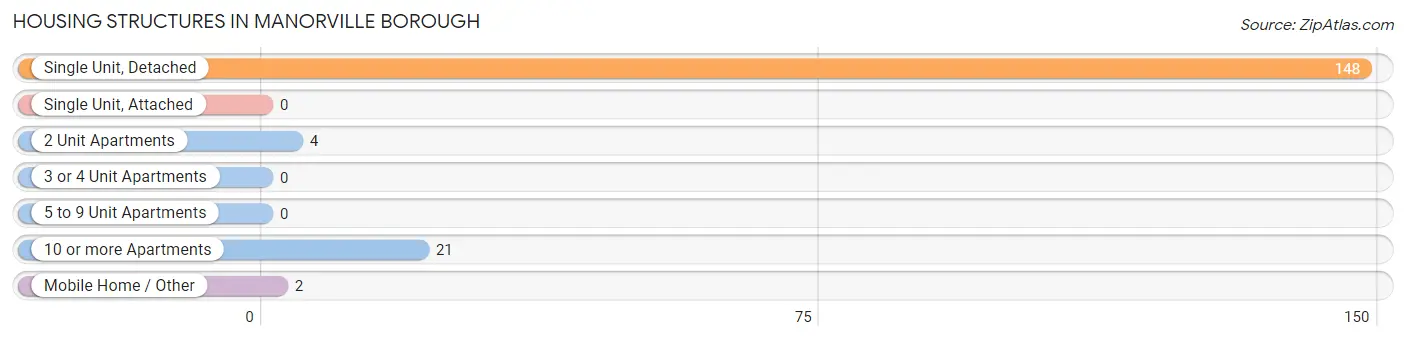
| Structure Type | # Housing Units | % Housing Units |
| Single Unit, Detached | 148 | 84.6% |
| Single Unit, Attached | 0 | 0.0% |
| 2 Unit Apartments | 4 | 2.3% |
| 3 or 4 Unit Apartments | 0 | 0.0% |
| 5 to 9 Unit Apartments | 0 | 0.0% |
| 10 or more Apartments | 21 | 12.0% |
| Mobile Home / Other | 2 | 1.1% |
| Total | 175 | 100.0% |
Housing Structures by Occupancy in Manorville borough
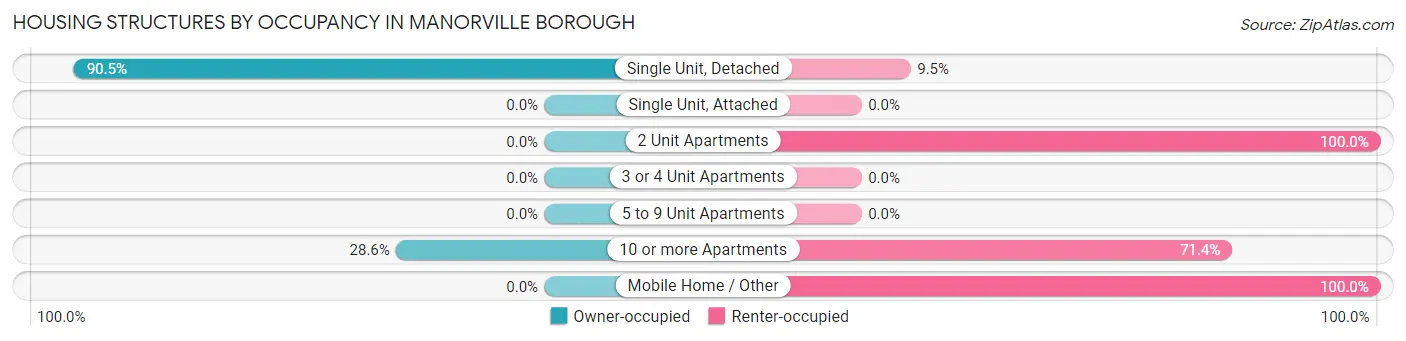
| Structure Type | Owner-occupied | Renter-occupied |
| Single Unit, Detached | 134 (90.5%) | 14 (9.5%) |
| Single Unit, Attached | 0 (0.0%) | 0 (0.0%) |
| 2 Unit Apartments | 0 (0.0%) | 4 (100.0%) |
| 3 or 4 Unit Apartments | 0 (0.0%) | 0 (0.0%) |
| 5 to 9 Unit Apartments | 0 (0.0%) | 0 (0.0%) |
| 10 or more Apartments | 6 (28.6%) | 15 (71.4%) |
| Mobile Home / Other | 0 (0.0%) | 2 (100.0%) |
| Total | 140 (80.0%) | 35 (20.0%) |
Housing Structures by Number of Rooms in Manorville borough
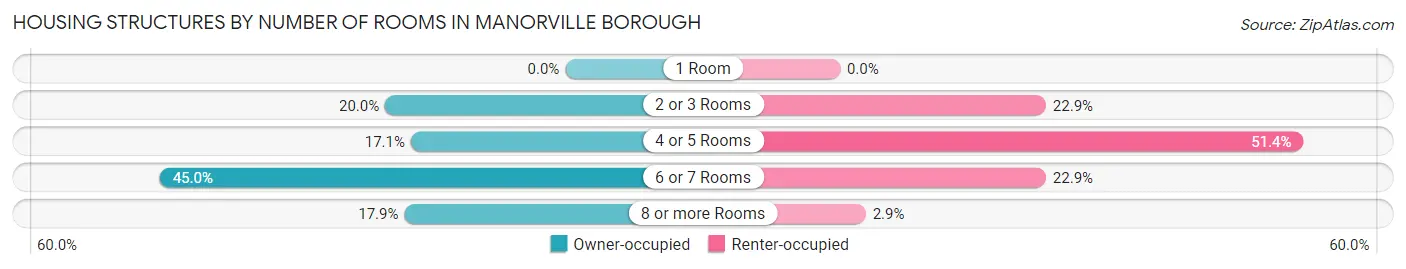
| Number of Rooms | Owner-occupied | Renter-occupied |
| 1 Room | 0 (0.0%) | 0 (0.0%) |
| 2 or 3 Rooms | 28 (20.0%) | 8 (22.9%) |
| 4 or 5 Rooms | 24 (17.1%) | 18 (51.4%) |
| 6 or 7 Rooms | 63 (45.0%) | 8 (22.9%) |
| 8 or more Rooms | 25 (17.9%) | 1 (2.9%) |
| Total | 140 (100.0%) | 35 (100.0%) |
Housing Structure by Heating Type in Manorville borough
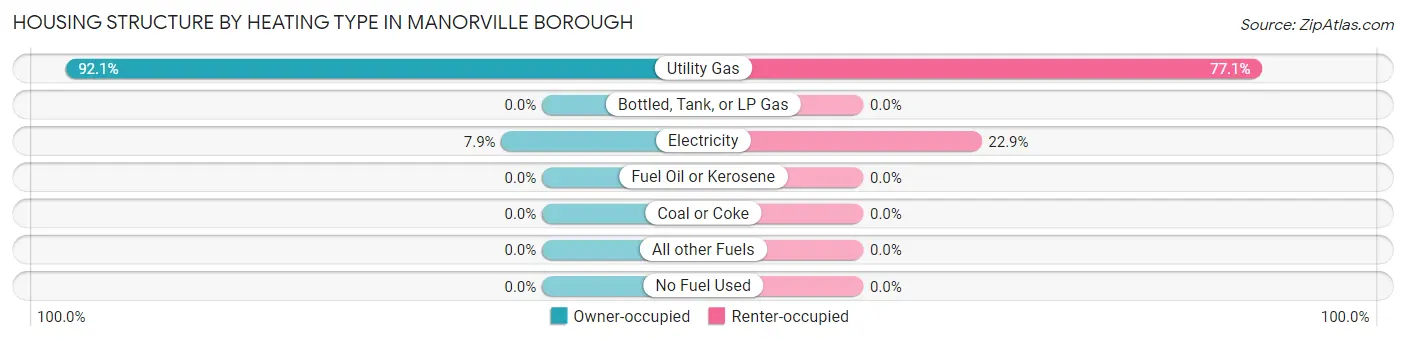
| Heating Type | Owner-occupied | Renter-occupied |
| Utility Gas | 129 (92.1%) | 27 (77.1%) |
| Bottled, Tank, or LP Gas | 0 (0.0%) | 0 (0.0%) |
| Electricity | 11 (7.9%) | 8 (22.9%) |
| Fuel Oil or Kerosene | 0 (0.0%) | 0 (0.0%) |
| Coal or Coke | 0 (0.0%) | 0 (0.0%) |
| All other Fuels | 0 (0.0%) | 0 (0.0%) |
| No Fuel Used | 0 (0.0%) | 0 (0.0%) |
| Total | 140 (100.0%) | 35 (100.0%) |
Household Vehicle Usage in Manorville borough
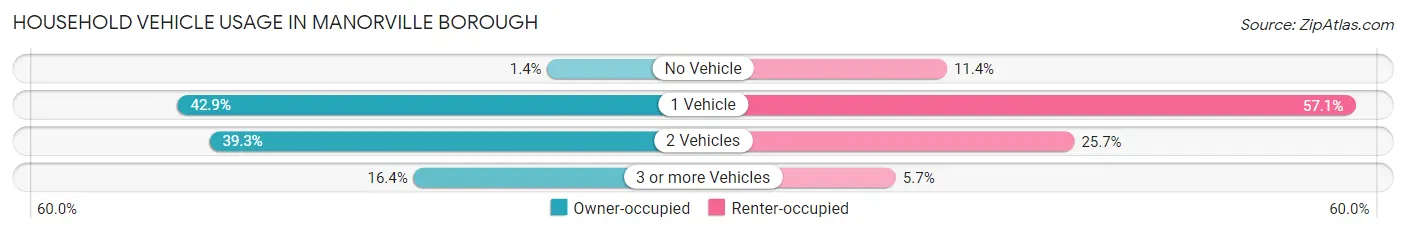
| Vehicles per Household | Owner-occupied | Renter-occupied |
| No Vehicle | 2 (1.4%) | 4 (11.4%) |
| 1 Vehicle | 60 (42.9%) | 20 (57.1%) |
| 2 Vehicles | 55 (39.3%) | 9 (25.7%) |
| 3 or more Vehicles | 23 (16.4%) | 2 (5.7%) |
| Total | 140 (100.0%) | 35 (100.0%) |
Real Estate & Mortgages in Manorville borough
Real Estate and Mortgage Overview in Manorville borough
| Characteristic | Without Mortgage | With Mortgage |
| Housing Units | 59 | 81 |
| Median Property Value | $114,600 | $260,700 |
| Median Household Income | $59,375 | $9 |
| Monthly Housing Costs | $413 | $5 |
| Real Estate Taxes | $882 | $0 |
Property Value by Mortgage Status in Manorville borough
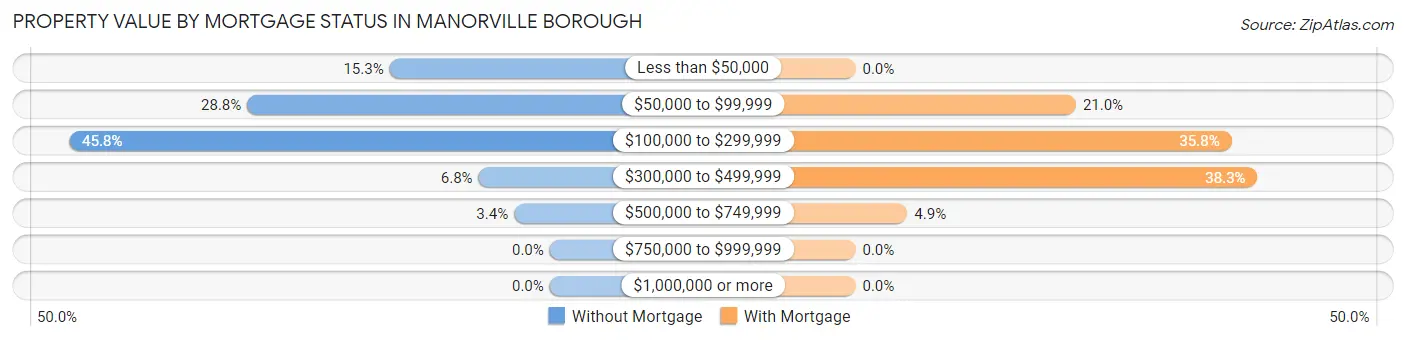
| Property Value | Without Mortgage | With Mortgage |
| Less than $50,000 | 9 (15.2%) | 0 (0.0%) |
| $50,000 to $99,999 | 17 (28.8%) | 17 (21.0%) |
| $100,000 to $299,999 | 27 (45.8%) | 29 (35.8%) |
| $300,000 to $499,999 | 4 (6.8%) | 31 (38.3%) |
| $500,000 to $749,999 | 2 (3.4%) | 4 (4.9%) |
| $750,000 to $999,999 | 0 (0.0%) | 0 (0.0%) |
| $1,000,000 or more | 0 (0.0%) | 0 (0.0%) |
| Total | 59 (100.0%) | 81 (100.0%) |
Household Income by Mortgage Status in Manorville borough
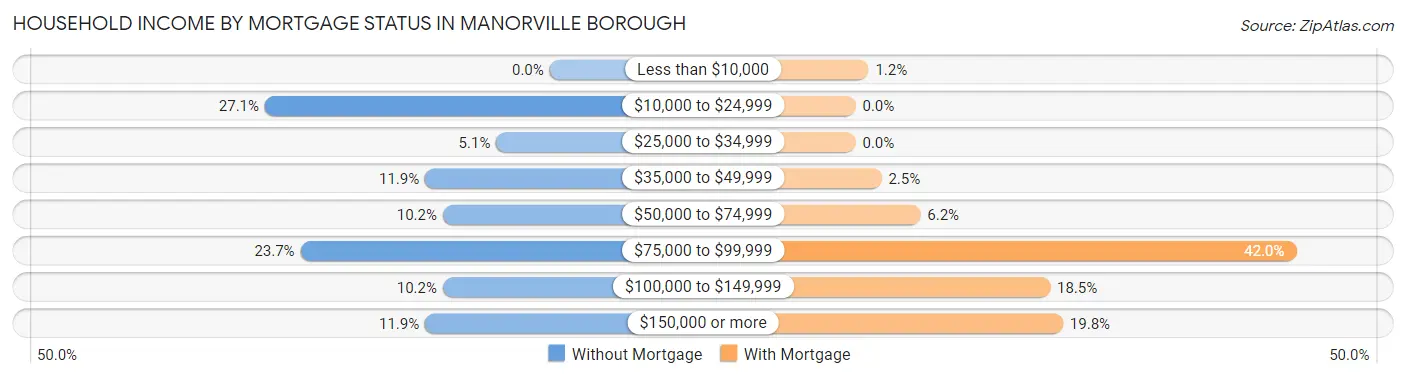
| Household Income | Without Mortgage | With Mortgage |
| Less than $10,000 | 0 (0.0%) | 1 (1.2%) |
| $10,000 to $24,999 | 16 (27.1%) | 0 (0.0%) |
| $25,000 to $34,999 | 3 (5.1%) | 0 (0.0%) |
| $35,000 to $49,999 | 7 (11.9%) | 2 (2.5%) |
| $50,000 to $74,999 | 6 (10.2%) | 5 (6.2%) |
| $75,000 to $99,999 | 14 (23.7%) | 34 (42.0%) |
| $100,000 to $149,999 | 6 (10.2%) | 15 (18.5%) |
| $150,000 or more | 7 (11.9%) | 16 (19.8%) |
| Total | 59 (100.0%) | 81 (100.0%) |
Property Value to Household Income Ratio in Manorville borough
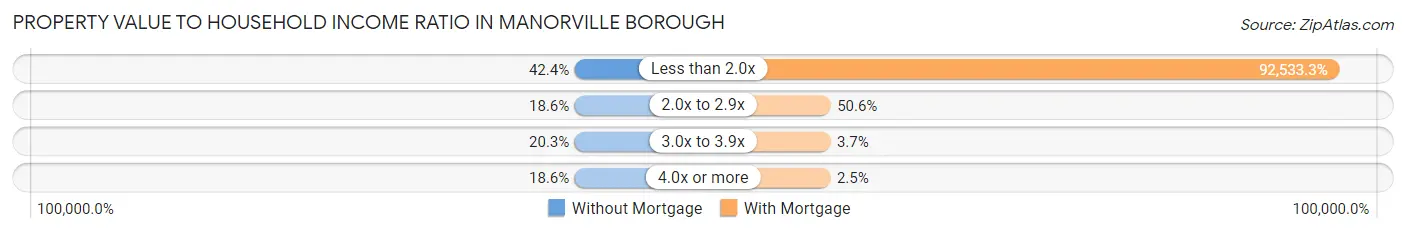
| Value-to-Income Ratio | Without Mortgage | With Mortgage |
| Less than 2.0x | 25 (42.4%) | 74,952 (92,533.3%) |
| 2.0x to 2.9x | 11 (18.6%) | 41 (50.6%) |
| 3.0x to 3.9x | 12 (20.3%) | 3 (3.7%) |
| 4.0x or more | 11 (18.6%) | 2 (2.5%) |
| Total | 59 (100.0%) | 81 (100.0%) |
Real Estate Taxes by Mortgage Status in Manorville borough
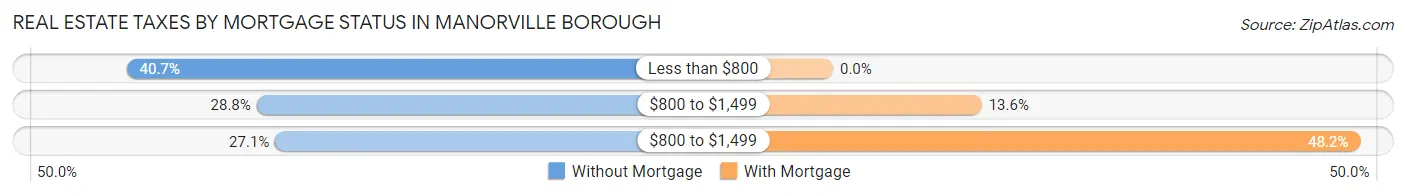
| Property Taxes | Without Mortgage | With Mortgage |
| Less than $800 | 24 (40.7%) | 0 (0.0%) |
| $800 to $1,499 | 17 (28.8%) | 11 (13.6%) |
| $800 to $1,499 | 16 (27.1%) | 39 (48.1%) |
| Total | 59 (100.0%) | 81 (100.0%) |
Health & Disability in Manorville borough
Health Insurance Coverage by Age in Manorville borough
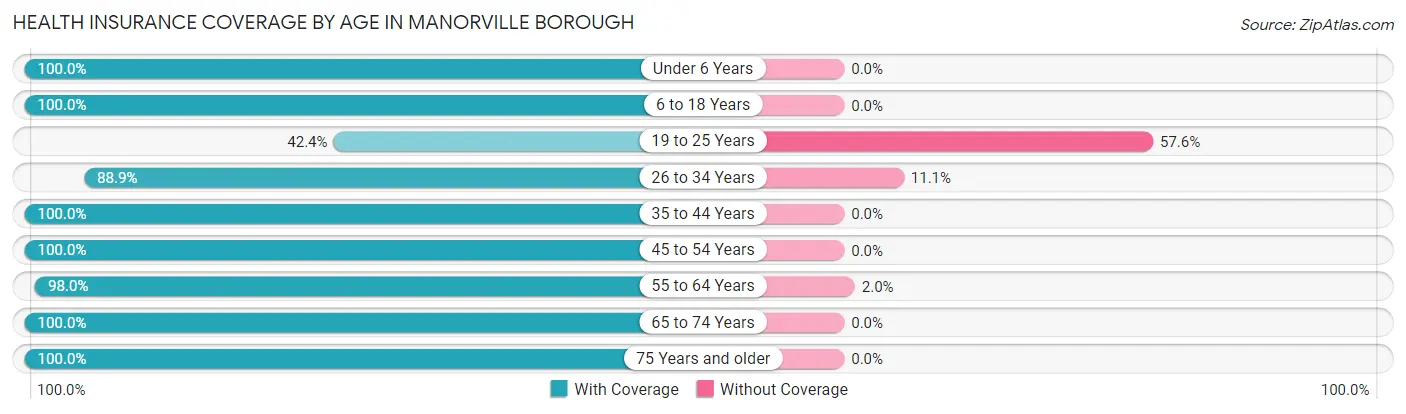
| Age Bracket | With Coverage | Without Coverage |
| Under 6 Years | 3 (100.0%) | 0 (0.0%) |
| 6 to 18 Years | 83 (100.0%) | 0 (0.0%) |
| 19 to 25 Years | 14 (42.4%) | 19 (57.6%) |
| 26 to 34 Years | 24 (88.9%) | 3 (11.1%) |
| 35 to 44 Years | 45 (100.0%) | 0 (0.0%) |
| 45 to 54 Years | 39 (100.0%) | 0 (0.0%) |
| 55 to 64 Years | 100 (98.0%) | 2 (2.0%) |
| 65 to 74 Years | 68 (100.0%) | 0 (0.0%) |
| 75 Years and older | 24 (100.0%) | 0 (0.0%) |
| Total | 400 (94.3%) | 24 (5.7%) |
Health Insurance Coverage by Citizenship Status in Manorville borough

| Citizenship Status | With Coverage | Without Coverage |
| Native Born | 3 (100.0%) | 0 (0.0%) |
| Foreign Born, Citizen | 83 (100.0%) | 0 (0.0%) |
| Foreign Born, not a Citizen | 14 (42.4%) | 19 (57.6%) |
Health Insurance Coverage by Household Income in Manorville borough
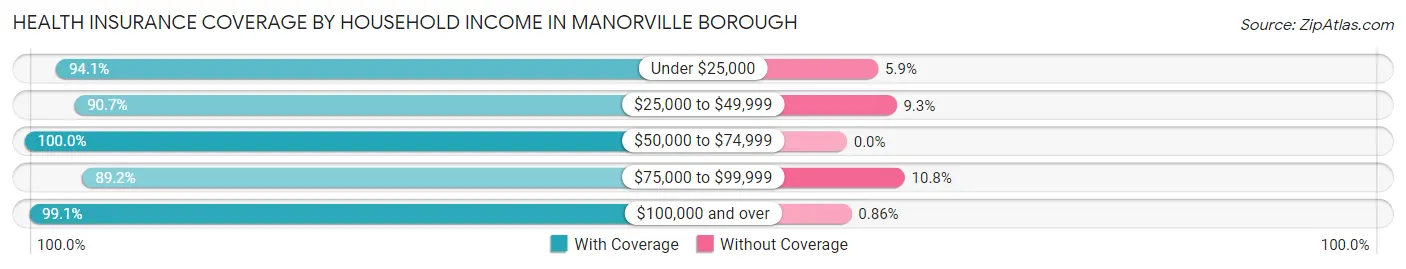
| Household Income | With Coverage | Without Coverage |
| Under $25,000 | 32 (94.1%) | 2 (5.9%) |
| $25,000 to $49,999 | 39 (90.7%) | 4 (9.3%) |
| $50,000 to $74,999 | 74 (100.0%) | 0 (0.0%) |
| $75,000 to $99,999 | 140 (89.2%) | 17 (10.8%) |
| $100,000 and over | 115 (99.1%) | 1 (0.9%) |
Public vs Private Health Insurance Coverage by Age in Manorville borough
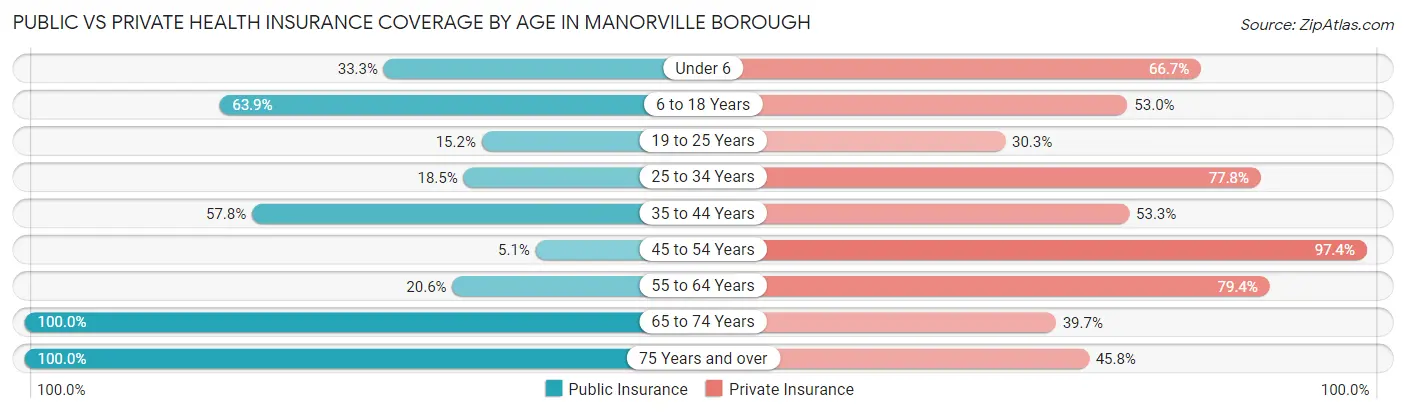
| Age Bracket | Public Insurance | Private Insurance |
| Under 6 | 1 (33.3%) | 2 (66.7%) |
| 6 to 18 Years | 53 (63.9%) | 44 (53.0%) |
| 19 to 25 Years | 5 (15.1%) | 10 (30.3%) |
| 25 to 34 Years | 5 (18.5%) | 21 (77.8%) |
| 35 to 44 Years | 26 (57.8%) | 24 (53.3%) |
| 45 to 54 Years | 2 (5.1%) | 38 (97.4%) |
| 55 to 64 Years | 21 (20.6%) | 81 (79.4%) |
| 65 to 74 Years | 68 (100.0%) | 27 (39.7%) |
| 75 Years and over | 24 (100.0%) | 11 (45.8%) |
| Total | 205 (48.3%) | 258 (60.9%) |
Disability Status by Sex by Age in Manorville borough
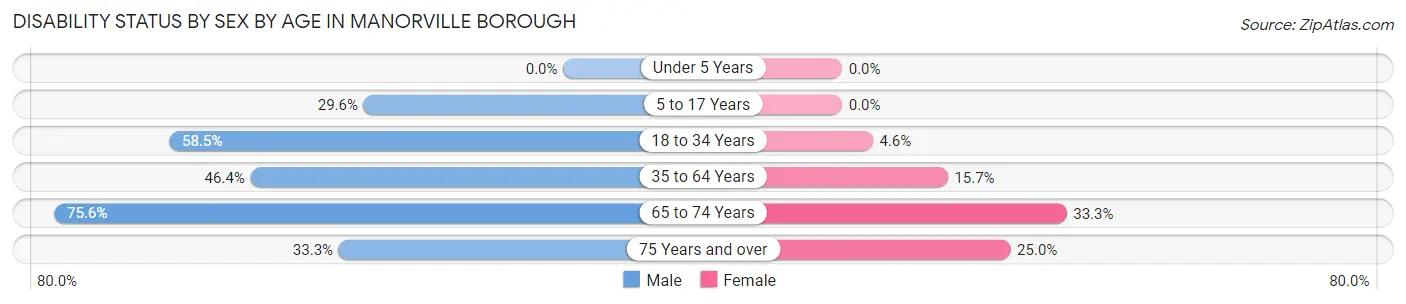
| Age Bracket | Male | Female |
| Under 5 Years | 0 (0.0%) | 0 (0.0%) |
| 5 to 17 Years | 8 (29.6%) | 0 (0.0%) |
| 18 to 34 Years | 24 (58.5%) | 1 (4.5%) |
| 35 to 64 Years | 39 (46.4%) | 16 (15.7%) |
| 65 to 74 Years | 31 (75.6%) | 9 (33.3%) |
| 75 Years and over | 4 (33.3%) | 3 (25.0%) |
Disability Class by Sex by Age in Manorville borough
Disability Class: Hearing Difficulty
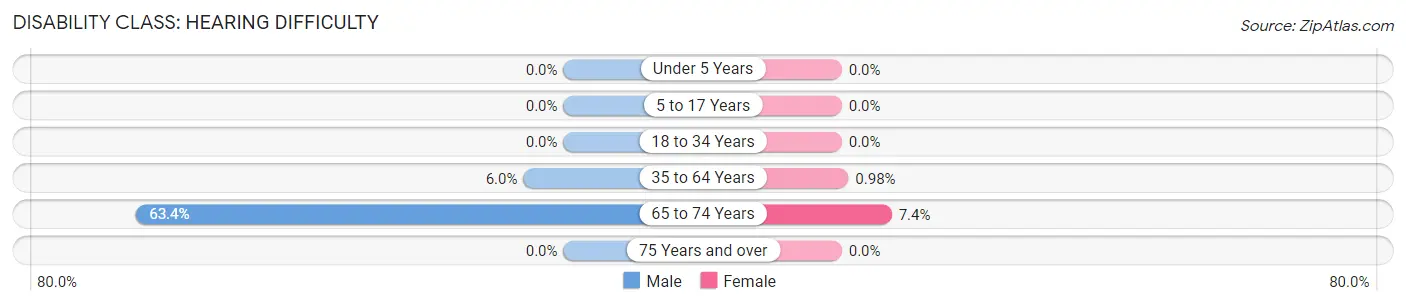
| Age Bracket | Male | Female |
| Under 5 Years | 0 (0.0%) | 0 (0.0%) |
| 5 to 17 Years | 0 (0.0%) | 0 (0.0%) |
| 18 to 34 Years | 0 (0.0%) | 0 (0.0%) |
| 35 to 64 Years | 5 (5.9%) | 1 (1.0%) |
| 65 to 74 Years | 26 (63.4%) | 2 (7.4%) |
| 75 Years and over | 0 (0.0%) | 0 (0.0%) |
Disability Class: Vision Difficulty
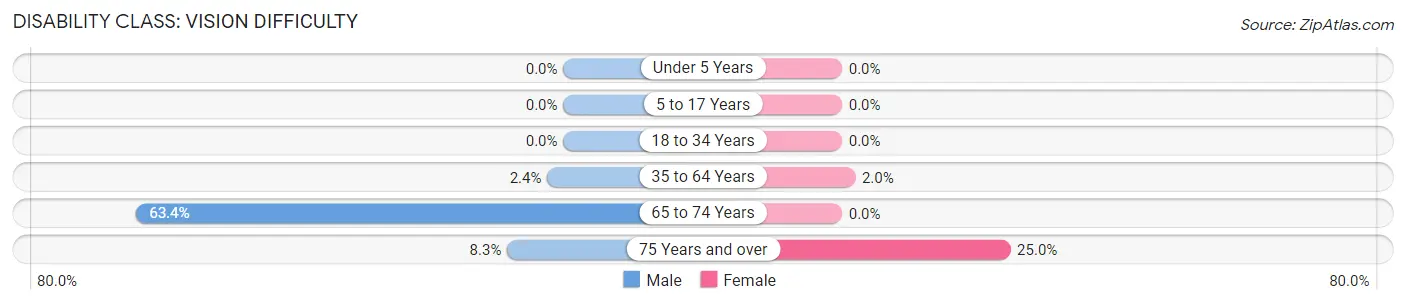
| Age Bracket | Male | Female |
| Under 5 Years | 0 (0.0%) | 0 (0.0%) |
| 5 to 17 Years | 0 (0.0%) | 0 (0.0%) |
| 18 to 34 Years | 0 (0.0%) | 0 (0.0%) |
| 35 to 64 Years | 2 (2.4%) | 2 (2.0%) |
| 65 to 74 Years | 26 (63.4%) | 0 (0.0%) |
| 75 Years and over | 1 (8.3%) | 3 (25.0%) |
Disability Class: Cognitive Difficulty
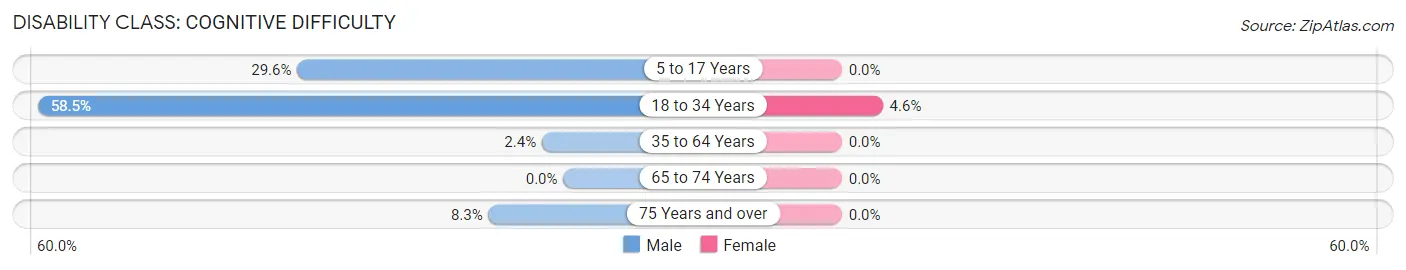
| Age Bracket | Male | Female |
| 5 to 17 Years | 8 (29.6%) | 0 (0.0%) |
| 18 to 34 Years | 24 (58.5%) | 1 (4.5%) |
| 35 to 64 Years | 2 (2.4%) | 0 (0.0%) |
| 65 to 74 Years | 0 (0.0%) | 0 (0.0%) |
| 75 Years and over | 1 (8.3%) | 0 (0.0%) |
Disability Class: Ambulatory Difficulty
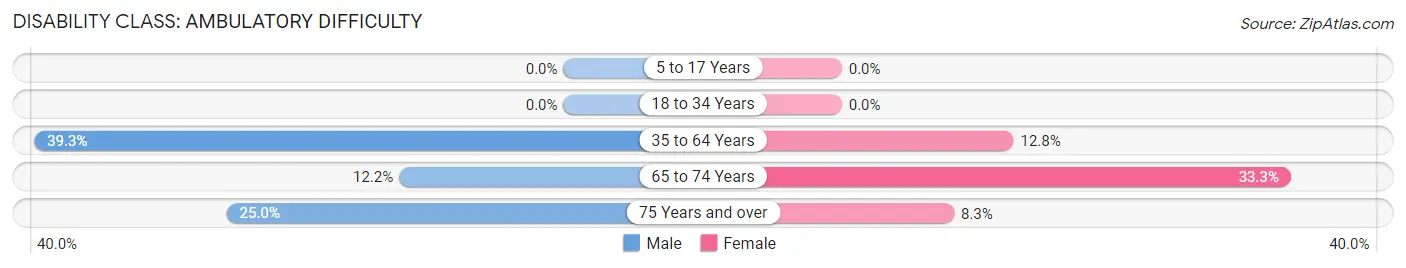
| Age Bracket | Male | Female |
| 5 to 17 Years | 0 (0.0%) | 0 (0.0%) |
| 18 to 34 Years | 0 (0.0%) | 0 (0.0%) |
| 35 to 64 Years | 33 (39.3%) | 13 (12.8%) |
| 65 to 74 Years | 5 (12.2%) | 9 (33.3%) |
| 75 Years and over | 3 (25.0%) | 1 (8.3%) |
Disability Class: Self-Care Difficulty

| Age Bracket | Male | Female |
| 5 to 17 Years | 0 (0.0%) | 0 (0.0%) |
| 18 to 34 Years | 1 (2.4%) | 0 (0.0%) |
| 35 to 64 Years | 0 (0.0%) | 0 (0.0%) |
| 65 to 74 Years | 0 (0.0%) | 0 (0.0%) |
| 75 Years and over | 1 (8.3%) | 0 (0.0%) |
Technology Access in Manorville borough
Computing Device Access in Manorville borough
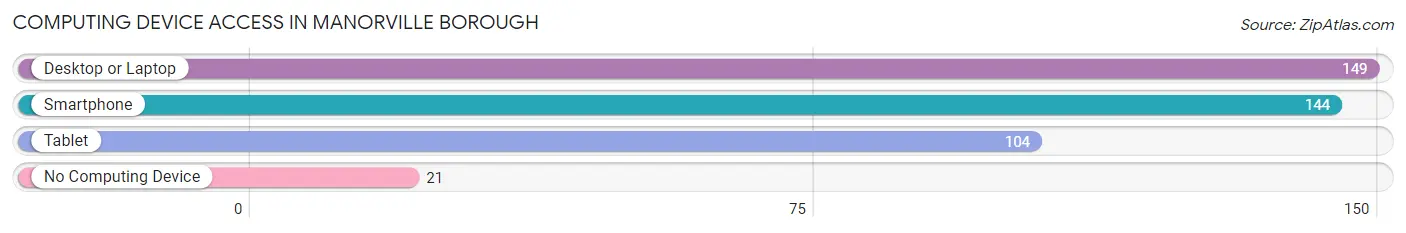
| Device Type | # Households | % Households |
| Desktop or Laptop | 149 | 85.1% |
| Smartphone | 144 | 82.3% |
| Tablet | 104 | 59.4% |
| No Computing Device | 21 | 12.0% |
| Total | 175 | 100.0% |
Internet Access in Manorville borough
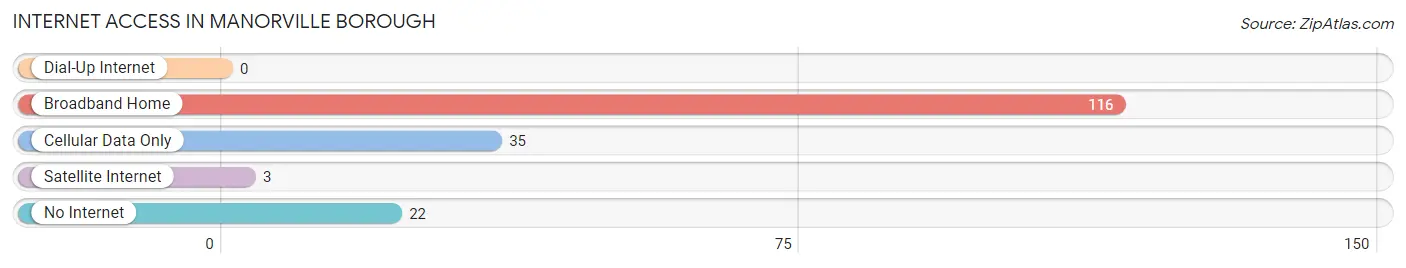
| Internet Type | # Households | % Households |
| Dial-Up Internet | 0 | 0.0% |
| Broadband Home | 116 | 66.3% |
| Cellular Data Only | 35 | 20.0% |
| Satellite Internet | 3 | 1.7% |
| No Internet | 22 | 12.6% |
| Total | 175 | 100.0% |
Manorville borough Summary
Manorville Borough is a small borough located in Westmoreland County, Pennsylvania. It is situated in the foothills of the Allegheny Mountains and is part of the Greater Pittsburgh Metropolitan Area. The borough has a population of approximately 1,000 people and covers an area of 0.6 square miles.
History
Manorville Borough was founded in 1876 by a group of settlers from the nearby town of Manor. The settlers were looking for a place to build a new community and chose the area that is now Manorville Borough. The town was originally called “Manorville” after the nearby town of Manor. The name was later changed to “Manorville Borough” in 1882.
The borough was originally a farming community and the main industry was coal mining. The coal mines provided employment for many of the residents and the town grew steadily throughout the late 19th and early 20th centuries.
In the 1950s, the coal industry began to decline and many of the mines closed. This caused a decline in the population of Manorville Borough and the town began to struggle economically. In the late 1970s, the borough began to experience a resurgence as new businesses and industries moved into the area.
Geography
Manorville Borough is located in Westmoreland County, Pennsylvania. It is situated in the foothills of the Allegheny Mountains and is part of the Greater Pittsburgh Metropolitan Area. The borough has a total area of 0.6 square miles and is bordered by the towns of Manor, New Stanton, and Youngwood.
The borough is located in a hilly region and is surrounded by forests and farmland. The climate is humid continental and the average temperature in the summer is around 75 degrees Fahrenheit. The average winter temperature is around 30 degrees Fahrenheit.
Economy
Manorville Borough’s economy is largely based on the service industry. The borough is home to several small businesses, including restaurants, retail stores, and professional services. The borough also has a few manufacturing companies, including a plastics factory and a metal fabrication plant.
The borough also has a few tourist attractions, including a historic train station and a museum. The borough is also home to a few parks and recreational areas, including a golf course and a swimming pool.
Demographics
As of the 2010 census, the population of Manorville Borough was 1,000 people. The racial makeup of the borough was 97.2% White, 0.7% African American, 0.3% Native American, 0.3% Asian, and 1.5% from other races. The median household income was $41,250 and the median family income was $50,000.
The borough has a high rate of homeownership, with over 80% of the population owning their own homes. The median value of owner-occupied homes is $90,000. The borough also has a high rate of educational attainment, with over 90% of the population having at least a high school diploma.
Conclusion
Manorville Borough is a small borough located in Westmoreland County, Pennsylvania. It is situated in the foothills of the Allegheny Mountains and is part of the Greater Pittsburgh Metropolitan Area. The borough has a population of approximately 1,000 people and covers an area of 0.6 square miles. The borough was founded in 1876 and has a long history of coal mining and farming. Today, the borough’s economy is largely based on the service industry and the borough has a high rate of homeownership and educational attainment.
Common Questions
What is Per Capita Income in Manorville borough?
Per Capita income in Manorville borough is $34,769.
What is the Median Family Income in Manorville borough?
Median Family Income in Manorville borough is $92,000.
What is the Median Household income in Manorville borough?
Median Household Income in Manorville borough is $73,843.
What is Income or Wage Gap in Manorville borough?
Income or Wage Gap in Manorville borough is 23.1%.
Women in Manorville borough earn 76.9 cents for every dollar earned by a man.
What is Inequality or Gini Index in Manorville borough?
Inequality or Gini Index in Manorville borough is 0.34.
What is the Total Population of Manorville borough?
Total Population of Manorville borough is 426.
What is the Total Male Population of Manorville borough?
Total Male Population of Manorville borough is 209.
What is the Total Female Population of Manorville borough?
Total Female Population of Manorville borough is 217.
What is the Ratio of Males per 100 Females in Manorville borough?
There are 96.31 Males per 100 Females in Manorville borough.
What is the Ratio of Females per 100 Males in Manorville borough?
There are 103.83 Females per 100 Males in Manorville borough.
What is the Median Population Age in Manorville borough?
Median Population Age in Manorville borough is 46.3 Years.
What is the Average Family Size in Manorville borough
Average Family Size in Manorville borough is 3.4 People.
What is the Average Household Size in Manorville borough
Average Household Size in Manorville borough is 2.4 People.
How Large is the Labor Force in Manorville borough?
There are 203 People in the Labor Forcein in Manorville borough.
What is the Percentage of People in the Labor Force in Manorville borough?
56.9% of People are in the Labor Force in Manorville borough.
What is the Unemployment Rate in Manorville borough?
Unemployment Rate in Manorville borough is 8.5%.