Hampton, PA Map & Demographics
Hampton Map
Hampton Overview
$31,423
PER CAPITA INCOME
$95,357
AVG FAMILY INCOME
$82,557
AVG HOUSEHOLD INCOME
72.9%
WAGE / INCOME GAP [ % ]
27.1¢/ $1
WAGE / INCOME GAP [ $ ]
0.37
INEQUALITY / GINI INDEX
1,701
TOTAL POPULATION
883
MALE POPULATION
818
FEMALE POPULATION
107.95
MALES / 100 FEMALES
92.64
FEMALES / 100 MALES
39.4
MEDIAN AGE
3.0
AVG FAMILY SIZE
2.8
AVG HOUSEHOLD SIZE
903
LABOR FORCE [ PEOPLE ]
68.7%
PERCENT IN LABOR FORCE
11.2%
UNEMPLOYMENT RATE
Income in Hampton
Income Overview in Hampton
Per Capita Income in Hampton is $31,423, while median incomes of families and households are $95,357 and $82,557 respectively.
| Characteristic | Number | Measure |
| Per Capita Income | 1,701 | $31,423 |
| Median Family Income | 498 | $95,357 |
| Mean Family Income | 498 | $98,872 |
| Median Household Income | 599 | $82,557 |
| Mean Household Income | 599 | $88,472 |
| Income Deficit | 498 | $0 |
| Wage / Income Gap (%) | 1,701 | 72.87% |
| Wage / Income Gap ($) | 1,701 | 27.13¢ per $1 |
| Gini / Inequality Index | 1,701 | 0.37 |
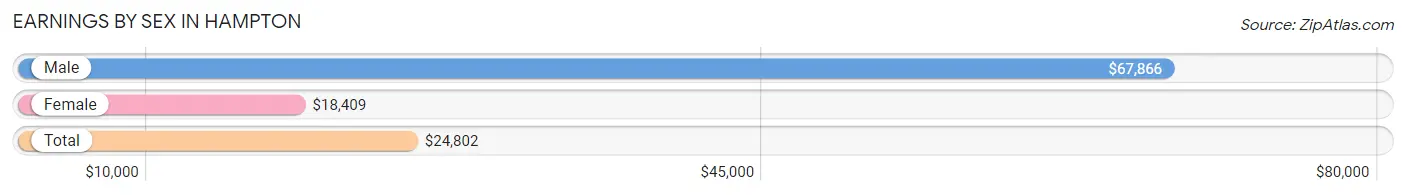
Earnings by Sex in Hampton
Average Earnings in Hampton are $24,802, $67,866 for men and $18,409 for women, a difference of 72.9%.
| Sex | Number | Average Earnings |
| Male | 440 (46.0%) | $67,866 |
| Female | 516 (54.0%) | $18,409 |
| Total | 956 (100.0%) | $24,802 |
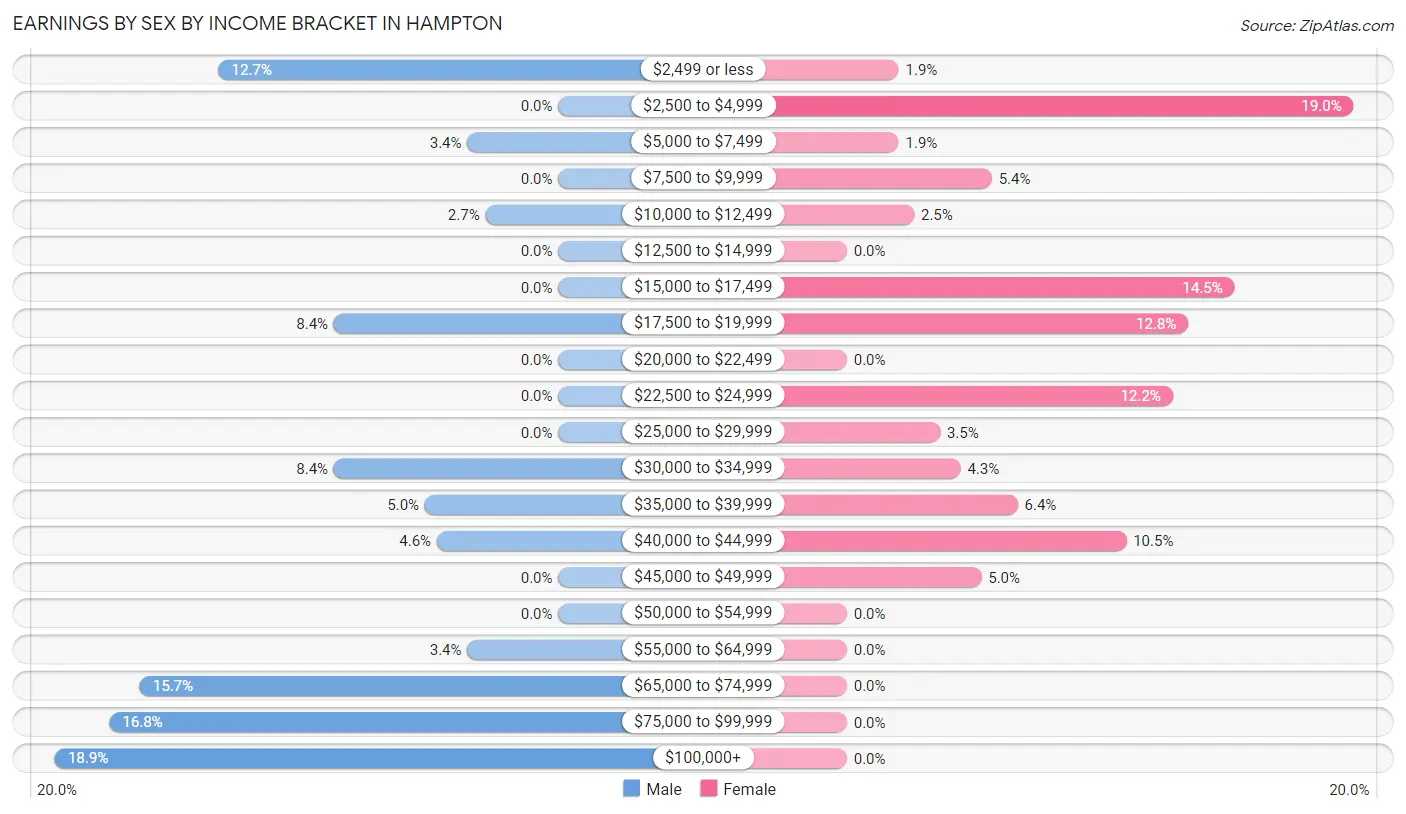
Earnings by Sex by Income Bracket in Hampton
The most common earnings brackets in Hampton are $100,000+ for men (83 | 18.9%) and $2,500 to $4,999 for women (98 | 19.0%).
| Income | Male | Female |
| $2,499 or less | 56 (12.7%) | 10 (1.9%) |
| $2,500 to $4,999 | 0 (0.0%) | 98 (19.0%) |
| $5,000 to $7,499 | 15 (3.4%) | 10 (1.9%) |
| $7,500 to $9,999 | 0 (0.0%) | 28 (5.4%) |
| $10,000 to $12,499 | 12 (2.7%) | 13 (2.5%) |
| $12,500 to $14,999 | 0 (0.0%) | 0 (0.0%) |
| $15,000 to $17,499 | 0 (0.0%) | 75 (14.5%) |
| $17,500 to $19,999 | 37 (8.4%) | 66 (12.8%) |
| $20,000 to $22,499 | 0 (0.0%) | 0 (0.0%) |
| $22,500 to $24,999 | 0 (0.0%) | 63 (12.2%) |
| $25,000 to $29,999 | 0 (0.0%) | 18 (3.5%) |
| $30,000 to $34,999 | 37 (8.4%) | 22 (4.3%) |
| $35,000 to $39,999 | 22 (5.0%) | 33 (6.4%) |
| $40,000 to $44,999 | 20 (4.5%) | 54 (10.5%) |
| $45,000 to $49,999 | 0 (0.0%) | 26 (5.0%) |
| $50,000 to $54,999 | 0 (0.0%) | 0 (0.0%) |
| $55,000 to $64,999 | 15 (3.4%) | 0 (0.0%) |
| $65,000 to $74,999 | 69 (15.7%) | 0 (0.0%) |
| $75,000 to $99,999 | 74 (16.8%) | 0 (0.0%) |
| $100,000+ | 83 (18.9%) | 0 (0.0%) |
| Total | 440 (100.0%) | 516 (100.0%) |
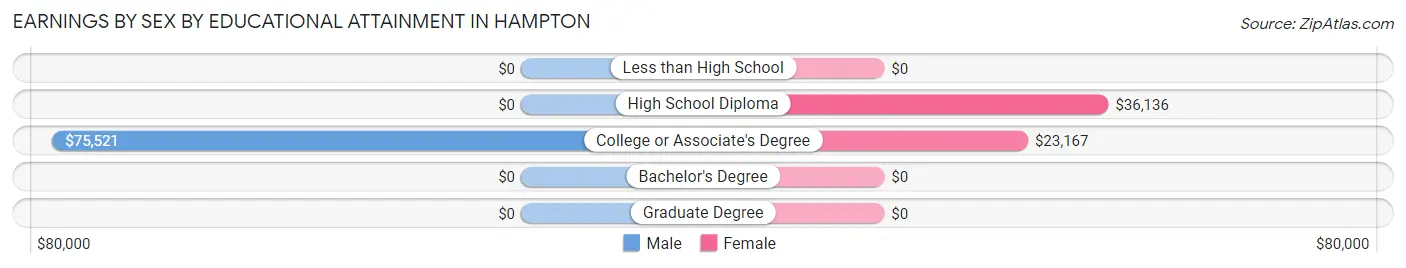
Earnings by Sex by Educational Attainment in Hampton
Average earnings in Hampton are $68,323 for men and $23,810 for women, a difference of 65.1%. Men with an educational attainment of college or associate's degree enjoy the highest average annual earnings of $75,521, while those with college or associate's degree education earn the least with $75,521. Women with an educational attainment of high school diploma earn the most with the average annual earnings of $36,136, while those with college or associate's degree education have the smallest earnings of $23,167.
| Educational Attainment | Male Income | Female Income |
| Less than High School | - | - |
| High School Diploma | - | - |
| College or Associate's Degree | $75,521 | $23,167 |
| Bachelor's Degree | - | - |
| Graduate Degree | - | - |
| Total | $68,323 | $23,810 |
Family Income in Hampton
Family Income Brackets in Hampton
According to the Hampton family income data, there are 162 families falling into the $100,000 to $149,999 income range, which is the most common income bracket and makes up 32.5% of all families.
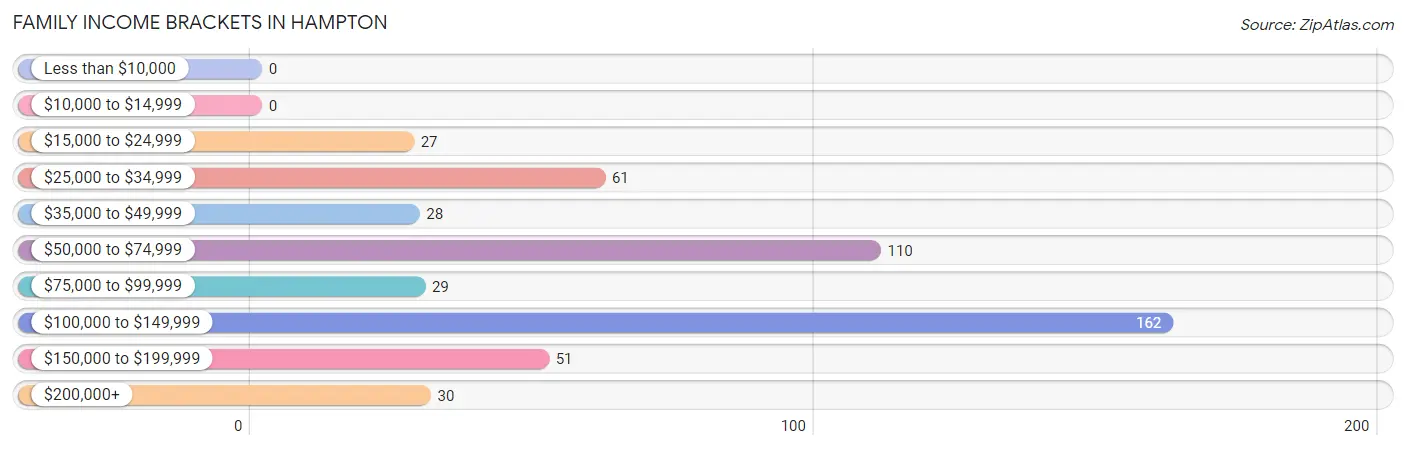
| Income Bracket | # Families | % Families |
| Less than $10,000 | 0 | 0.0% |
| $10,000 to $14,999 | 0 | 0.0% |
| $15,000 to $24,999 | 27 | 5.4% |
| $25,000 to $34,999 | 61 | 12.2% |
| $35,000 to $49,999 | 28 | 5.6% |
| $50,000 to $74,999 | 110 | 22.1% |
| $75,000 to $99,999 | 29 | 5.8% |
| $100,000 to $149,999 | 162 | 32.5% |
| $150,000 to $199,999 | 51 | 10.2% |
| $200,000+ | 30 | 6.0% |
Family Income by Famaliy Size in Hampton
2-person families (317 | 63.6%) account for the highest median family income in Hampton with $63,345 per family, while 2-person families (317 | 63.6%) have the highest median income of $31,672 per family member.
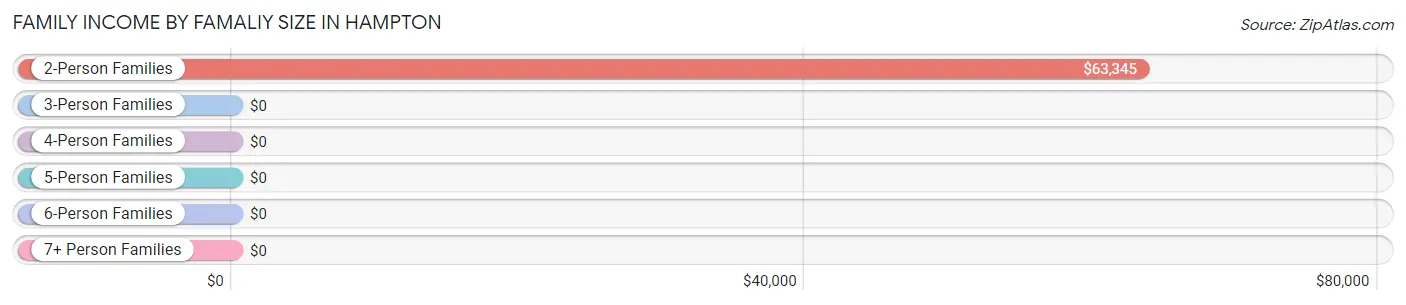
| Income Bracket | # Families | Median Income |
| 2-Person Families | 317 (63.6%) | $63,345 |
| 3-Person Families | 41 (8.2%) | $0 |
| 4-Person Families | 42 (8.4%) | $0 |
| 5-Person Families | 95 (19.1%) | $0 |
| 6-Person Families | 3 (0.6%) | $0 |
| 7+ Person Families | 0 (0.0%) | $0 |
| Total | 498 (100.0%) | $95,357 |
Family Income by Number of Earners in Hampton
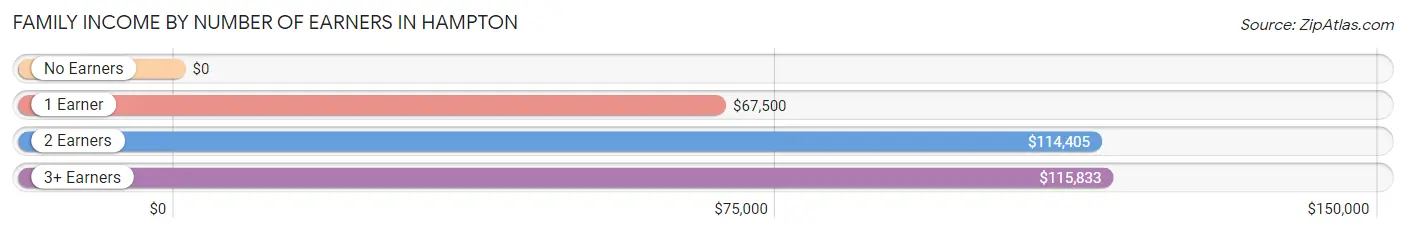
| Number of Earners | # Families | Median Income |
| No Earners | 104 (20.9%) | $0 |
| 1 Earner | 86 (17.3%) | $67,500 |
| 2 Earners | 240 (48.2%) | $114,405 |
| 3+ Earners | 68 (13.7%) | $115,833 |
| Total | 498 (100.0%) | $95,357 |
Household Income in Hampton
Household Income Brackets in Hampton
With 162 households falling in the category, the $100,000 to $149,999 income range is the most frequent in Hampton, accounting for 27.1% of all households.
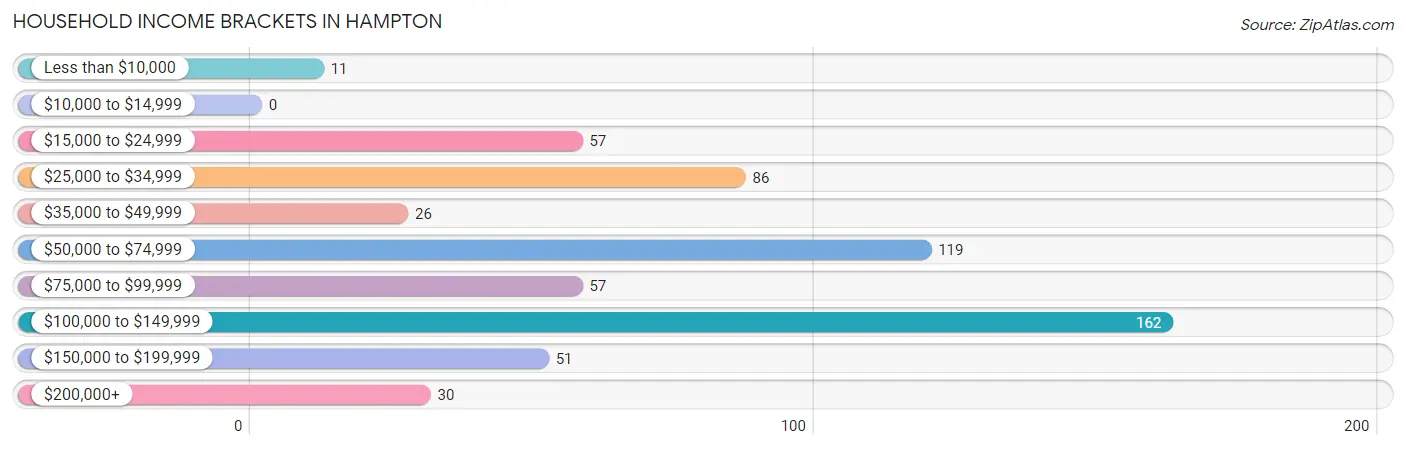
| Income Bracket | # Households | % Households |
| Less than $10,000 | 11 | 1.8% |
| $10,000 to $14,999 | 0 | 0.0% |
| $15,000 to $24,999 | 57 | 9.5% |
| $25,000 to $34,999 | 86 | 14.4% |
| $35,000 to $49,999 | 26 | 4.3% |
| $50,000 to $74,999 | 119 | 19.9% |
| $75,000 to $99,999 | 57 | 9.5% |
| $100,000 to $149,999 | 162 | 27.0% |
| $150,000 to $199,999 | 51 | 8.5% |
| $200,000+ | 30 | 5.0% |
Household Income by Householder Age in Hampton
The median household income in Hampton is $82,557, with the highest median household income of $116,667 found in the 25 to 44 years age bracket for the primary householder. A total of 162 households (27.1%) fall into this category.
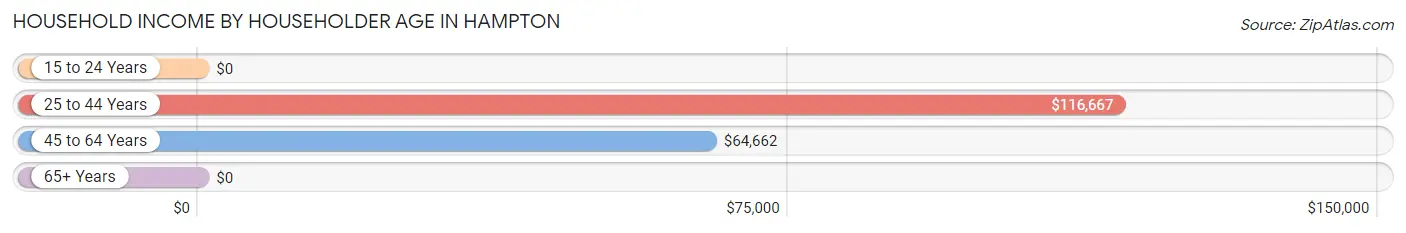
| Income Bracket | # Households | Median Income |
| 15 to 24 Years | 0 (0.0%) | $0 |
| 25 to 44 Years | 162 (27.1%) | $116,667 |
| 45 to 64 Years | 270 (45.1%) | $64,662 |
| 65+ Years | 167 (27.9%) | $0 |
| Total | 599 (100.0%) | $82,557 |
Poverty in Hampton
Income Below Poverty by Sex and Age in Hampton
With 5.0% poverty level for males and 1.8% for females among the residents of Hampton, 18 to 24 year old males and 35 to 44 year old females are the most vulnerable to poverty, with 15 males (48.4%) and 15 females (15.1%) in their respective age groups living below the poverty level.
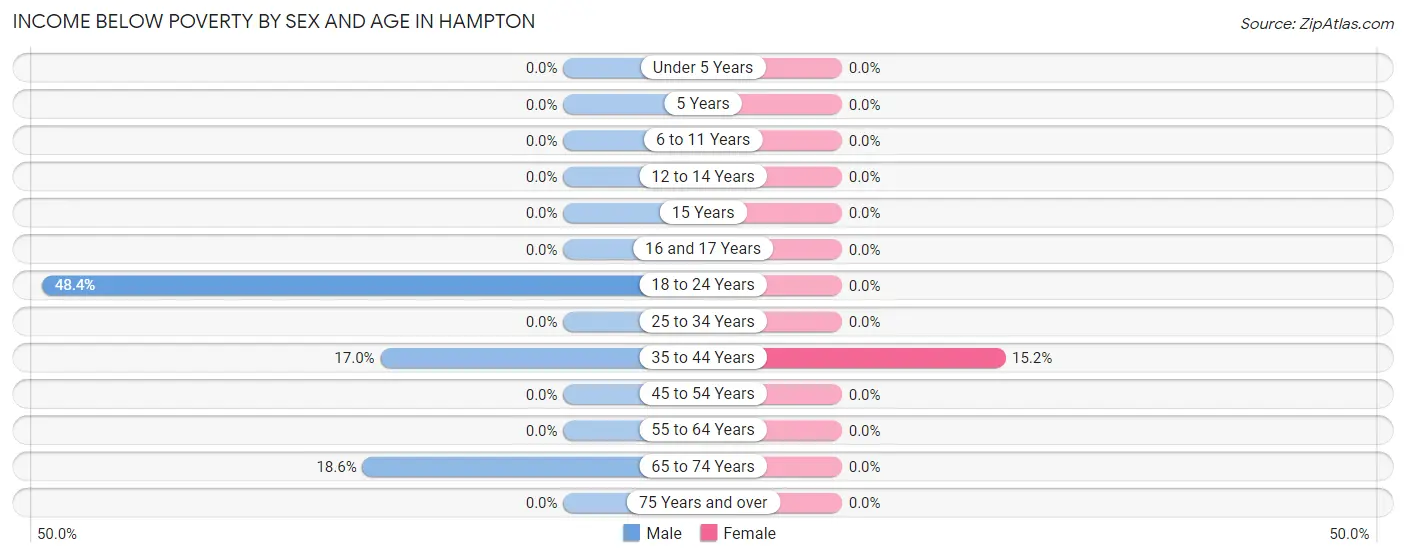
| Age Bracket | Male | Female |
| Under 5 Years | 0 (0.0%) | 0 (0.0%) |
| 5 Years | 0 (0.0%) | 0 (0.0%) |
| 6 to 11 Years | 0 (0.0%) | 0 (0.0%) |
| 12 to 14 Years | 0 (0.0%) | 0 (0.0%) |
| 15 Years | 0 (0.0%) | 0 (0.0%) |
| 16 and 17 Years | 0 (0.0%) | 0 (0.0%) |
| 18 to 24 Years | 15 (48.4%) | 0 (0.0%) |
| 25 to 34 Years | 0 (0.0%) | 0 (0.0%) |
| 35 to 44 Years | 18 (17.0%) | 15 (15.1%) |
| 45 to 54 Years | 0 (0.0%) | 0 (0.0%) |
| 55 to 64 Years | 0 (0.0%) | 0 (0.0%) |
| 65 to 74 Years | 11 (18.6%) | 0 (0.0%) |
| 75 Years and over | 0 (0.0%) | 0 (0.0%) |
| Total | 44 (5.0%) | 15 (1.8%) |
Income Above Poverty by Sex and Age in Hampton
According to the poverty statistics in Hampton, males aged under 5 years and females aged under 5 years are the age groups that are most secure financially, with 100.0% of males and 100.0% of females in these age groups living above the poverty line.
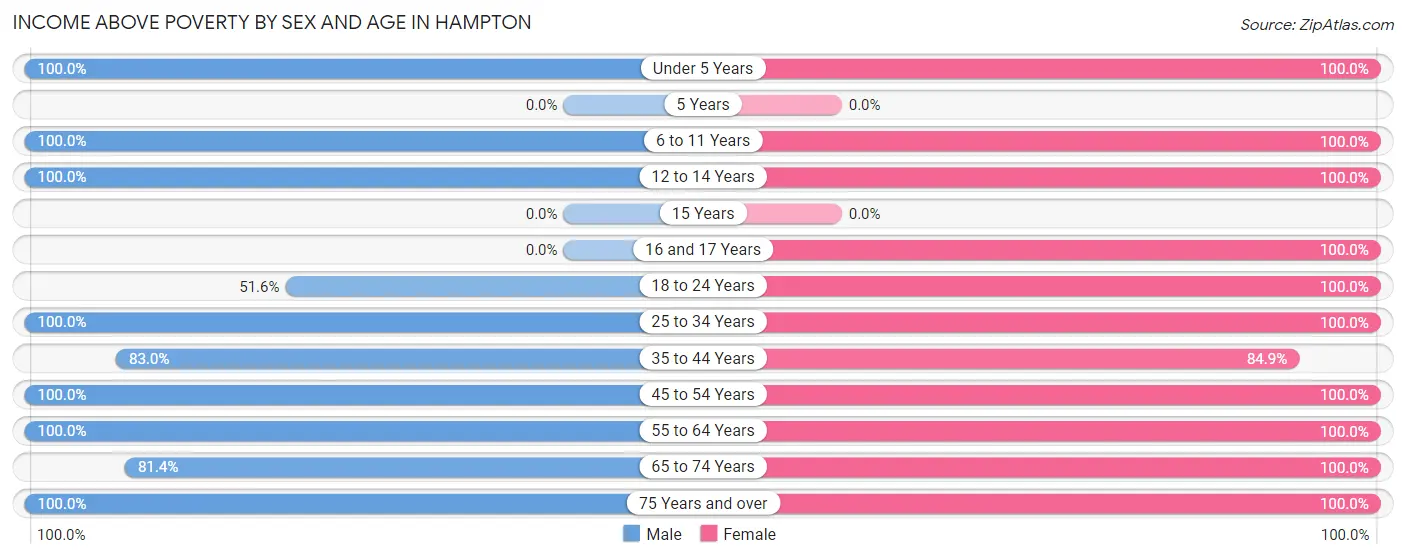
| Age Bracket | Male | Female |
| Under 5 Years | 2 (100.0%) | 16 (100.0%) |
| 5 Years | 0 (0.0%) | 0 (0.0%) |
| 6 to 11 Years | 203 (100.0%) | 13 (100.0%) |
| 12 to 14 Years | 99 (100.0%) | 53 (100.0%) |
| 15 Years | 0 (0.0%) | 0 (0.0%) |
| 16 and 17 Years | 0 (0.0%) | 20 (100.0%) |
| 18 to 24 Years | 16 (51.6%) | 172 (100.0%) |
| 25 to 34 Years | 113 (100.0%) | 60 (100.0%) |
| 35 to 44 Years | 88 (83.0%) | 84 (84.9%) |
| 45 to 54 Years | 114 (100.0%) | 137 (100.0%) |
| 55 to 64 Years | 93 (100.0%) | 116 (100.0%) |
| 65 to 74 Years | 48 (81.4%) | 88 (100.0%) |
| 75 Years and over | 63 (100.0%) | 44 (100.0%) |
| Total | 839 (95.0%) | 803 (98.2%) |
Income Below Poverty Among Married-Couple Families in Hampton
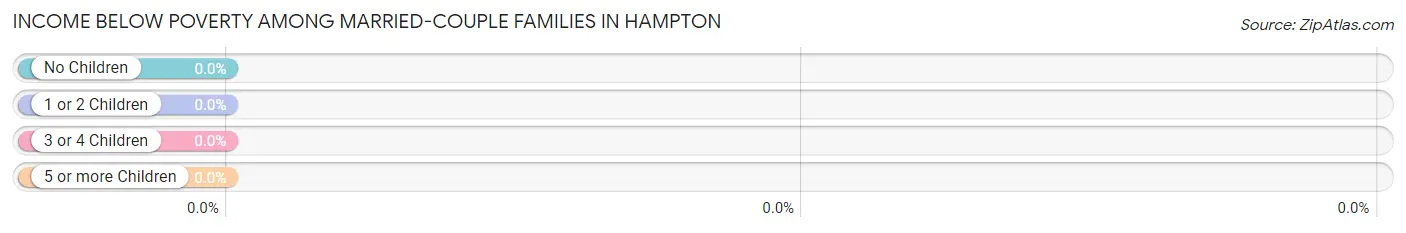
| Children | Above Poverty | Below Poverty |
| No Children | 205 (100.0%) | 0 (0.0%) |
| 1 or 2 Children | 56 (100.0%) | 0 (0.0%) |
| 3 or 4 Children | 62 (100.0%) | 0 (0.0%) |
| 5 or more Children | 0 (0.0%) | 0 (0.0%) |
| Total | 323 (100.0%) | 0 (0.0%) |
Income Below Poverty Among Single-Parent Households in Hampton
| Children | Single Father | Single Mother |
| No Children | 0 (0.0%) | 0 (0.0%) |
| 1 or 2 Children | 0 (0.0%) | 0 (0.0%) |
| 3 or 4 Children | 0 (0.0%) | 0 (0.0%) |
| 5 or more Children | 0 (0.0%) | 0 (0.0%) |
| Total | 0 (0.0%) | 0 (0.0%) |
Income Below Poverty Among Married-Couple vs Single-Parent Households in Hampton
| Children | Married-Couple Families | Single-Parent Households |
| No Children | 0 (0.0%) | 0 (0.0%) |
| 1 or 2 Children | 0 (0.0%) | 0 (0.0%) |
| 3 or 4 Children | 0 (0.0%) | 0 (0.0%) |
| 5 or more Children | 0 (0.0%) | 0 (0.0%) |
| Total | 0 (0.0%) | 0 (0.0%) |
Race in Hampton
The most populous races in Hampton are White / Caucasian (1,505 | 88.5%), Hispanic or Latino (123 | 7.2%), and Two or more Races (94 | 5.5%).
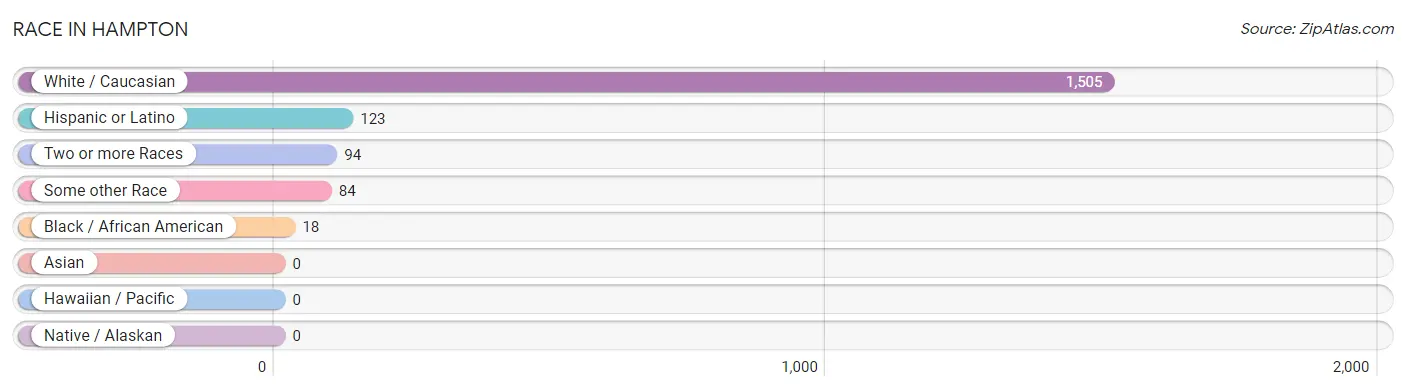
| Race | # Population | % Population |
| Asian | 0 | 0.0% |
| Black / African American | 18 | 1.1% |
| Hawaiian / Pacific | 0 | 0.0% |
| Hispanic or Latino | 123 | 7.2% |
| Native / Alaskan | 0 | 0.0% |
| White / Caucasian | 1,505 | 88.5% |
| Two or more Races | 94 | 5.5% |
| Some other Race | 84 | 4.9% |
| Total | 1,701 | 100.0% |
Ancestry in Hampton
The most populous ancestries reported in Hampton are German (581 | 34.2%), American (104 | 6.1%), Italian (91 | 5.3%), Mexican (84 | 4.9%), and English (60 | 3.5%), together accounting for 54.1% of all Hampton residents.
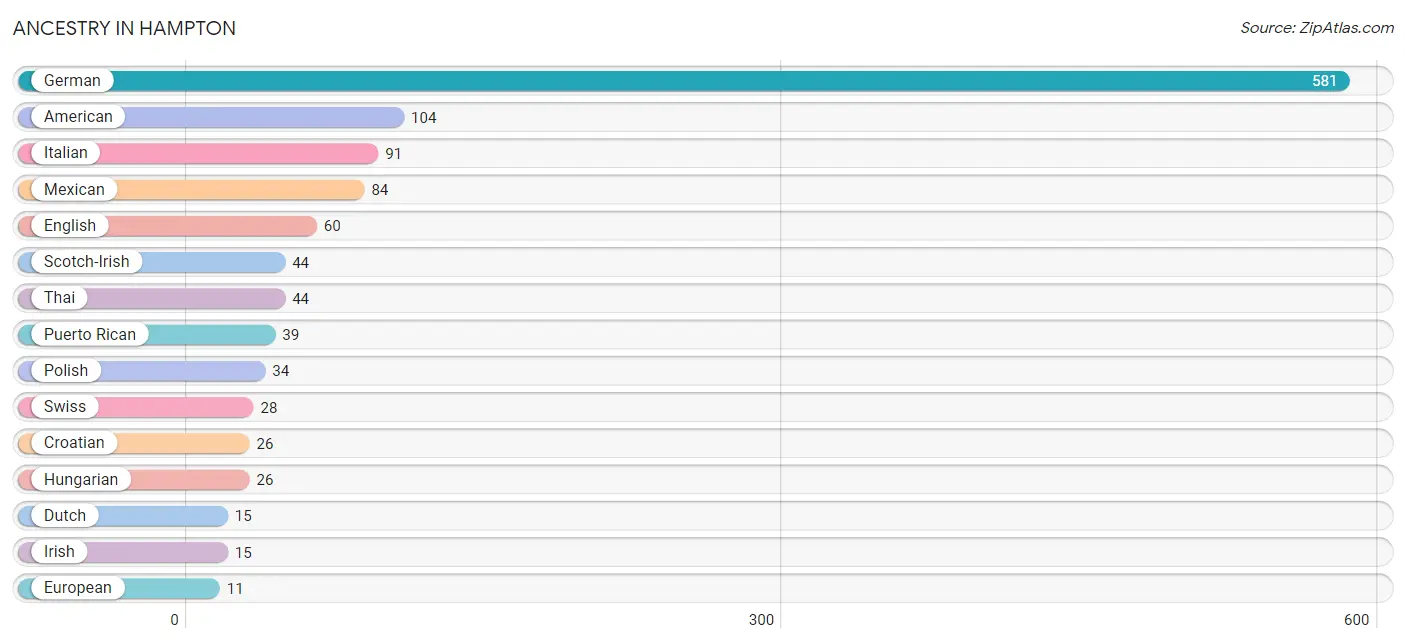
| Ancestry | # Population | % Population |
| American | 104 | 6.1% |
| Croatian | 26 | 1.5% |
| Dutch | 15 | 0.9% |
| English | 60 | 3.5% |
| European | 11 | 0.6% |
| French | 3 | 0.2% |
| German | 581 | 34.2% |
| Hungarian | 26 | 1.5% |
| Irish | 15 | 0.9% |
| Italian | 91 | 5.3% |
| Mexican | 84 | 4.9% |
| Polish | 34 | 2.0% |
| Puerto Rican | 39 | 2.3% |
| Scotch-Irish | 44 | 2.6% |
| Swedish | 10 | 0.6% |
| Swiss | 28 | 1.7% |
| Thai | 44 | 2.6% | View All 17 Rows |
Immigrants in Hampton
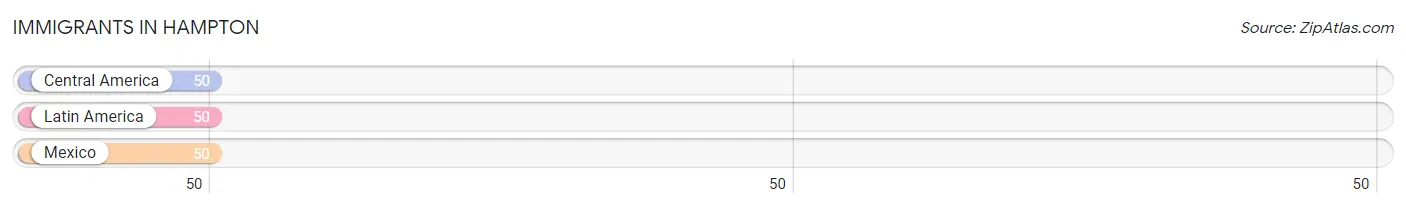
The most numerous immigrant groups reported in Hampton came from Central America (50 | 2.9%), Latin America (50 | 2.9%), and Mexico (50 | 2.9%), together accounting for 8.8% of all Hampton residents.
| Immigration Origin | # Population | % Population |
| Central America | 50 | 2.9% |
| Latin America | 50 | 2.9% |
| Mexico | 50 | 2.9% | View All 3 Rows |
Sex and Age in Hampton
Sex and Age in Hampton
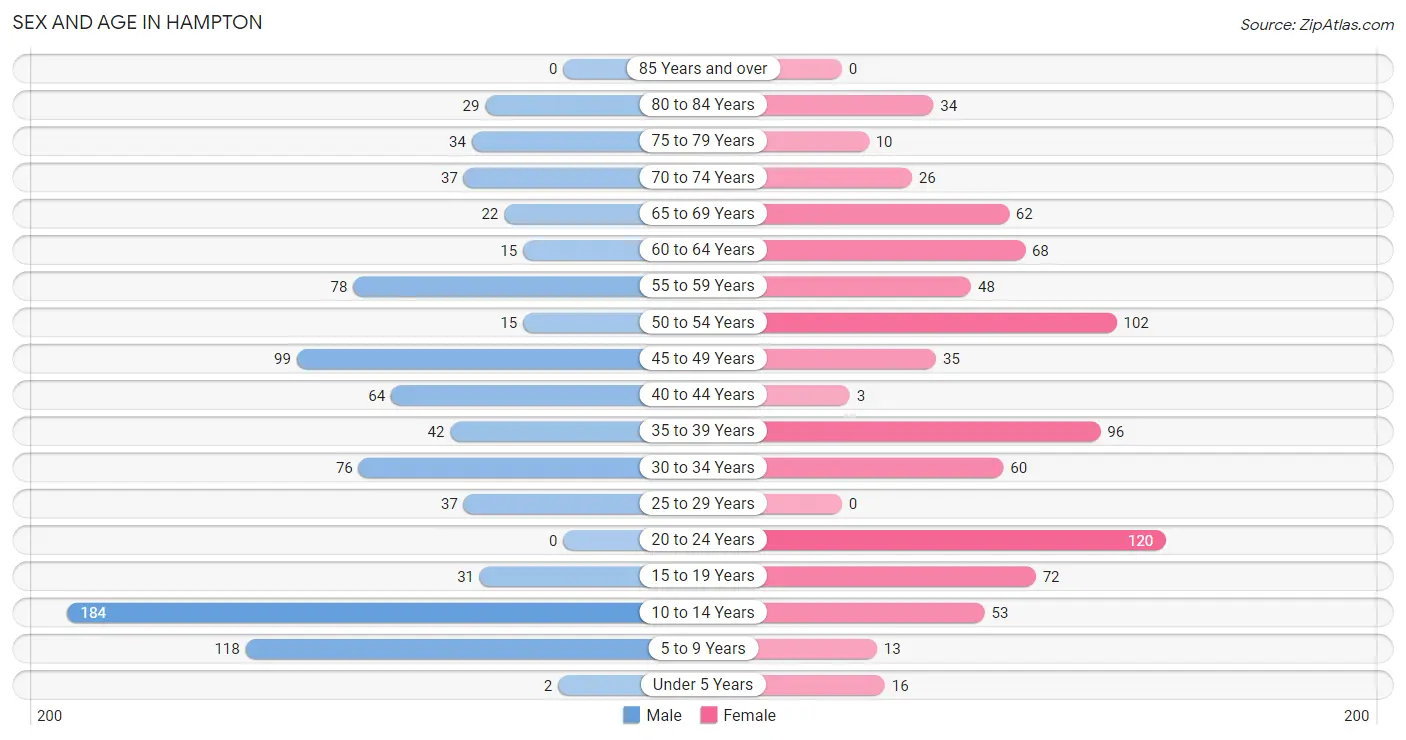
The most populous age groups in Hampton are 10 to 14 Years (184 | 20.8%) for men and 20 to 24 Years (120 | 14.7%) for women.
| Age Bracket | Male | Female |
| Under 5 Years | 2 (0.2%) | 16 (2.0%) |
| 5 to 9 Years | 118 (13.4%) | 13 (1.6%) |
| 10 to 14 Years | 184 (20.8%) | 53 (6.5%) |
| 15 to 19 Years | 31 (3.5%) | 72 (8.8%) |
| 20 to 24 Years | 0 (0.0%) | 120 (14.7%) |
| 25 to 29 Years | 37 (4.2%) | 0 (0.0%) |
| 30 to 34 Years | 76 (8.6%) | 60 (7.3%) |
| 35 to 39 Years | 42 (4.8%) | 96 (11.7%) |
| 40 to 44 Years | 64 (7.2%) | 3 (0.4%) |
| 45 to 49 Years | 99 (11.2%) | 35 (4.3%) |
| 50 to 54 Years | 15 (1.7%) | 102 (12.5%) |
| 55 to 59 Years | 78 (8.8%) | 48 (5.9%) |
| 60 to 64 Years | 15 (1.7%) | 68 (8.3%) |
| 65 to 69 Years | 22 (2.5%) | 62 (7.6%) |
| 70 to 74 Years | 37 (4.2%) | 26 (3.2%) |
| 75 to 79 Years | 34 (3.8%) | 10 (1.2%) |
| 80 to 84 Years | 29 (3.3%) | 34 (4.2%) |
| 85 Years and over | 0 (0.0%) | 0 (0.0%) |
| Total | 883 (100.0%) | 818 (100.0%) |
Families and Households in Hampton
Median Family Size in Hampton
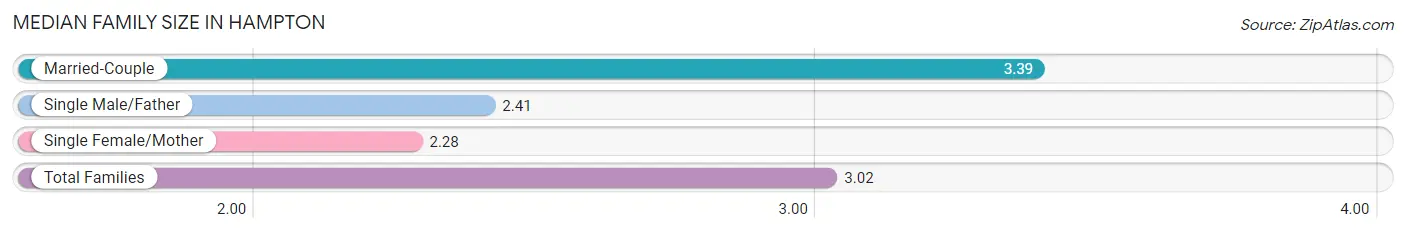
The median family size in Hampton is 3.02 persons per family, with married-couple families (323 | 64.9%) accounting for the largest median family size of 3.39 persons per family. On the other hand, single female/mother families (124 | 24.9%) represent the smallest median family size with 2.28 persons per family.
| Family Type | # Families | Family Size |
| Married-Couple | 323 (64.9%) | 3.39 |
| Single Male/Father | 51 (10.2%) | 2.41 |
| Single Female/Mother | 124 (24.9%) | 2.28 |
| Total Families | 498 (100.0%) | 3.02 |
Median Household Size in Hampton
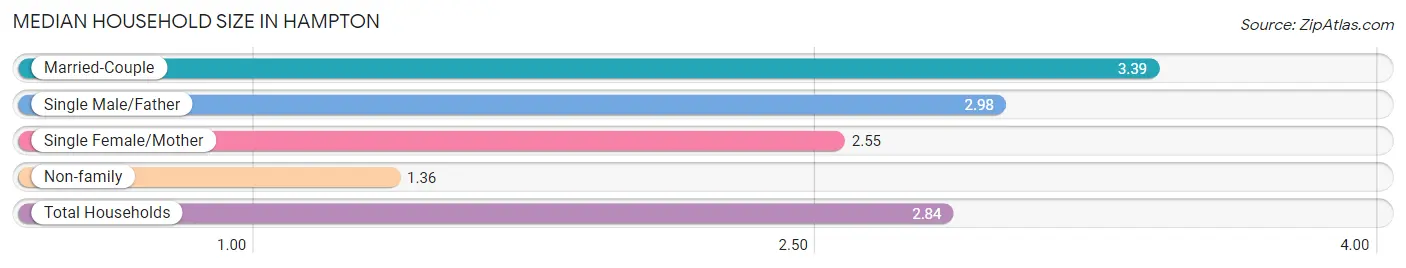
The median household size in Hampton is 2.84 persons per household, with married-couple households (323 | 53.9%) accounting for the largest median household size of 3.39 persons per household. non-family households (101 | 16.9%) represent the smallest median household size with 1.36 persons per household.
| Household Type | # Households | Household Size |
| Married-Couple | 323 (53.9%) | 3.39 |
| Single Male/Father | 51 (8.5%) | 2.98 |
| Single Female/Mother | 124 (20.7%) | 2.55 |
| Non-family | 101 (16.9%) | 1.36 |
| Total Households | 599 (100.0%) | 2.84 |
Household Size by Marriage Status in Hampton
Out of a total of 599 households in Hampton, 498 (83.1%) are family households, while 101 (16.9%) are nonfamily households. The most numerous type of family households are 2-person households, comprising 272, and the most common type of nonfamily households are 1-person households, comprising 67.
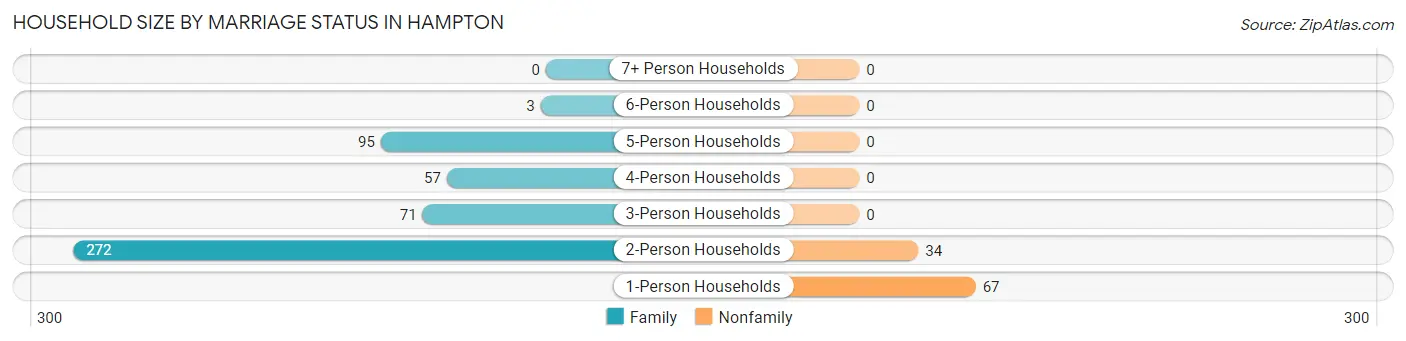
| Household Size | Family Households | Nonfamily Households |
| 1-Person Households | - | 67 (11.2%) |
| 2-Person Households | 272 (45.4%) | 34 (5.7%) |
| 3-Person Households | 71 (11.8%) | 0 (0.0%) |
| 4-Person Households | 57 (9.5%) | 0 (0.0%) |
| 5-Person Households | 95 (15.9%) | 0 (0.0%) |
| 6-Person Households | 3 (0.5%) | 0 (0.0%) |
| 7+ Person Households | 0 (0.0%) | 0 (0.0%) |
| Total | 498 (83.1%) | 101 (16.9%) |
Female Fertility in Hampton
Fertility by Age in Hampton
| Age Bracket | Women with Births | Births / 1,000 Women |
| 15 to 19 years | 0 (0.0%) | 0.0 |
| 20 to 34 years | 0 (0.0%) | 0.0 |
| 35 to 50 years | 0 (0.0%) | 0.0 |
| Total | 0 (0.0%) | 0.0 |
Fertility by Age by Marriage Status in Hampton
| Age Bracket | Married | Unmarried |
| 15 to 19 years | 0 (0.0%) | 0 (0.0%) |
| 20 to 34 years | 0 (0.0%) | 0 (0.0%) |
| 35 to 50 years | 0 (0.0%) | 0 (0.0%) |
| Total | 0 (0.0%) | 0 (0.0%) |
Fertility by Education in Hampton
| Educational Attainment | Women with Births | Births / 1,000 Women |
| Less than High School | 0 (0.0%) | 0.0 |
| High School Diploma | 0 (0.0%) | 0.0 |
| College or Associate's Degree | 0 (0.0%) | 0.0 |
| Bachelor's Degree | 0 (0.0%) | 0.0 |
| Graduate Degree | 0 (0.0%) | 0.0 |
| Total | 0 (0.0%) | 0.0 |
Fertility by Education by Marriage Status in Hampton
| Educational Attainment | Married | Unmarried |
| Less than High School | 0 (0.0%) | 0 (0.0%) |
| High School Diploma | 0 (0.0%) | 0 (0.0%) |
| College or Associate's Degree | 0 (0.0%) | 0 (0.0%) |
| Bachelor's Degree | 0 (0.0%) | 0 (0.0%) |
| Graduate Degree | 0 (0.0%) | 0 (0.0%) |
| Total | 0 (0.0%) | 0 (0.0%) |
Employment Characteristics in Hampton
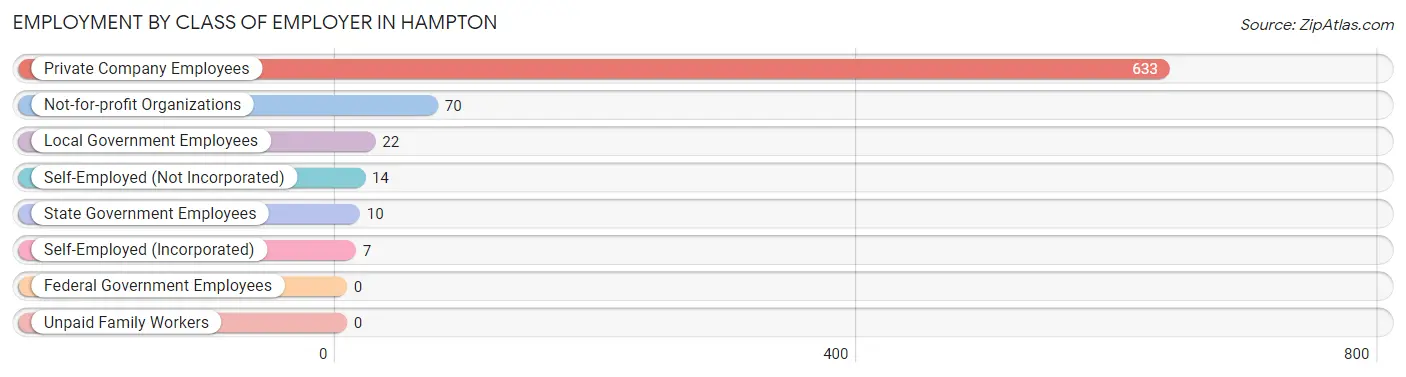
Employment by Class of Employer in Hampton
Among the 756 employed individuals in Hampton, private company employees (633 | 83.7%), not-for-profit organizations (70 | 9.3%), and local government employees (22 | 2.9%) make up the most common classes of employment.
| Employer Class | # Employees | % Employees |
| Private Company Employees | 633 | 83.7% |
| Self-Employed (Incorporated) | 7 | 0.9% |
| Self-Employed (Not Incorporated) | 14 | 1.8% |
| Not-for-profit Organizations | 70 | 9.3% |
| Local Government Employees | 22 | 2.9% |
| State Government Employees | 10 | 1.3% |
| Federal Government Employees | 0 | 0.0% |
| Unpaid Family Workers | 0 | 0.0% |
| Total | 756 | 100.0% |
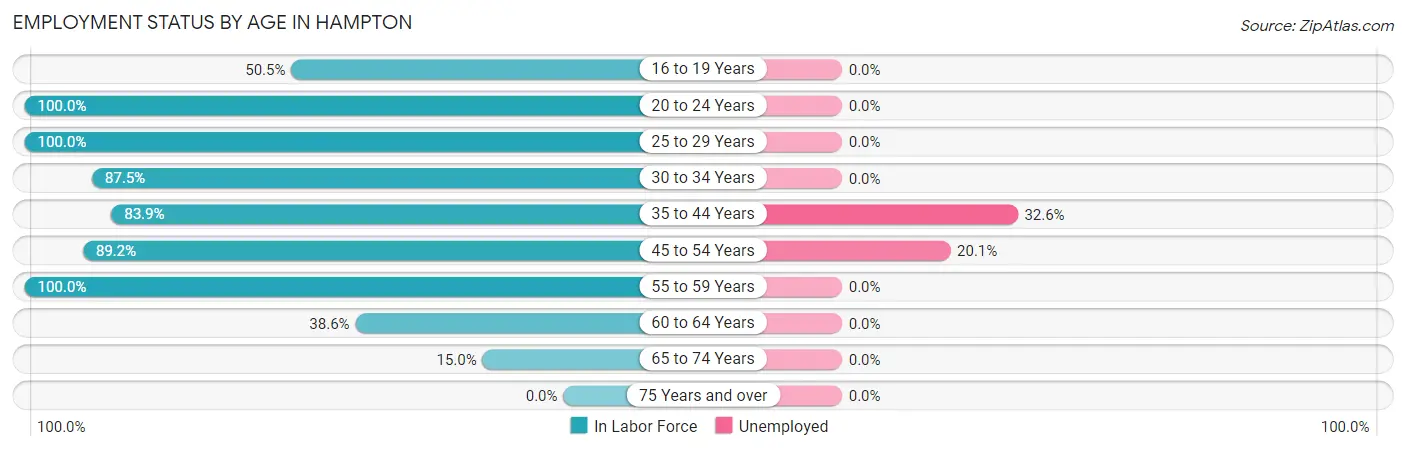
Employment Status by Age in Hampton
According to the labor force statistics for Hampton, out of the total population over 16 years of age (1,315), 68.7% or 903 individuals are in the labor force, with 11.2% or 101 of them unemployed. The age group with the highest labor force participation rate is 20 to 24 years, with 100.0% or 120 individuals in the labor force. Within the labor force, the 35 to 44 years age range has the highest percentage of unemployed individuals, with 32.6% or 56 of them being unemployed.
| Age Bracket | In Labor Force | Unemployed |
| 16 to 19 Years | 52 (50.5%) | 0 (0.0%) |
| 20 to 24 Years | 120 (100.0%) | 0 (0.0%) |
| 25 to 29 Years | 37 (100.0%) | 0 (0.0%) |
| 30 to 34 Years | 119 (87.5%) | 0 (0.0%) |
| 35 to 44 Years | 172 (83.9%) | 56 (32.6%) |
| 45 to 54 Years | 224 (89.2%) | 45 (20.1%) |
| 55 to 59 Years | 126 (100.0%) | 0 (0.0%) |
| 60 to 64 Years | 32 (38.6%) | 0 (0.0%) |
| 65 to 74 Years | 22 (15.0%) | 0 (0.0%) |
| 75 Years and over | 0 (0.0%) | 0 (0.0%) |
| Total | 903 (68.7%) | 101 (11.2%) |
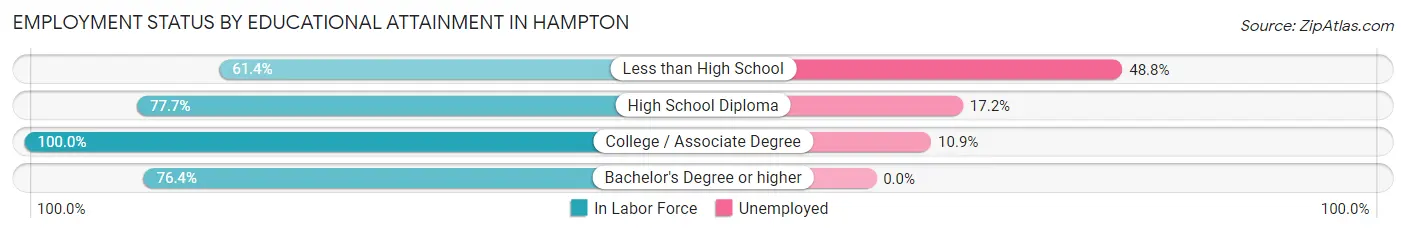
Employment Status by Educational Attainment in Hampton
According to labor force statistics for Hampton, 84.7% of individuals (710) out of the total population between 25 and 64 years of age (838) are in the labor force, with 14.2% or 101 of them being unemployed. The group with the highest labor force participation rate are those with the educational attainment of college / associate degree, with 100.0% or 321 individuals in the labor force. Within the labor force, individuals with less than high school education have the highest percentage of unemployment, with 48.8% or 21 of them being unemployed.
| Educational Attainment | In Labor Force | Unemployed |
| Less than High School | 43 (61.4%) | 34 (48.8%) |
| High School Diploma | 262 (77.7%) | 58 (17.2%) |
| College / Associate Degree | 321 (100.0%) | 35 (10.9%) |
| Bachelor's Degree or higher | 84 (76.4%) | 0 (0.0%) |
| Total | 710 (84.7%) | 119 (14.2%) |
Employment Occupations by Sex in Hampton
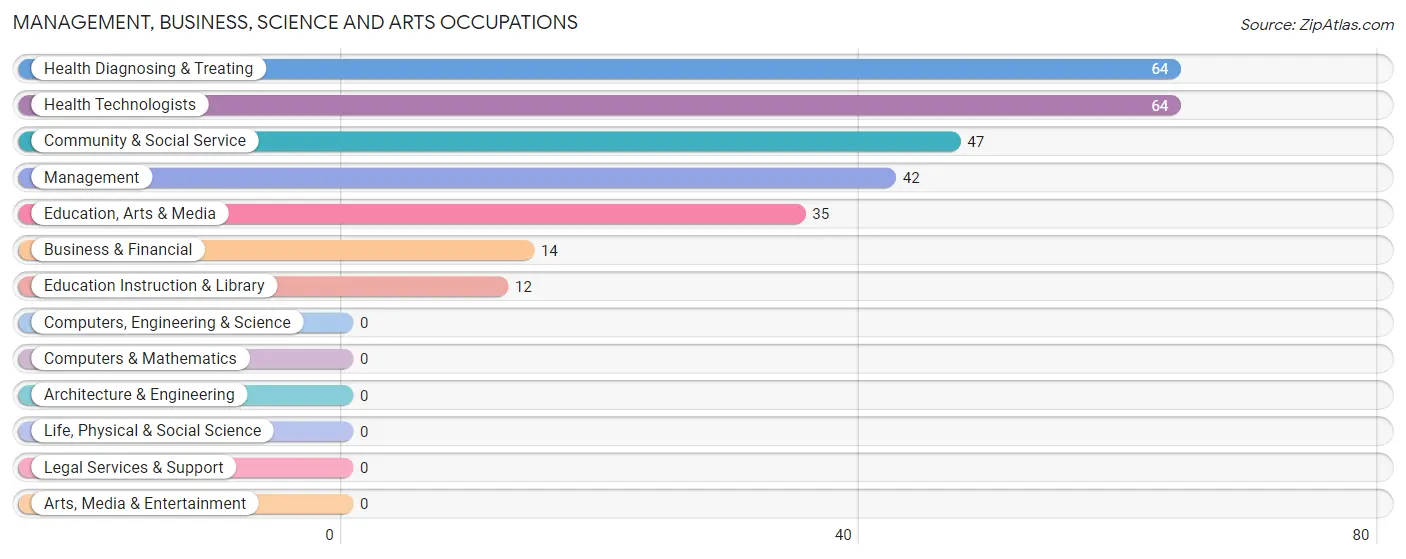
Management, Business, Science and Arts Occupations
The most common Management, Business, Science and Arts occupations in Hampton are Health Diagnosing & Treating (64 | 8.0%), Health Technologists (64 | 8.0%), Community & Social Service (47 | 5.9%), Management (42 | 5.2%), and Education, Arts & Media (35 | 4.4%).
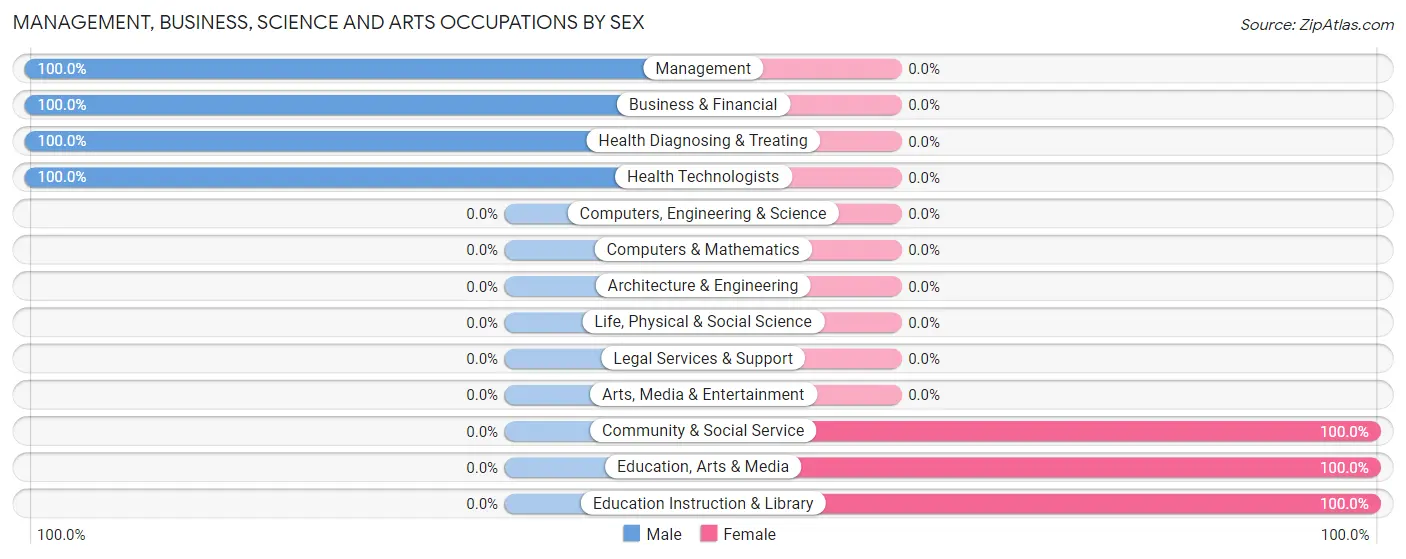
Management, Business, Science and Arts Occupations by Sex
Within the Management, Business, Science and Arts occupations in Hampton, the most male-oriented occupations are Management (100.0%), Business & Financial (100.0%), and Health Diagnosing & Treating (100.0%), while the most female-oriented occupations are Community & Social Service (100.0%), Education, Arts & Media (100.0%), and Education Instruction & Library (100.0%).
| Occupation | Male | Female |
| Management | 42 (100.0%) | 0 (0.0%) |
| Business & Financial | 14 (100.0%) | 0 (0.0%) |
| Computers, Engineering & Science | 0 (0.0%) | 0 (0.0%) |
| Computers & Mathematics | 0 (0.0%) | 0 (0.0%) |
| Architecture & Engineering | 0 (0.0%) | 0 (0.0%) |
| Life, Physical & Social Science | 0 (0.0%) | 0 (0.0%) |
| Community & Social Service | 0 (0.0%) | 47 (100.0%) |
| Education, Arts & Media | 0 (0.0%) | 35 (100.0%) |
| Legal Services & Support | 0 (0.0%) | 0 (0.0%) |
| Education Instruction & Library | 0 (0.0%) | 12 (100.0%) |
| Arts, Media & Entertainment | 0 (0.0%) | 0 (0.0%) |
| Health Diagnosing & Treating | 64 (100.0%) | 0 (0.0%) |
| Health Technologists | 64 (100.0%) | 0 (0.0%) |
| Total (Category) | 120 (71.9%) | 47 (28.1%) |
| Total (Overall) | 357 (44.5%) | 446 (55.5%) |
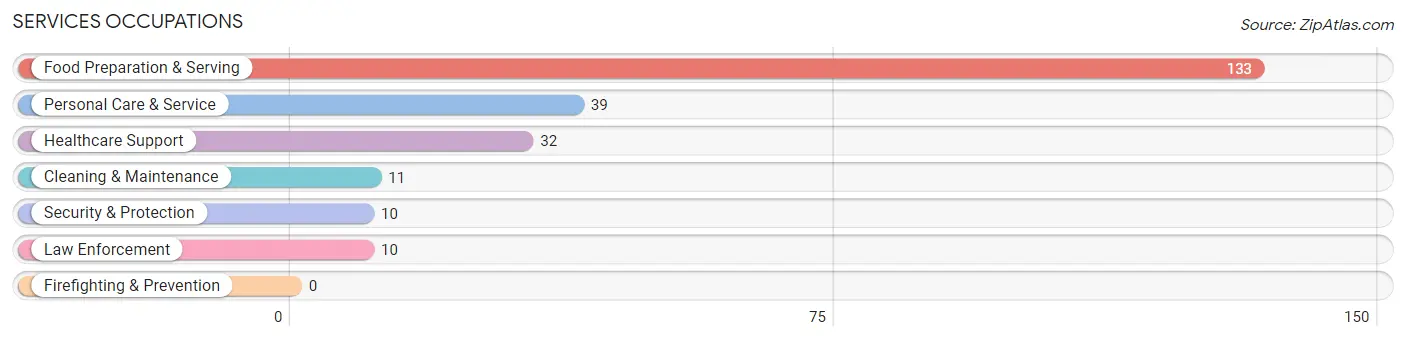
Services Occupations
The most common Services occupations in Hampton are Food Preparation & Serving (133 | 16.6%), Personal Care & Service (39 | 4.9%), Healthcare Support (32 | 4.0%), Cleaning & Maintenance (11 | 1.4%), and Security & Protection (10 | 1.3%).
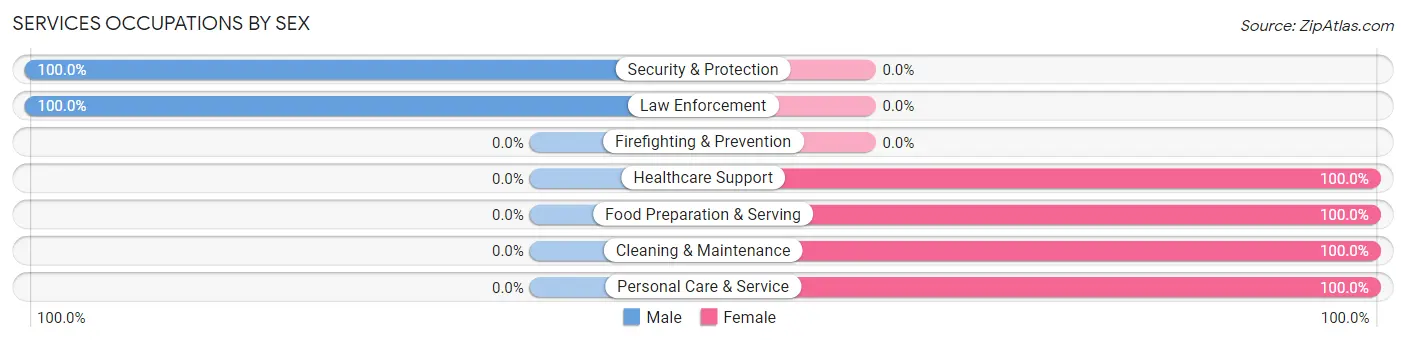
Services Occupations by Sex
Within the Services occupations in Hampton, the most male-oriented occupations are Security & Protection (100.0%), and Law Enforcement (100.0%), while the most female-oriented occupations are Healthcare Support (100.0%), Food Preparation & Serving (100.0%), and Cleaning & Maintenance (100.0%).
| Occupation | Male | Female |
| Healthcare Support | 0 (0.0%) | 32 (100.0%) |
| Security & Protection | 10 (100.0%) | 0 (0.0%) |
| Firefighting & Prevention | 0 (0.0%) | 0 (0.0%) |
| Law Enforcement | 10 (100.0%) | 0 (0.0%) |
| Food Preparation & Serving | 0 (0.0%) | 133 (100.0%) |
| Cleaning & Maintenance | 0 (0.0%) | 11 (100.0%) |
| Personal Care & Service | 0 (0.0%) | 39 (100.0%) |
| Total (Category) | 10 (4.4%) | 215 (95.6%) |
| Total (Overall) | 357 (44.5%) | 446 (55.5%) |
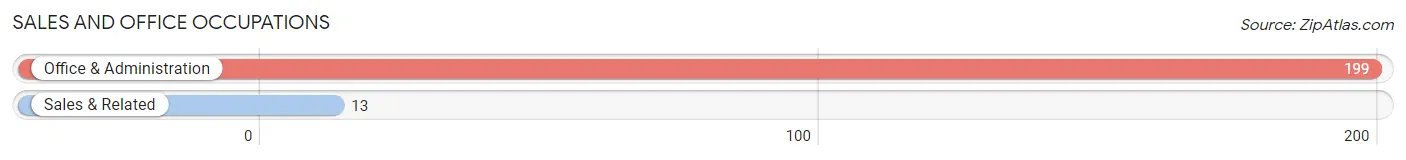
Sales and Office Occupations
The most common Sales and Office occupations in Hampton are Office & Administration (199 | 24.8%), and Sales & Related (13 | 1.6%).
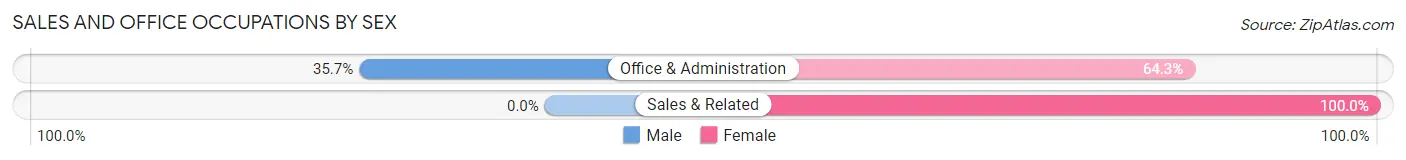
Sales and Office Occupations by Sex
| Occupation | Male | Female |
| Sales & Related | 0 (0.0%) | 13 (100.0%) |
| Office & Administration | 71 (35.7%) | 128 (64.3%) |
| Total (Category) | 71 (33.5%) | 141 (66.5%) |
| Total (Overall) | 357 (44.5%) | 446 (55.5%) |
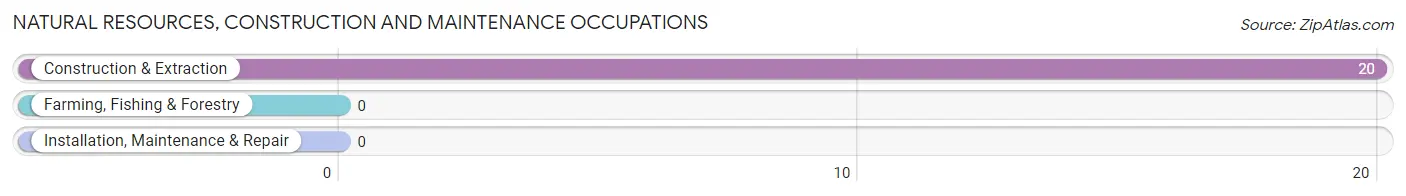
Natural Resources, Construction and Maintenance Occupations
The most common Natural Resources, Construction and Maintenance occupations in Hampton are , and Construction & Extraction (20 | 2.5%).
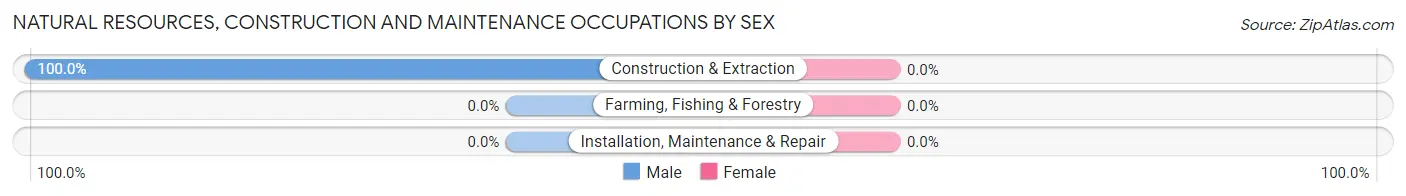
Natural Resources, Construction and Maintenance Occupations by Sex
| Occupation | Male | Female |
| Farming, Fishing & Forestry | 0 (0.0%) | 0 (0.0%) |
| Construction & Extraction | 20 (100.0%) | 0 (0.0%) |
| Installation, Maintenance & Repair | 0 (0.0%) | 0 (0.0%) |
| Total (Category) | 20 (100.0%) | 0 (0.0%) |
| Total (Overall) | 357 (44.5%) | 446 (55.5%) |
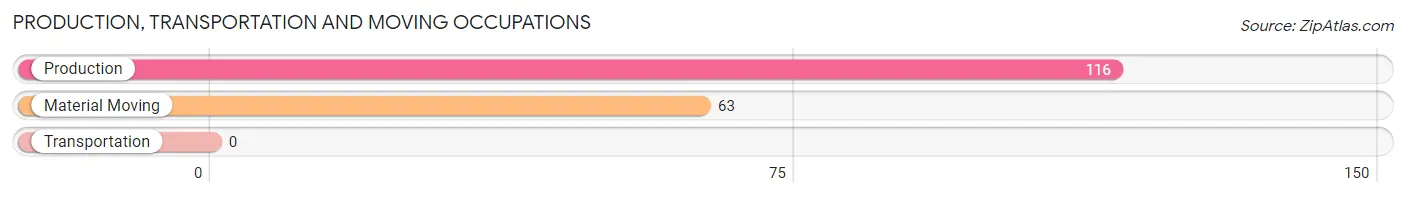
Production, Transportation and Moving Occupations
The most common Production, Transportation and Moving occupations in Hampton are Production (116 | 14.4%), and Material Moving (63 | 7.9%).
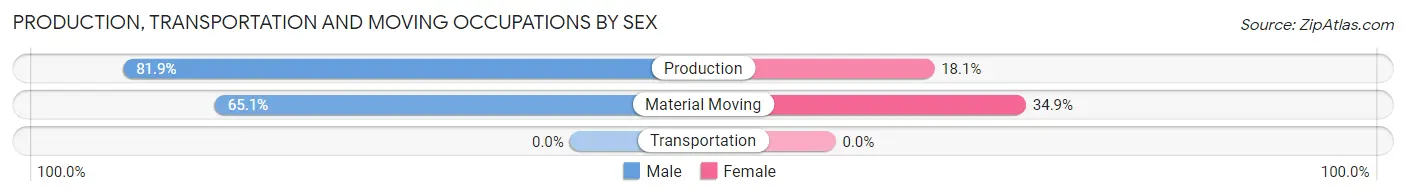
Production, Transportation and Moving Occupations by Sex
| Occupation | Male | Female |
| Production | 95 (81.9%) | 21 (18.1%) |
| Transportation | 0 (0.0%) | 0 (0.0%) |
| Material Moving | 41 (65.1%) | 22 (34.9%) |
| Total (Category) | 136 (76.0%) | 43 (24.0%) |
| Total (Overall) | 357 (44.5%) | 446 (55.5%) |
Employment Industries by Sex in Hampton
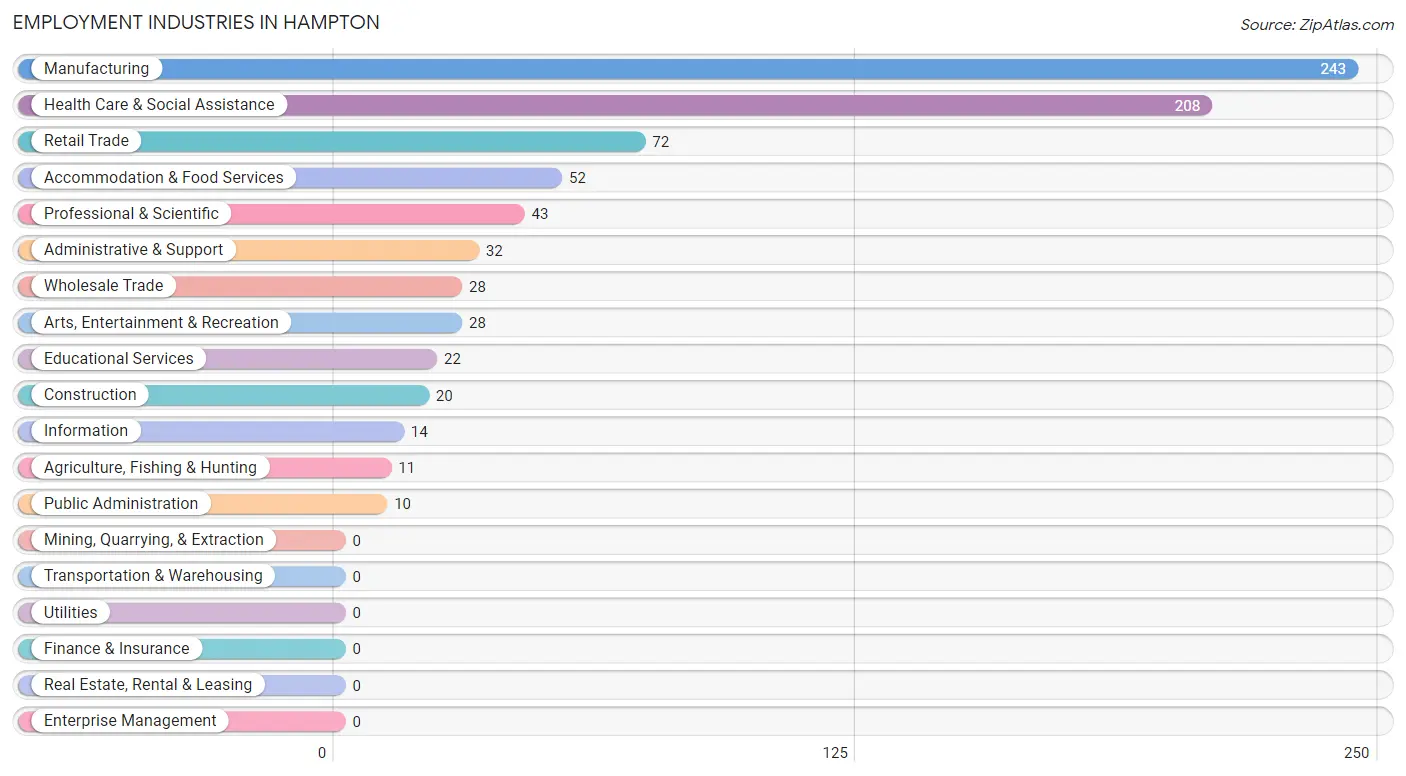
Employment Industries in Hampton
The major employment industries in Hampton include Manufacturing (243 | 30.3%), Health Care & Social Assistance (208 | 25.9%), Retail Trade (72 | 9.0%), Accommodation & Food Services (52 | 6.5%), and Professional & Scientific (43 | 5.3%).
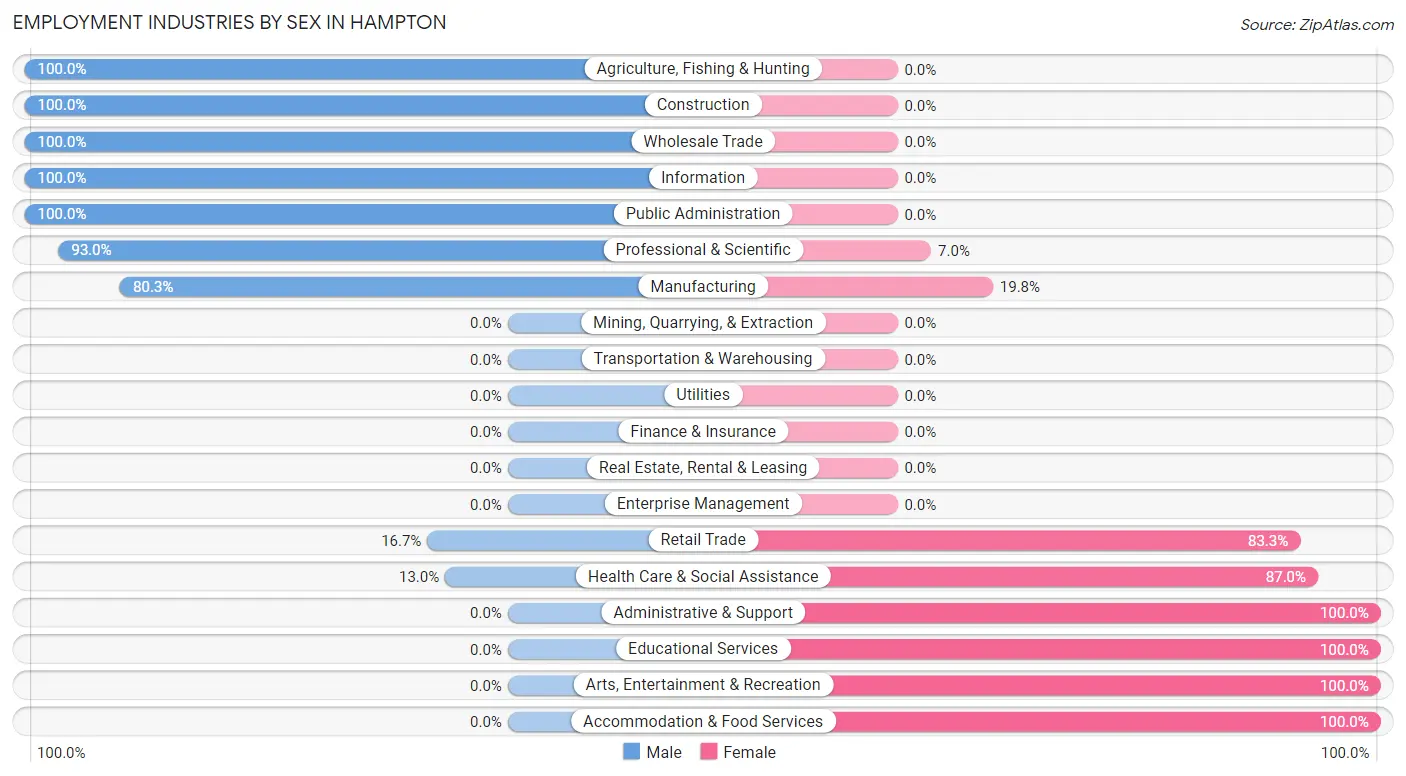
Employment Industries by Sex in Hampton
The Hampton industries that see more men than women are Agriculture, Fishing & Hunting (100.0%), Construction (100.0%), and Wholesale Trade (100.0%), whereas the industries that tend to have a higher number of women are Administrative & Support (100.0%), Educational Services (100.0%), and Arts, Entertainment & Recreation (100.0%).
| Industry | Male | Female |
| Agriculture, Fishing & Hunting | 11 (100.0%) | 0 (0.0%) |
| Mining, Quarrying, & Extraction | 0 (0.0%) | 0 (0.0%) |
| Construction | 20 (100.0%) | 0 (0.0%) |
| Manufacturing | 195 (80.2%) | 48 (19.8%) |
| Wholesale Trade | 28 (100.0%) | 0 (0.0%) |
| Retail Trade | 12 (16.7%) | 60 (83.3%) |
| Transportation & Warehousing | 0 (0.0%) | 0 (0.0%) |
| Utilities | 0 (0.0%) | 0 (0.0%) |
| Information | 14 (100.0%) | 0 (0.0%) |
| Finance & Insurance | 0 (0.0%) | 0 (0.0%) |
| Real Estate, Rental & Leasing | 0 (0.0%) | 0 (0.0%) |
| Professional & Scientific | 40 (93.0%) | 3 (7.0%) |
| Enterprise Management | 0 (0.0%) | 0 (0.0%) |
| Administrative & Support | 0 (0.0%) | 32 (100.0%) |
| Educational Services | 0 (0.0%) | 22 (100.0%) |
| Health Care & Social Assistance | 27 (13.0%) | 181 (87.0%) |
| Arts, Entertainment & Recreation | 0 (0.0%) | 28 (100.0%) |
| Accommodation & Food Services | 0 (0.0%) | 52 (100.0%) |
| Public Administration | 10 (100.0%) | 0 (0.0%) |
| Total | 357 (44.5%) | 446 (55.5%) |
Education in Hampton
School Enrollment in Hampton
The most common levels of schooling among the 546 students in Hampton are middle school (232 | 42.5%), elementary school (131 | 24.0%), and high school (93 | 17.0%).
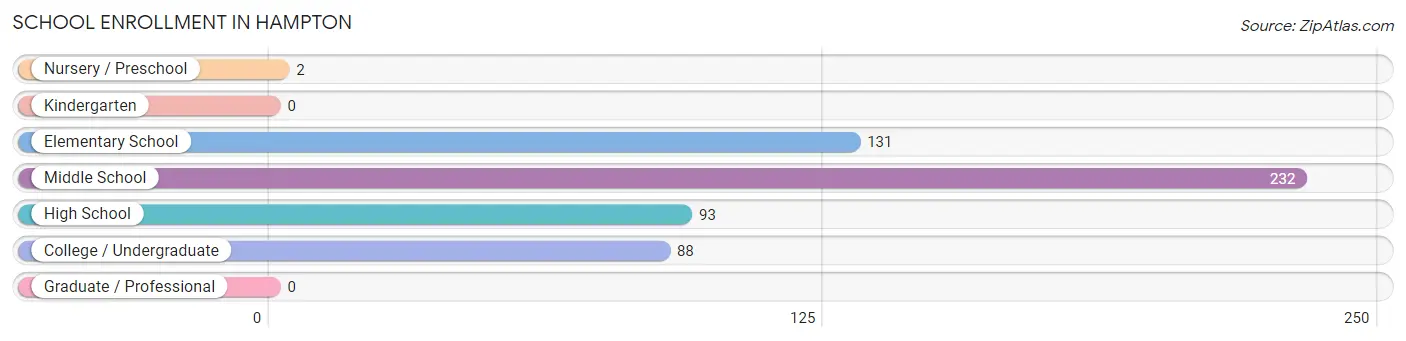
| School Level | # Students | % Students |
| Nursery / Preschool | 2 | 0.4% |
| Kindergarten | 0 | 0.0% |
| Elementary School | 131 | 24.0% |
| Middle School | 232 | 42.5% |
| High School | 93 | 17.0% |
| College / Undergraduate | 88 | 16.1% |
| Graduate / Professional | 0 | 0.0% |
| Total | 546 | 100.0% |
School Enrollment by Age by Funding Source in Hampton
Out of a total of 546 students who are enrolled in schools in Hampton, 20 (3.7%) attend a private institution, while the remaining 526 (96.3%) are enrolled in public schools. The age group of 15 to 17 year olds has the highest likelihood of being enrolled in private schools, with 20 (100.0% in the age bracket) enrolled. Conversely, the age group of 3 to 4 year olds has the lowest likelihood of being enrolled in a private school, with 2 (100.0% in the age bracket) attending a public institution.
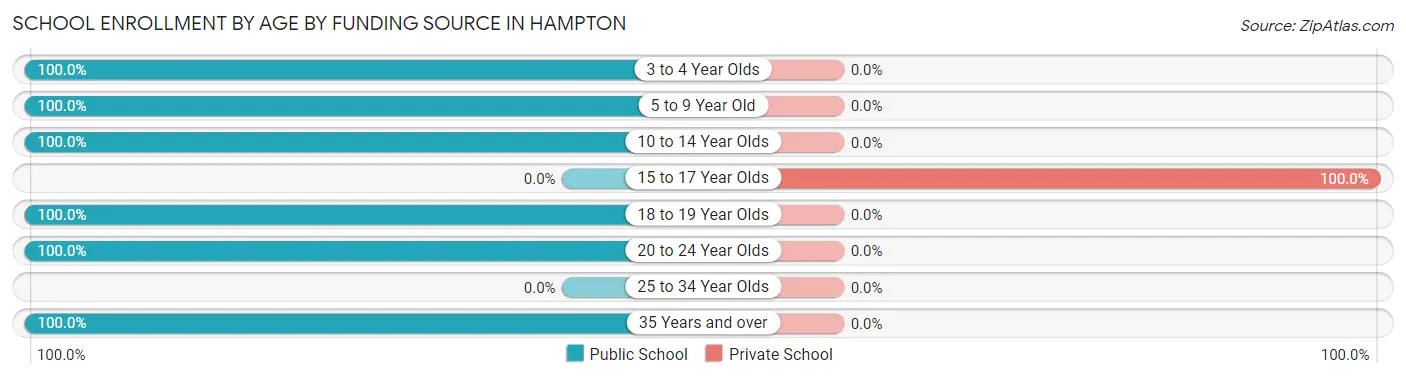
| Age Bracket | Public School | Private School |
| 3 to 4 Year Olds | 2 (100.0%) | 0 (0.0%) |
| 5 to 9 Year Old | 131 (100.0%) | 0 (0.0%) |
| 10 to 14 Year Olds | 237 (100.0%) | 0 (0.0%) |
| 15 to 17 Year Olds | 0 (0.0%) | 20 (100.0%) |
| 18 to 19 Year Olds | 68 (100.0%) | 0 (0.0%) |
| 20 to 24 Year Olds | 60 (100.0%) | 0 (0.0%) |
| 25 to 34 Year Olds | 0 (0.0%) | 0 (0.0%) |
| 35 Years and over | 28 (100.0%) | 0 (0.0%) |
| Total | 526 (96.3%) | 20 (3.7%) |
Educational Attainment by Field of Study in Hampton
Bio, nature & agricultural (64 | 49.2%), science & technology (26 | 20.0%), social sciences (13 | 10.0%), business (10 | 7.7%), and arts & humanities (10 | 7.7%) are the most common fields of study among 130 individuals in Hampton who have obtained a bachelor's degree or higher.
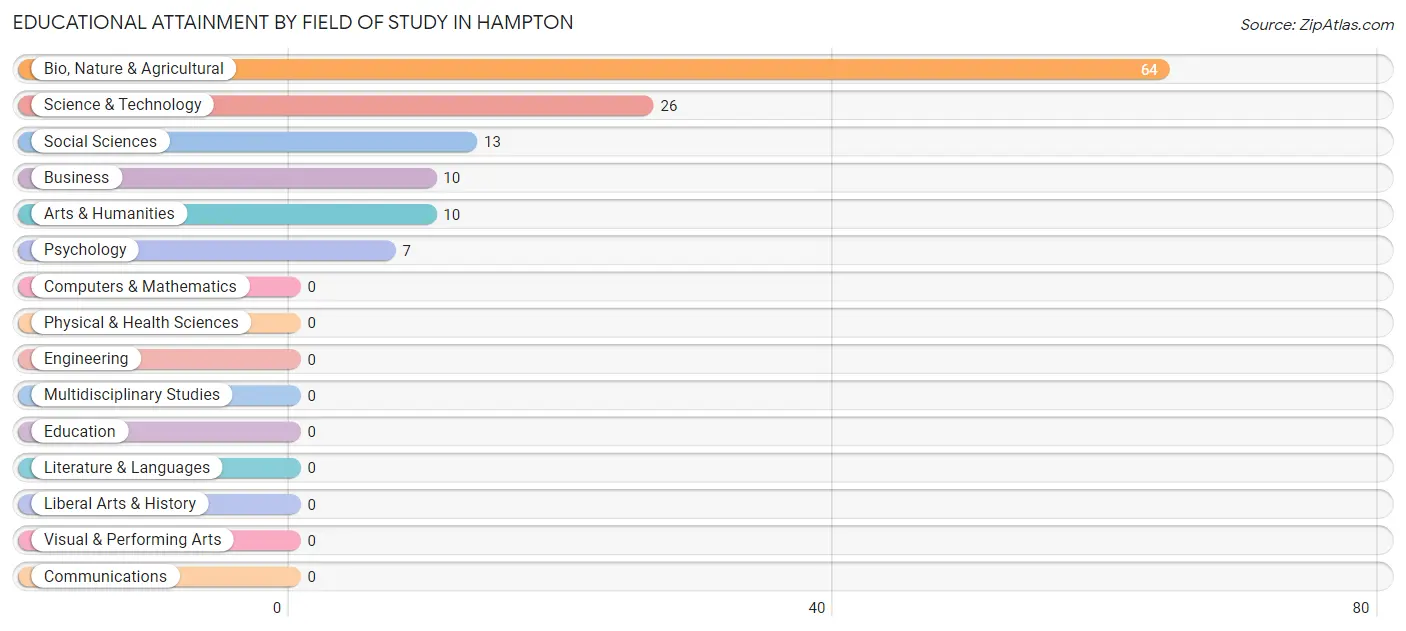
| Field of Study | # Graduates | % Graduates |
| Computers & Mathematics | 0 | 0.0% |
| Bio, Nature & Agricultural | 64 | 49.2% |
| Physical & Health Sciences | 0 | 0.0% |
| Psychology | 7 | 5.4% |
| Social Sciences | 13 | 10.0% |
| Engineering | 0 | 0.0% |
| Multidisciplinary Studies | 0 | 0.0% |
| Science & Technology | 26 | 20.0% |
| Business | 10 | 7.7% |
| Education | 0 | 0.0% |
| Literature & Languages | 0 | 0.0% |
| Liberal Arts & History | 0 | 0.0% |
| Visual & Performing Arts | 0 | 0.0% |
| Communications | 0 | 0.0% |
| Arts & Humanities | 10 | 7.7% |
| Total | 130 | 100.0% |
Transportation & Commute in Hampton
Vehicle Availability by Sex in Hampton
The most prevalent vehicle ownership categories in Hampton are males with 3 vehicles (159, accounting for 49.7%) and females with 3 vehicles (135, making up 36.5%).
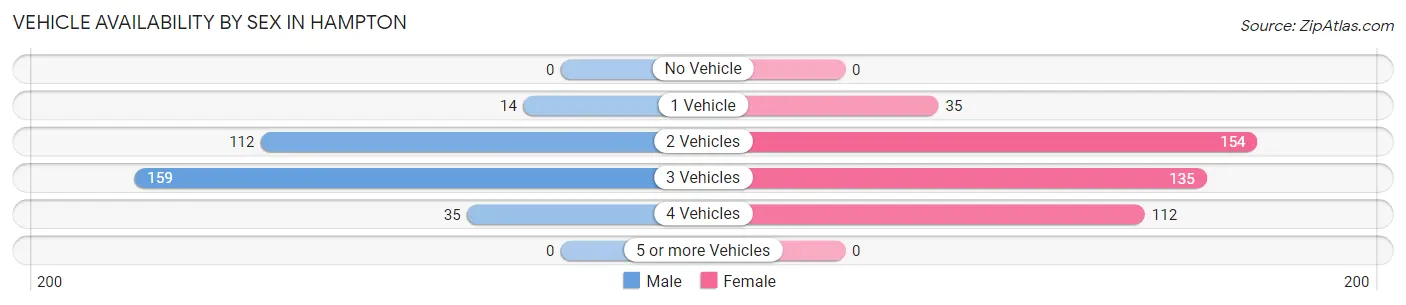
| Vehicles Available | Male | Female |
| No Vehicle | 0 (0.0%) | 0 (0.0%) |
| 1 Vehicle | 14 (4.4%) | 35 (8.0%) |
| 2 Vehicles | 112 (35.0%) | 154 (35.3%) |
| 3 Vehicles | 159 (49.7%) | 135 (31.0%) |
| 4 Vehicles | 35 (10.9%) | 112 (25.7%) |
| 5 or more Vehicles | 0 (0.0%) | 0 (0.0%) |
| Total | 320 (100.0%) | 436 (100.0%) |
Commute Time in Hampton
The most frequently occuring commute durations in Hampton are 15 to 19 minutes (221 commuters, 29.9%), 20 to 24 minutes (137 commuters, 18.6%), and 25 to 29 minutes (95 commuters, 12.9%).
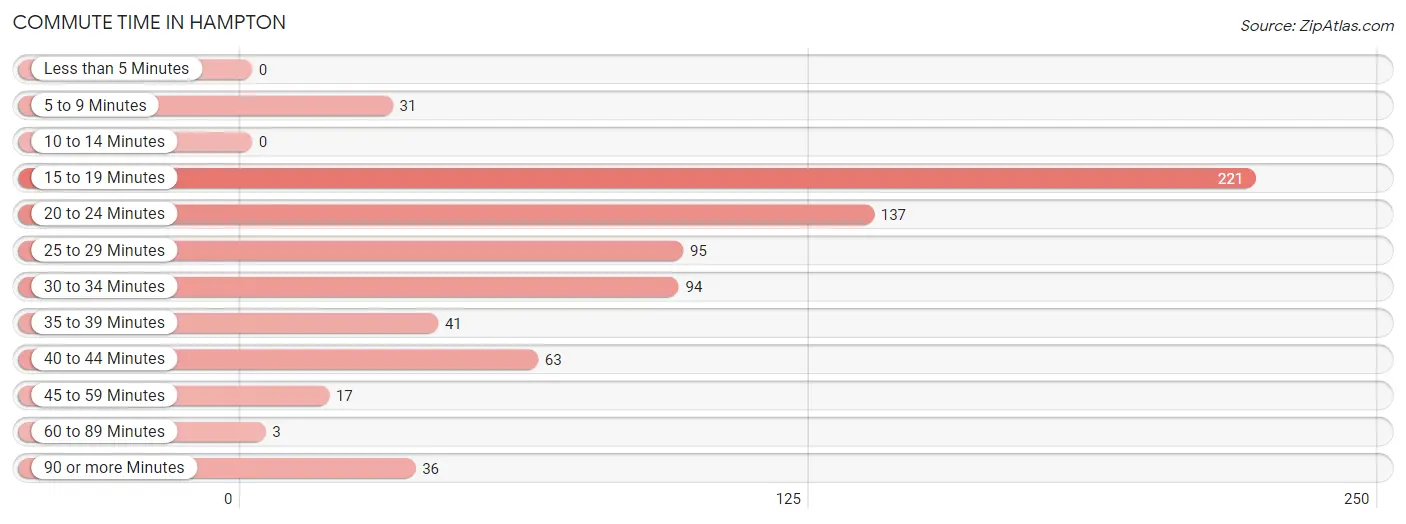
| Commute Time | # Commuters | % Commuters |
| Less than 5 Minutes | 0 | 0.0% |
| 5 to 9 Minutes | 31 | 4.2% |
| 10 to 14 Minutes | 0 | 0.0% |
| 15 to 19 Minutes | 221 | 29.9% |
| 20 to 24 Minutes | 137 | 18.6% |
| 25 to 29 Minutes | 95 | 12.9% |
| 30 to 34 Minutes | 94 | 12.7% |
| 35 to 39 Minutes | 41 | 5.6% |
| 40 to 44 Minutes | 63 | 8.5% |
| 45 to 59 Minutes | 17 | 2.3% |
| 60 to 89 Minutes | 3 | 0.4% |
| 90 or more Minutes | 36 | 4.9% |
Commute Time by Sex in Hampton
The most common commute times in Hampton are 15 to 19 minutes (80 commuters, 25.0%) for males and 15 to 19 minutes (141 commuters, 33.7%) for females.
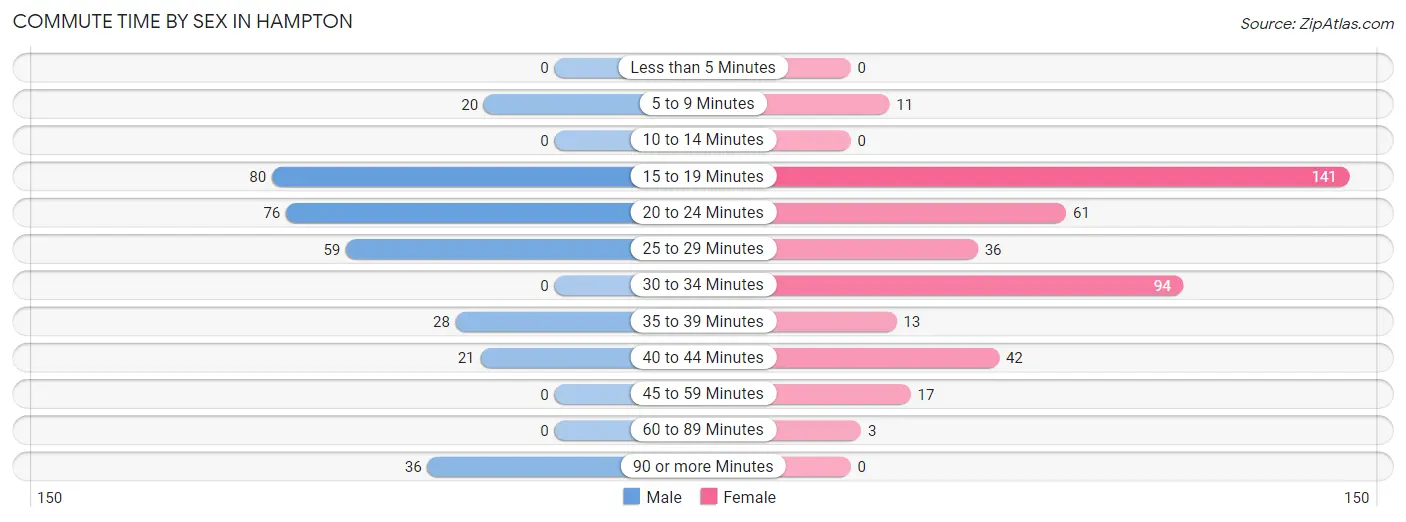
| Commute Time | Male | Female |
| Less than 5 Minutes | 0 (0.0%) | 0 (0.0%) |
| 5 to 9 Minutes | 20 (6.2%) | 11 (2.6%) |
| 10 to 14 Minutes | 0 (0.0%) | 0 (0.0%) |
| 15 to 19 Minutes | 80 (25.0%) | 141 (33.7%) |
| 20 to 24 Minutes | 76 (23.7%) | 61 (14.6%) |
| 25 to 29 Minutes | 59 (18.4%) | 36 (8.6%) |
| 30 to 34 Minutes | 0 (0.0%) | 94 (22.5%) |
| 35 to 39 Minutes | 28 (8.7%) | 13 (3.1%) |
| 40 to 44 Minutes | 21 (6.6%) | 42 (10.1%) |
| 45 to 59 Minutes | 0 (0.0%) | 17 (4.1%) |
| 60 to 89 Minutes | 0 (0.0%) | 3 (0.7%) |
| 90 or more Minutes | 36 (11.3%) | 0 (0.0%) |
Time of Departure to Work by Sex in Hampton
The most frequent times of departure to work in Hampton are 5:00 AM to 5:29 AM (112, 35.0%) for males and 12:00 PM to 3:59 PM (120, 28.7%) for females.
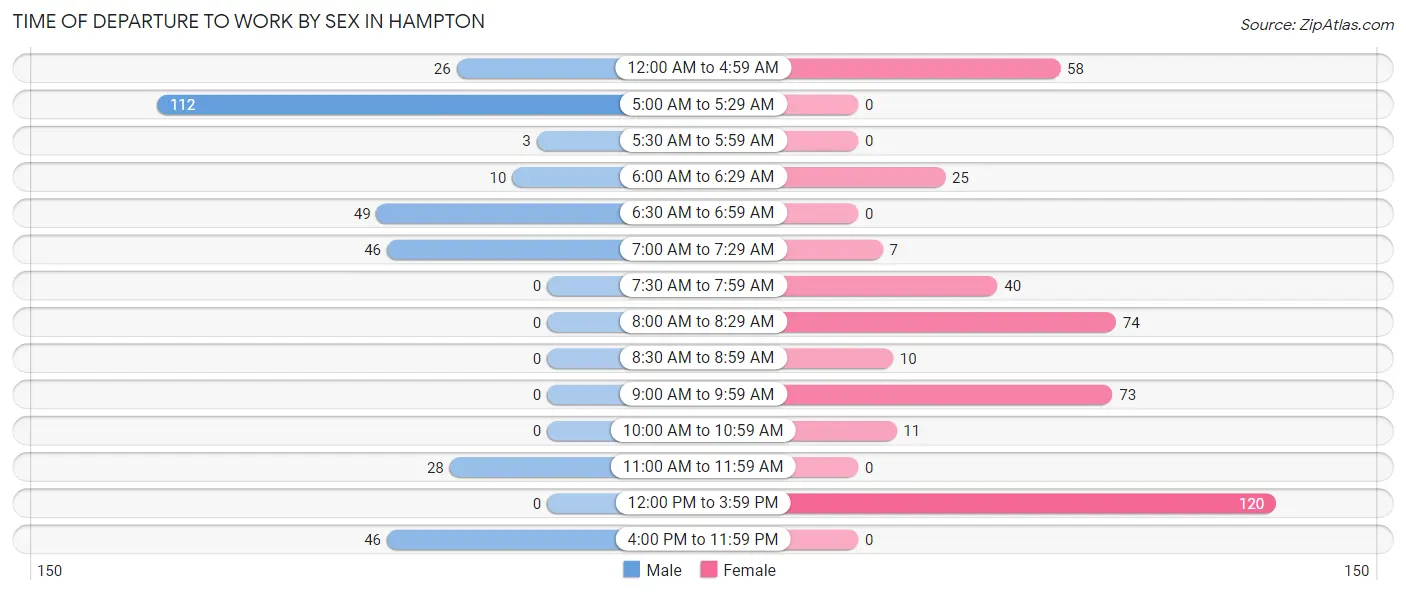
| Time of Departure | Male | Female |
| 12:00 AM to 4:59 AM | 26 (8.1%) | 58 (13.9%) |
| 5:00 AM to 5:29 AM | 112 (35.0%) | 0 (0.0%) |
| 5:30 AM to 5:59 AM | 3 (0.9%) | 0 (0.0%) |
| 6:00 AM to 6:29 AM | 10 (3.1%) | 25 (6.0%) |
| 6:30 AM to 6:59 AM | 49 (15.3%) | 0 (0.0%) |
| 7:00 AM to 7:29 AM | 46 (14.4%) | 7 (1.7%) |
| 7:30 AM to 7:59 AM | 0 (0.0%) | 40 (9.6%) |
| 8:00 AM to 8:29 AM | 0 (0.0%) | 74 (17.7%) |
| 8:30 AM to 8:59 AM | 0 (0.0%) | 10 (2.4%) |
| 9:00 AM to 9:59 AM | 0 (0.0%) | 73 (17.5%) |
| 10:00 AM to 10:59 AM | 0 (0.0%) | 11 (2.6%) |
| 11:00 AM to 11:59 AM | 28 (8.7%) | 0 (0.0%) |
| 12:00 PM to 3:59 PM | 0 (0.0%) | 120 (28.7%) |
| 4:00 PM to 11:59 PM | 46 (14.4%) | 0 (0.0%) |
| Total | 320 (100.0%) | 418 (100.0%) |
Housing Occupancy in Hampton
Occupancy by Ownership in Hampton
Of the total 599 dwellings in Hampton, owner-occupied units account for 462 (77.1%), while renter-occupied units make up 137 (22.9%).
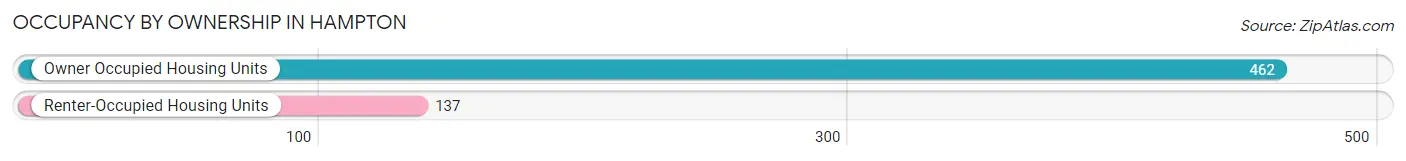
| Occupancy | # Housing Units | % Housing Units |
| Owner Occupied Housing Units | 462 | 77.1% |
| Renter-Occupied Housing Units | 137 | 22.9% |
| Total Occupied Housing Units | 599 | 100.0% |
Occupancy by Household Size in Hampton
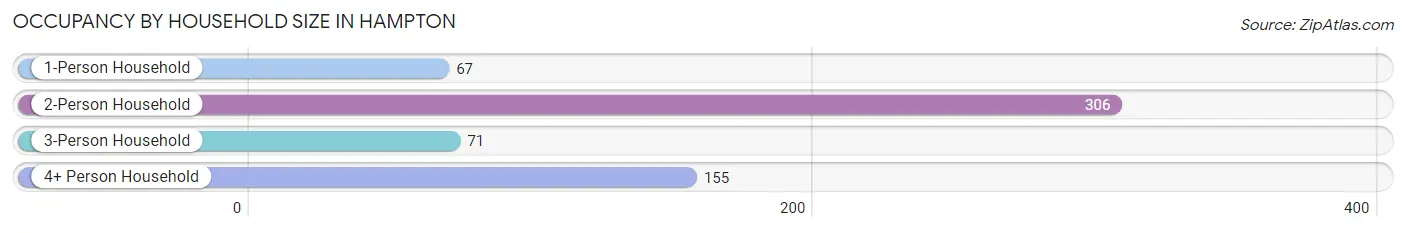
| Household Size | # Housing Units | % Housing Units |
| 1-Person Household | 67 | 11.2% |
| 2-Person Household | 306 | 51.1% |
| 3-Person Household | 71 | 11.8% |
| 4+ Person Household | 155 | 25.9% |
| Total Housing Units | 599 | 100.0% |
Occupancy by Ownership by Household Size in Hampton
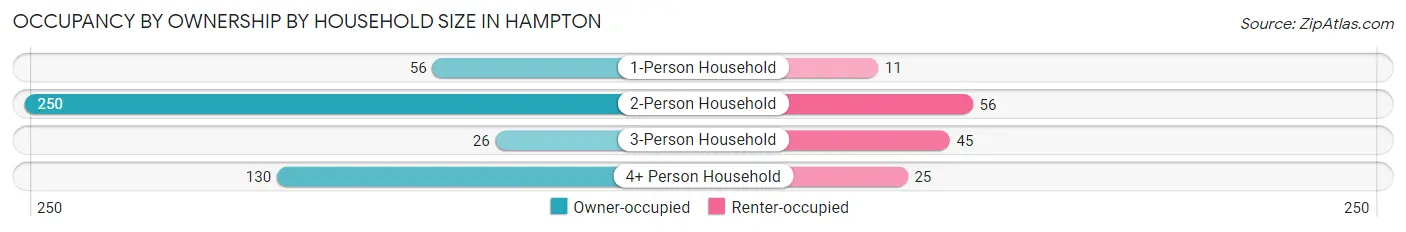
| Household Size | Owner-occupied | Renter-occupied |
| 1-Person Household | 56 (83.6%) | 11 (16.4%) |
| 2-Person Household | 250 (81.7%) | 56 (18.3%) |
| 3-Person Household | 26 (36.6%) | 45 (63.4%) |
| 4+ Person Household | 130 (83.9%) | 25 (16.1%) |
| Total Housing Units | 462 (77.1%) | 137 (22.9%) |
Occupancy by Educational Attainment in Hampton
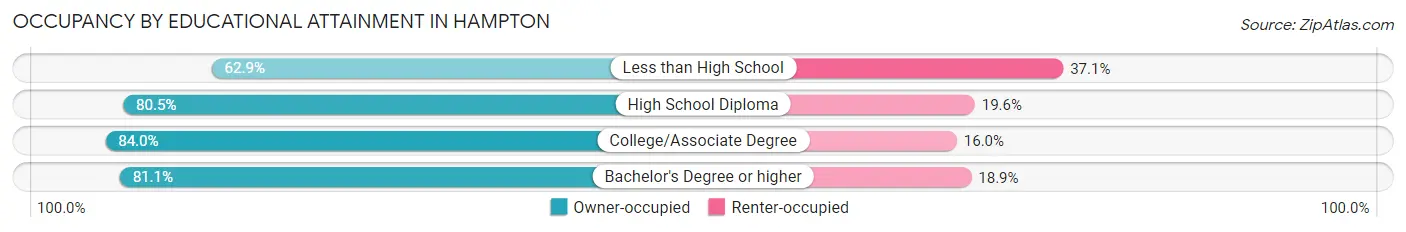
| Household Size | Owner-occupied | Renter-occupied |
| Less than High School | 95 (62.9%) | 56 (37.1%) |
| High School Diploma | 177 (80.4%) | 43 (19.6%) |
| College/Associate Degree | 147 (84.0%) | 28 (16.0%) |
| Bachelor's Degree or higher | 43 (81.1%) | 10 (18.9%) |
Occupancy by Age of Householder in Hampton
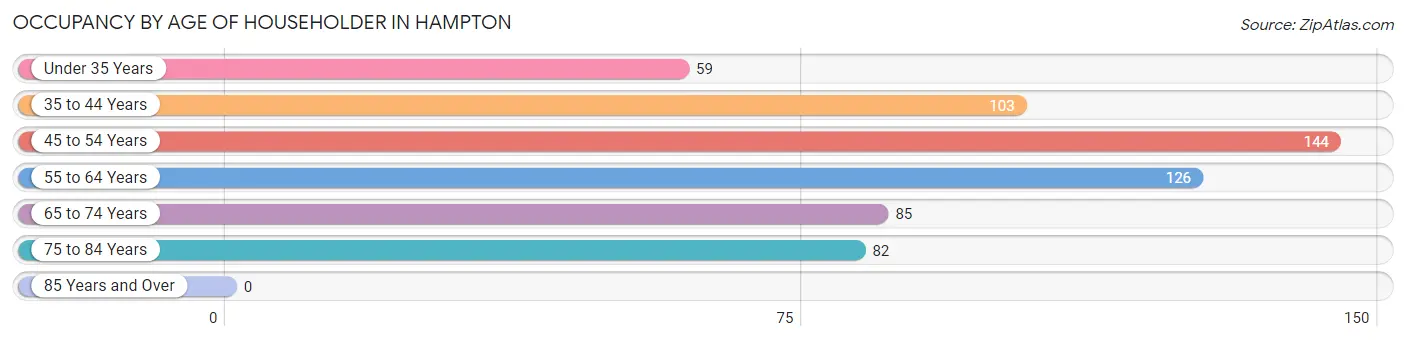
| Age Bracket | # Households | % Households |
| Under 35 Years | 59 | 9.9% |
| 35 to 44 Years | 103 | 17.2% |
| 45 to 54 Years | 144 | 24.0% |
| 55 to 64 Years | 126 | 21.0% |
| 65 to 74 Years | 85 | 14.2% |
| 75 to 84 Years | 82 | 13.7% |
| 85 Years and Over | 0 | 0.0% |
| Total | 599 | 100.0% |
Housing Finances in Hampton
Median Income by Occupancy in Hampton
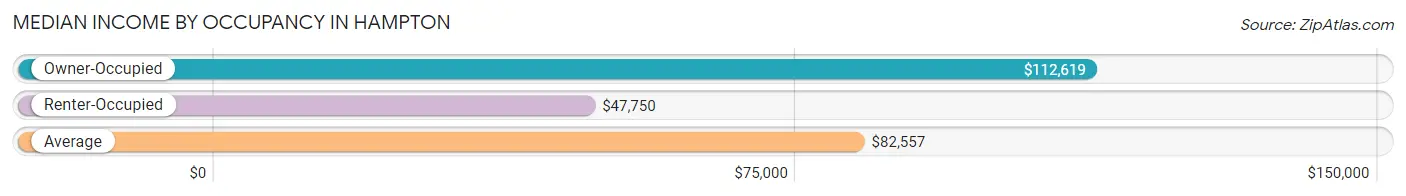
| Occupancy Type | # Households | Median Income |
| Owner-Occupied | 462 (77.1%) | $112,619 |
| Renter-Occupied | 137 (22.9%) | $47,750 |
| Average | 599 (100.0%) | $82,557 |
Occupancy by Householder Income Bracket in Hampton
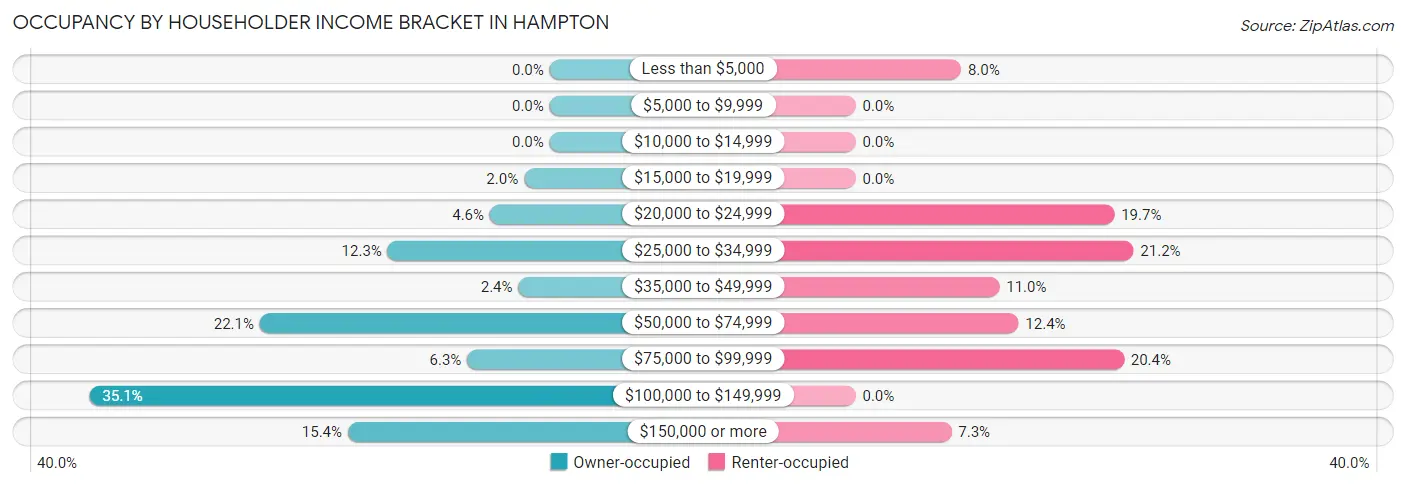
| Income Bracket | Owner-occupied | Renter-occupied |
| Less than $5,000 | 0 (0.0%) | 11 (8.0%) |
| $5,000 to $9,999 | 0 (0.0%) | 0 (0.0%) |
| $10,000 to $14,999 | 0 (0.0%) | 0 (0.0%) |
| $15,000 to $19,999 | 9 (1.9%) | 0 (0.0%) |
| $20,000 to $24,999 | 21 (4.5%) | 27 (19.7%) |
| $25,000 to $34,999 | 57 (12.3%) | 29 (21.2%) |
| $35,000 to $49,999 | 11 (2.4%) | 15 (11.0%) |
| $50,000 to $74,999 | 102 (22.1%) | 17 (12.4%) |
| $75,000 to $99,999 | 29 (6.3%) | 28 (20.4%) |
| $100,000 to $149,999 | 162 (35.1%) | 0 (0.0%) |
| $150,000 or more | 71 (15.4%) | 10 (7.3%) |
| Total | 462 (100.0%) | 137 (100.0%) |
Monthly Housing Cost Tiers in Hampton
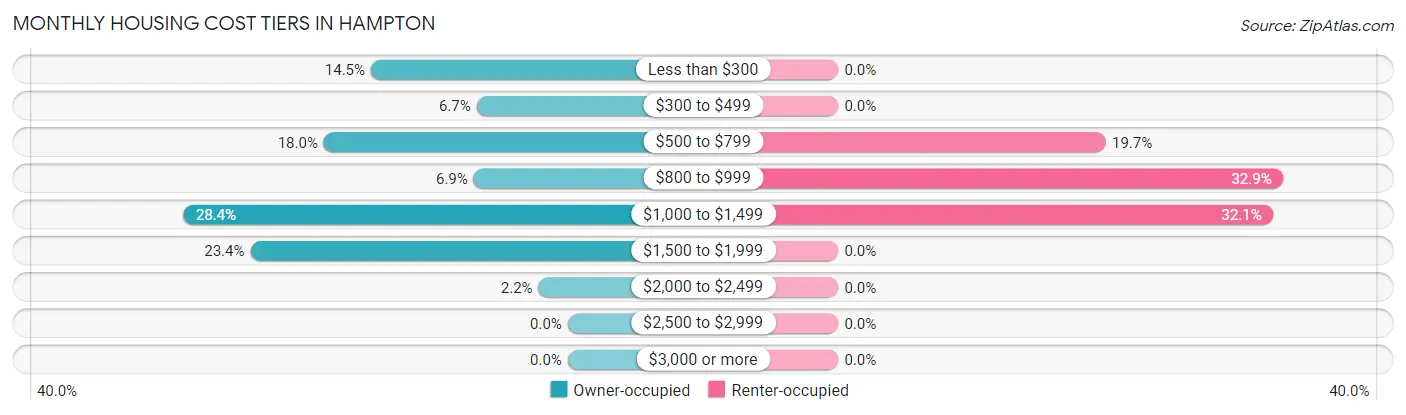
| Monthly Cost | Owner-occupied | Renter-occupied |
| Less than $300 | 67 (14.5%) | 0 (0.0%) |
| $300 to $499 | 31 (6.7%) | 0 (0.0%) |
| $500 to $799 | 83 (18.0%) | 27 (19.7%) |
| $800 to $999 | 32 (6.9%) | 45 (32.9%) |
| $1,000 to $1,499 | 131 (28.3%) | 44 (32.1%) |
| $1,500 to $1,999 | 108 (23.4%) | 0 (0.0%) |
| $2,000 to $2,499 | 10 (2.2%) | 0 (0.0%) |
| $2,500 to $2,999 | 0 (0.0%) | 0 (0.0%) |
| $3,000 or more | 0 (0.0%) | 0 (0.0%) |
| Total | 462 (100.0%) | 137 (100.0%) |
Physical Housing Characteristics in Hampton
Housing Structures in Hampton
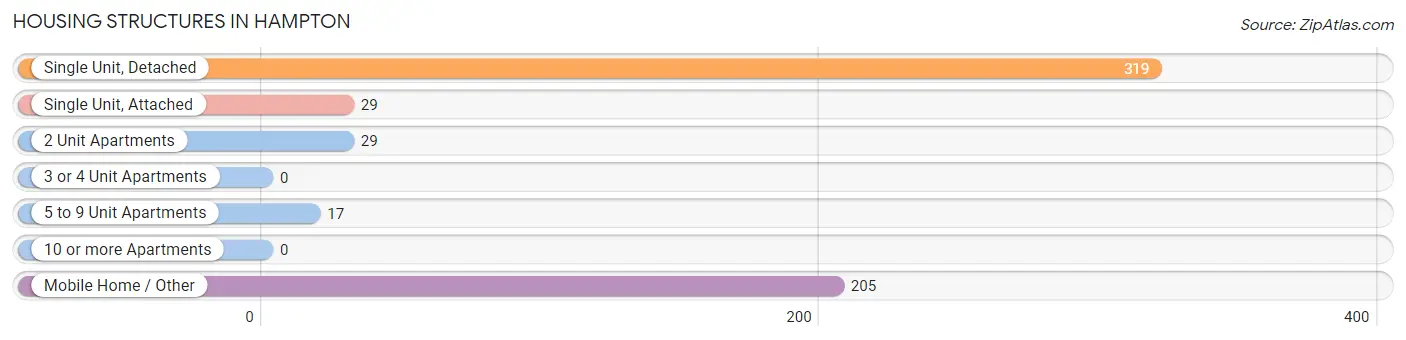
| Structure Type | # Housing Units | % Housing Units |
| Single Unit, Detached | 319 | 53.3% |
| Single Unit, Attached | 29 | 4.8% |
| 2 Unit Apartments | 29 | 4.8% |
| 3 or 4 Unit Apartments | 0 | 0.0% |
| 5 to 9 Unit Apartments | 17 | 2.8% |
| 10 or more Apartments | 0 | 0.0% |
| Mobile Home / Other | 205 | 34.2% |
| Total | 599 | 100.0% |
Housing Structures by Occupancy in Hampton
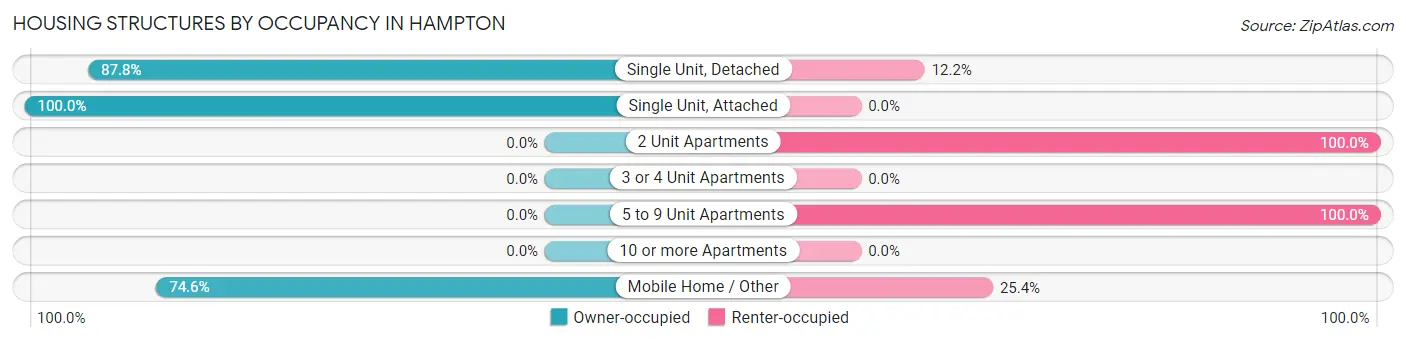
| Structure Type | Owner-occupied | Renter-occupied |
| Single Unit, Detached | 280 (87.8%) | 39 (12.2%) |
| Single Unit, Attached | 29 (100.0%) | 0 (0.0%) |
| 2 Unit Apartments | 0 (0.0%) | 29 (100.0%) |
| 3 or 4 Unit Apartments | 0 (0.0%) | 0 (0.0%) |
| 5 to 9 Unit Apartments | 0 (0.0%) | 17 (100.0%) |
| 10 or more Apartments | 0 (0.0%) | 0 (0.0%) |
| Mobile Home / Other | 153 (74.6%) | 52 (25.4%) |
| Total | 462 (77.1%) | 137 (22.9%) |
Housing Structures by Number of Rooms in Hampton
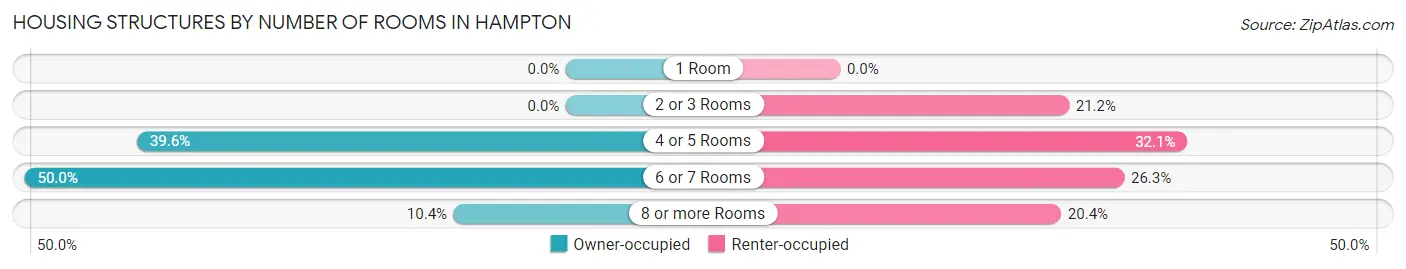
| Number of Rooms | Owner-occupied | Renter-occupied |
| 1 Room | 0 (0.0%) | 0 (0.0%) |
| 2 or 3 Rooms | 0 (0.0%) | 29 (21.2%) |
| 4 or 5 Rooms | 183 (39.6%) | 44 (32.1%) |
| 6 or 7 Rooms | 231 (50.0%) | 36 (26.3%) |
| 8 or more Rooms | 48 (10.4%) | 28 (20.4%) |
| Total | 462 (100.0%) | 137 (100.0%) |
Housing Structure by Heating Type in Hampton
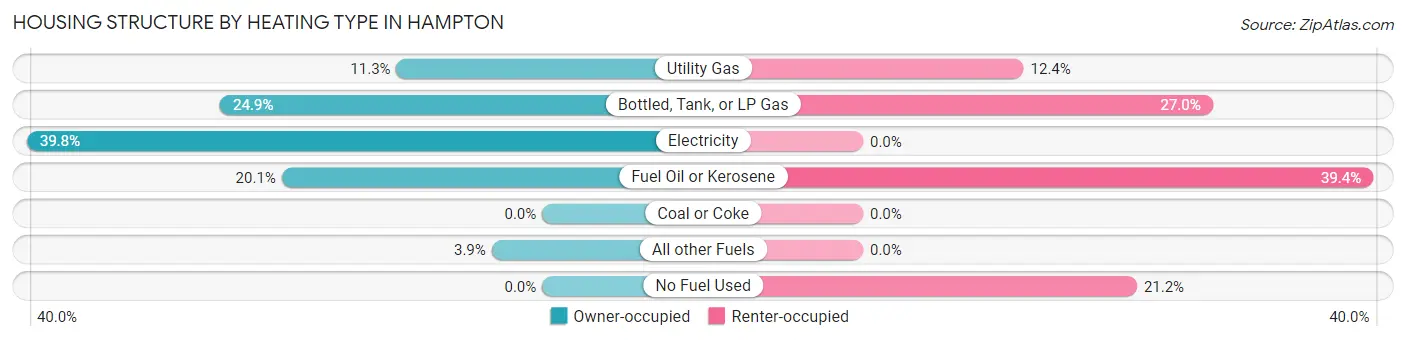
| Heating Type | Owner-occupied | Renter-occupied |
| Utility Gas | 52 (11.3%) | 17 (12.4%) |
| Bottled, Tank, or LP Gas | 115 (24.9%) | 37 (27.0%) |
| Electricity | 184 (39.8%) | 0 (0.0%) |
| Fuel Oil or Kerosene | 93 (20.1%) | 54 (39.4%) |
| Coal or Coke | 0 (0.0%) | 0 (0.0%) |
| All other Fuels | 18 (3.9%) | 0 (0.0%) |
| No Fuel Used | 0 (0.0%) | 29 (21.2%) |
| Total | 462 (100.0%) | 137 (100.0%) |
Household Vehicle Usage in Hampton
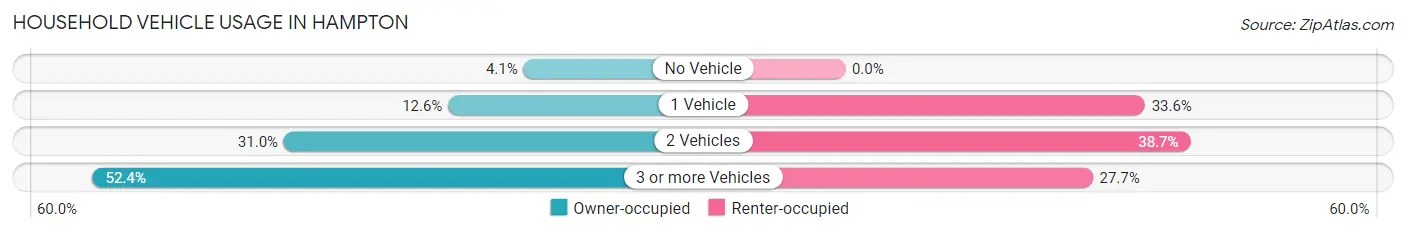
| Vehicles per Household | Owner-occupied | Renter-occupied |
| No Vehicle | 19 (4.1%) | 0 (0.0%) |
| 1 Vehicle | 58 (12.6%) | 46 (33.6%) |
| 2 Vehicles | 143 (30.9%) | 53 (38.7%) |
| 3 or more Vehicles | 242 (52.4%) | 38 (27.7%) |
| Total | 462 (100.0%) | 137 (100.0%) |
Real Estate & Mortgages in Hampton
Real Estate and Mortgage Overview in Hampton
| Characteristic | Without Mortgage | With Mortgage |
| Housing Units | 227 | 235 |
| Median Property Value | $68,300 | $162,200 |
| Median Household Income | $61,715 | $15 |
| Monthly Housing Costs | $560 | $0 |
| Real Estate Taxes | - | - |
Property Value by Mortgage Status in Hampton
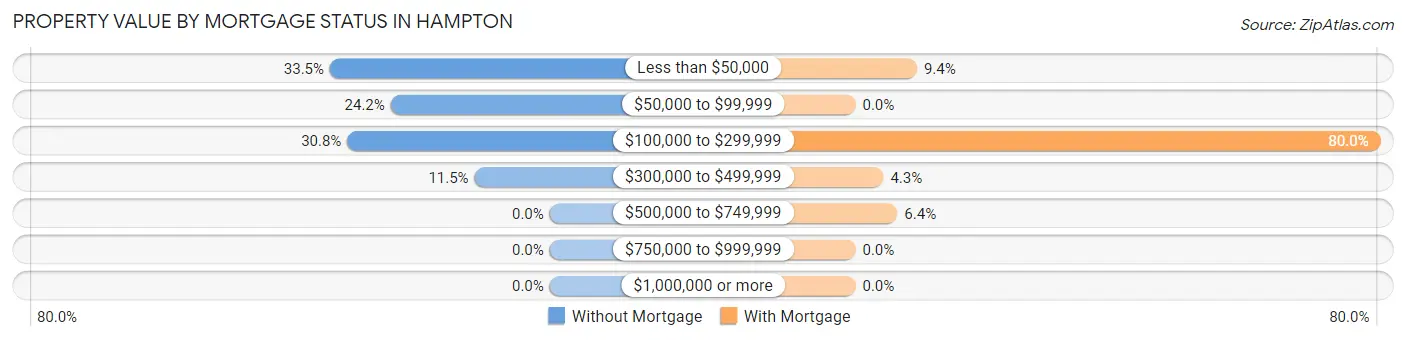
| Property Value | Without Mortgage | With Mortgage |
| Less than $50,000 | 76 (33.5%) | 22 (9.4%) |
| $50,000 to $99,999 | 55 (24.2%) | 0 (0.0%) |
| $100,000 to $299,999 | 70 (30.8%) | 188 (80.0%) |
| $300,000 to $499,999 | 26 (11.5%) | 10 (4.3%) |
| $500,000 to $749,999 | 0 (0.0%) | 15 (6.4%) |
| $750,000 to $999,999 | 0 (0.0%) | 0 (0.0%) |
| $1,000,000 or more | 0 (0.0%) | 0 (0.0%) |
| Total | 227 (100.0%) | 235 (100.0%) |
Household Income by Mortgage Status in Hampton
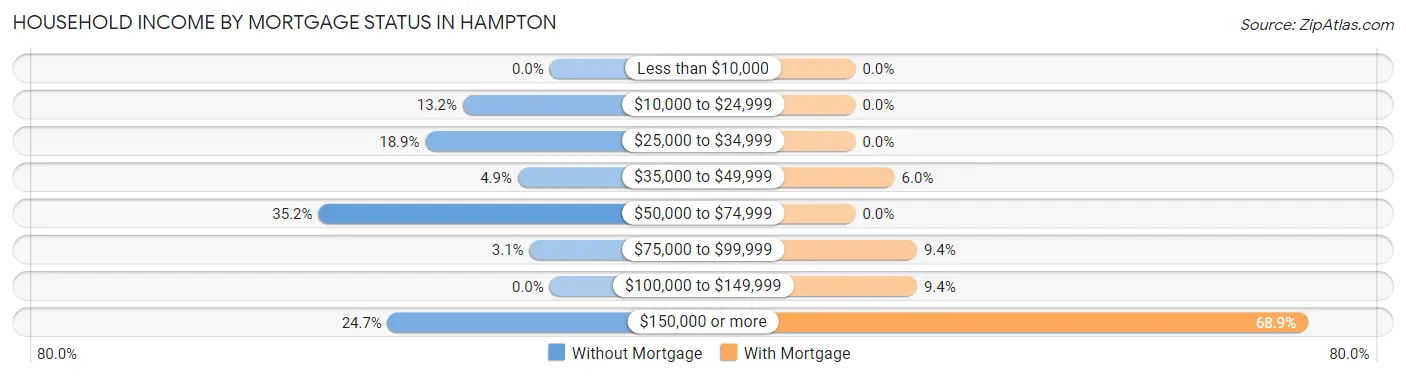
| Household Income | Without Mortgage | With Mortgage |
| Less than $10,000 | 0 (0.0%) | 0 (0.0%) |
| $10,000 to $24,999 | 30 (13.2%) | 0 (0.0%) |
| $25,000 to $34,999 | 43 (18.9%) | 0 (0.0%) |
| $35,000 to $49,999 | 11 (4.9%) | 14 (6.0%) |
| $50,000 to $74,999 | 80 (35.2%) | 0 (0.0%) |
| $75,000 to $99,999 | 7 (3.1%) | 22 (9.4%) |
| $100,000 to $149,999 | 0 (0.0%) | 22 (9.4%) |
| $150,000 or more | 56 (24.7%) | 162 (68.9%) |
| Total | 227 (100.0%) | 235 (100.0%) |
Property Value to Household Income Ratio in Hampton
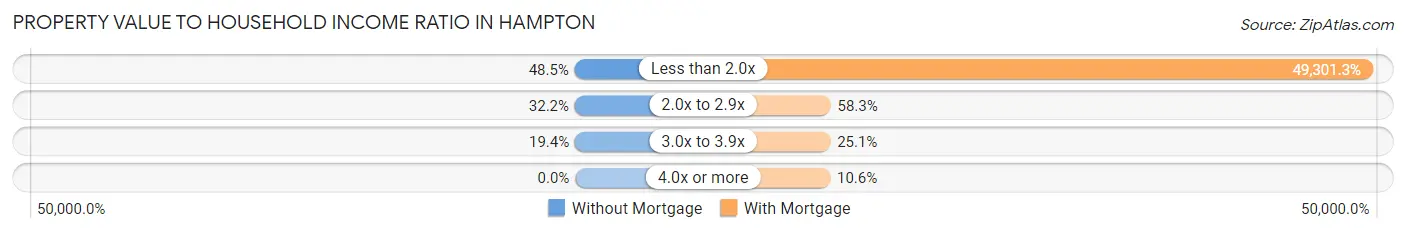
| Value-to-Income Ratio | Without Mortgage | With Mortgage |
| Less than 2.0x | 110 (48.5%) | 115,858 (49,301.3%) |
| 2.0x to 2.9x | 73 (32.2%) | 137 (58.3%) |
| 3.0x to 3.9x | 44 (19.4%) | 59 (25.1%) |
| 4.0x or more | 0 (0.0%) | 25 (10.6%) |
| Total | 227 (100.0%) | 235 (100.0%) |
Real Estate Taxes by Mortgage Status in Hampton
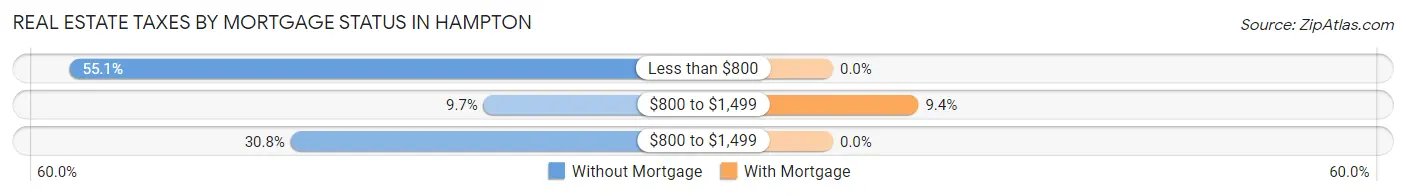
| Property Taxes | Without Mortgage | With Mortgage |
| Less than $800 | 125 (55.1%) | 0 (0.0%) |
| $800 to $1,499 | 22 (9.7%) | 22 (9.4%) |
| $800 to $1,499 | 70 (30.8%) | 0 (0.0%) |
| Total | 227 (100.0%) | 235 (100.0%) |
Health & Disability in Hampton
Health Insurance Coverage by Age in Hampton
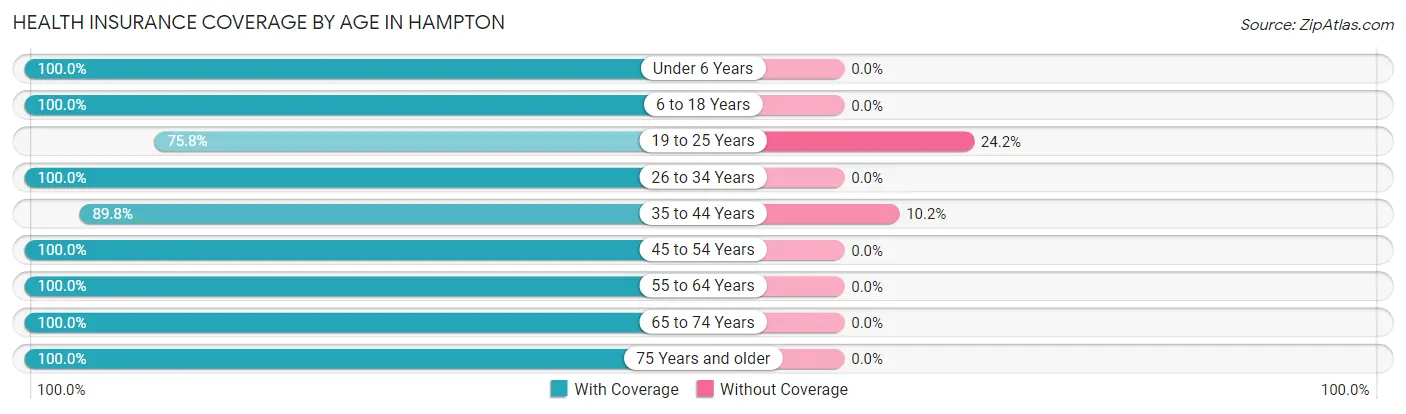
| Age Bracket | With Coverage | Without Coverage |
| Under 6 Years | 18 (100.0%) | 0 (0.0%) |
| 6 to 18 Years | 471 (100.0%) | 0 (0.0%) |
| 19 to 25 Years | 91 (75.8%) | 29 (24.2%) |
| 26 to 34 Years | 173 (100.0%) | 0 (0.0%) |
| 35 to 44 Years | 184 (89.8%) | 21 (10.2%) |
| 45 to 54 Years | 251 (100.0%) | 0 (0.0%) |
| 55 to 64 Years | 209 (100.0%) | 0 (0.0%) |
| 65 to 74 Years | 147 (100.0%) | 0 (0.0%) |
| 75 Years and older | 107 (100.0%) | 0 (0.0%) |
| Total | 1,651 (97.1%) | 50 (2.9%) |
Health Insurance Coverage by Citizenship Status in Hampton
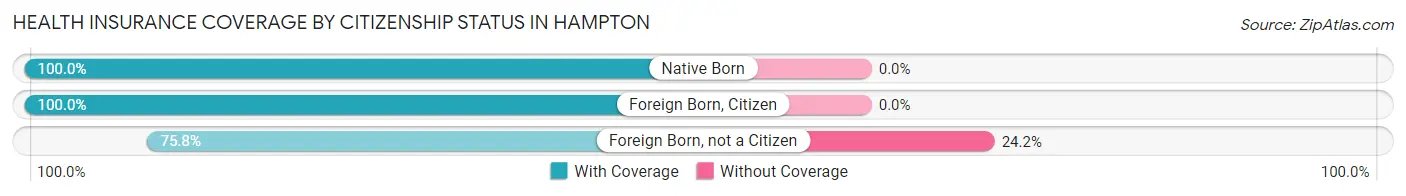
| Citizenship Status | With Coverage | Without Coverage |
| Native Born | 18 (100.0%) | 0 (0.0%) |
| Foreign Born, Citizen | 471 (100.0%) | 0 (0.0%) |
| Foreign Born, not a Citizen | 91 (75.8%) | 29 (24.2%) |
Health Insurance Coverage by Household Income in Hampton
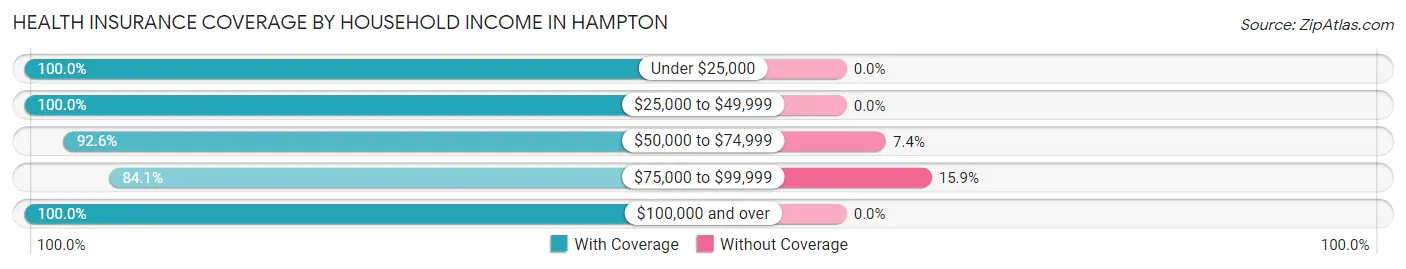
| Household Income | With Coverage | Without Coverage |
| Under $25,000 | 85 (100.0%) | 0 (0.0%) |
| $25,000 to $49,999 | 251 (100.0%) | 0 (0.0%) |
| $50,000 to $74,999 | 264 (92.6%) | 21 (7.4%) |
| $75,000 to $99,999 | 153 (84.1%) | 29 (15.9%) |
| $100,000 and over | 898 (100.0%) | 0 (0.0%) |
Public vs Private Health Insurance Coverage by Age in Hampton

| Age Bracket | Public Insurance | Private Insurance |
| Under 6 | 18 (100.0%) | 0 (0.0%) |
| 6 to 18 Years | 73 (15.5%) | 398 (84.5%) |
| 19 to 25 Years | 0 (0.0%) | 91 (75.8%) |
| 25 to 34 Years | 17 (9.8%) | 156 (90.2%) |
| 35 to 44 Years | 21 (10.2%) | 163 (79.5%) |
| 45 to 54 Years | 42 (16.7%) | 236 (94.0%) |
| 55 to 64 Years | 27 (12.9%) | 182 (87.1%) |
| 65 to 74 Years | 147 (100.0%) | 50 (34.0%) |
| 75 Years and over | 107 (100.0%) | 11 (10.3%) |
| Total | 452 (26.6%) | 1,287 (75.7%) |
Disability Status by Sex by Age in Hampton
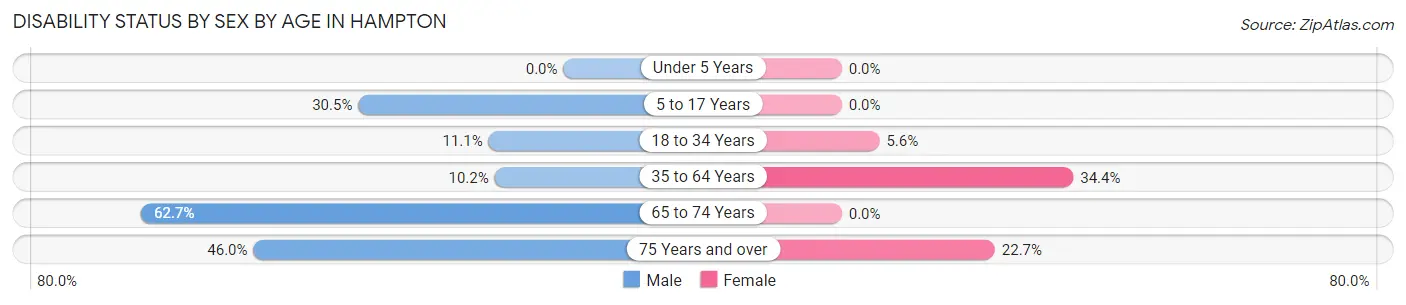
| Age Bracket | Male | Female |
| Under 5 Years | 0 (0.0%) | 0 (0.0%) |
| 5 to 17 Years | 92 (30.5%) | 0 (0.0%) |
| 18 to 34 Years | 16 (11.1%) | 13 (5.6%) |
| 35 to 64 Years | 32 (10.2%) | 121 (34.4%) |
| 65 to 74 Years | 37 (62.7%) | 0 (0.0%) |
| 75 Years and over | 29 (46.0%) | 10 (22.7%) |
Disability Class by Sex by Age in Hampton
Disability Class: Hearing Difficulty
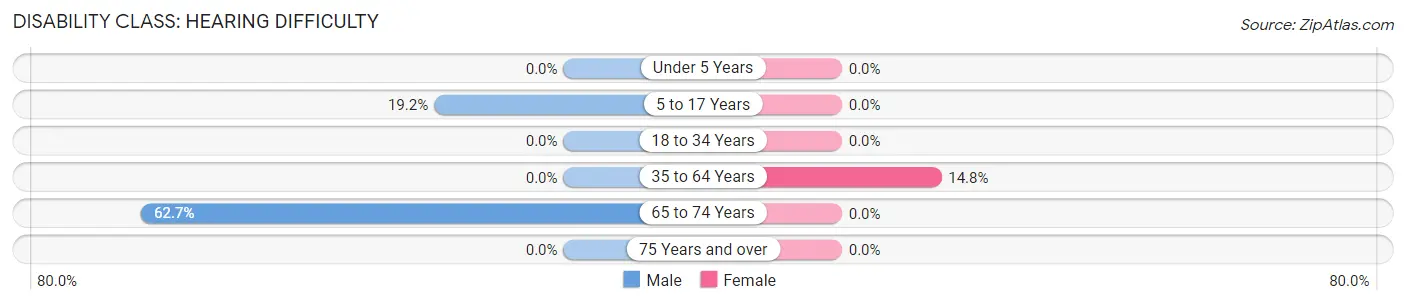
| Age Bracket | Male | Female |
| Under 5 Years | 0 (0.0%) | 0 (0.0%) |
| 5 to 17 Years | 58 (19.2%) | 0 (0.0%) |
| 18 to 34 Years | 0 (0.0%) | 0 (0.0%) |
| 35 to 64 Years | 0 (0.0%) | 52 (14.8%) |
| 65 to 74 Years | 37 (62.7%) | 0 (0.0%) |
| 75 Years and over | 0 (0.0%) | 0 (0.0%) |
Disability Class: Vision Difficulty
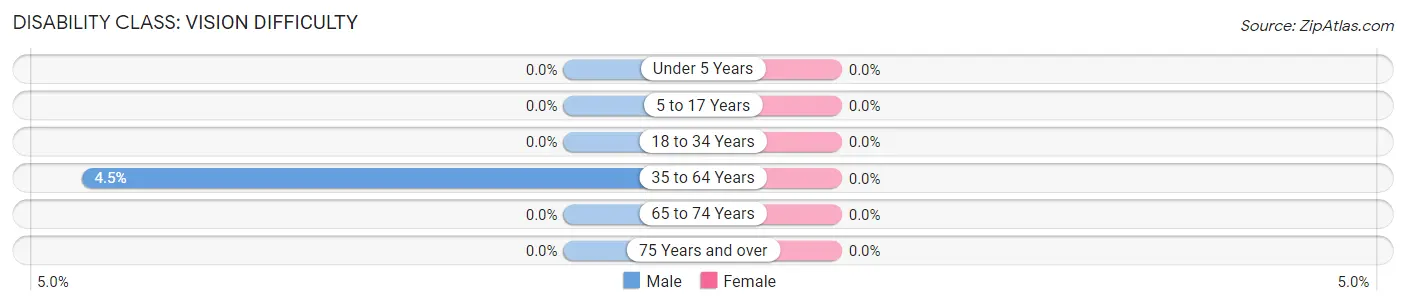
| Age Bracket | Male | Female |
| Under 5 Years | 0 (0.0%) | 0 (0.0%) |
| 5 to 17 Years | 0 (0.0%) | 0 (0.0%) |
| 18 to 34 Years | 0 (0.0%) | 0 (0.0%) |
| 35 to 64 Years | 14 (4.5%) | 0 (0.0%) |
| 65 to 74 Years | 0 (0.0%) | 0 (0.0%) |
| 75 Years and over | 0 (0.0%) | 0 (0.0%) |
Disability Class: Cognitive Difficulty
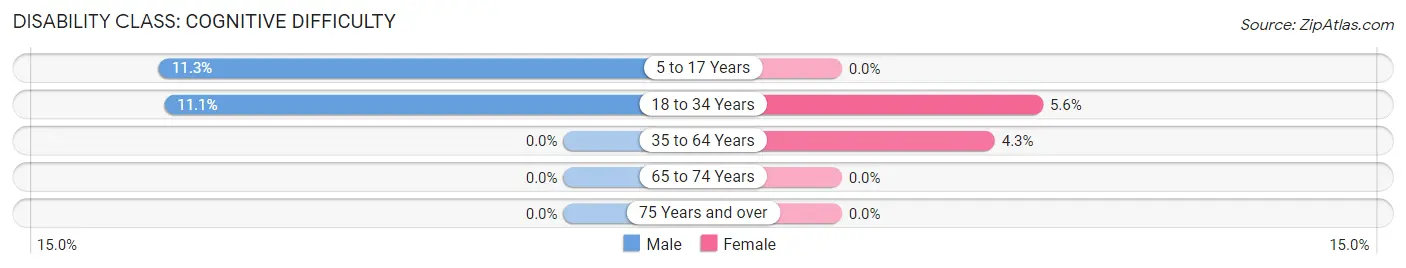
| Age Bracket | Male | Female |
| 5 to 17 Years | 34 (11.3%) | 0 (0.0%) |
| 18 to 34 Years | 16 (11.1%) | 13 (5.6%) |
| 35 to 64 Years | 0 (0.0%) | 15 (4.3%) |
| 65 to 74 Years | 0 (0.0%) | 0 (0.0%) |
| 75 Years and over | 0 (0.0%) | 0 (0.0%) |
Disability Class: Ambulatory Difficulty
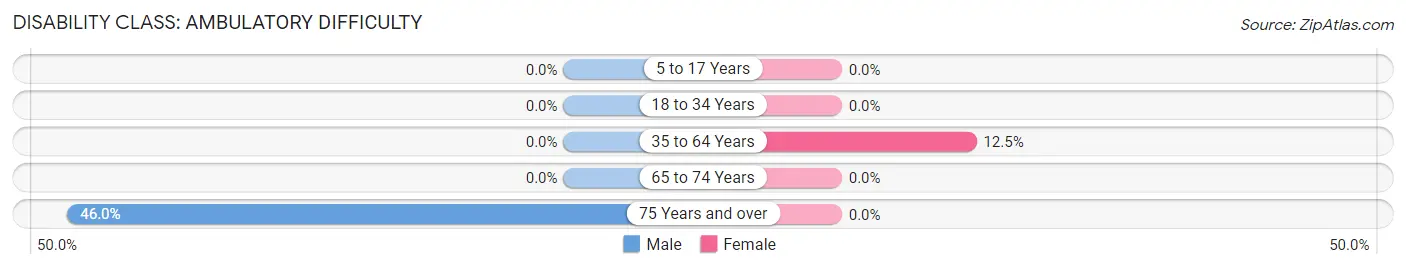
| Age Bracket | Male | Female |
| 5 to 17 Years | 0 (0.0%) | 0 (0.0%) |
| 18 to 34 Years | 0 (0.0%) | 0 (0.0%) |
| 35 to 64 Years | 0 (0.0%) | 44 (12.5%) |
| 65 to 74 Years | 0 (0.0%) | 0 (0.0%) |
| 75 Years and over | 29 (46.0%) | 0 (0.0%) |
Disability Class: Self-Care Difficulty
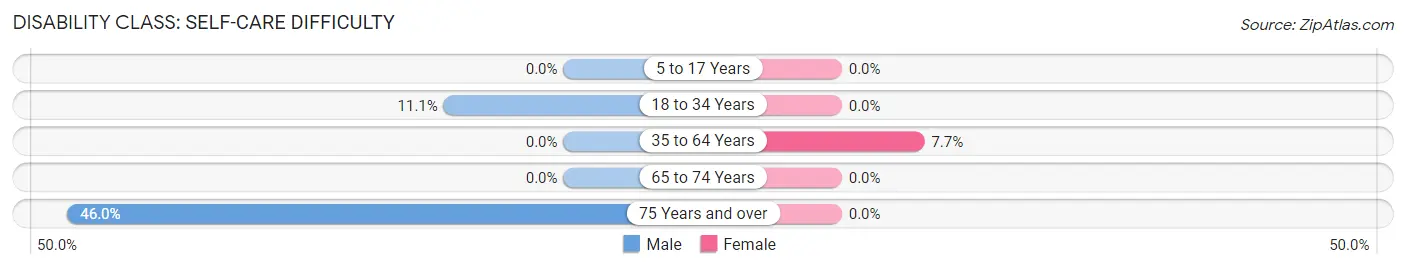
| Age Bracket | Male | Female |
| 5 to 17 Years | 0 (0.0%) | 0 (0.0%) |
| 18 to 34 Years | 16 (11.1%) | 0 (0.0%) |
| 35 to 64 Years | 0 (0.0%) | 27 (7.7%) |
| 65 to 74 Years | 0 (0.0%) | 0 (0.0%) |
| 75 Years and over | 29 (46.0%) | 0 (0.0%) |
Technology Access in Hampton
Computing Device Access in Hampton
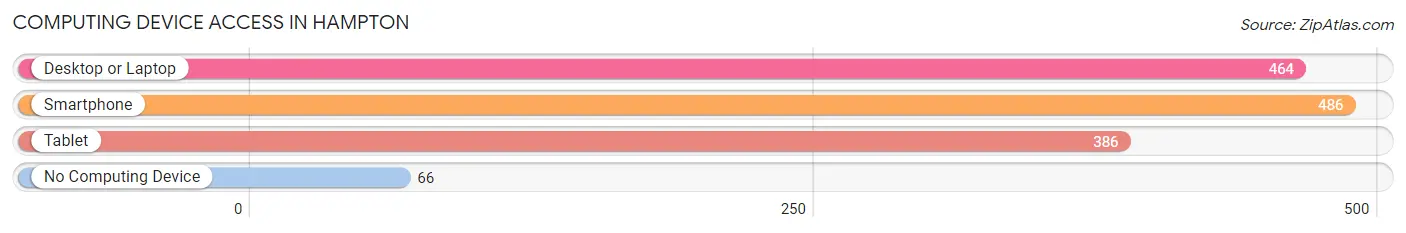
| Device Type | # Households | % Households |
| Desktop or Laptop | 464 | 77.5% |
| Smartphone | 486 | 81.1% |
| Tablet | 386 | 64.4% |
| No Computing Device | 66 | 11.0% |
| Total | 599 | 100.0% |
Internet Access in Hampton
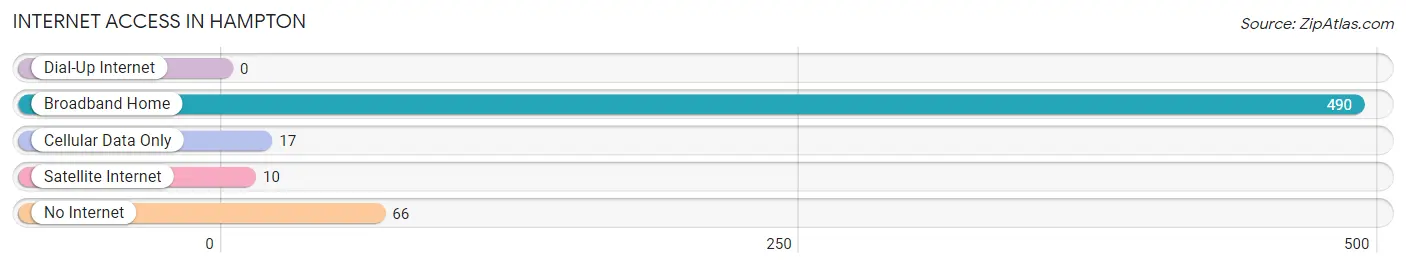
| Internet Type | # Households | % Households |
| Dial-Up Internet | 0 | 0.0% |
| Broadband Home | 490 | 81.8% |
| Cellular Data Only | 17 | 2.8% |
| Satellite Internet | 10 | 1.7% |
| No Internet | 66 | 11.0% |
| Total | 599 | 100.0% |
Hampton Summary
Hampton, Pennsylvania is a borough located in Allegheny County, Pennsylvania. It is a small community of approximately 1,500 people, located about 15 miles northeast of Pittsburgh. The borough was founded in 1845 and is named after the Hampton family, who were early settlers in the area.
Geography
Hampton is located in the Allegheny Plateau region of Pennsylvania. It is situated in the northeast corner of Allegheny County, near the border of Butler County. The borough is located on the banks of the Allegheny River, and is surrounded by the communities of Richland Township, West Deer Township, and Frazer Township. The terrain of the area is mostly hilly, with some flat areas near the river.
Economy
The economy of Hampton is largely based on small businesses and local services. The borough is home to a variety of small businesses, including restaurants, retail stores, and professional services. The borough also has a few larger employers, such as a manufacturing plant and a hospital. The borough is also home to a number of small farms, which provide fresh produce to the local community.
Demographics
As of the 2010 census, the population of Hampton was 1,521. The racial makeup of the borough was 97.2% White, 0.7% African American, 0.2% Native American, 0.3% Asian, 0.2% from other races, and 1.4% from two or more races. Hispanic or Latino of any race were 0.7% of the population.
The median household income in Hampton was $45,938, and the median family income was $51,250. The per capita income for the borough was $20,945. About 8.2% of families and 10.2% of the population were below the poverty line, including 14.2% of those under age 18 and 6.2% of those age 65 or over.
Conclusion
Hampton, Pennsylvania is a small borough located in Allegheny County. It is a quiet community with a population of approximately 1,500 people. The economy of the borough is largely based on small businesses and local services. The racial makeup of the borough is mostly White, with a small percentage of African American, Native American, and Asian residents. The median household income in Hampton is slightly above the national average, and the poverty rate is slightly below the national average.
Common Questions
What is Per Capita Income in Hampton?
Per Capita income in Hampton is $31,423.
What is the Median Family Income in Hampton?
Median Family Income in Hampton is $95,357.
What is the Median Household income in Hampton?
Median Household Income in Hampton is $82,557.
What is Income or Wage Gap in Hampton?
Income or Wage Gap in Hampton is 72.9%.
Women in Hampton earn 27.1 cents for every dollar earned by a man.
What is Inequality or Gini Index in Hampton?
Inequality or Gini Index in Hampton is 0.37.
What is the Total Population of Hampton?
Total Population of Hampton is 1,701.
What is the Total Male Population of Hampton?
Total Male Population of Hampton is 883.
What is the Total Female Population of Hampton?
Total Female Population of Hampton is 818.
What is the Ratio of Males per 100 Females in Hampton?
There are 107.95 Males per 100 Females in Hampton.
What is the Ratio of Females per 100 Males in Hampton?
There are 92.64 Females per 100 Males in Hampton.
What is the Median Population Age in Hampton?
Median Population Age in Hampton is 39.4 Years.
What is the Average Family Size in Hampton
Average Family Size in Hampton is 3.0 People.
What is the Average Household Size in Hampton
Average Household Size in Hampton is 2.8 People.
How Large is the Labor Force in Hampton?
There are 903 People in the Labor Forcein in Hampton.
What is the Percentage of People in the Labor Force in Hampton?
68.7% of People are in the Labor Force in Hampton.
What is the Unemployment Rate in Hampton?
Unemployment Rate in Hampton is 11.2%.