Cities with the Highest Percentage of Births to Unmarried Women under the Age of 20 in Pennsylvania
RELATED REPORTS & OPTIONS
Highest Illegitimacy | Women 15-19
Pennsylvania
Compare Cities
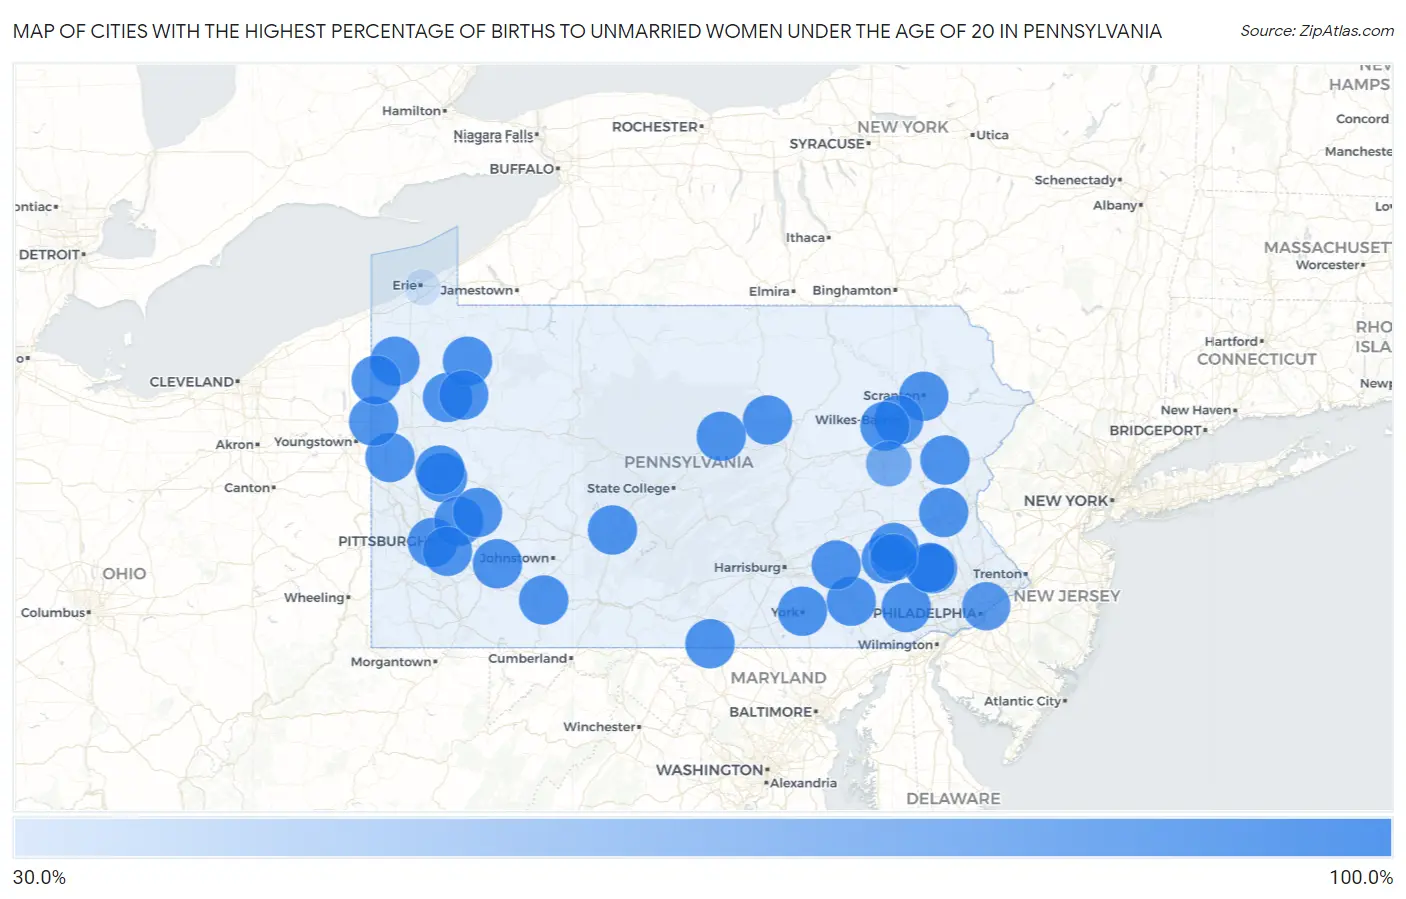
Map of Cities with the Highest Percentage of Births to Unmarried Women under the Age of 20 in Pennsylvania
0.0%
100.0%
Cities with the Highest Percentage of Births to Unmarried Women under the Age of 20 in Pennsylvania
| City | % Unmarried | vs State | vs National | |
| 1. | Pittsburgh | 100.0% | 93.0%(+7.00)#1 | 86.9%(+13.1)#28 |
| 2. | Scranton | 100.0% | 93.0%(+7.00)#2 | 86.9%(+13.1)#234 |
| 3. | Lancaster | 100.0% | 93.0%(+7.00)#3 | 86.9%(+13.1)#315 |
| 4. | York | 100.0% | 93.0%(+7.00)#4 | 86.9%(+13.1)#393 |
| 5. | Wilkes Barre | 100.0% | 93.0%(+7.00)#5 | 86.9%(+13.1)#402 |
| 6. | Altoona | 100.0% | 93.0%(+7.00)#6 | 86.9%(+13.1)#406 |
| 7. | Norristown Borough | 100.0% | 93.0%(+7.00)#7 | 86.9%(+13.1)#462 |
| 8. | Williamsport | 100.0% | 93.0%(+7.00)#8 | 86.9%(+13.1)#554 |
| 9. | Chambersburg Borough | 100.0% | 93.0%(+7.00)#9 | 86.9%(+13.1)#638 |
| 10. | New Castle | 100.0% | 93.0%(+7.00)#10 | 86.9%(+13.1)#639 |
| 11. | Fullerton | 100.0% | 93.0%(+7.00)#11 | 86.9%(+13.1)#756 |
| 12. | Butler | 100.0% | 93.0%(+7.00)#12 | 86.9%(+13.1)#841 |
| 13. | Coatesville | 100.0% | 93.0%(+7.00)#13 | 86.9%(+13.1)#845 |
| 14. | Sharon | 100.0% | 93.0%(+7.00)#14 | 86.9%(+13.1)#851 |
| 15. | New Kensington | 100.0% | 93.0%(+7.00)#15 | 86.9%(+13.1)#882 |
| 16. | Nanticoke | 100.0% | 93.0%(+7.00)#16 | 86.9%(+13.1)#921 |
| 17. | Columbia Borough | 100.0% | 93.0%(+7.00)#17 | 86.9%(+13.1)#941 |
| 18. | Middletown Borough | 100.0% | 93.0%(+7.00)#18 | 86.9%(+13.1)#966 |
| 19. | Collingdale Borough | 100.0% | 93.0%(+7.00)#19 | 86.9%(+13.1)#988 |
| 20. | Sanatoga | 100.0% | 93.0%(+7.00)#20 | 86.9%(+13.1)#991 |
| 21. | Lewistown Borough | 100.0% | 93.0%(+7.00)#21 | 86.9%(+13.1)#1,007 |
| 22. | Lock Haven | 100.0% | 93.0%(+7.00)#22 | 86.9%(+13.1)#1,010 |
| 23. | Huntingdon Borough | 100.0% | 93.0%(+7.00)#23 | 86.9%(+13.1)#1,066 |
| 24. | Franklin | 100.0% | 93.0%(+7.00)#24 | 86.9%(+13.1)#1,092 |
| 25. | Somerset Borough | 100.0% | 93.0%(+7.00)#25 | 86.9%(+13.1)#1,100 |
| 26. | Mount Carmel Borough | 100.0% | 93.0%(+7.00)#26 | 86.9%(+13.1)#1,112 |
| 27. | Titusville | 100.0% | 93.0%(+7.00)#27 | 86.9%(+13.1)#1,134 |
| 28. | Duquesne | 100.0% | 93.0%(+7.00)#28 | 86.9%(+13.1)#1,136 |
| 29. | Shanor Northvue | 100.0% | 93.0%(+7.00)#29 | 86.9%(+13.1)#1,142 |
| 30. | Manheim Borough | 100.0% | 93.0%(+7.00)#30 | 86.9%(+13.1)#1,147 |
| 31. | Scottdale Borough | 100.0% | 93.0%(+7.00)#31 | 86.9%(+13.1)#1,179 |
| 32. | Throop Borough | 100.0% | 93.0%(+7.00)#32 | 86.9%(+13.1)#1,201 |
| 33. | Pottsgrove | 100.0% | 93.0%(+7.00)#33 | 86.9%(+13.1)#1,240 |
| 34. | West Wyomissing | 100.0% | 93.0%(+7.00)#34 | 86.9%(+13.1)#1,249 |
| 35. | Wayne Heights | 100.0% | 93.0%(+7.00)#35 | 86.9%(+13.1)#1,258 |
| 36. | Youngwood Borough | 100.0% | 93.0%(+7.00)#36 | 86.9%(+13.1)#1,272 |
| 37. | West Grove Borough | 100.0% | 93.0%(+7.00)#37 | 86.9%(+13.1)#1,296 |
| 38. | Midland Borough | 100.0% | 93.0%(+7.00)#38 | 86.9%(+13.1)#1,312 |
| 39. | Marysville Borough | 100.0% | 93.0%(+7.00)#39 | 86.9%(+13.1)#1,314 |
| 40. | Reynoldsville Borough | 100.0% | 93.0%(+7.00)#40 | 86.9%(+13.1)#1,323 |
| 41. | Hyde Park | 100.0% | 93.0%(+7.00)#41 | 86.9%(+13.1)#1,344 |
| 42. | Port Allegany Borough | 100.0% | 93.0%(+7.00)#42 | 86.9%(+13.1)#1,357 |
| 43. | Sun Valley | 100.0% | 93.0%(+7.00)#43 | 86.9%(+13.1)#1,368 |
| 44. | Wrightsville Borough | 100.0% | 93.0%(+7.00)#44 | 86.9%(+13.1)#1,369 |
| 45. | Brockway Borough | 100.0% | 93.0%(+7.00)#45 | 86.9%(+13.1)#1,370 |
| 46. | Conneaut Lakeshore | 100.0% | 93.0%(+7.00)#46 | 86.9%(+13.1)#1,415 |
| 47. | South Temple | 100.0% | 93.0%(+7.00)#47 | 86.9%(+13.1)#1,425 |
| 48. | New Oxford Borough | 100.0% | 93.0%(+7.00)#48 | 86.9%(+13.1)#1,453 |
| 49. | Tremont Borough | 100.0% | 93.0%(+7.00)#49 | 86.9%(+13.1)#1,462 |
| 50. | Martinsburg Borough | 100.0% | 93.0%(+7.00)#50 | 86.9%(+13.1)#1,468 |
| 51. | Gallitzin Borough | 100.0% | 93.0%(+7.00)#51 | 86.9%(+13.1)#1,490 |
| 52. | St Vincent College | 100.0% | 93.0%(+7.00)#52 | 86.9%(+13.1)#1,511 |
| 53. | Catawissa Borough | 100.0% | 93.0%(+7.00)#53 | 86.9%(+13.1)#1,520 |
| 54. | Avis Borough | 100.0% | 93.0%(+7.00)#54 | 86.9%(+13.1)#1,528 |
| 55. | Saxonburg Borough | 100.0% | 93.0%(+7.00)#55 | 86.9%(+13.1)#1,535 |
| 56. | Woodland Heights | 100.0% | 93.0%(+7.00)#56 | 86.9%(+13.1)#1,536 |
| 57. | Westfield Borough | 100.0% | 93.0%(+7.00)#57 | 86.9%(+13.1)#1,553 |
| 58. | Friedens | 100.0% | 93.0%(+7.00)#58 | 86.9%(+13.1)#1,567 |
| 59. | Yoe Borough | 100.0% | 93.0%(+7.00)#59 | 86.9%(+13.1)#1,598 |
| 60. | South Fork Borough | 100.0% | 93.0%(+7.00)#60 | 86.9%(+13.1)#1,664 |
| 61. | Beavertown Borough | 100.0% | 93.0%(+7.00)#61 | 86.9%(+13.1)#1,671 |
| 62. | Ringtown Borough | 100.0% | 93.0%(+7.00)#62 | 86.9%(+13.1)#1,702 |
| 63. | Quentin | 100.0% | 93.0%(+7.00)#63 | 86.9%(+13.1)#1,720 |
| 64. | Wyalusing Borough | 100.0% | 93.0%(+7.00)#64 | 86.9%(+13.1)#1,724 |
| 65. | Marion Heights Borough | 100.0% | 93.0%(+7.00)#65 | 86.9%(+13.1)#1,730 |
| 66. | Hydetown Borough | 100.0% | 93.0%(+7.00)#66 | 86.9%(+13.1)#1,731 |
| 67. | Rouseville Borough | 100.0% | 93.0%(+7.00)#67 | 86.9%(+13.1)#1,786 |
| 68. | Worthington Borough | 100.0% | 93.0%(+7.00)#68 | 86.9%(+13.1)#1,787 |
| 69. | Dushore Borough | 100.0% | 93.0%(+7.00)#69 | 86.9%(+13.1)#1,813 |
| 70. | Vintondale Borough | 100.0% | 93.0%(+7.00)#70 | 86.9%(+13.1)#1,814 |
| 71. | Fawn Grove Borough | 100.0% | 93.0%(+7.00)#71 | 86.9%(+13.1)#1,818 |
| 72. | Pymatuning South | 100.0% | 93.0%(+7.00)#72 | 86.9%(+13.1)#1,822 |
| 73. | Mifflin Borough | 100.0% | 93.0%(+7.00)#73 | 86.9%(+13.1)#1,858 |
| 74. | Enon Valley Borough | 100.0% | 93.0%(+7.00)#74 | 86.9%(+13.1)#1,868 |
| 75. | Vanderbilt Borough | 100.0% | 93.0%(+7.00)#76 | 86.9%(+13.1)#1,874 |
| 76. | Indian Lake Borough | 100.0% | 93.0%(+7.00)#77 | 86.9%(+13.1)#1,875 |
| 77. | Union Dale Borough | 100.0% | 93.0%(+7.00)#78 | 86.9%(+13.1)#1,931 |
| 78. | Philadelphia | 94.0% | 93.0%(+1.000)#79 | 86.9%(+7.10)#1,957 |
| 79. | Reading | 88.7% | 93.0%(-4.30)#80 | 86.9%(+1.80)#1,977 |
| 80. | Hazleton | 79.5% | 93.0%(-13.5)#81 | 86.9%(-7.40)#2,016 |
| 81. | Erie | 31.0% | 93.0%(-62.0)#82 | 86.9%(-55.9)#2,116 |
Common Questions
What are the Top 10 Cities with the Highest Percentage of Births to Unmarried Women under the Age of 20 in Pennsylvania?
Top 10 Cities with the Highest Percentage of Births to Unmarried Women under the Age of 20 in Pennsylvania are:
#1
100.0%
#2
100.0%
#3
100.0%
#4
100.0%
#5
100.0%
#6
100.0%
#7
100.0%
#8
100.0%
#9
100.0%
#10
100.0%
What city has the Highest Percentage of Births to Unmarried Women under the Age of 20 in Pennsylvania?
Pittsburgh has the Highest Percentage of Births to Unmarried Women under the Age of 20 in Pennsylvania with 100.0%.
What is the Percentage of Births to Unmarried Women under the Age of 20 in the State of Pennsylvania?
Percentage of Births to Unmarried Women under the Age of 20 in Pennsylvania is 93.0%.
What is the Percentage of Births to Unmarried Women under the Age of 20 in the United States?
Percentage of Births to Unmarried Women under the Age of 20 in the United States is 86.9%.