Cities with the Most Immigrants from Philippines in Pennsylvania
RELATED REPORTS & OPTIONS
Philippines
Pennsylvania
Compare Cities
Map of Cities with the Most Immigrants from Philippines in Pennsylvania
0
5,000
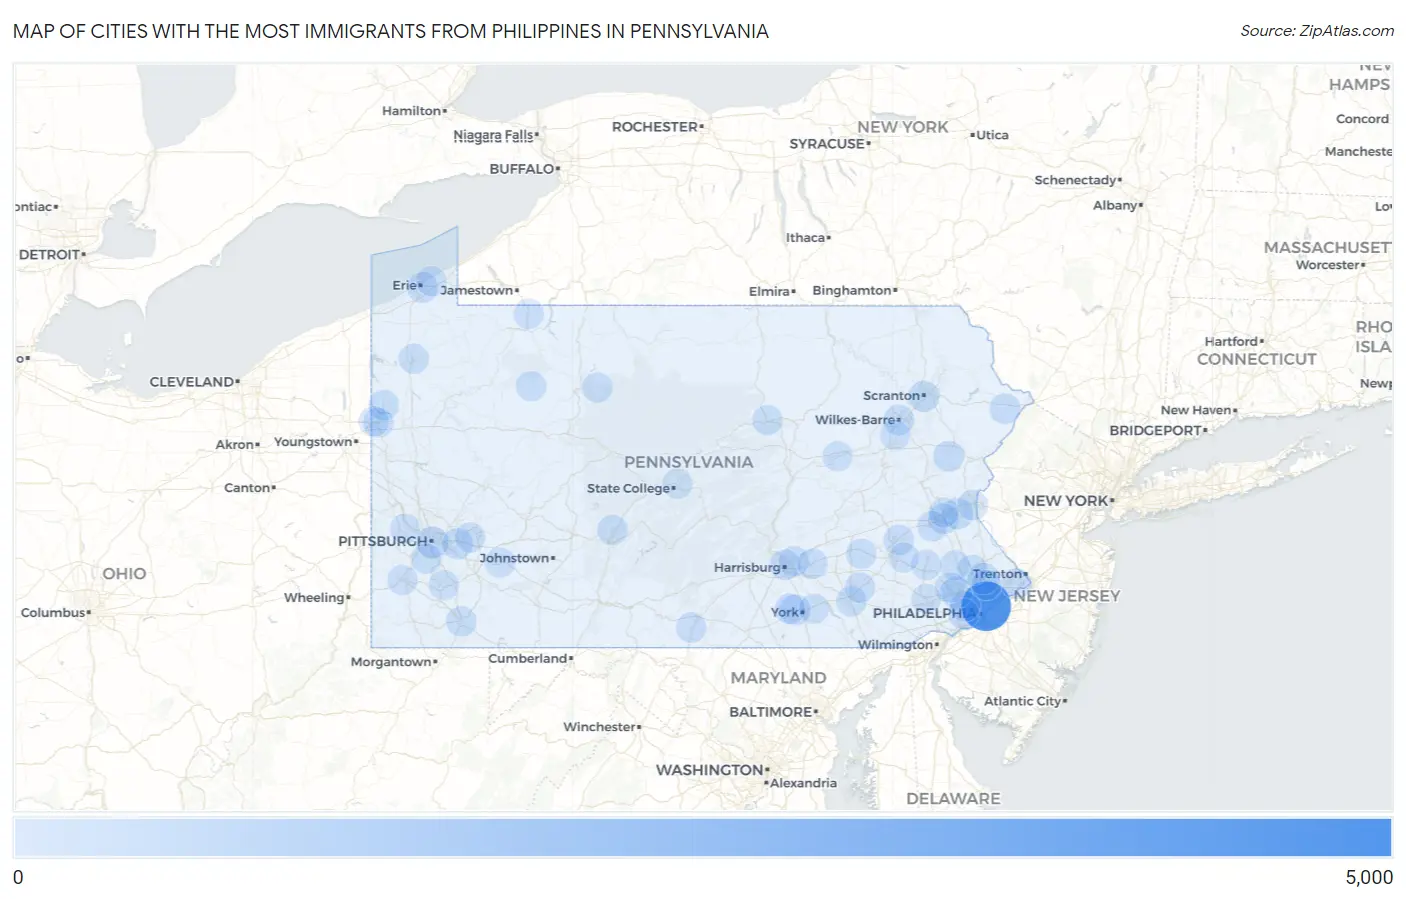
Cities with the Most Immigrants from Philippines in Pennsylvania
| City | Philippines | vs State | vs National | |
| 1. | Philadelphia | 4,462 | 21,039(21.21%)#1 | 1,985,710(0.22%)#56 |
| 2. | Pittsburgh | 444 | 21,039(2.11%)#2 | 1,985,710(0.02%)#608 |
| 3. | King Of Prussia | 377 | 21,039(1.79%)#3 | 1,985,710(0.02%)#702 |
| 4. | Horsham | 286 | 21,039(1.36%)#4 | 1,985,710(0.01%)#860 |
| 5. | Bethlehem | 244 | 21,039(1.16%)#5 | 1,985,710(0.01%)#982 |
| 6. | Scranton | 227 | 21,039(1.08%)#6 | 1,985,710(0.01%)#1,034 |
| 7. | Monroeville | 200 | 21,039(0.95%)#7 | 1,985,710(0.01%)#1,154 |
| 8. | South Williamsport Borough | 192 | 21,039(0.91%)#8 | 1,985,710(0.01%)#1,208 |
| 9. | Sierra View | 179 | 21,039(0.85%)#9 | 1,985,710(0.01%)#1,284 |
| 10. | Shiloh | 165 | 21,039(0.78%)#10 | 1,985,710(0.01%)#1,352 |
| 11. | Lititz Borough | 152 | 21,039(0.72%)#11 | 1,985,710(0.01%)#1,435 |
| 12. | Allentown | 149 | 21,039(0.71%)#12 | 1,985,710(0.01%)#1,448 |
| 13. | Drexel Hill | 148 | 21,039(0.70%)#13 | 1,985,710(0.01%)#1,461 |
| 14. | Erie | 147 | 21,039(0.70%)#14 | 1,985,710(0.01%)#1,463 |
| 15. | Levittown | 138 | 21,039(0.66%)#15 | 1,985,710(0.01%)#1,533 |
| 16. | Wilkes Barre | 138 | 21,039(0.66%)#16 | 1,985,710(0.01%)#1,534 |
| 17. | Prospect Park Borough | 130 | 21,039(0.62%)#17 | 1,985,710(0.01%)#1,615 |
| 18. | Dunmore Borough | 129 | 21,039(0.61%)#18 | 1,985,710(0.01%)#1,622 |
| 19. | Gold Key Lake | 116 | 21,039(0.55%)#19 | 1,985,710(0.01%)#1,738 |
| 20. | Harrisburg | 96 | 21,039(0.46%)#20 | 1,985,710(0.00%)#1,966 |
| 21. | Norristown Borough | 96 | 21,039(0.46%)#21 | 1,985,710(0.00%)#1,969 |
| 22. | Montgomeryville | 96 | 21,039(0.46%)#22 | 1,985,710(0.00%)#1,978 |
| 23. | Ancient Oaks | 94 | 21,039(0.45%)#23 | 1,985,710(0.00%)#2,004 |
| 24. | Blandon | 89 | 21,039(0.42%)#24 | 1,985,710(0.00%)#2,081 |
| 25. | Ambler Borough | 84 | 21,039(0.40%)#25 | 1,985,710(0.00%)#2,152 |
| 26. | Williamsport | 77 | 21,039(0.37%)#26 | 1,985,710(0.00%)#2,265 |
| 27. | Carlisle Borough | 72 | 21,039(0.34%)#27 | 1,985,710(0.00%)#2,360 |
| 28. | Hanover Borough | 71 | 21,039(0.34%)#28 | 1,985,710(0.00%)#2,394 |
| 29. | Bala Cynwyd | 70 | 21,039(0.33%)#29 | 1,985,710(0.00%)#2,415 |
| 30. | Reynolds Heights | 66 | 21,039(0.31%)#30 | 1,985,710(0.00%)#2,490 |
| 31. | Southmont Borough | 64 | 21,039(0.30%)#31 | 1,985,710(0.00%)#2,539 |
| 32. | Ardmore | 62 | 21,039(0.29%)#32 | 1,985,710(0.00%)#2,574 |
| 33. | Colonial Park | 61 | 21,039(0.29%)#33 | 1,985,710(0.00%)#2,593 |
| 34. | Whitehall Borough | 61 | 21,039(0.29%)#34 | 1,985,710(0.00%)#2,594 |
| 35. | Weigelstown | 60 | 21,039(0.29%)#35 | 1,985,710(0.00%)#2,612 |
| 36. | Boswell Borough | 59 | 21,039(0.28%)#36 | 1,985,710(0.00%)#2,653 |
| 37. | Bethel Park | 56 | 21,039(0.27%)#37 | 1,985,710(0.00%)#2,704 |
| 38. | Lansdale Borough | 52 | 21,039(0.25%)#38 | 1,985,710(0.00%)#2,828 |
| 39. | Lancaster | 51 | 21,039(0.24%)#39 | 1,985,710(0.00%)#2,843 |
| 40. | Parkesburg Borough | 51 | 21,039(0.24%)#40 | 1,985,710(0.00%)#2,863 |
| 41. | Turtle Creek Borough | 50 | 21,039(0.24%)#41 | 1,985,710(0.00%)#2,895 |
| 42. | Jessup Borough | 50 | 21,039(0.24%)#42 | 1,985,710(0.00%)#2,897 |
| 43. | Aldan Borough | 50 | 21,039(0.24%)#43 | 1,985,710(0.00%)#2,899 |
| 44. | Marion | 50 | 21,039(0.24%)#44 | 1,985,710(0.00%)#2,906 |
| 45. | Easton | 49 | 21,039(0.23%)#45 | 1,985,710(0.00%)#2,910 |
| 46. | Murrysville | 49 | 21,039(0.23%)#46 | 1,985,710(0.00%)#2,912 |
| 47. | Uniontown | 47 | 21,039(0.22%)#47 | 1,985,710(0.00%)#2,983 |
| 48. | State College Borough | 46 | 21,039(0.22%)#48 | 1,985,710(0.00%)#2,996 |
| 49. | Willow Grove | 46 | 21,039(0.22%)#49 | 1,985,710(0.00%)#3,007 |
| 50. | Altoona | 45 | 21,039(0.21%)#50 | 1,985,710(0.00%)#3,026 |
| 51. | Hershey | 45 | 21,039(0.21%)#51 | 1,985,710(0.00%)#3,036 |
| 52. | Meadville | 45 | 21,039(0.21%)#52 | 1,985,710(0.00%)#3,039 |
| 53. | Dover Borough | 45 | 21,039(0.21%)#53 | 1,985,710(0.00%)#3,058 |
| 54. | Downingtown Borough | 44 | 21,039(0.21%)#54 | 1,985,710(0.00%)#3,080 |
| 55. | Brownstown | 43 | 21,039(0.20%)#55 | 1,985,710(0.00%)#3,133 |
| 56. | East Stroudsburg Borough | 42 | 21,039(0.20%)#56 | 1,985,710(0.00%)#3,164 |
| 57. | Newmanstown | 42 | 21,039(0.20%)#57 | 1,985,710(0.00%)#3,180 |
| 58. | Mount Pocono Borough | 41 | 21,039(0.19%)#58 | 1,985,710(0.00%)#3,220 |
| 59. | Villanova | 40 | 21,039(0.19%)#59 | 1,985,710(0.00%)#3,253 |
| 60. | Marienville | 39 | 21,039(0.19%)#60 | 1,985,710(0.00%)#3,310 |
| 61. | Plum Borough | 38 | 21,039(0.18%)#61 | 1,985,710(0.00%)#3,329 |
| 62. | St Marys | 38 | 21,039(0.18%)#62 | 1,985,710(0.00%)#3,339 |
| 63. | Quakertown Borough | 38 | 21,039(0.18%)#63 | 1,985,710(0.00%)#3,348 |
| 64. | Mckees Rocks Borough | 37 | 21,039(0.18%)#64 | 1,985,710(0.00%)#3,401 |
| 65. | Russell | 37 | 21,039(0.18%)#65 | 1,985,710(0.00%)#3,414 |
| 66. | Bridgeport Borough | 36 | 21,039(0.17%)#66 | 1,985,710(0.00%)#3,442 |
| 67. | Espy | 36 | 21,039(0.17%)#67 | 1,985,710(0.00%)#3,452 |
| 68. | Red Lion Borough | 35 | 21,039(0.17%)#68 | 1,985,710(0.00%)#3,491 |
| 69. | Hermitage | 34 | 21,039(0.16%)#69 | 1,985,710(0.00%)#3,530 |
| 70. | Harleysville | 33 | 21,039(0.16%)#70 | 1,985,710(0.00%)#3,579 |
| 71. | Lehighton Borough | 33 | 21,039(0.16%)#71 | 1,985,710(0.00%)#3,588 |
| 72. | West Pittston Borough | 32 | 21,039(0.15%)#72 | 1,985,710(0.00%)#3,641 |
| 73. | Sharon | 30 | 21,039(0.14%)#73 | 1,985,710(0.00%)#3,734 |
| 74. | Swarthmore Borough | 30 | 21,039(0.14%)#74 | 1,985,710(0.00%)#3,753 |
| 75. | Lawson Heights | 30 | 21,039(0.14%)#75 | 1,985,710(0.00%)#3,768 |
| 76. | Clarks Green Borough | 30 | 21,039(0.14%)#76 | 1,985,710(0.00%)#3,771 |
| 77. | Jenkintown Borough | 29 | 21,039(0.14%)#77 | 1,985,710(0.00%)#3,825 |
| 78. | Halfway House | 29 | 21,039(0.14%)#78 | 1,985,710(0.00%)#3,830 |
| 79. | Jefferson Hills Borough | 28 | 21,039(0.13%)#79 | 1,985,710(0.00%)#3,861 |
| 80. | Audubon | 28 | 21,039(0.13%)#80 | 1,985,710(0.00%)#3,869 |
| 81. | Kingston Borough | 27 | 21,039(0.13%)#81 | 1,985,710(0.00%)#3,919 |
| 82. | Mountain Top | 27 | 21,039(0.13%)#82 | 1,985,710(0.00%)#3,922 |
| 83. | Rosemont | 27 | 21,039(0.13%)#83 | 1,985,710(0.00%)#3,956 |
| 84. | Trafford Borough | 27 | 21,039(0.13%)#84 | 1,985,710(0.00%)#3,960 |
| 85. | Northwest Harborcreek | 26 | 21,039(0.12%)#85 | 1,985,710(0.00%)#3,997 |
| 86. | Jacksonwald | 26 | 21,039(0.12%)#86 | 1,985,710(0.00%)#4,014 |
| 87. | Alburtis Borough | 25 | 21,039(0.12%)#87 | 1,985,710(0.00%)#4,080 |
| 88. | Lionville | 24 | 21,039(0.11%)#88 | 1,985,710(0.00%)#4,134 |
| 89. | Carnot Moon | 23 | 21,039(0.11%)#89 | 1,985,710(0.00%)#4,173 |
| 90. | Greenville Borough | 23 | 21,039(0.11%)#90 | 1,985,710(0.00%)#4,191 |
| 91. | Stonybrook | 23 | 21,039(0.11%)#91 | 1,985,710(0.00%)#4,198 |
| 92. | Pitcairn Borough | 23 | 21,039(0.11%)#92 | 1,985,710(0.00%)#4,200 |
| 93. | Clearfield Borough | 22 | 21,039(0.10%)#93 | 1,985,710(0.00%)#4,256 |
| 94. | Geistown Borough | 22 | 21,039(0.10%)#94 | 1,985,710(0.00%)#4,266 |
| 95. | Houserville | 22 | 21,039(0.10%)#95 | 1,985,710(0.00%)#4,268 |
| 96. | Pottstown Borough | 21 | 21,039(0.10%)#96 | 1,985,710(0.00%)#4,296 |
| 97. | Fullerton | 21 | 21,039(0.10%)#97 | 1,985,710(0.00%)#4,307 |
| 98. | Washington | 21 | 21,039(0.10%)#98 | 1,985,710(0.00%)#4,314 |
| 99. | Swissvale Borough | 21 | 21,039(0.10%)#99 | 1,985,710(0.00%)#4,329 |
| 100. | Monessen | 21 | 21,039(0.10%)#100 | 1,985,710(0.00%)#4,334 |
Common Questions
What are the Top 10 Cities with the Most Immigrants from Philippines in Pennsylvania?
Top 10 Cities with the Most Immigrants from Philippines in Pennsylvania are:
#1
4,462
#2
444
#3
377
#4
286
#5
244
#6
227
#7
200
#8
179
#9
165
#10
149
What city has the Most Immigrants from Philippines in Pennsylvania?
Philadelphia has the Most Immigrants from Philippines in Pennsylvania with 4,462.
What is the Total Immigrants from Philippines in the State of Pennsylvania?
Total Immigrants from Philippines in Pennsylvania is 21,039.
What is the Total Immigrants from Philippines in the United States?
Total Immigrants from Philippines in the United States is 1,985,710.