Cities with the Most Immigrants from Italy in Illinois
RELATED REPORTS & OPTIONS
Italy
Illinois
Compare Cities
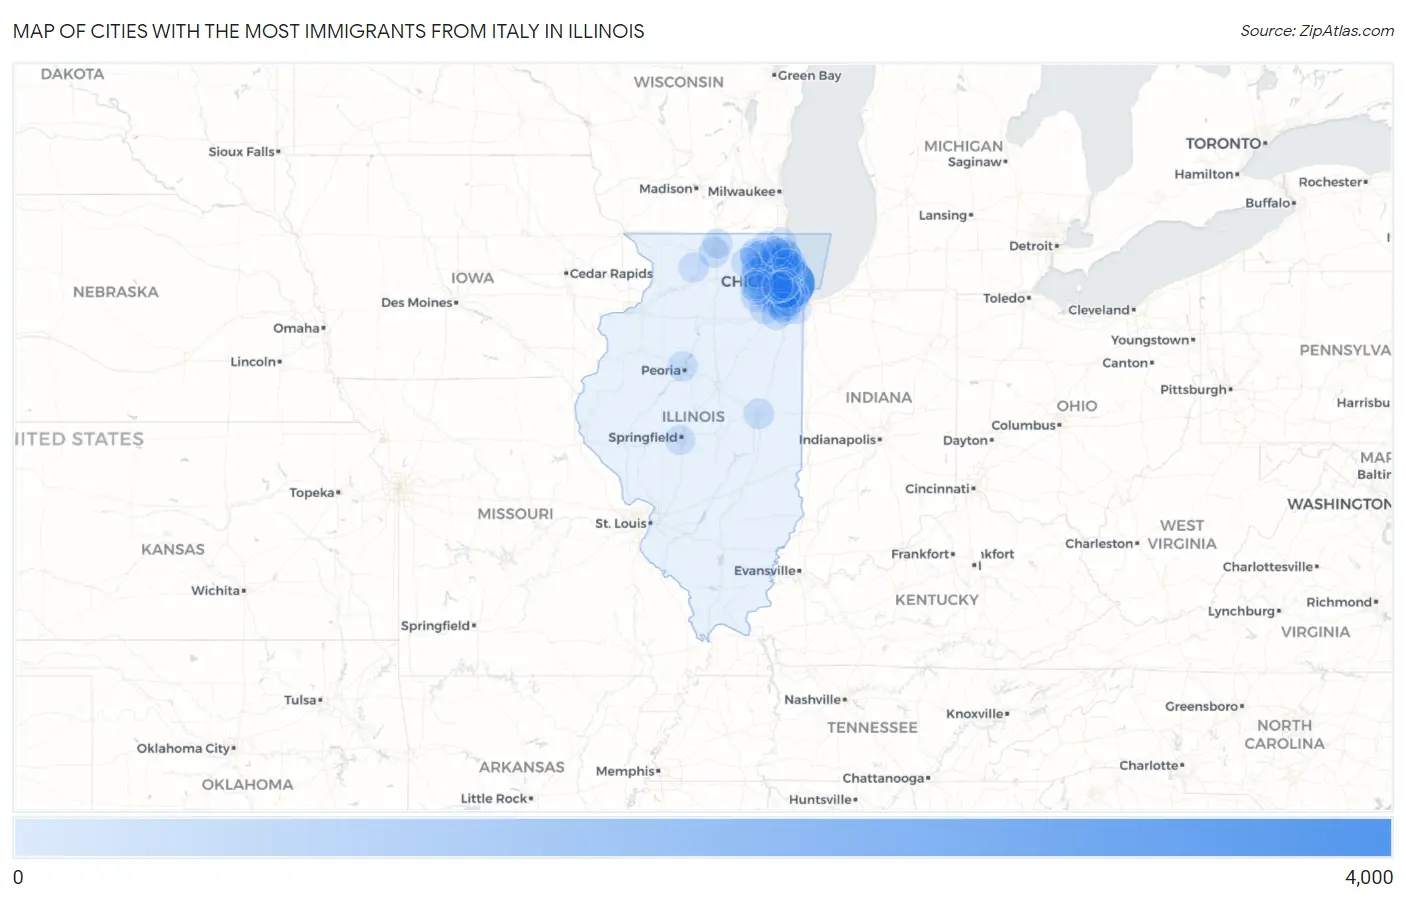
Map of Cities with the Most Immigrants from Italy in Illinois
0
4,000
Cities with the Most Immigrants from Italy in Illinois
| City | Italy | vs State | vs National | |
| 1. | Chicago | 3,065 | 15,679(19.55%)#1 | 312,941(0.98%)#3 |
| 2. | Addison | 728 | 15,679(4.64%)#2 | 312,941(0.23%)#22 |
| 3. | Norridge | 647 | 15,679(4.13%)#3 | 312,941(0.21%)#26 |
| 4. | Bartlett | 395 | 15,679(2.52%)#4 | 312,941(0.13%)#64 |
| 5. | Mount Prospect | 394 | 15,679(2.51%)#5 | 312,941(0.13%)#68 |
| 6. | Arlington Heights | 327 | 15,679(2.09%)#6 | 312,941(0.10%)#87 |
| 7. | Melrose Park | 261 | 15,679(1.66%)#7 | 312,941(0.08%)#134 |
| 8. | Winnetka | 232 | 15,679(1.48%)#8 | 312,941(0.07%)#160 |
| 9. | Orland Park | 220 | 15,679(1.40%)#9 | 312,941(0.07%)#175 |
| 10. | Naperville | 213 | 15,679(1.36%)#10 | 312,941(0.07%)#184 |
| 11. | Niles | 195 | 15,679(1.24%)#11 | 312,941(0.06%)#208 |
| 12. | Carol Stream | 185 | 15,679(1.18%)#12 | 312,941(0.06%)#226 |
| 13. | Highland Park | 181 | 15,679(1.15%)#13 | 312,941(0.06%)#234 |
| 14. | Oswego | 179 | 15,679(1.14%)#14 | 312,941(0.06%)#239 |
| 15. | Bloomingdale | 176 | 15,679(1.12%)#15 | 312,941(0.06%)#244 |
| 16. | Elmhurst | 166 | 15,679(1.06%)#16 | 312,941(0.05%)#259 |
| 17. | Schiller Park | 166 | 15,679(1.06%)#17 | 312,941(0.05%)#260 |
| 18. | Westchester | 164 | 15,679(1.05%)#18 | 312,941(0.05%)#266 |
| 19. | Buffalo Grove | 153 | 15,679(0.98%)#19 | 312,941(0.05%)#304 |
| 20. | Prospect Heights | 153 | 15,679(0.98%)#20 | 312,941(0.05%)#305 |
| 21. | Harwood Heights | 149 | 15,679(0.95%)#21 | 312,941(0.05%)#321 |
| 22. | Elmwood Park | 144 | 15,679(0.92%)#22 | 312,941(0.05%)#329 |
| 23. | Tinley Park | 141 | 15,679(0.90%)#23 | 312,941(0.05%)#339 |
| 24. | St Charles | 141 | 15,679(0.90%)#24 | 312,941(0.05%)#340 |
| 25. | Berwyn | 138 | 15,679(0.88%)#25 | 312,941(0.04%)#349 |
| 26. | Des Plaines | 134 | 15,679(0.85%)#26 | 312,941(0.04%)#355 |
| 27. | Oak Lawn | 134 | 15,679(0.85%)#27 | 312,941(0.04%)#356 |
| 28. | Hoffman Estates | 125 | 15,679(0.80%)#28 | 312,941(0.04%)#383 |
| 29. | Schaumburg | 124 | 15,679(0.79%)#29 | 312,941(0.04%)#389 |
| 30. | Elk Grove Village | 124 | 15,679(0.79%)#30 | 312,941(0.04%)#391 |
| 31. | Woodridge | 120 | 15,679(0.77%)#31 | 312,941(0.04%)#400 |
| 32. | Rockford | 118 | 15,679(0.75%)#32 | 312,941(0.04%)#406 |
| 33. | Wood Dale | 117 | 15,679(0.75%)#33 | 312,941(0.04%)#413 |
| 34. | Skokie | 113 | 15,679(0.72%)#34 | 312,941(0.04%)#428 |
| 35. | Champaign | 112 | 15,679(0.71%)#35 | 312,941(0.04%)#437 |
| 36. | Park Ridge | 107 | 15,679(0.68%)#36 | 312,941(0.03%)#469 |
| 37. | Romeoville | 106 | 15,679(0.68%)#37 | 312,941(0.03%)#476 |
| 38. | Downers Grove | 105 | 15,679(0.67%)#38 | 312,941(0.03%)#480 |
| 39. | Blue Island | 104 | 15,679(0.66%)#39 | 312,941(0.03%)#487 |
| 40. | Homer Glen | 99 | 15,679(0.63%)#40 | 312,941(0.03%)#513 |
| 41. | Franklin Park | 96 | 15,679(0.61%)#41 | 312,941(0.03%)#530 |
| 42. | Palatine | 94 | 15,679(0.60%)#42 | 312,941(0.03%)#538 |
| 43. | Joliet | 90 | 15,679(0.57%)#43 | 312,941(0.03%)#564 |
| 44. | Oak Park | 88 | 15,679(0.56%)#44 | 312,941(0.03%)#583 |
| 45. | Itasca | 88 | 15,679(0.56%)#45 | 312,941(0.03%)#588 |
| 46. | Roselle | 81 | 15,679(0.52%)#46 | 312,941(0.03%)#635 |
| 47. | Morton Grove | 78 | 15,679(0.50%)#47 | 312,941(0.02%)#663 |
| 48. | Wheeling | 76 | 15,679(0.48%)#48 | 312,941(0.02%)#675 |
| 49. | North Riverside | 75 | 15,679(0.48%)#49 | 312,941(0.02%)#695 |
| 50. | Chicago Heights | 72 | 15,679(0.46%)#50 | 312,941(0.02%)#715 |
| 51. | Deerfield | 72 | 15,679(0.46%)#51 | 312,941(0.02%)#716 |
| 52. | Evanston | 68 | 15,679(0.43%)#52 | 312,941(0.02%)#750 |
| 53. | Elgin | 67 | 15,679(0.43%)#53 | 312,941(0.02%)#763 |
| 54. | Lake Forest | 67 | 15,679(0.43%)#54 | 312,941(0.02%)#766 |
| 55. | Peoria | 65 | 15,679(0.41%)#55 | 312,941(0.02%)#785 |
| 56. | Brookfield | 64 | 15,679(0.41%)#56 | 312,941(0.02%)#801 |
| 57. | Palos Heights | 59 | 15,679(0.38%)#57 | 312,941(0.02%)#862 |
| 58. | Frankfort | 55 | 15,679(0.35%)#58 | 312,941(0.02%)#917 |
| 59. | Algonquin | 54 | 15,679(0.34%)#59 | 312,941(0.02%)#931 |
| 60. | Lombard | 52 | 15,679(0.33%)#60 | 312,941(0.02%)#952 |
| 61. | Evergreen Park | 51 | 15,679(0.33%)#61 | 312,941(0.02%)#980 |
| 62. | Worth | 51 | 15,679(0.33%)#62 | 312,941(0.02%)#987 |
| 63. | Alsip | 50 | 15,679(0.32%)#63 | 312,941(0.02%)#1,008 |
| 64. | Mount Morris | 49 | 15,679(0.31%)#64 | 312,941(0.02%)#1,024 |
| 65. | Glen Ellyn | 48 | 15,679(0.31%)#65 | 312,941(0.02%)#1,027 |
| 66. | Lake Zurich | 47 | 15,679(0.30%)#66 | 312,941(0.02%)#1,053 |
| 67. | Glenview | 46 | 15,679(0.29%)#67 | 312,941(0.01%)#1,067 |
| 68. | Wilmette | 46 | 15,679(0.29%)#68 | 312,941(0.01%)#1,070 |
| 69. | Glendale Heights | 45 | 15,679(0.29%)#69 | 312,941(0.01%)#1,085 |
| 70. | Manhattan | 45 | 15,679(0.29%)#70 | 312,941(0.01%)#1,094 |
| 71. | Oak Forest | 44 | 15,679(0.28%)#71 | 312,941(0.01%)#1,100 |
| 72. | Villa Park | 43 | 15,679(0.27%)#72 | 312,941(0.01%)#1,119 |
| 73. | Volo | 42 | 15,679(0.27%)#73 | 312,941(0.01%)#1,153 |
| 74. | Springfield | 41 | 15,679(0.26%)#74 | 312,941(0.01%)#1,161 |
| 75. | Palos Hills | 41 | 15,679(0.26%)#75 | 312,941(0.01%)#1,170 |
| 76. | Lake In The Hills | 40 | 15,679(0.26%)#76 | 312,941(0.01%)#1,182 |
| 77. | Crystal Lake | 38 | 15,679(0.24%)#77 | 312,941(0.01%)#1,235 |
| 78. | Oak Brook | 38 | 15,679(0.24%)#78 | 312,941(0.01%)#1,248 |
| 79. | Highwood | 38 | 15,679(0.24%)#79 | 312,941(0.01%)#1,251 |
| 80. | West Chicago | 35 | 15,679(0.22%)#80 | 312,941(0.01%)#1,314 |
| 81. | Vernon Hills | 34 | 15,679(0.22%)#81 | 312,941(0.01%)#1,330 |
| 82. | Westmont | 34 | 15,679(0.22%)#82 | 312,941(0.01%)#1,332 |
| 83. | Western Springs | 34 | 15,679(0.22%)#83 | 312,941(0.01%)#1,335 |
| 84. | Aurora | 32 | 15,679(0.20%)#84 | 312,941(0.01%)#1,373 |
| 85. | Bensenville | 31 | 15,679(0.20%)#85 | 312,941(0.01%)#1,427 |
| 86. | South Elgin | 30 | 15,679(0.19%)#86 | 312,941(0.01%)#1,459 |
| 87. | Cary | 30 | 15,679(0.19%)#87 | 312,941(0.01%)#1,461 |
| 88. | Hickory Hills | 30 | 15,679(0.19%)#88 | 312,941(0.01%)#1,463 |
| 89. | Waukegan | 29 | 15,679(0.18%)#89 | 312,941(0.01%)#1,483 |
| 90. | Hinsdale | 29 | 15,679(0.18%)#90 | 312,941(0.01%)#1,498 |
| 91. | Hampshire | 29 | 15,679(0.18%)#91 | 312,941(0.01%)#1,511 |
| 92. | Mundelein | 28 | 15,679(0.18%)#92 | 312,941(0.01%)#1,537 |
| 93. | Mokena | 28 | 15,679(0.18%)#93 | 312,941(0.01%)#1,543 |
| 94. | Northfield | 28 | 15,679(0.18%)#94 | 312,941(0.01%)#1,553 |
| 95. | Batavia | 27 | 15,679(0.17%)#95 | 312,941(0.01%)#1,566 |
| 96. | North Aurora | 27 | 15,679(0.17%)#96 | 312,941(0.01%)#1,573 |
| 97. | La Grange | 27 | 15,679(0.17%)#97 | 312,941(0.01%)#1,577 |
| 98. | Riverside | 27 | 15,679(0.17%)#98 | 312,941(0.01%)#1,582 |
| 99. | Machesney Park | 26 | 15,679(0.17%)#99 | 312,941(0.01%)#1,611 |
| 100. | Clarendon Hills | 26 | 15,679(0.17%)#100 | 312,941(0.01%)#1,625 |
Common Questions
What are the Top 10 Cities with the Most Immigrants from Italy in Illinois?
Top 10 Cities with the Most Immigrants from Italy in Illinois are:
#1
3,065
#2
728
#3
647
#4
395
#5
394
#6
327
#7
261
#8
232
#9
220
#10
213
What city has the Most Immigrants from Italy in Illinois?
Chicago has the Most Immigrants from Italy in Illinois with 3,065.
What is the Total Immigrants from Italy in the State of Illinois?
Total Immigrants from Italy in Illinois is 15,679.
What is the Total Immigrants from Italy in the United States?
Total Immigrants from Italy in the United States is 312,941.