Cities with the Highest Percentage of Bahamian Population in the United States
RELATED REPORTS & OPTIONS
Bahamian
United States
Compare Cities
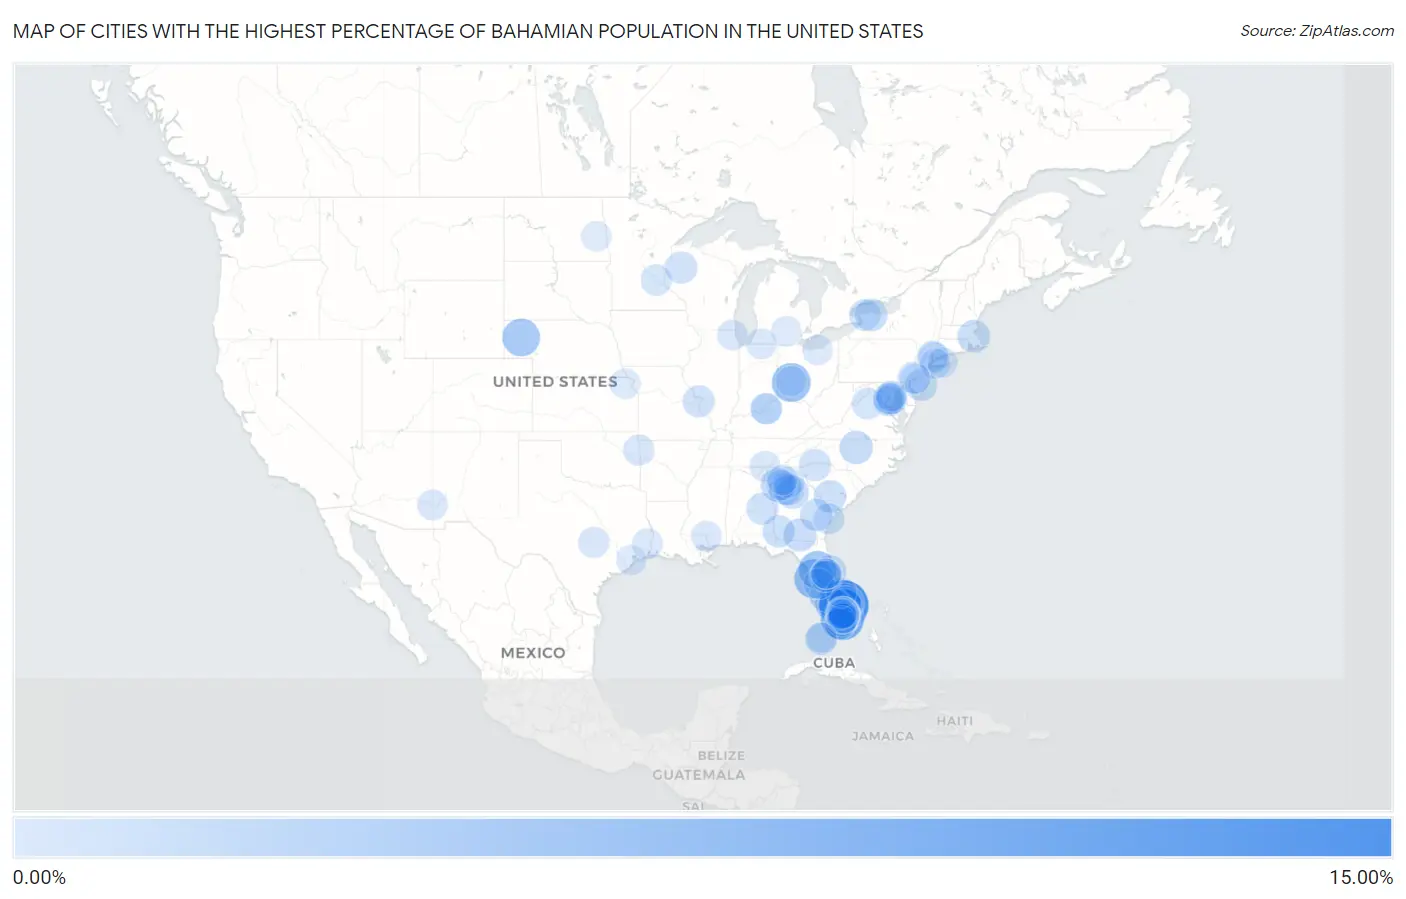
Map of Cities with the Highest Percentage of Bahamian Population in the United States
0.00%
15.00%
Cities with the Highest Percentage of Bahamian Population in the United States
| City | Bahamian | vs State | vs National | |
| 1. | Plantation Mobile Home Park | 10.78% | 0.15%(+10.6)#1 | 0.017%(+10.8)#1 |
| 2. | Drayton | 7.32% | 0.013%(+7.31)#1 | 0.017%(+7.30)#2 |
| 3. | Gladeview | 7.21% | 0.15%(+7.07)#2 | 0.017%(+7.19)#3 |
| 4. | Schall Circle | 5.97% | 0.15%(+5.82)#3 | 0.017%(+5.95)#4 |
| 5. | St Leo | 5.07% | 0.15%(+4.92)#4 | 0.017%(+5.05)#5 |
| 6. | Wilberforce | 4.89% | 0.0040%(+4.88)#1 | 0.017%(+4.87)#6 |
| 7. | Wildwood | 4.48% | 0.15%(+4.33)#5 | 0.017%(+4.46)#7 |
| 8. | Alliance | 4.34% | 0.020%(+4.32)#1 | 0.017%(+4.32)#8 |
| 9. | Boulevard Gardens | 4.14% | 0.15%(+4.00)#6 | 0.017%(+4.13)#9 |
| 10. | Mangonia Park | 3.74% | 0.15%(+3.60)#7 | 0.017%(+3.73)#10 |
| 11. | Broadview Park | 3.30% | 0.15%(+3.16)#8 | 0.017%(+3.29)#11 |
| 12. | Pembroke Park | 2.98% | 0.15%(+2.84)#9 | 0.017%(+2.97)#12 |
| 13. | Harlem | 2.64% | 0.15%(+2.49)#10 | 0.017%(+2.62)#13 |
| 14. | San Castle | 2.51% | 0.15%(+2.36)#11 | 0.017%(+2.49)#14 |
| 15. | Lake Placid | 2.26% | 0.15%(+2.11)#12 | 0.017%(+2.24)#15 |
| 16. | Westgate | 2.07% | 0.15%(+1.93)#13 | 0.017%(+2.06)#16 |
| 17. | Woodlawn | 2.01% | 0.0082%(+2.00)#1 | 0.017%(+1.99)#17 |
| 18. | Dallas | 1.98% | 0.048%(+1.93)#1 | 0.017%(+1.97)#18 |
| 19. | Moody Afb | 1.86% | 0.048%(+1.81)#2 | 0.017%(+1.84)#19 |
| 20. | Mansfield | 1.78% | 0.048%(+1.73)#3 | 0.017%(+1.76)#20 |
| 21. | Holbrook | 1.69% | 0.011%(+1.68)#1 | 0.017%(+1.68)#21 |
| 22. | Washington Park | 1.69% | 0.15%(+1.54)#14 | 0.017%(+1.67)#22 |
| 23. | West Park | 1.63% | 0.15%(+1.49)#15 | 0.017%(+1.61)#23 |
| 24. | Franklin Park | 1.63% | 0.15%(+1.48)#16 | 0.017%(+1.61)#24 |
| 25. | Geneva | 1.60% | 0.15%(+1.45)#17 | 0.017%(+1.58)#25 |
| 26. | Stock Island | 1.53% | 0.15%(+1.39)#18 | 0.017%(+1.52)#26 |
| 27. | Denmark | 1.52% | 0.013%(+1.51)#2 | 0.017%(+1.50)#27 |
| 28. | Miami Gardens | 1.51% | 0.15%(+1.37)#19 | 0.017%(+1.50)#28 |
| 29. | Albion | 1.51% | 0.013%(+1.50)#1 | 0.017%(+1.49)#29 |
| 30. | Collins | 1.51% | 0.048%(+1.46)#4 | 0.017%(+1.49)#30 |
| 31. | Colquitt | 1.50% | 0.048%(+1.45)#5 | 0.017%(+1.48)#31 |
| 32. | Belvedere Park | 1.50% | 0.048%(+1.45)#6 | 0.017%(+1.48)#32 |
| 33. | Andrews Afb | 1.48% | 0.014%(+1.47)#1 | 0.017%(+1.47)#33 |
| 34. | Opa Locka | 1.47% | 0.15%(+1.33)#20 | 0.017%(+1.46)#34 |
| 35. | Naranja | 1.42% | 0.15%(+1.27)#21 | 0.017%(+1.40)#35 |
| 36. | Elwood | 1.41% | 0.011%(+1.40)#1 | 0.017%(+1.40)#36 |
| 37. | South Bay | 1.41% | 0.15%(+1.26)#22 | 0.017%(+1.39)#37 |
| 38. | Campobello | 1.39% | 0.013%(+1.37)#3 | 0.017%(+1.37)#38 |
| 39. | Birchwood | 1.38% | 0.0025%(+1.38)#1 | 0.017%(+1.37)#39 |
| 40. | Riviera Beach | 1.34% | 0.15%(+1.19)#23 | 0.017%(+1.32)#40 |
| 41. | Greendale | 1.32% | 0.0039%(+1.32)#1 | 0.017%(+1.30)#41 |
| 42. | Pinewood | 1.32% | 0.15%(+1.17)#24 | 0.017%(+1.30)#42 |
| 43. | Tallassee | 1.31% | 0.0078%(+1.31)#1 | 0.017%(+1.30)#43 |
| 44. | Tamarac | 1.28% | 0.15%(+1.13)#25 | 0.017%(+1.26)#44 |
| 45. | Penn Wynne | 1.27% | 0.0066%(+1.27)#1 | 0.017%(+1.26)#45 |
| 46. | Dania Beach | 1.25% | 0.15%(+1.10)#26 | 0.017%(+1.23)#46 |
| 47. | Newfane | 1.14% | 0.013%(+1.13)#2 | 0.017%(+1.13)#47 |
| 48. | Bay Hill | 1.10% | 0.15%(+0.954)#27 | 0.017%(+1.08)#48 |
| 49. | Stanley | 1.05% | 0.012%(+1.04)#1 | 0.017%(+1.03)#49 |
| 50. | Oak Ridge | 1.03% | 0.15%(+0.887)#28 | 0.017%(+1.02)#50 |
| 51. | El Portal | 1.00% | 0.15%(+0.851)#29 | 0.017%(+0.981)#51 |
| 52. | Lauderhill | 1.00% | 0.15%(+0.851)#30 | 0.017%(+0.980)#52 |
| 53. | Georgetown | 0.98% | 0.048%(+0.937)#7 | 0.017%(+0.968)#53 |
| 54. | Glenview Manor | 0.97% | 0.0058%(+0.965)#1 | 0.017%(+0.954)#54 |
| 55. | Robbinsdale | 0.95% | 0.011%(+0.944)#1 | 0.017%(+0.938)#55 |
| 56. | Conyers | 0.95% | 0.048%(+0.906)#8 | 0.017%(+0.936)#56 |
| 57. | North Miami Beach | 0.95% | 0.15%(+0.799)#31 | 0.017%(+0.928)#57 |
| 58. | Temple Hills | 0.91% | 0.014%(+0.900)#2 | 0.017%(+0.897)#58 |
| 59. | Westville | 0.90% | 0.0068%(+0.890)#1 | 0.017%(+0.880)#59 |
| 60. | Brushy Creek | 0.88% | 0.012%(+0.864)#1 | 0.017%(+0.858)#60 |
| 61. | Hollywood | 0.84% | 0.15%(+0.689)#32 | 0.017%(+0.819)#61 |
| 62. | North Miami | 0.80% | 0.15%(+0.650)#33 | 0.017%(+0.780)#62 |
| 63. | Elmsford | 0.79% | 0.013%(+0.777)#3 | 0.017%(+0.773)#63 |
| 64. | Golden Glades | 0.77% | 0.15%(+0.622)#34 | 0.017%(+0.752)#64 |
| 65. | Highland City | 0.76% | 0.15%(+0.616)#35 | 0.017%(+0.746)#65 |
| 66. | Suwanee | 0.74% | 0.048%(+0.696)#9 | 0.017%(+0.727)#66 |
| 67. | Accokeek | 0.74% | 0.014%(+0.723)#3 | 0.017%(+0.720)#67 |
| 68. | South Nyack | 0.73% | 0.013%(+0.716)#4 | 0.017%(+0.711)#68 |
| 69. | Manor Creek | 0.73% | 0.0058%(+0.721)#2 | 0.017%(+0.710)#69 |
| 70. | Kimball | 0.70% | 0.0058%(+0.690)#1 | 0.017%(+0.678)#70 |
| 71. | Westphalia | 0.69% | 0.014%(+0.679)#4 | 0.017%(+0.676)#71 |
| 72. | Homestead | 0.69% | 0.15%(+0.545)#36 | 0.017%(+0.674)#72 |
| 73. | Duncan | 0.68% | 0.0048%(+0.678)#1 | 0.017%(+0.665)#73 |
| 74. | Oakland Park | 0.68% | 0.15%(+0.532)#37 | 0.017%(+0.662)#74 |
| 75. | South Floral Park | 0.67% | 0.013%(+0.662)#5 | 0.017%(+0.657)#75 |
| 76. | Gloucester City | 0.67% | 0.011%(+0.663)#2 | 0.017%(+0.656)#76 |
| 77. | Long Grove | 0.65% | 0.0034%(+0.649)#1 | 0.017%(+0.635)#77 |
| 78. | Liberty Triangle | 0.65% | 0.15%(+0.502)#38 | 0.017%(+0.632)#78 |
| 79. | Pembroke Pines | 0.65% | 0.15%(+0.502)#39 | 0.017%(+0.631)#79 |
| 80. | Mitchellville | 0.64% | 0.014%(+0.630)#5 | 0.017%(+0.627)#80 |
| 81. | Marietta | 0.64% | 0.048%(+0.591)#10 | 0.017%(+0.621)#81 |
| 82. | Buna | 0.63% | 0.012%(+0.617)#2 | 0.017%(+0.612)#82 |
| 83. | Varnado | 0.61% | 0.0037%(+0.606)#1 | 0.017%(+0.593)#83 |
| 84. | Simonton Lake | 0.60% | 0.0052%(+0.591)#1 | 0.017%(+0.579)#84 |
| 85. | Fort Lauderdale | 0.59% | 0.15%(+0.444)#40 | 0.017%(+0.574)#85 |
| 86. | North Bay Shore | 0.58% | 0.013%(+0.569)#6 | 0.017%(+0.565)#86 |
| 87. | Brownsville | 0.58% | 0.15%(+0.432)#41 | 0.017%(+0.561)#87 |
| 88. | Canton | 0.57% | 0.048%(+0.526)#11 | 0.017%(+0.556)#88 |
| 89. | Stockbridge | 0.56% | 0.0070%(+0.549)#1 | 0.017%(+0.539)#89 |
| 90. | Fort Pierce | 0.56% | 0.15%(+0.409)#42 | 0.017%(+0.538)#90 |
| 91. | Richmond Heights | 0.55% | 0.15%(+0.401)#43 | 0.017%(+0.530)#91 |
| 92. | Avon | 0.54% | 0.0040%(+0.536)#2 | 0.017%(+0.523)#92 |
| 93. | Key West | 0.54% | 0.15%(+0.390)#44 | 0.017%(+0.520)#93 |
| 94. | Sunrise | 0.53% | 0.15%(+0.385)#45 | 0.017%(+0.514)#94 |
| 95. | Horton | 0.53% | 0.00095%(+0.527)#1 | 0.017%(+0.511)#95 |
| 96. | Fairview Shores | 0.53% | 0.15%(+0.380)#46 | 0.017%(+0.510)#96 |
| 97. | Fern Park | 0.52% | 0.15%(+0.377)#47 | 0.017%(+0.507)#97 |
| 98. | Page | 0.52% | 0.0033%(+0.515)#1 | 0.017%(+0.501)#98 |
| 99. | Cedarville | 0.51% | 0.0040%(+0.507)#3 | 0.017%(+0.494)#99 |
| 100. | League City | 0.50% | 0.012%(+0.493)#3 | 0.017%(+0.487)#100 |
Common Questions
What are the Top 10 Cities with the Highest Percentage of Bahamian Population in the United States?
Top 10 Cities with the Highest Percentage of Bahamian Population in the United States are:
#1
10.78%
#2
7.21%
#3
5.97%
#4
5.07%
#5
4.89%
#6
4.48%
#7
4.34%
#8
4.14%
#9
3.74%
#10
3.30%
What city has the Highest Percentage of Bahamian Population in the United States?
Plantation Mobile Home Park has the Highest Percentage of Bahamian Population in the United States with 10.78%.
What is the Percentage of Bahamian Population in the United States?
Percentage of Bahamian Population in the United States is 0.017%.