Cities with the Most Immigrants from Thailand in Massachusetts
RELATED REPORTS & OPTIONS
Thailand
Massachusetts
Compare Cities
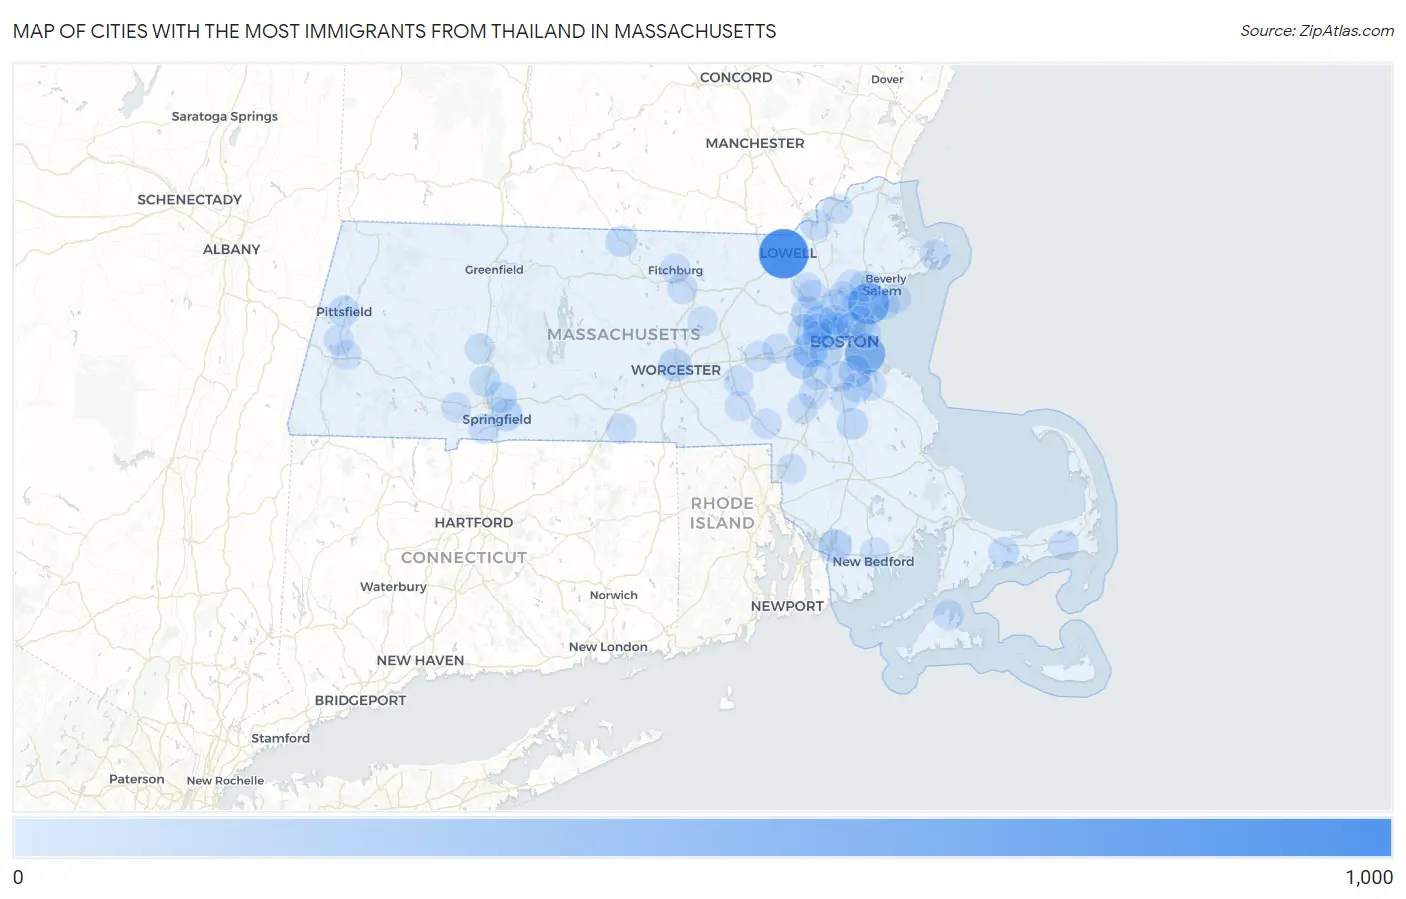
Map of Cities with the Most Immigrants from Thailand in Massachusetts
0
1,000
Cities with the Most Immigrants from Thailand in Massachusetts
| City | Thailand | vs State | vs National | |
| 1. | Lowell | 871 | 5,553(15.69%)#1 | 256,546(0.34%)#34 |
| 2. | Lynn | 496 | 5,553(8.93%)#2 | 256,546(0.19%)#64 |
| 3. | Boston | 456 | 5,553(8.21%)#3 | 256,546(0.18%)#71 |
| 4. | Newton | 200 | 5,553(3.60%)#4 | 256,546(0.08%)#188 |
| 5. | Arlington | 162 | 5,553(2.92%)#5 | 256,546(0.06%)#243 |
| 6. | Fall River | 149 | 5,553(2.68%)#6 | 256,546(0.06%)#266 |
| 7. | Needham | 133 | 5,553(2.40%)#7 | 256,546(0.05%)#301 |
| 8. | Brookline | 128 | 5,553(2.31%)#8 | 256,546(0.05%)#314 |
| 9. | Cambridge | 126 | 5,553(2.27%)#9 | 256,546(0.05%)#323 |
| 10. | Worcester | 116 | 5,553(2.09%)#10 | 256,546(0.05%)#359 |
| 11. | Quincy | 106 | 5,553(1.91%)#11 | 256,546(0.04%)#397 |
| 12. | Lexington | 105 | 5,553(1.89%)#12 | 256,546(0.04%)#410 |
| 13. | Springfield | 104 | 5,553(1.87%)#13 | 256,546(0.04%)#413 |
| 14. | Somerville | 85 | 5,553(1.53%)#14 | 256,546(0.03%)#505 |
| 15. | Brockton | 70 | 5,553(1.26%)#15 | 256,546(0.03%)#602 |
| 16. | Stoneham | 68 | 5,553(1.22%)#16 | 256,546(0.03%)#618 |
| 17. | Waltham | 66 | 5,553(1.19%)#17 | 256,546(0.03%)#639 |
| 18. | Peabody | 63 | 5,553(1.13%)#18 | 256,546(0.02%)#666 |
| 19. | Chicopee | 56 | 5,553(1.01%)#19 | 256,546(0.02%)#755 |
| 20. | Winchendon | 55 | 5,553(0.99%)#20 | 256,546(0.02%)#771 |
| 21. | Pittsfield | 54 | 5,553(0.97%)#21 | 256,546(0.02%)#780 |
| 22. | Methuen Town | 50 | 5,553(0.90%)#22 | 256,546(0.02%)#835 |
| 23. | Holyoke | 44 | 5,553(0.79%)#23 | 256,546(0.02%)#916 |
| 24. | Barnstable Town | 43 | 5,553(0.77%)#24 | 256,546(0.02%)#932 |
| 25. | Everett | 38 | 5,553(0.68%)#25 | 256,546(0.01%)#1,024 |
| 26. | Revere | 33 | 5,553(0.59%)#26 | 256,546(0.01%)#1,124 |
| 27. | Weymouth Town | 32 | 5,553(0.58%)#27 | 256,546(0.01%)#1,148 |
| 28. | Gloucester | 31 | 5,553(0.56%)#28 | 256,546(0.01%)#1,176 |
| 29. | Northampton | 26 | 5,553(0.47%)#29 | 256,546(0.01%)#1,323 |
| 30. | Burlington | 26 | 5,553(0.47%)#30 | 256,546(0.01%)#1,324 |
| 31. | North Attleborough | 25 | 5,553(0.45%)#31 | 256,546(0.01%)#1,356 |
| 32. | Agawam Town | 25 | 5,553(0.45%)#32 | 256,546(0.01%)#1,358 |
| 33. | Amherst | 24 | 5,553(0.43%)#33 | 256,546(0.01%)#1,392 |
| 34. | Southbridge Town | 24 | 5,553(0.43%)#34 | 256,546(0.01%)#1,398 |
| 35. | Leominster | 23 | 5,553(0.41%)#35 | 256,546(0.01%)#1,422 |
| 36. | Watertown Town | 23 | 5,553(0.41%)#36 | 256,546(0.01%)#1,426 |
| 37. | Vineyard Haven | 21 | 5,553(0.38%)#37 | 256,546(0.01%)#1,530 |
| 38. | Norwood | 20 | 5,553(0.36%)#38 | 256,546(0.01%)#1,543 |
| 39. | Walpole | 19 | 5,553(0.34%)#39 | 256,546(0.01%)#1,613 |
| 40. | Franklin Town | 18 | 5,553(0.32%)#40 | 256,546(0.01%)#1,636 |
| 41. | Lynnfield | 18 | 5,553(0.32%)#41 | 256,546(0.01%)#1,648 |
| 42. | Milford | 17 | 5,553(0.31%)#42 | 256,546(0.01%)#1,681 |
| 43. | Haverhill | 16 | 5,553(0.29%)#43 | 256,546(0.01%)#1,727 |
| 44. | Milton | 15 | 5,553(0.27%)#44 | 256,546(0.01%)#1,788 |
| 45. | Dedham | 15 | 5,553(0.27%)#45 | 256,546(0.01%)#1,791 |
| 46. | Framingham | 14 | 5,553(0.25%)#46 | 256,546(0.01%)#1,836 |
| 47. | Westfield | 14 | 5,553(0.25%)#47 | 256,546(0.01%)#1,842 |
| 48. | Saugus | 14 | 5,553(0.25%)#48 | 256,546(0.01%)#1,849 |
| 49. | Wakefield | 14 | 5,553(0.25%)#49 | 256,546(0.01%)#1,850 |
| 50. | Chelsea | 13 | 5,553(0.23%)#50 | 256,546(0.01%)#1,904 |
| 51. | Belmont | 13 | 5,553(0.23%)#51 | 256,546(0.01%)#1,908 |
| 52. | Lenox | 13 | 5,553(0.23%)#52 | 256,546(0.01%)#1,959 |
| 53. | Northwest Harwich | 11 | 5,553(0.20%)#53 | 256,546(0.00%)#2,089 |
| 54. | Fitchburg | 9 | 5,553(0.16%)#54 | 256,546(0.00%)#2,199 |
| 55. | Winthrop Town | 9 | 5,553(0.16%)#55 | 256,546(0.00%)#2,224 |
| 56. | Cochituate | 9 | 5,553(0.16%)#56 | 256,546(0.00%)#2,246 |
| 57. | Pinehurst | 9 | 5,553(0.16%)#57 | 256,546(0.00%)#2,249 |
| 58. | Hopkinton | 9 | 5,553(0.16%)#58 | 256,546(0.00%)#2,261 |
| 59. | Braintree Town | 8 | 5,553(0.14%)#59 | 256,546(0.00%)#2,292 |
| 60. | New Bedford | 6 | 5,553(0.11%)#60 | 256,546(0.00%)#2,453 |
| 61. | Marblehead | 6 | 5,553(0.11%)#61 | 256,546(0.00%)#2,478 |
| 62. | Clinton | 6 | 5,553(0.11%)#62 | 256,546(0.00%)#2,504 |
| 63. | Medford | 5 | 5,553(0.09%)#63 | 256,546(0.00%)#2,560 |
| 64. | Attleboro | 5 | 5,553(0.09%)#64 | 256,546(0.00%)#2,562 |
| 65. | Swampscott | 5 | 5,553(0.09%)#65 | 256,546(0.00%)#2,581 |
| 66. | Randolph Town | 4 | 5,553(0.07%)#66 | 256,546(0.00%)#2,643 |
| 67. | Lee | 1 | 5,553(0.02%)#67 | 256,546(0.00%)#2,940 |
Common Questions
What are the Top 10 Cities with the Most Immigrants from Thailand in Massachusetts?
Top 10 Cities with the Most Immigrants from Thailand in Massachusetts are:
What city has the Most Immigrants from Thailand in Massachusetts?
Lowell has the Most Immigrants from Thailand in Massachusetts with 871.
What is the Total Immigrants from Thailand in the State of Massachusetts?
Total Immigrants from Thailand in Massachusetts is 5,553.
What is the Total Immigrants from Thailand in the United States?
Total Immigrants from Thailand in the United States is 256,546.