Cities with the Highest Percentage of Households With Two or more Vehicles in Rhode Island
RELATED REPORTS & OPTIONS
Households with 2 or more Cars
Rhode Island
Compare Cities
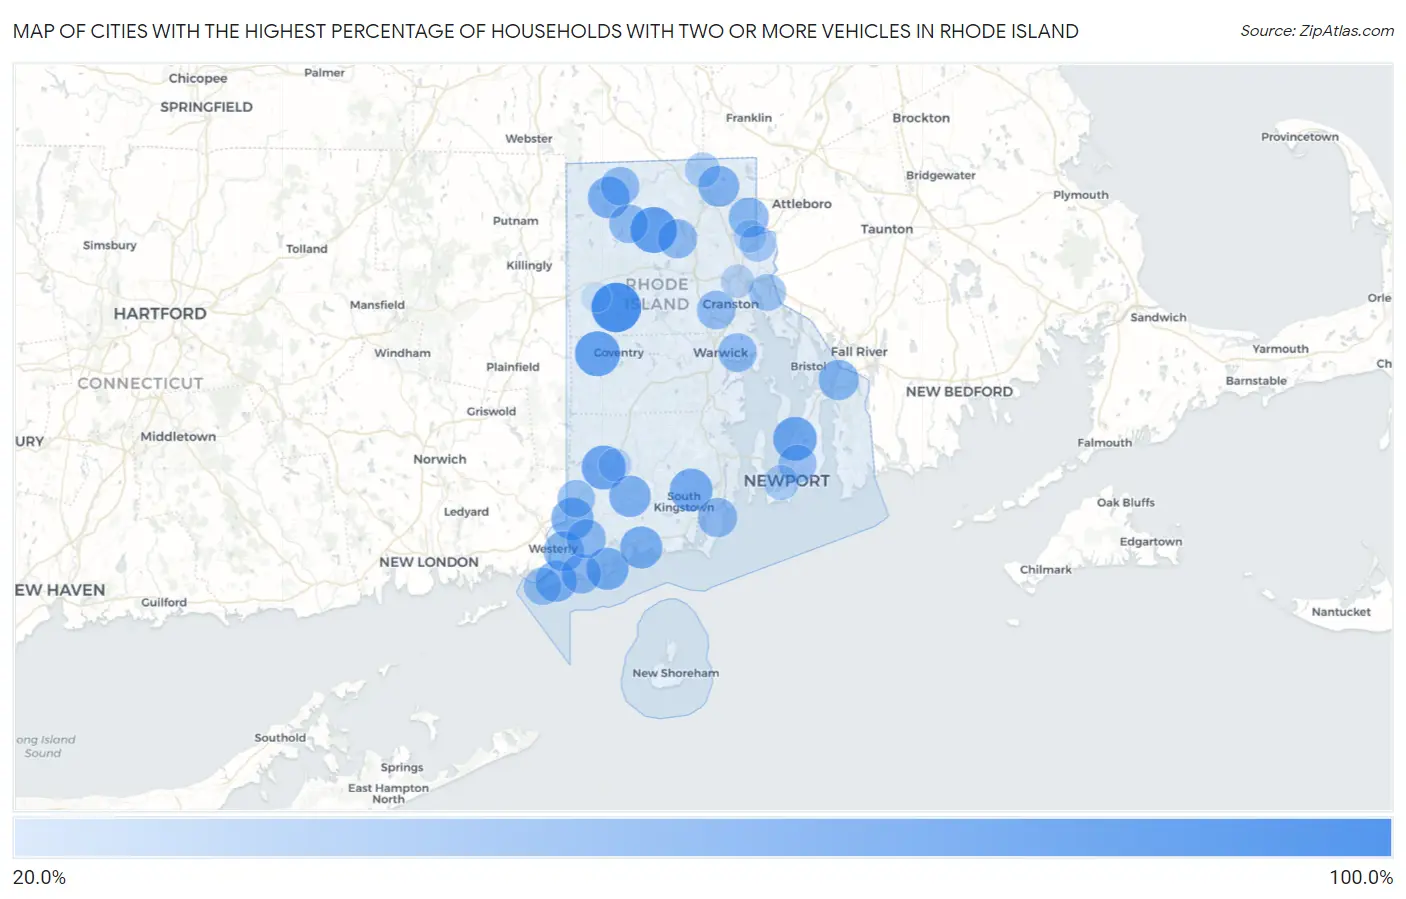
Map of Cities with the Highest Percentage of Households With Two or more Vehicles in Rhode Island
0.0%
100.0%
Cities with the Highest Percentage of Households With Two or more Vehicles in Rhode Island
| City | Housholds With 2+ Cars | vs State | vs National | |
| 1. | Clayville | 100.0% | 55.1%(+44.9)#1 | 59.1%(+40.9)#513 |
| 2. | Harmony | 86.7% | 55.1%(+31.6)#2 | 59.1%(+27.6)#2,825 |
| 3. | Greene | 82.4% | 55.1%(+27.3)#3 | 59.1%(+23.3)#4,173 |
| 4. | Hope Valley | 78.4% | 55.1%(+23.3)#4 | 59.1%(+19.3)#6,001 |
| 5. | Melville | 77.0% | 55.1%(+21.9)#5 | 59.1%(+17.9)#6,736 |
| 6. | Kingston | 73.3% | 55.1%(+18.2)#6 | 59.1%(+14.2)#8,939 |
| 7. | Ashaway | 71.3% | 55.1%(+16.2)#7 | 59.1%(+12.2)#10,312 |
| 8. | Quonochontaug | 71.3% | 55.1%(+16.2)#8 | 59.1%(+12.2)#10,342 |
| 9. | Charlestown | 71.0% | 55.1%(+15.9)#9 | 59.1%(+11.9)#10,505 |
| 10. | Pascoag | 69.2% | 55.1%(+14.1)#10 | 59.1%(+10.1)#11,797 |
| 11. | Carolina | 68.6% | 55.1%(+13.5)#11 | 59.1%(+9.50)#12,240 |
| 12. | Misquamicut | 66.8% | 55.1%(+11.7)#12 | 59.1%(+7.70)#13,594 |
| 13. | Cumberland Hill | 66.2% | 55.1%(+11.1)#13 | 59.1%(+7.10)#14,080 |
| 14. | Westerly | 63.4% | 55.1%(+8.30)#14 | 59.1%(+4.30)#16,089 |
| 15. | Tiverton | 63.1% | 55.1%(+8.00)#15 | 59.1%(+4.00)#16,324 |
| 16. | Valley Falls | 62.2% | 55.1%(+7.10)#16 | 59.1%(+3.10)#16,967 |
| 17. | Weekapaug | 61.1% | 55.1%(+6.00)#17 | 59.1%(+2.00)#17,875 |
| 18. | Narragansett Pier | 59.6% | 55.1%(+4.50)#18 | 59.1%(+0.500)#18,976 |
| 19. | Bradford | 59.6% | 55.1%(+4.50)#19 | 59.1%(+0.500)#18,985 |
| 20. | Greenville | 59.4% | 55.1%(+4.30)#20 | 59.1%(+0.300)#19,091 |
| 21. | Chepachet | 58.2% | 55.1%(+3.10)#21 | 59.1%(-0.900)#20,028 |
| 22. | Warwick | 57.2% | 55.1%(+2.10)#22 | 59.1%(-1.90)#20,735 |
| 23. | Cranston | 57.0% | 55.1%(+1.90)#23 | 59.1%(-2.10)#20,861 |
| 24. | Harrisville | 56.9% | 55.1%(+1.80)#24 | 59.1%(-2.20)#20,965 |
| 25. | Wakefield-Peace Dale | 56.5% | 55.1%(+1.40)#25 | 59.1%(-2.60)#21,234 |
| 26. | Newport East | 54.8% | 55.1%(-0.300)#26 | 59.1%(-4.30)#22,417 |
| 27. | Watch Hill | 53.0% | 55.1%(-2.10)#27 | 59.1%(-6.10)#23,583 |
| 28. | Hopkinton | 52.9% | 55.1%(-2.20)#28 | 59.1%(-6.20)#23,646 |
| 29. | East Providence | 50.7% | 55.1%(-4.40)#29 | 59.1%(-8.40)#24,826 |
| 30. | Pawtucket | 46.5% | 55.1%(-8.60)#30 | 59.1%(-12.6)#26,847 |
| 31. | Woonsocket | 43.7% | 55.1%(-11.4)#31 | 59.1%(-15.4)#27,836 |
| 32. | Newport | 42.9% | 55.1%(-12.2)#32 | 59.1%(-16.2)#28,059 |
| 33. | Providence | 37.1% | 55.1%(-18.0)#33 | 59.1%(-22.0)#29,419 |
| 34. | Wyoming | 36.1% | 55.1%(-19.0)#34 | 59.1%(-23.0)#29,600 |
| 35. | Central Falls | 35.2% | 55.1%(-19.9)#35 | 59.1%(-23.9)#29,730 |
| 36. | Foster Center | 24.1% | 55.1%(-31.0)#36 | 59.1%(-35.0)#30,712 |
1
Common Questions
What are the Top 10 Cities with the Highest Percentage of Households With Two or more Vehicles in Rhode Island?
Top 10 Cities with the Highest Percentage of Households With Two or more Vehicles in Rhode Island are:
#1
100.0%
#2
86.7%
#3
82.4%
#4
78.4%
#5
77.0%
#6
73.3%
#7
71.3%
#8
71.3%
#9
71.0%
#10
69.2%
What city has the Highest Percentage of Households With Two or more Vehicles in Rhode Island?
Clayville has the Highest Percentage of Households With Two or more Vehicles in Rhode Island with 100.0%.
What is the Percentage of Households With Two or more Vehicles in the State of Rhode Island?
Percentage of Households With Two or more Vehicles in Rhode Island is 55.1%.
What is the Percentage of Households With Two or more Vehicles in the United States?
Percentage of Households With Two or more Vehicles in the United States is 59.1%.