Cities with the Highest Percentage of Households With Two or more Vehicles in Tennessee
RELATED REPORTS & OPTIONS
Households with 2 or more Cars
Tennessee
Compare Cities
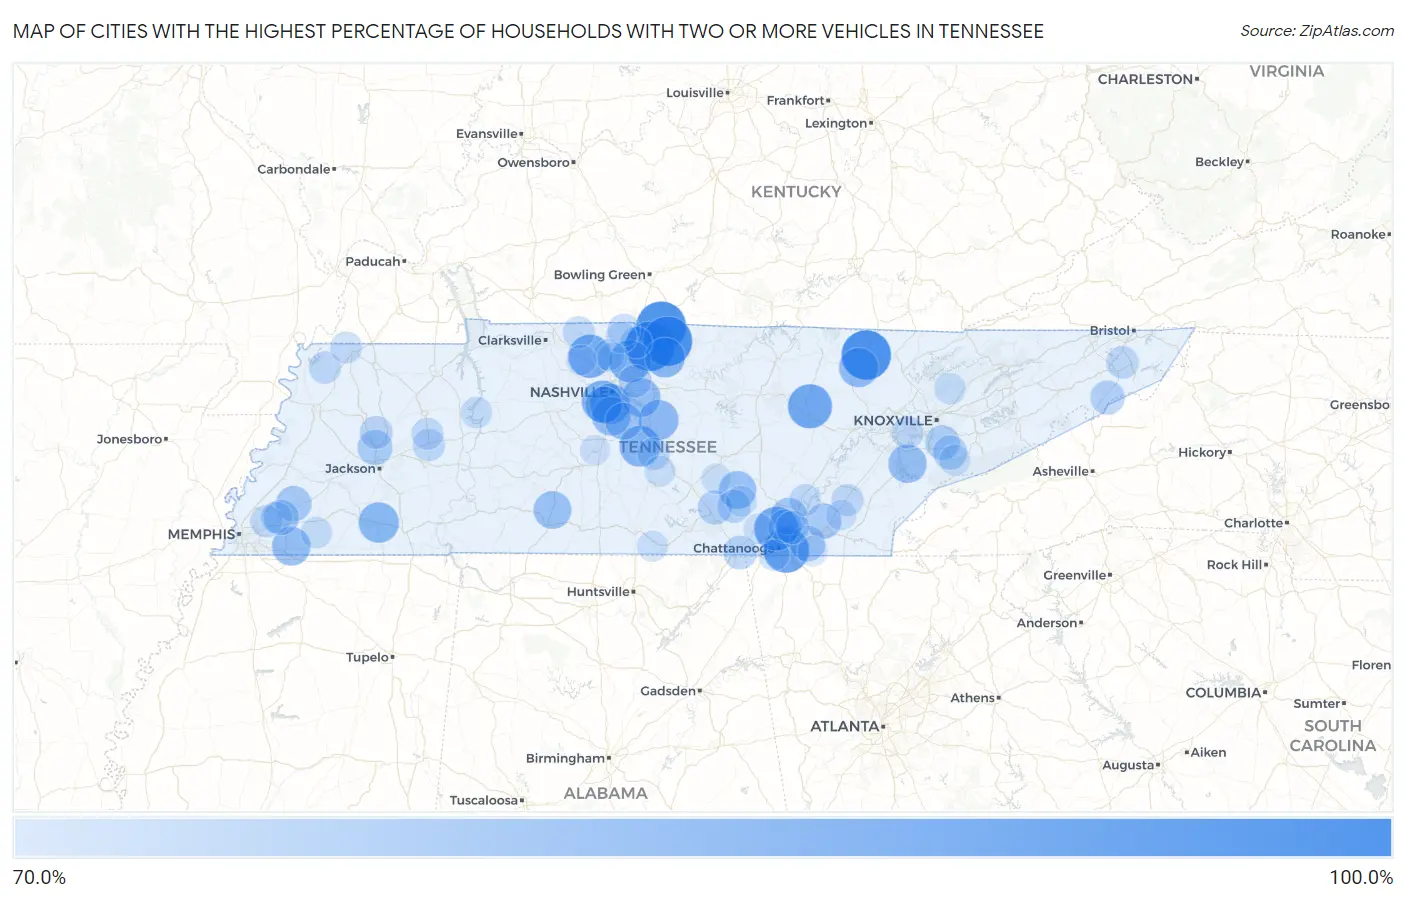
Map of Cities with the Highest Percentage of Households With Two or more Vehicles in Tennessee
0.0%
100.0%
Cities with the Highest Percentage of Households With Two or more Vehicles in Tennessee
| City | Housholds With 2+ Cars | vs State | vs National | |
| 1. | Kahite | 100.0% | 64.1%(+35.9)#1 | 59.1%(+40.9)#59 |
| 2. | Lenox | 100.0% | 64.1%(+35.9)#2 | 59.1%(+40.9)#60 |
| 3. | Beech Bluff | 100.0% | 64.1%(+35.9)#3 | 59.1%(+40.9)#72 |
| 4. | Norene | 100.0% | 64.1%(+35.9)#5 | 59.1%(+40.9)#163 |
| 5. | Fairfield | 100.0% | 64.1%(+35.9)#6 | 59.1%(+40.9)#164 |
| 6. | Ocoee | 100.0% | 64.1%(+35.9)#7 | 59.1%(+40.9)#227 |
| 7. | Conasauga | 100.0% | 64.1%(+35.9)#8 | 59.1%(+40.9)#313 |
| 8. | Luray | 100.0% | 64.1%(+35.9)#9 | 59.1%(+40.9)#376 |
| 9. | Graball | 100.0% | 64.1%(+35.9)#10 | 59.1%(+40.9)#377 |
| 10. | Helenwood | 100.0% | 64.1%(+35.9)#11 | 59.1%(+40.9)#382 |
| 11. | Bransford | 100.0% | 64.1%(+35.9)#12 | 59.1%(+40.9)#409 |
| 12. | Greenvale | 100.0% | 64.1%(+35.9)#13 | 59.1%(+40.9)#449 |
| 13. | Belvidere | 100.0% | 64.1%(+35.9)#14 | 59.1%(+40.9)#657 |
| 14. | Childers Hill | 100.0% | 64.1%(+35.9)#15 | 59.1%(+40.9)#1,052 |
| 15. | Whitlock | 100.0% | 64.1%(+35.9)#16 | 59.1%(+40.9)#1,078 |
| 16. | Wynnburg | 100.0% | 64.1%(+35.9)#17 | 59.1%(+40.9)#1,113 |
| 17. | Gladeville | 96.3% | 64.1%(+32.2)#18 | 59.1%(+37.2)#1,338 |
| 18. | Hilham | 96.2% | 64.1%(+32.1)#19 | 59.1%(+37.1)#1,347 |
| 19. | Ridgeside | 95.1% | 64.1%(+31.0)#20 | 59.1%(+36.0)#1,424 |
| 20. | Palmersville | 94.1% | 64.1%(+30.0)#21 | 59.1%(+35.0)#1,511 |
| 21. | Bowman | 93.4% | 64.1%(+29.3)#22 | 59.1%(+34.3)#1,588 |
| 22. | Fairmount | 93.3% | 64.1%(+29.2)#23 | 59.1%(+34.2)#1,594 |
| 23. | Coopertown | 92.4% | 64.1%(+28.3)#24 | 59.1%(+33.3)#1,718 |
| 24. | Statesville | 91.4% | 64.1%(+27.3)#25 | 59.1%(+32.3)#1,863 |
| 25. | Shackle Island | 90.8% | 64.1%(+26.7)#26 | 59.1%(+31.7)#1,949 |
| 26. | Belle Meade | 90.4% | 64.1%(+26.3)#27 | 59.1%(+31.3)#2,007 |
| 27. | Rockvale | 89.4% | 64.1%(+25.3)#28 | 59.1%(+30.3)#2,193 |
| 28. | Oak Hill | 89.0% | 64.1%(+24.9)#29 | 59.1%(+29.9)#2,272 |
| 29. | Whiteside | 89.0% | 64.1%(+24.9)#30 | 59.1%(+29.9)#2,282 |
| 30. | Hornsby | 88.8% | 64.1%(+24.7)#31 | 59.1%(+29.7)#2,333 |
| 31. | Castalian Springs | 88.3% | 64.1%(+24.2)#32 | 59.1%(+29.2)#2,421 |
| 32. | Griffith Creek | 88.3% | 64.1%(+24.2)#33 | 59.1%(+29.2)#2,424 |
| 33. | Walterhill | 88.1% | 64.1%(+24.0)#34 | 59.1%(+29.0)#2,482 |
| 34. | Elgin | 87.8% | 64.1%(+23.7)#35 | 59.1%(+28.7)#2,557 |
| 35. | Rural Hill | 86.9% | 64.1%(+22.8)#36 | 59.1%(+27.8)#2,765 |
| 36. | Brentwood | 86.7% | 64.1%(+22.6)#37 | 59.1%(+27.6)#2,817 |
| 37. | Piperton | 86.7% | 64.1%(+22.6)#38 | 59.1%(+27.6)#2,822 |
| 38. | Greenback | 86.5% | 64.1%(+22.4)#39 | 59.1%(+27.4)#2,873 |
| 39. | Bon Air | 86.1% | 64.1%(+22.0)#40 | 59.1%(+27.0)#2,994 |
| 40. | Delano | 86.0% | 64.1%(+21.9)#41 | 59.1%(+26.9)#3,023 |
| 41. | Ethridge | 85.8% | 64.1%(+21.7)#42 | 59.1%(+26.7)#3,074 |
| 42. | Beersheba Springs | 85.6% | 64.1%(+21.5)#43 | 59.1%(+26.5)#3,141 |
| 43. | Forest Hills | 85.0% | 64.1%(+20.9)#44 | 59.1%(+25.9)#3,289 |
| 44. | Nolensville | 84.9% | 64.1%(+20.8)#45 | 59.1%(+25.8)#3,321 |
| 45. | Mowbray Mountain | 84.7% | 64.1%(+20.6)#46 | 59.1%(+25.6)#3,384 |
| 46. | Chewalla | 83.4% | 64.1%(+19.3)#47 | 59.1%(+24.3)#3,835 |
| 47. | Lynchburg | 83.3% | 64.1%(+19.2)#48 | 59.1%(+24.2)#3,843 |
| 48. | Shiloh | 83.3% | 64.1%(+19.2)#49 | 59.1%(+24.2)#3,878 |
| 49. | Braden | 83.2% | 64.1%(+19.1)#50 | 59.1%(+24.1)#3,916 |
| 50. | Ooltewah | 82.9% | 64.1%(+18.8)#51 | 59.1%(+23.8)#4,019 |
| 51. | Arlington | 82.8% | 64.1%(+18.7)#52 | 59.1%(+23.7)#4,029 |
| 52. | Hopewell | 82.8% | 64.1%(+18.7)#53 | 59.1%(+23.7)#4,042 |
| 53. | Three Way | 82.5% | 64.1%(+18.4)#54 | 59.1%(+23.4)#4,140 |
| 54. | Sequatchie | 82.5% | 64.1%(+18.4)#55 | 59.1%(+23.4)#4,152 |
| 55. | Wildwood | 81.8% | 64.1%(+17.7)#56 | 59.1%(+22.7)#4,429 |
| 56. | Walland | 81.5% | 64.1%(+17.4)#57 | 59.1%(+22.4)#4,583 |
| 57. | Pelham | 81.5% | 64.1%(+17.4)#58 | 59.1%(+22.4)#4,584 |
| 58. | Banner Hill | 81.4% | 64.1%(+17.3)#59 | 59.1%(+22.3)#4,610 |
| 59. | Huron | 81.3% | 64.1%(+17.2)#60 | 59.1%(+22.2)#4,669 |
| 60. | New Hope | 81.0% | 64.1%(+16.9)#61 | 59.1%(+21.9)#4,769 |
| 61. | Falling Water | 80.9% | 64.1%(+16.8)#62 | 59.1%(+21.8)#4,805 |
| 62. | Middle Valley | 80.4% | 64.1%(+16.3)#63 | 59.1%(+21.3)#5,014 |
| 63. | Karns | 80.3% | 64.1%(+16.2)#64 | 59.1%(+21.2)#5,063 |
| 64. | Coalmont | 80.3% | 64.1%(+16.2)#65 | 59.1%(+21.2)#5,079 |
| 65. | Mcdonald | 80.3% | 64.1%(+16.2)#66 | 59.1%(+21.2)#5,081 |
| 66. | Gibson | 80.1% | 64.1%(+16.0)#67 | 59.1%(+21.0)#5,185 |
| 67. | Green Hill | 79.8% | 64.1%(+15.7)#68 | 59.1%(+20.7)#5,326 |
| 68. | Watauga | 79.6% | 64.1%(+15.5)#69 | 59.1%(+20.5)#5,433 |
| 69. | Christiana | 79.4% | 64.1%(+15.3)#70 | 59.1%(+20.3)#5,510 |
| 70. | Orlinda | 79.4% | 64.1%(+15.3)#71 | 59.1%(+20.3)#5,528 |
| 71. | Parker S Crossroads | 79.4% | 64.1%(+15.3)#72 | 59.1%(+20.3)#5,532 |
| 72. | Hornbeak | 79.3% | 64.1%(+15.2)#73 | 59.1%(+20.2)#5,589 |
| 73. | Bartlett | 79.2% | 64.1%(+15.1)#74 | 59.1%(+20.1)#5,605 |
| 74. | Farragut | 79.2% | 64.1%(+15.1)#75 | 59.1%(+20.1)#5,607 |
| 75. | Riceville | 79.1% | 64.1%(+15.0)#76 | 59.1%(+20.0)#5,678 |
| 76. | Adams | 79.1% | 64.1%(+15.0)#77 | 59.1%(+20.0)#5,682 |
| 77. | Clarksburg | 78.9% | 64.1%(+14.8)#78 | 59.1%(+19.8)#5,766 |
| 78. | Woodland Mills | 78.8% | 64.1%(+14.7)#79 | 59.1%(+19.7)#5,826 |
| 79. | Sale Creek | 78.7% | 64.1%(+14.6)#80 | 59.1%(+19.6)#5,870 |
| 80. | New Deal | 78.7% | 64.1%(+14.6)#81 | 59.1%(+19.6)#5,897 |
| 81. | Leoma | 78.6% | 64.1%(+14.5)#82 | 59.1%(+19.5)#5,929 |
| 82. | Lakeland | 78.4% | 64.1%(+14.3)#83 | 59.1%(+19.3)#5,991 |
| 83. | New Johnsonville | 78.4% | 64.1%(+14.3)#84 | 59.1%(+19.3)#6,003 |
| 84. | Williston | 78.4% | 64.1%(+14.3)#85 | 59.1%(+19.3)#6,020 |
| 85. | Plainview | 78.2% | 64.1%(+14.1)#86 | 59.1%(+19.1)#6,103 |
| 86. | Greenbrier | 78.1% | 64.1%(+14.0)#87 | 59.1%(+19.0)#6,141 |
| 87. | Cross Plains | 78.1% | 64.1%(+14.0)#88 | 59.1%(+19.0)#6,154 |
| 88. | Lookout Mountain | 78.0% | 64.1%(+13.9)#89 | 59.1%(+18.9)#6,204 |
| 89. | Townsend | 78.0% | 64.1%(+13.9)#90 | 59.1%(+18.9)#6,214 |
| 90. | Gruetli Laager | 77.9% | 64.1%(+13.8)#91 | 59.1%(+18.8)#6,250 |
| 91. | Bell Buckle | 77.7% | 64.1%(+13.6)#92 | 59.1%(+18.6)#6,385 |
| 92. | Flintville | 77.7% | 64.1%(+13.6)#93 | 59.1%(+18.6)#6,393 |
| 93. | Charleston | 77.4% | 64.1%(+13.3)#94 | 59.1%(+18.3)#6,531 |
| 94. | Pleasant View | 77.2% | 64.1%(+13.1)#95 | 59.1%(+18.1)#6,623 |
| 95. | Spring Hill | 77.1% | 64.1%(+13.0)#96 | 59.1%(+18.0)#6,657 |
| 96. | Powells Crossroads | 77.1% | 64.1%(+13.0)#97 | 59.1%(+18.0)#6,680 |
| 97. | Viola | 77.1% | 64.1%(+13.0)#98 | 59.1%(+18.0)#6,717 |
| 98. | Apison | 76.9% | 64.1%(+12.8)#99 | 59.1%(+17.8)#6,777 |
| 99. | Counce | 76.9% | 64.1%(+12.8)#100 | 59.1%(+17.8)#6,806 |
| 100. | Ridgetop | 76.8% | 64.1%(+12.7)#101 | 59.1%(+17.7)#6,849 |
Common Questions
What are the Top 10 Cities with the Highest Percentage of Households With Two or more Vehicles in Tennessee?
Top 10 Cities with the Highest Percentage of Households With Two or more Vehicles in Tennessee are:
#1
100.0%
#2
100.0%
#3
100.0%
#4
100.0%
#5
95.1%
#6
93.4%
#7
93.3%
#8
92.4%
#9
90.8%
#10
90.4%
What city has the Highest Percentage of Households With Two or more Vehicles in Tennessee?
Fairfield has the Highest Percentage of Households With Two or more Vehicles in Tennessee with 100.0%.
What is the Percentage of Households With Two or more Vehicles in the State of Tennessee?
Percentage of Households With Two or more Vehicles in Tennessee is 64.1%.
What is the Percentage of Households With Two or more Vehicles in the United States?
Percentage of Households With Two or more Vehicles in the United States is 59.1%.