Cities with the Highest Percentage of Households With Two or more Vehicles in Iowa
RELATED REPORTS & OPTIONS
Households with 2 or more Cars
Iowa
Compare Cities
Map of Cities with the Highest Percentage of Households With Two or more Vehicles in Iowa
0.0%
100.0%
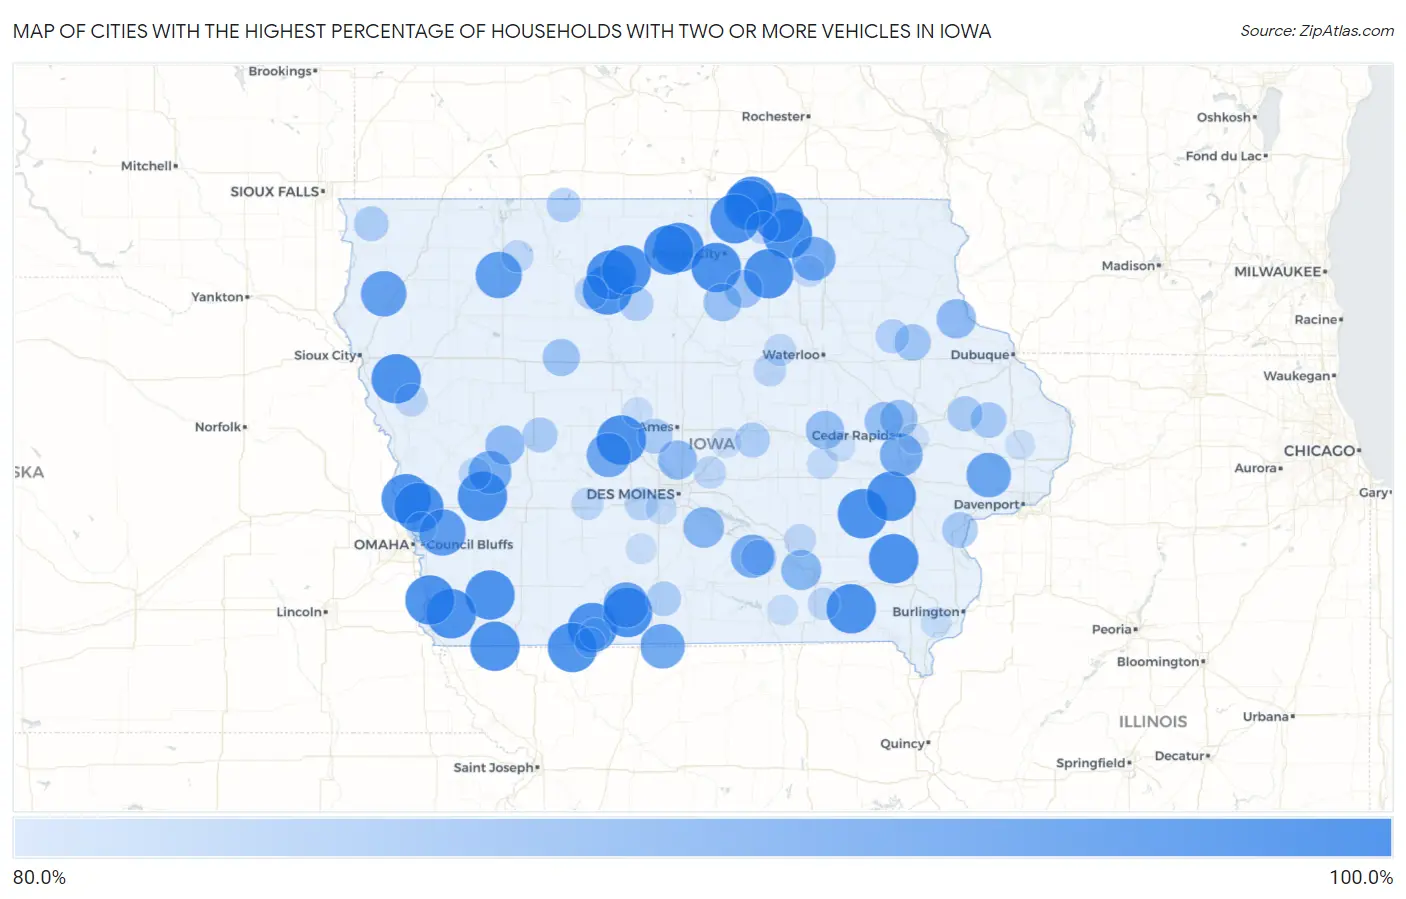
Cities with the Highest Percentage of Households With Two or more Vehicles in Iowa
| City | Housholds With 2+ Cars | vs State | vs National | |
| 1. | Wever | 100.0% | 64.8% (+35.2)#1 | 59.1% (+40.9)#287 |
| 2. | Oak Hills | 100.0% | 64.8% (+35.2)#2 | 59.1% (+40.9)#458 |
| 3. | Kinross | 100.0% | 64.8% (+35.2)#3 | 59.1% (+40.9)#507 |
| 4. | Lowell | 100.0% | 64.8% (+35.2)#4 | 59.1% (+40.9)#510 |
| 5. | California Junction | 100.0% | 64.8% (+35.2)#5 | 59.1% (+40.9)#622 |
| 6. | Climbing Hill | 100.0% | 64.8% (+35.2)#6 | 59.1% (+40.9)#665 |
| 7. | St Joseph | 100.0% | 64.8% (+35.2)#7 | 59.1% (+40.9)#685 |
| 8. | New Haven | 100.0% | 64.8% (+35.2)#8 | 59.1% (+40.9)#729 |
| 9. | Augusta | 100.0% | 64.8% (+35.2)#9 | 59.1% (+40.9)#735 |
| 10. | Irvington | 100.0% | 64.8% (+35.2)#10 | 59.1% (+40.9)#745 |
| 11. | Miller | 100.0% | 64.8% (+35.2)#11 | 59.1% (+40.9)#761 |
| 12. | Coburg | 100.0% | 64.8% (+35.2)#12 | 59.1% (+40.9)#813 |
| 13. | St Benedict | 100.0% | 64.8% (+35.2)#13 | 59.1% (+40.9)#819 |
| 14. | Loveland | 100.0% | 64.8% (+35.2)#14 | 59.1% (+40.9)#824 |
| 15. | Anderson | 100.0% | 64.8% (+35.2)#15 | 59.1% (+40.9)#825 |
| 16. | Argyle | 100.0% | 64.8% (+35.2)#16 | 59.1% (+40.9)#833 |
| 17. | Little Cedar | 100.0% | 64.8% (+35.2)#17 | 59.1% (+40.9)#861 |
| 18. | Kingston | 100.0% | 64.8% (+35.2)#18 | 59.1% (+40.9)#896 |
| 19. | Frytown | 100.0% | 64.8% (+35.2)#19 | 59.1% (+40.9)#897 |
| 20. | Blanchard | 100.0% | 64.8% (+35.2)#20 | 59.1% (+40.9)#908 |
| 21. | Mona | 100.0% | 64.8% (+35.2)#21 | 59.1% (+40.9)#973 |
| 22. | Leando | 100.0% | 64.8% (+35.2)#23 | 59.1% (+40.9)#1,006 |
| 23. | Otranto | 100.0% | 64.8% (+35.2)#24 | 59.1% (+40.9)#1,007 |
| 24. | Coppock | 100.0% | 64.8% (+35.2)#25 | 59.1% (+40.9)#1,008 |
| 25. | Benton | 100.0% | 64.8% (+35.2)#26 | 59.1% (+40.9)#1,017 |
| 26. | Burchinal | 100.0% | 64.8% (+35.2)#27 | 59.1% (+40.9)#1,029 |
| 27. | Hayfield | 100.0% | 64.8% (+35.2)#28 | 59.1% (+40.9)#1,048 |
| 28. | Argo | 100.0% | 64.8% (+35.2)#29 | 59.1% (+40.9)#1,151 |
| 29. | Bartlett | 100.0% | 64.8% (+35.2)#30 | 59.1% (+40.9)#1,152 |
| 30. | Roseville | 100.0% | 64.8% (+35.2)#31 | 59.1% (+40.9)#1,153 |
| 31. | Plainview | 100.0% | 64.8% (+35.2)#32 | 59.1% (+40.9)#1,175 |
| 32. | Bolan | 100.0% | 64.8% (+35.2)#33 | 59.1% (+40.9)#1,195 |
| 33. | Corley | 100.0% | 64.8% (+35.2)#34 | 59.1% (+40.9)#1,220 |
| 34. | Athelstan | 100.0% | 64.8% (+35.2)#35 | 59.1% (+40.9)#1,241 |
| 35. | Berkley | 100.0% | 64.8% (+35.2)#36 | 59.1% (+40.9)#1,242 |
| 36. | Beaconsfield | 100.0% | 64.8% (+35.2)#37 | 59.1% (+40.9)#1,245 |
| 37. | Mcclelland | 97.9% | 64.8% (+33.1)#38 | 59.1% (+38.8)#1,279 |
| 38. | Rossie | 97.8% | 64.8% (+33.0)#39 | 59.1% (+38.7)#1,282 |
| 39. | Struble | 97.3% | 64.8% (+32.5)#40 | 59.1% (+38.2)#1,296 |
| 40. | Sun Valley Lake | 97.1% | 64.8% (+32.3)#41 | 59.1% (+38.0)#1,307 |
| 41. | New Liberty | 96.6% | 64.8% (+31.8)#42 | 59.1% (+37.5)#1,325 |
| 42. | Pleasanton | 96.6% | 64.8% (+31.8)#43 | 59.1% (+37.5)#1,327 |
| 43. | Sandusky | 96.3% | 64.8% (+31.5)#44 | 59.1% (+37.2)#1,342 |
| 44. | Dawson | 96.3% | 64.8% (+31.5)#45 | 59.1% (+37.2)#1,343 |
| 45. | North Washington | 96.0% | 64.8% (+31.2)#46 | 59.1% (+36.9)#1,353 |
| 46. | Marysville | 95.6% | 64.8% (+30.8)#47 | 59.1% (+36.5)#1,389 |
| 47. | Kirkman | 95.5% | 64.8% (+30.7)#48 | 59.1% (+36.4)#1,396 |
| 48. | Shueyville | 95.3% | 64.8% (+30.5)#49 | 59.1% (+36.2)#1,405 |
| 49. | Sandyville | 93.8% | 64.8% (+29.0)#50 | 59.1% (+34.7)#1,541 |
| 50. | Chillicothe | 93.5% | 64.8% (+28.7)#51 | 59.1% (+34.4)#1,581 |
| 51. | Fairport | 93.2% | 64.8% (+28.4)#52 | 59.1% (+34.1)#1,620 |
| 52. | Osterdock | 93.0% | 64.8% (+28.2)#53 | 59.1% (+33.9)#1,643 |
| 53. | Aspinwall | 92.9% | 64.8% (+28.1)#54 | 59.1% (+33.8)#1,662 |
| 54. | Alleman | 92.8% | 64.8% (+28.0)#55 | 59.1% (+33.7)#1,673 |
| 55. | Elberon | 92.3% | 64.8% (+27.5)#56 | 59.1% (+33.2)#1,740 |
| 56. | Palo | 92.2% | 64.8% (+27.4)#57 | 59.1% (+33.1)#1,751 |
| 57. | Dougherty | 92.0% | 64.8% (+27.2)#58 | 59.1% (+32.9)#1,790 |
| 58. | Chapin | 91.9% | 64.8% (+27.1)#59 | 59.1% (+32.8)#1,804 |
| 59. | Robins | 91.7% | 64.8% (+26.9)#60 | 59.1% (+32.6)#1,810 |
| 60. | Twin Lakes | 91.5% | 64.8% (+26.7)#61 | 59.1% (+32.4)#1,847 |
| 61. | Dundee | 91.1% | 64.8% (+26.3)#62 | 59.1% (+32.0)#1,901 |
| 62. | Fruitland | 90.5% | 64.8% (+25.7)#63 | 59.1% (+31.4)#1,993 |
| 63. | Monmouth | 90.4% | 64.8% (+25.6)#64 | 59.1% (+31.3)#2,019 |
| 64. | Hamilton | 90.3% | 64.8% (+25.5)#65 | 59.1% (+31.2)#2,042 |
| 65. | Luther | 90.0% | 64.8% (+25.2)#66 | 59.1% (+30.9)#2,093 |
| 66. | Center Junction | 90.0% | 64.8% (+25.2)#67 | 59.1% (+30.9)#2,094 |
| 67. | Willey | 90.0% | 64.8% (+25.2)#68 | 59.1% (+30.9)#2,095 |
| 68. | Haverhill | 89.9% | 64.8% (+25.1)#69 | 59.1% (+30.8)#2,121 |
| 69. | Alvord | 89.8% | 64.8% (+25.0)#70 | 59.1% (+30.7)#2,137 |
| 70. | Weldon | 89.7% | 64.8% (+24.9)#71 | 59.1% (+30.6)#2,151 |
| 71. | Renwick | 89.6% | 64.8% (+24.8)#72 | 59.1% (+30.5)#2,161 |
| 72. | Dolliver | 89.5% | 64.8% (+24.7)#73 | 59.1% (+30.4)#2,181 |
| 73. | Aurora | 89.3% | 64.8% (+24.5)#74 | 59.1% (+30.2)#2,222 |
| 74. | Van Meter | 88.9% | 64.8% (+24.1)#75 | 59.1% (+29.8)#2,288 |
| 75. | Ottosen | 88.9% | 64.8% (+24.1)#76 | 59.1% (+29.8)#2,319 |
| 76. | Rodney | 88.5% | 64.8% (+23.7)#77 | 59.1% (+29.4)#2,388 |
| 77. | Holland | 88.4% | 64.8% (+23.6)#78 | 59.1% (+29.3)#2,401 |
| 78. | Mitchell | 88.4% | 64.8% (+23.6)#79 | 59.1% (+29.3)#2,407 |
| 79. | Kent Estates | 88.3% | 64.8% (+23.5)#80 | 59.1% (+29.2)#2,411 |
| 80. | Westphalia | 88.3% | 64.8% (+23.5)#81 | 59.1% (+29.2)#2,430 |
| 81. | Menlo | 88.2% | 64.8% (+23.4)#82 | 59.1% (+29.1)#2,447 |
| 82. | Floris | 88.2% | 64.8% (+23.4)#83 | 59.1% (+29.1)#2,453 |
| 83. | Valeria | 88.2% | 64.8% (+23.4)#84 | 59.1% (+29.1)#2,456 |
| 84. | Stout | 88.1% | 64.8% (+23.3)#85 | 59.1% (+29.0)#2,479 |
| 85. | Dickens | 88.1% | 64.8% (+23.3)#86 | 59.1% (+29.0)#2,485 |
| 86. | Keomah Village | 88.1% | 64.8% (+23.3)#87 | 59.1% (+29.0)#2,486 |
| 87. | Ionia | 87.7% | 64.8% (+22.9)#88 | 59.1% (+28.6)#2,573 |
| 88. | Cumming | 87.5% | 64.8% (+22.7)#89 | 59.1% (+28.4)#2,607 |
| 89. | Hartwick | 87.5% | 64.8% (+22.7)#90 | 59.1% (+28.4)#2,623 |
| 90. | Delphos | 87.5% | 64.8% (+22.7)#91 | 59.1% (+28.4)#2,631 |
| 91. | Denmark | 87.4% | 64.8% (+22.6)#92 | 59.1% (+28.3)#2,645 |
| 92. | Crescent | 87.3% | 64.8% (+22.5)#93 | 59.1% (+28.2)#2,667 |
| 93. | East Peru | 87.2% | 64.8% (+22.4)#94 | 59.1% (+28.1)#2,700 |
| 94. | Luzerne | 87.2% | 64.8% (+22.4)#95 | 59.1% (+28.1)#2,702 |
| 95. | Fraser | 87.1% | 64.8% (+22.3)#96 | 59.1% (+28.0)#2,726 |
| 96. | Unionville | 87.1% | 64.8% (+22.3)#97 | 59.1% (+28.0)#2,728 |
| 97. | Rhodes | 87.0% | 64.8% (+22.2)#98 | 59.1% (+27.9)#2,748 |
| 98. | Bertram | 86.8% | 64.8% (+22.0)#99 | 59.1% (+27.7)#2,806 |
| 99. | Welton | 86.8% | 64.8% (+22.0)#100 | 59.1% (+27.7)#2,810 |
| 100. | Redding | 86.7% | 64.8% (+21.9)#101 | 59.1% (+27.6)#2,842 |
Common Questions
What are the Top 10 Cities with the Highest Percentage of Households With Two or more Vehicles in Iowa?
Top 10 Cities with the Highest Percentage of Households With Two or more Vehicles in Iowa are:
#1
100.0%
#2
100.0%
#3
100.0%
#4
100.0%
#5
100.0%
#6
100.0%
#7
100.0%
#8
100.0%
#9
100.0%
#10
100.0%
What city has the Highest Percentage of Households With Two or more Vehicles in Iowa?
Kinross has the Highest Percentage of Households With Two or more Vehicles in Iowa with 100.0%.
What is the Percentage of Households With Two or more Vehicles in the State of Iowa?
Percentage of Households With Two or more Vehicles in Iowa is 64.8%.
What is the Percentage of Households With Two or more Vehicles in the United States?
Percentage of Households With Two or more Vehicles in the United States is 59.1%.