Cities with the Most Immigrants from Bosnia and Herzegovina in Minnesota
RELATED REPORTS & OPTIONS
Bosnia and Herzegovina
Minnesota
Compare Cities
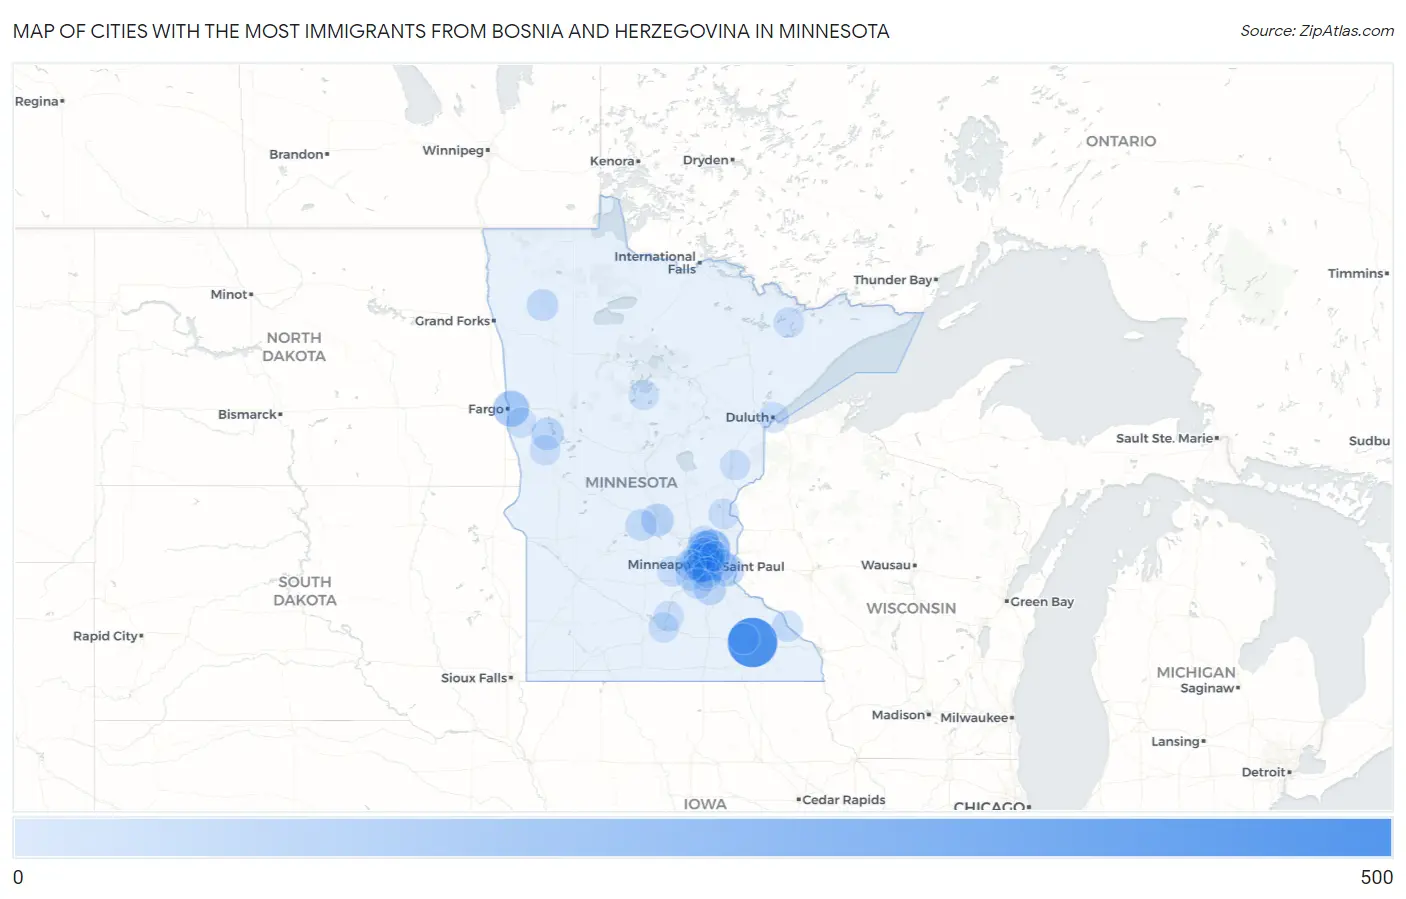
Map of Cities with the Most Immigrants from Bosnia and Herzegovina in Minnesota
0
500
Cities with the Most Immigrants from Bosnia and Herzegovina in Minnesota
| City | Bosnia and Herzegovina | vs State | vs National | |
| 1. | Rochester | 472 | 2,134(22.12%)#1 | 106,359(0.44%)#35 |
| 2. | Golden Valley | 201 | 2,134(9.42%)#2 | 106,359(0.19%)#88 |
| 3. | Blaine | 189 | 2,134(8.86%)#3 | 106,359(0.18%)#92 |
| 4. | Moorhead | 140 | 2,134(6.56%)#4 | 106,359(0.13%)#126 |
| 5. | Coon Rapids | 126 | 2,134(5.90%)#5 | 106,359(0.12%)#135 |
| 6. | Minneapolis | 83 | 2,134(3.89%)#6 | 106,359(0.08%)#213 |
| 7. | Woodbury | 70 | 2,134(3.28%)#7 | 106,359(0.07%)#255 |
| 8. | Fridley | 69 | 2,134(3.23%)#8 | 106,359(0.06%)#259 |
| 9. | Spring Lake Park | 65 | 2,134(3.05%)#9 | 106,359(0.06%)#274 |
| 10. | St Cloud | 59 | 2,134(2.76%)#10 | 106,359(0.06%)#291 |
| 11. | St Louis Park | 57 | 2,134(2.67%)#11 | 106,359(0.05%)#305 |
| 12. | Maplewood | 57 | 2,134(2.67%)#12 | 106,359(0.05%)#306 |
| 13. | Lakeville | 56 | 2,134(2.62%)#13 | 106,359(0.05%)#310 |
| 14. | Pelican Rapids | 54 | 2,134(2.53%)#14 | 106,359(0.05%)#324 |
| 15. | Plymouth | 44 | 2,134(2.06%)#15 | 106,359(0.04%)#376 |
| 16. | Brooklyn Park | 41 | 2,134(1.92%)#16 | 106,359(0.04%)#397 |
| 17. | Thief River Falls | 37 | 2,134(1.73%)#17 | 106,359(0.03%)#430 |
| 18. | Cold Spring | 34 | 2,134(1.59%)#18 | 106,359(0.03%)#452 |
| 19. | Columbia Heights | 28 | 2,134(1.31%)#19 | 106,359(0.03%)#506 |
| 20. | Chanhassen | 23 | 2,134(1.08%)#20 | 106,359(0.02%)#559 |
| 21. | Byron | 21 | 2,134(0.98%)#21 | 106,359(0.02%)#589 |
| 22. | Minneiska | 21 | 2,134(0.98%)#22 | 106,359(0.02%)#593 |
| 23. | Hopkins | 18 | 2,134(0.84%)#23 | 106,359(0.02%)#646 |
| 24. | Bloomington | 16 | 2,134(0.75%)#24 | 106,359(0.02%)#685 |
| 25. | Andover | 16 | 2,134(0.75%)#25 | 106,359(0.02%)#692 |
| 26. | Mayer | 16 | 2,134(0.75%)#26 | 106,359(0.02%)#703 |
| 27. | Richfield | 15 | 2,134(0.70%)#27 | 106,359(0.01%)#711 |
| 28. | Orono | 15 | 2,134(0.70%)#28 | 106,359(0.01%)#723 |
| 29. | Prior Lake | 12 | 2,134(0.56%)#29 | 106,359(0.01%)#783 |
| 30. | Elizabeth | 11 | 2,134(0.52%)#30 | 106,359(0.01%)#828 |
| 31. | Shoreview | 10 | 2,134(0.47%)#31 | 106,359(0.01%)#843 |
| 32. | St Peter | 10 | 2,134(0.47%)#32 | 106,359(0.01%)#852 |
| 33. | Ely | 10 | 2,134(0.47%)#33 | 106,359(0.01%)#861 |
| 34. | Harris | 10 | 2,134(0.47%)#34 | 106,359(0.01%)#866 |
| 35. | Duluth | 9 | 2,134(0.42%)#35 | 106,359(0.01%)#874 |
| 36. | North Mankato | 6 | 2,134(0.28%)#36 | 106,359(0.01%)#975 |
| 37. | Askov | 4 | 2,134(0.19%)#37 | 106,359(0.00%)#1,030 |
| 38. | Baker | 3 | 2,134(0.14%)#38 | 106,359(0.00%)#1,043 |
| 39. | Whipholt | 1 | 2,134(0.05%)#39 | 106,359(0.00%)#1,067 |
Common Questions
What are the Top 10 Cities with the Most Immigrants from Bosnia and Herzegovina in Minnesota?
Top 10 Cities with the Most Immigrants from Bosnia and Herzegovina in Minnesota are:
#1
472
#2
201
#3
189
#4
140
#5
126
#6
83
#7
70
#8
69
#9
65
#10
59
What city has the Most Immigrants from Bosnia and Herzegovina in Minnesota?
Rochester has the Most Immigrants from Bosnia and Herzegovina in Minnesota with 472.
What is the Total Immigrants from Bosnia and Herzegovina in the State of Minnesota?
Total Immigrants from Bosnia and Herzegovina in Minnesota is 2,134.
What is the Total Immigrants from Bosnia and Herzegovina in the United States?
Total Immigrants from Bosnia and Herzegovina in the United States is 106,359.