Cities with the Most Immigrants from Bosnia and Herzegovina in Ohio
RELATED REPORTS & OPTIONS
Bosnia and Herzegovina
Ohio
Compare Cities
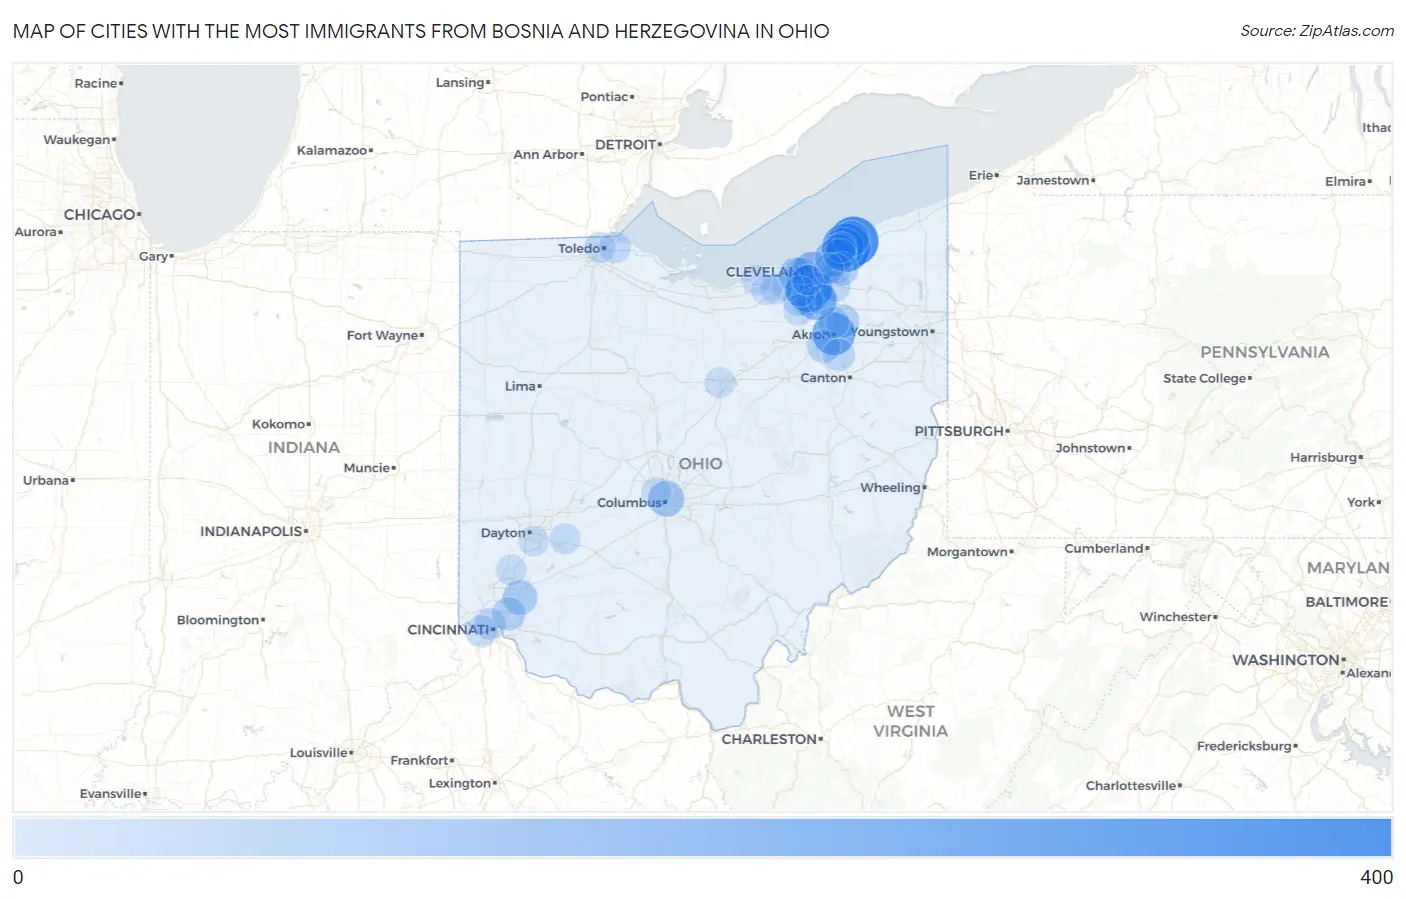
Map of Cities with the Most Immigrants from Bosnia and Herzegovina in Ohio
0
400
Cities with the Most Immigrants from Bosnia and Herzegovina in Ohio
| City | Bosnia and Herzegovina | vs State | vs National | |
| 1. | Mentor | 347 | 3,269(10.61%)#1 | 106,359(0.33%)#49 |
| 2. | Willoughby | 326 | 3,269(9.97%)#2 | 106,359(0.31%)#55 |
| 3. | Parma | 281 | 3,269(8.60%)#3 | 106,359(0.26%)#67 |
| 4. | Akron | 224 | 3,269(6.85%)#4 | 106,359(0.21%)#82 |
| 5. | Eastlake | 174 | 3,269(5.32%)#5 | 106,359(0.16%)#103 |
| 6. | Broadview Heights | 171 | 3,269(5.23%)#6 | 106,359(0.16%)#106 |
| 7. | Cleveland | 162 | 3,269(4.96%)#7 | 106,359(0.15%)#109 |
| 8. | Euclid | 124 | 3,269(3.79%)#8 | 106,359(0.12%)#137 |
| 9. | Columbus | 102 | 3,269(3.12%)#9 | 106,359(0.10%)#173 |
| 10. | Mentor On The Lake | 96 | 3,269(2.94%)#10 | 106,359(0.09%)#184 |
| 11. | Rocky River | 82 | 3,269(2.51%)#11 | 106,359(0.08%)#222 |
| 12. | Landen | 80 | 3,269(2.45%)#12 | 106,359(0.08%)#230 |
| 13. | Willowick | 75 | 3,269(2.29%)#13 | 106,359(0.07%)#235 |
| 14. | Mayfield Heights | 67 | 3,269(2.05%)#14 | 106,359(0.06%)#266 |
| 15. | Stow | 60 | 3,269(1.84%)#15 | 106,359(0.06%)#286 |
| 16. | Kenwood | 60 | 3,269(1.84%)#16 | 106,359(0.06%)#288 |
| 17. | Seven Hills | 57 | 3,269(1.74%)#17 | 106,359(0.05%)#308 |
| 18. | Barberton | 53 | 3,269(1.62%)#18 | 106,359(0.05%)#326 |
| 19. | Lakewood | 47 | 3,269(1.44%)#19 | 106,359(0.04%)#358 |
| 20. | Green | 39 | 3,269(1.19%)#20 | 106,359(0.04%)#410 |
| 21. | Wickliffe | 33 | 3,269(1.01%)#21 | 106,359(0.03%)#458 |
| 22. | Delhi Hills | 33 | 3,269(1.01%)#22 | 106,359(0.03%)#462 |
| 23. | North Royalton | 32 | 3,269(0.98%)#23 | 106,359(0.03%)#468 |
| 24. | Cincinnati | 27 | 3,269(0.83%)#24 | 106,359(0.03%)#513 |
| 25. | Strongsville | 27 | 3,269(0.83%)#25 | 106,359(0.03%)#515 |
| 26. | North Olmsted | 24 | 3,269(0.73%)#26 | 106,359(0.02%)#548 |
| 27. | Oregon | 24 | 3,269(0.73%)#27 | 106,359(0.02%)#551 |
| 28. | Bedford Heights | 23 | 3,269(0.70%)#28 | 106,359(0.02%)#563 |
| 29. | Cuyahoga Falls | 20 | 3,269(0.61%)#29 | 106,359(0.02%)#597 |
| 30. | Wilberforce | 19 | 3,269(0.58%)#30 | 106,359(0.02%)#628 |
| 31. | Toledo | 17 | 3,269(0.52%)#31 | 106,359(0.02%)#654 |
| 32. | Brunswick | 17 | 3,269(0.52%)#32 | 106,359(0.02%)#664 |
| 33. | Middletown | 16 | 3,269(0.49%)#33 | 106,359(0.02%)#688 |
| 34. | Brecksville | 16 | 3,269(0.49%)#34 | 106,359(0.02%)#694 |
| 35. | North Ridgeville | 15 | 3,269(0.46%)#35 | 106,359(0.01%)#712 |
| 36. | Middleburg Heights | 13 | 3,269(0.40%)#36 | 106,359(0.01%)#761 |
| 37. | Mansfield | 12 | 3,269(0.37%)#37 | 106,359(0.01%)#776 |
| 38. | Brooklyn | 10 | 3,269(0.31%)#38 | 106,359(0.01%)#853 |
| 39. | Kettering | 9 | 3,269(0.28%)#39 | 106,359(0.01%)#876 |
| 40. | Upper Arlington | 9 | 3,269(0.28%)#40 | 106,359(0.01%)#880 |
| 41. | Lorain | 8 | 3,269(0.24%)#41 | 106,359(0.01%)#911 |
| 42. | Elyria | 8 | 3,269(0.24%)#42 | 106,359(0.01%)#914 |
| 43. | Lyndhurst | 8 | 3,269(0.24%)#43 | 106,359(0.01%)#928 |
| 44. | Lakeline | 6 | 3,269(0.18%)#44 | 106,359(0.01%)#986 |
| 45. | Cleveland Heights | 5 | 3,269(0.15%)#45 | 106,359(0.00%)#992 |
Common Questions
What are the Top 10 Cities with the Most Immigrants from Bosnia and Herzegovina in Ohio?
Top 10 Cities with the Most Immigrants from Bosnia and Herzegovina in Ohio are:
#1
347
#2
326
#3
281
#4
224
#5
174
#6
171
#7
162
#8
124
#9
102
#10
96
What city has the Most Immigrants from Bosnia and Herzegovina in Ohio?
Mentor has the Most Immigrants from Bosnia and Herzegovina in Ohio with 347.
What is the Total Immigrants from Bosnia and Herzegovina in the State of Ohio?
Total Immigrants from Bosnia and Herzegovina in Ohio is 3,269.
What is the Total Immigrants from Bosnia and Herzegovina in the United States?
Total Immigrants from Bosnia and Herzegovina in the United States is 106,359.