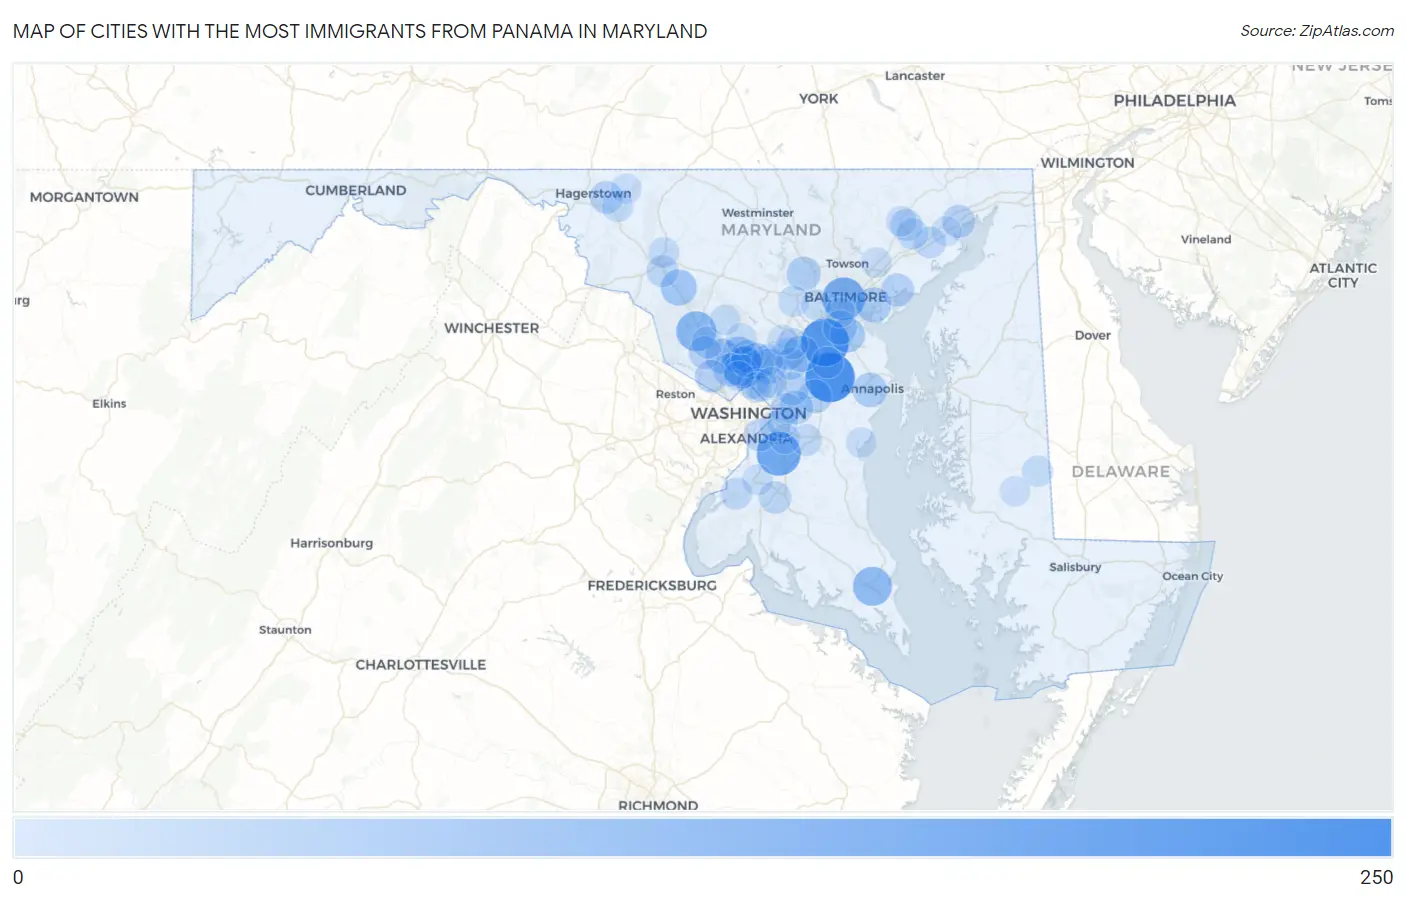
Cities with the Most Immigrants from Panama in Maryland
RELATED REPORTS & OPTIONS
Panama
Maryland
Compare Cities
Map of Cities with the Most Immigrants from Panama in Maryland
0
250
Cities with the Most Immigrants from Panama in Maryland
| City | Panama | vs State | vs National | |
| 1. | Crofton | 225 | 2,848(7.90%)#1 | 105,274(0.21%)#53 |
| 2. | Severn | 205 | 2,848(7.20%)#2 | 105,274(0.19%)#61 |
| 3. | Clinton | 159 | 2,848(5.58%)#3 | 105,274(0.15%)#87 |
| 4. | Baltimore | 145 | 2,848(5.09%)#4 | 105,274(0.14%)#102 |
| 5. | Wheaton | 122 | 2,848(4.28%)#5 | 105,274(0.12%)#126 |
| 6. | Germantown | 112 | 2,848(3.93%)#6 | 105,274(0.11%)#138 |
| 7. | California | 101 | 2,848(3.55%)#7 | 105,274(0.10%)#170 |
| 8. | Aspen Hill | 71 | 2,848(2.49%)#8 | 105,274(0.07%)#256 |
| 9. | Colesville | 71 | 2,848(2.49%)#9 | 105,274(0.07%)#258 |
| 10. | Urbana | 68 | 2,848(2.39%)#10 | 105,274(0.06%)#273 |
| 11. | Maryland City | 67 | 2,848(2.35%)#11 | 105,274(0.06%)#278 |
| 12. | Calverton | 60 | 2,848(2.11%)#12 | 105,274(0.06%)#314 |
| 13. | Glen Burnie | 55 | 2,848(1.93%)#13 | 105,274(0.05%)#340 |
| 14. | Rockville | 54 | 2,848(1.90%)#14 | 105,274(0.05%)#352 |
| 15. | Dundalk | 53 | 2,848(1.86%)#15 | 105,274(0.05%)#363 |
| 16. | Annapolis | 50 | 2,848(1.76%)#16 | 105,274(0.05%)#382 |
| 17. | Ferndale | 47 | 2,848(1.65%)#17 | 105,274(0.04%)#412 |
| 18. | Randallstown | 46 | 2,848(1.62%)#18 | 105,274(0.04%)#417 |
| 19. | Bowie | 42 | 2,848(1.47%)#19 | 105,274(0.04%)#447 |
| 20. | Lake Arbor | 42 | 2,848(1.47%)#20 | 105,274(0.04%)#449 |
| 21. | North Bethesda | 35 | 2,848(1.23%)#21 | 105,274(0.03%)#515 |
| 22. | Seabrook | 34 | 2,848(1.19%)#22 | 105,274(0.03%)#524 |
| 23. | Bowleys Quarters | 34 | 2,848(1.19%)#23 | 105,274(0.03%)#527 |
| 24. | North Potomac | 32 | 2,848(1.12%)#24 | 105,274(0.03%)#547 |
| 25. | Havre De Grace | 32 | 2,848(1.12%)#25 | 105,274(0.03%)#549 |
| 26. | Robinwood | 32 | 2,848(1.12%)#26 | 105,274(0.03%)#552 |
| 27. | Glassmanor | 30 | 2,848(1.05%)#27 | 105,274(0.03%)#588 |
| 28. | Layhill | 30 | 2,848(1.05%)#28 | 105,274(0.03%)#593 |
| 29. | Potomac | 29 | 2,848(1.02%)#29 | 105,274(0.03%)#598 |
| 30. | Silver Spring | 27 | 2,848(0.95%)#30 | 105,274(0.03%)#633 |
| 31. | Langley Park | 27 | 2,848(0.95%)#31 | 105,274(0.03%)#639 |
| 32. | Waldorf | 25 | 2,848(0.88%)#32 | 105,274(0.02%)#678 |
| 33. | Laurel | 25 | 2,848(0.88%)#33 | 105,274(0.02%)#687 |
| 34. | South Laurel | 24 | 2,848(0.84%)#34 | 105,274(0.02%)#711 |
| 35. | North Kensington | 22 | 2,848(0.77%)#35 | 105,274(0.02%)#770 |
| 36. | Ballenger Creek | 21 | 2,848(0.74%)#36 | 105,274(0.02%)#787 |
| 37. | Bel Air | 21 | 2,848(0.74%)#37 | 105,274(0.02%)#797 |
| 38. | Gaithersburg | 20 | 2,848(0.70%)#38 | 105,274(0.02%)#805 |
| 39. | Summerfield | 20 | 2,848(0.70%)#39 | 105,274(0.02%)#821 |
| 40. | Queensland | 19 | 2,848(0.67%)#40 | 105,274(0.02%)#853 |
| 41. | Bryans Road | 18 | 2,848(0.63%)#41 | 105,274(0.02%)#877 |
| 42. | Odenton | 17 | 2,848(0.60%)#42 | 105,274(0.02%)#892 |
| 43. | Fairland | 17 | 2,848(0.60%)#43 | 105,274(0.02%)#898 |
| 44. | Riverside | 17 | 2,848(0.60%)#44 | 105,274(0.02%)#916 |
| 45. | Bel Air South | 16 | 2,848(0.56%)#45 | 105,274(0.02%)#928 |
| 46. | North Laurel | 14 | 2,848(0.49%)#46 | 105,274(0.01%)#1,000 |
| 47. | Glenmont | 13 | 2,848(0.46%)#47 | 105,274(0.01%)#1,045 |
| 48. | Mount Aetna | 13 | 2,848(0.46%)#48 | 105,274(0.01%)#1,061 |
| 49. | Frederick | 12 | 2,848(0.42%)#49 | 105,274(0.01%)#1,072 |
| 50. | Ellicott City | 12 | 2,848(0.42%)#50 | 105,274(0.01%)#1,073 |
| 51. | Federalsburg | 12 | 2,848(0.42%)#51 | 105,274(0.01%)#1,107 |
| 52. | College Park | 11 | 2,848(0.39%)#52 | 105,274(0.01%)#1,135 |
| 53. | Olney | 10 | 2,848(0.35%)#53 | 105,274(0.01%)#1,179 |
| 54. | Perry Hall | 9 | 2,848(0.32%)#54 | 105,274(0.01%)#1,218 |
| 55. | Accokeek | 9 | 2,848(0.32%)#55 | 105,274(0.01%)#1,230 |
| 56. | Suitland | 8 | 2,848(0.28%)#56 | 105,274(0.01%)#1,276 |
| 57. | Takoma Park | 7 | 2,848(0.25%)#57 | 105,274(0.01%)#1,335 |
| 58. | Laytonsville | 7 | 2,848(0.25%)#58 | 105,274(0.01%)#1,367 |
| 59. | Catonsville | 6 | 2,848(0.21%)#59 | 105,274(0.01%)#1,380 |
| 60. | District Heights | 6 | 2,848(0.21%)#60 | 105,274(0.01%)#1,393 |
| 61. | Bel Air North | 5 | 2,848(0.18%)#61 | 105,274(0.00%)#1,410 |
| 62. | Scaggsville | 5 | 2,848(0.18%)#62 | 105,274(0.00%)#1,423 |
| 63. | Deale | 4 | 2,848(0.14%)#63 | 105,274(0.00%)#1,468 |
| 64. | South Kensington | 3 | 2,848(0.11%)#64 | 105,274(0.00%)#1,505 |
| 65. | Andrews Afb | 3 | 2,848(0.11%)#65 | 105,274(0.00%)#1,511 |
| 66. | Smithsburg | 3 | 2,848(0.11%)#66 | 105,274(0.00%)#1,512 |
| 67. | Hurlock | 3 | 2,848(0.11%)#67 | 105,274(0.00%)#1,517 |
| 68. | Aberdeen | 1 | 2,848(0.04%)#68 | 105,274(0.00%)#1,582 |
| 69. | Baltimore Highlands | 1 | 2,848(0.04%)#69 | 105,274(0.00%)#1,588 |
Common Questions
What are the Top 10 Cities with the Most Immigrants from Panama in Maryland?
Top 10 Cities with the Most Immigrants from Panama in Maryland are:
#1
225
#2
205
#3
159
#4
145
#5
122
#6
112
#7
101
#8
71
#9
71
#10
68
What city has the Most Immigrants from Panama in Maryland?
Crofton has the Most Immigrants from Panama in Maryland with 225.
What is the Total Immigrants from Panama in the State of Maryland?
Total Immigrants from Panama in Maryland is 2,848.
What is the Total Immigrants from Panama in the United States?
Total Immigrants from Panama in the United States is 105,274.