Cities with the Highest Percentage of Palestinian Population in the United States
RELATED REPORTS & OPTIONS
Palestinian
United States
Compare Cities
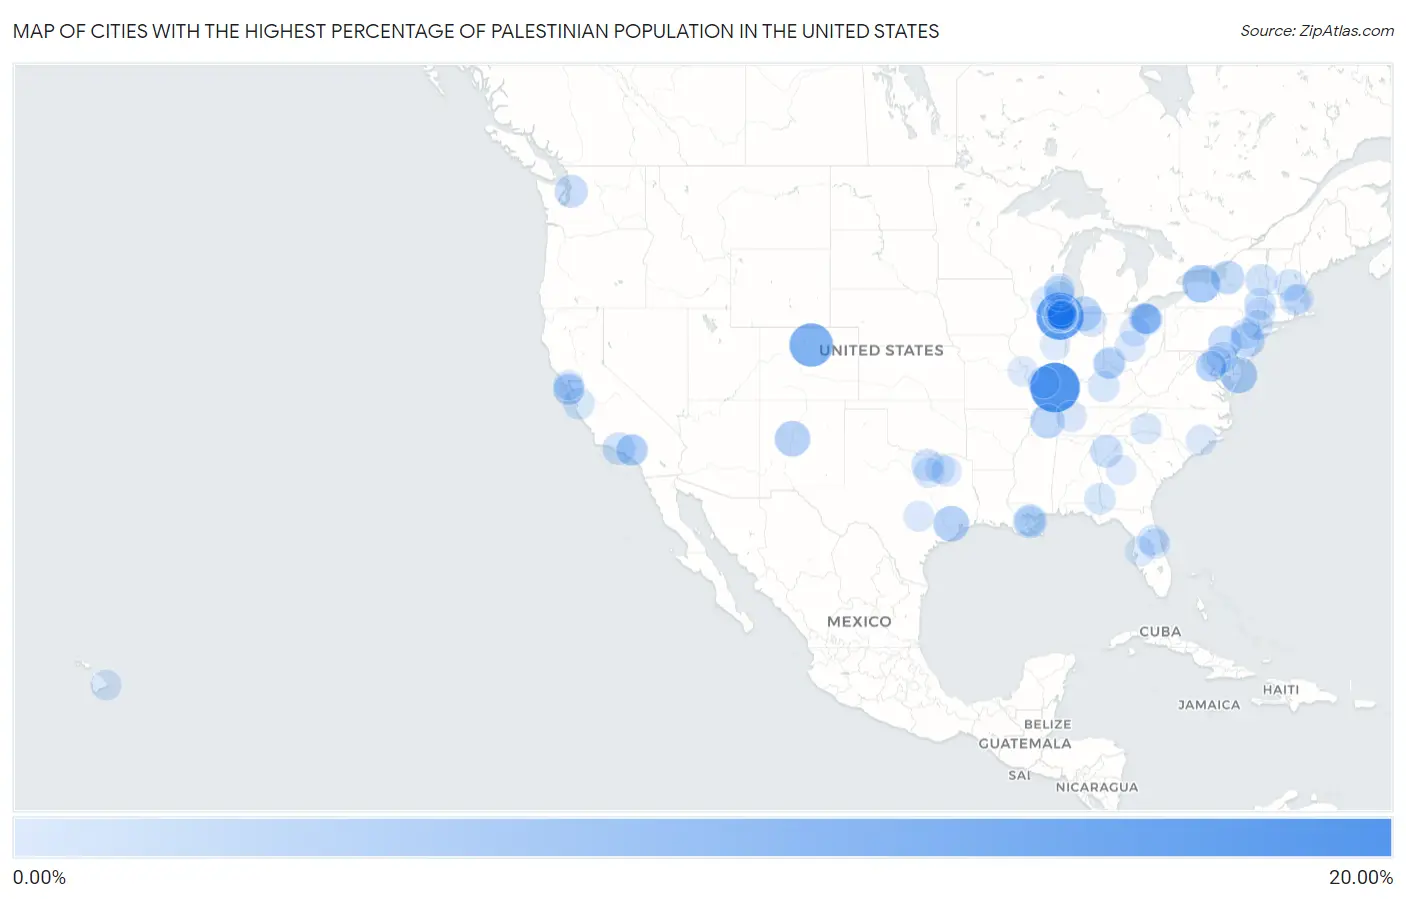
Map of Cities with the Highest Percentage of Palestinian Population in the United States
0.00%
20.00%
Cities with the Highest Percentage of Palestinian Population in the United States
| City | Palestinian | vs State | vs National | |
| 1. | Junction | 16.95% | 0.15%(+16.8)#1 | 0.046%(+16.9)#1 |
| 2. | Orland Hills | 14.95% | 0.15%(+14.8)#2 | 0.046%(+14.9)#2 |
| 3. | West Warren | 13.56% | 0.031%(+13.5)#1 | 0.046%(+13.5)#3 |
| 4. | Sunshine | 11.79% | 0.028%(+11.8)#1 | 0.046%(+11.7)#4 |
| 5. | Mehan | 8.82% | 0.010%(+8.81)#1 | 0.046%(+8.78)#5 |
| 6. | Clarkson | 7.03% | 0.044%(+6.98)#1 | 0.046%(+6.98)#6 |
| 7. | Bridgeview | 6.31% | 0.15%(+6.16)#3 | 0.046%(+6.26)#7 |
| 8. | Chicago Ridge | 6.22% | 0.15%(+6.07)#4 | 0.046%(+6.18)#8 |
| 9. | Willards | 6.20% | 0.046%(+6.16)#1 | 0.046%(+6.16)#9 |
| 10. | Hickory Hills | 5.98% | 0.15%(+5.83)#5 | 0.046%(+5.93)#10 |
| 11. | Spring Valley Village | 5.47% | 0.046%(+5.42)#1 | 0.046%(+5.43)#11 |
| 12. | Peralta | 5.27% | 0.032%(+5.24)#1 | 0.046%(+5.22)#12 |
| 13. | Greens Farms | 4.89% | 0.033%(+4.85)#1 | 0.046%(+4.84)#13 |
| 14. | Roseland | 4.66% | 0.020%(+4.64)#1 | 0.046%(+4.61)#14 |
| 15. | Lawrenceville | 4.58% | 0.086%(+4.49)#1 | 0.046%(+4.53)#15 |
| 16. | Medina | 4.37% | 0.040%(+4.33)#1 | 0.046%(+4.33)#16 |
| 17. | Justice | 4.05% | 0.15%(+3.90)#6 | 0.046%(+4.00)#17 |
| 18. | Timberlane | 4.01% | 0.070%(+3.94)#1 | 0.046%(+3.97)#18 |
| 19. | Oak Brook | 3.83% | 0.15%(+3.68)#7 | 0.046%(+3.79)#19 |
| 20. | Great Notch | 3.81% | 0.086%(+3.72)#2 | 0.046%(+3.76)#20 |
| 21. | Pulaski | 3.68% | 0.044%(+3.64)#2 | 0.046%(+3.64)#21 |
| 22. | Rothsville | 3.58% | 0.025%(+3.55)#1 | 0.046%(+3.53)#22 |
| 23. | Palos Hills | 3.40% | 0.15%(+3.25)#8 | 0.046%(+3.35)#23 |
| 24. | Orland Park | 3.22% | 0.15%(+3.06)#9 | 0.046%(+3.17)#24 |
| 25. | Alderwood Manor | 3.18% | 0.033%(+3.15)#1 | 0.046%(+3.14)#25 |
| 26. | Fairfield | 2.97% | 0.051%(+2.92)#1 | 0.046%(+2.92)#26 |
| 27. | Acworth | 2.91% | 0.022%(+2.89)#1 | 0.046%(+2.86)#27 |
| 28. | Santa Rosa Valley | 2.79% | 0.066%(+2.73)#1 | 0.046%(+2.74)#28 |
| 29. | Worth | 2.66% | 0.15%(+2.51)#10 | 0.046%(+2.62)#29 |
| 30. | Mount Hope | 2.55% | 0.086%(+2.47)#3 | 0.046%(+2.51)#30 |
| 31. | Bloomingdale Borough | 2.54% | 0.086%(+2.45)#4 | 0.046%(+2.49)#31 |
| 32. | Krum | 2.52% | 0.046%(+2.48)#2 | 0.046%(+2.48)#32 |
| 33. | Tinley Park | 2.49% | 0.15%(+2.33)#11 | 0.046%(+2.44)#33 |
| 34. | Lake George | 2.44% | 0.044%(+2.39)#3 | 0.046%(+2.39)#34 |
| 35. | North City | 2.44% | 0.15%(+2.29)#12 | 0.046%(+2.39)#35 |
| 36. | North Olmsted | 2.42% | 0.082%(+2.33)#1 | 0.046%(+2.37)#36 |
| 37. | Hartwick Seminary | 2.41% | 0.044%(+2.36)#4 | 0.046%(+2.36)#37 |
| 38. | Pine Brook | 2.26% | 0.086%(+2.18)#5 | 0.046%(+2.22)#38 |
| 39. | Bradbury | 2.22% | 0.066%(+2.15)#2 | 0.046%(+2.17)#39 |
| 40. | Fruit Hill | 2.21% | 0.082%(+2.13)#2 | 0.046%(+2.17)#40 |
| 41. | Fairview Borough | 2.18% | 0.086%(+2.10)#6 | 0.046%(+2.14)#41 |
| 42. | Hudson | 2.16% | 0.044%(+2.12)#5 | 0.046%(+2.11)#42 |
| 43. | Burbank | 2.05% | 0.15%(+1.89)#13 | 0.046%(+2.00)#43 |
| 44. | Colma | 2.03% | 0.066%(+1.97)#3 | 0.046%(+1.99)#44 |
| 45. | Elkhorn | 2.02% | 0.066%(+1.96)#4 | 0.046%(+1.98)#45 |
| 46. | Contoocook | 2.01% | 0.012%(+2.00)#1 | 0.046%(+1.96)#46 |
| 47. | Rossville | 2.01% | 0.046%(+1.96)#2 | 0.046%(+1.96)#47 |
| 48. | Columbia | 1.99% | 0.028%(+1.96)#1 | 0.046%(+1.94)#48 |
| 49. | Cliffside Park Borough | 1.90% | 0.086%(+1.82)#7 | 0.046%(+1.86)#49 |
| 50. | Palos Park | 1.88% | 0.15%(+1.73)#14 | 0.046%(+1.84)#50 |
| 51. | Harrodsburg | 1.87% | 0.024%(+1.84)#1 | 0.046%(+1.82)#51 |
| 52. | West Concord | 1.78% | 0.031%(+1.75)#2 | 0.046%(+1.74)#52 |
| 53. | North Webster | 1.77% | 0.020%(+1.75)#2 | 0.046%(+1.72)#53 |
| 54. | Homer Glen | 1.75% | 0.15%(+1.60)#15 | 0.046%(+1.70)#54 |
| 55. | Pegram | 1.71% | 0.040%(+1.67)#2 | 0.046%(+1.66)#55 |
| 56. | Sierra Madre | 1.68% | 0.066%(+1.61)#5 | 0.046%(+1.63)#56 |
| 57. | Pompton Lakes Borough | 1.65% | 0.086%(+1.56)#8 | 0.046%(+1.60)#57 |
| 58. | Bostic | 1.64% | 0.043%(+1.60)#1 | 0.046%(+1.60)#58 |
| 59. | Taylor Mill | 1.62% | 0.024%(+1.60)#2 | 0.046%(+1.57)#59 |
| 60. | Dunn Loring | 1.62% | 0.051%(+1.57)#2 | 0.046%(+1.57)#60 |
| 61. | White House Station | 1.61% | 0.086%(+1.52)#9 | 0.046%(+1.56)#61 |
| 62. | Millbrae | 1.59% | 0.066%(+1.53)#6 | 0.046%(+1.55)#62 |
| 63. | Buena Vista Comunidad Humacao Municipio | 1.56% | 0.017%(+1.55)#1 | 0.046%(+1.52)#63 |
| 64. | Oak Lawn | 1.56% | 0.15%(+1.41)#16 | 0.046%(+1.51)#64 |
| 65. | Woodland Park Borough | 1.56% | 0.086%(+1.47)#10 | 0.046%(+1.51)#65 |
| 66. | Heathrow | 1.54% | 0.046%(+1.49)#1 | 0.046%(+1.49)#66 |
| 67. | Bexley | 1.51% | 0.082%(+1.43)#3 | 0.046%(+1.47)#67 |
| 68. | Poplar Grove | 1.50% | 0.15%(+1.35)#17 | 0.046%(+1.46)#68 |
| 69. | Nanawale Estates | 1.50% | 0.014%(+1.49)#1 | 0.046%(+1.45)#69 |
| 70. | Parma Heights | 1.50% | 0.082%(+1.42)#4 | 0.046%(+1.45)#70 |
| 71. | Clifton Heights Borough | 1.48% | 0.025%(+1.45)#2 | 0.046%(+1.43)#71 |
| 72. | Pleasant Valley | 1.46% | 0.044%(+1.42)#6 | 0.046%(+1.41)#72 |
| 73. | Wallace | 1.45% | 0.043%(+1.41)#2 | 0.046%(+1.41)#73 |
| 74. | De Witt | 1.44% | 0.044%(+1.39)#7 | 0.046%(+1.39)#74 |
| 75. | Sunset Valley | 1.42% | 0.046%(+1.38)#3 | 0.046%(+1.38)#75 |
| 76. | Ontario | 1.42% | 0.082%(+1.33)#5 | 0.046%(+1.37)#76 |
| 77. | Nanuet | 1.36% | 0.044%(+1.31)#8 | 0.046%(+1.31)#77 |
| 78. | Elmwood Park | 1.33% | 0.15%(+1.18)#18 | 0.046%(+1.28)#78 |
| 79. | Westlake | 1.32% | 0.082%(+1.23)#6 | 0.046%(+1.27)#79 |
| 80. | Bedford | 1.31% | 0.046%(+1.26)#4 | 0.046%(+1.26)#80 |
| 81. | Fairview Park | 1.30% | 0.082%(+1.21)#7 | 0.046%(+1.25)#81 |
| 82. | St Francis | 1.29% | 0.044%(+1.25)#1 | 0.046%(+1.25)#82 |
| 83. | Scaggsville | 1.28% | 0.046%(+1.23)#3 | 0.046%(+1.23)#83 |
| 84. | Point | 1.28% | 0.046%(+1.23)#5 | 0.046%(+1.23)#84 |
| 85. | Alafaya | 1.28% | 0.046%(+1.23)#2 | 0.046%(+1.23)#85 |
| 86. | Franklin | 1.27% | 0.044%(+1.23)#2 | 0.046%(+1.22)#86 |
| 87. | San Antonio Comunidad Quebradillas Municipio | 1.26% | 0.017%(+1.24)#2 | 0.046%(+1.22)#87 |
| 88. | Josephine | 1.26% | 0.046%(+1.21)#6 | 0.046%(+1.21)#88 |
| 89. | Stoneham | 1.24% | 0.031%(+1.21)#3 | 0.046%(+1.20)#89 |
| 90. | Thonotosassa | 1.23% | 0.046%(+1.19)#3 | 0.046%(+1.19)#90 |
| 91. | Gray | 1.23% | 0.022%(+1.21)#2 | 0.046%(+1.18)#91 |
| 92. | Somers | 1.20% | 0.044%(+1.16)#3 | 0.046%(+1.16)#92 |
| 93. | Tysons | 1.20% | 0.051%(+1.15)#3 | 0.046%(+1.15)#93 |
| 94. | Crestwood | 1.19% | 0.15%(+1.04)#19 | 0.046%(+1.15)#94 |
| 95. | Dunthorpe | 1.19% | 0.022%(+1.17)#1 | 0.046%(+1.14)#95 |
| 96. | Tiburon | 1.15% | 0.066%(+1.09)#7 | 0.046%(+1.11)#96 |
| 97. | Oak Forest | 1.15% | 0.15%(+0.995)#20 | 0.046%(+1.10)#97 |
| 98. | Manchester | 1.15% | 0.037%(+1.11)#1 | 0.046%(+1.10)#98 |
| 99. | Chalmette | 1.14% | 0.070%(+1.07)#2 | 0.046%(+1.10)#99 |
| 100. | Savoy | 1.13% | 0.15%(+0.976)#21 | 0.046%(+1.08)#100 |
Common Questions
What are the Top 10 Cities with the Highest Percentage of Palestinian Population in the United States?
Top 10 Cities with the Highest Percentage of Palestinian Population in the United States are:
#1
16.95%
#2
14.95%
#3
11.79%
#4
7.03%
#5
6.31%
#6
6.22%
#7
6.20%
#8
5.98%
#9
5.47%
#10
5.27%
What city has the Highest Percentage of Palestinian Population in the United States?
Junction has the Highest Percentage of Palestinian Population in the United States with 16.95%.
What is the Percentage of Palestinian Population in the United States?
Percentage of Palestinian Population in the United States is 0.046%.