Cities with the Most Immigrants from Belgium in Texas
RELATED REPORTS & OPTIONS
Belgium
Texas
Compare Cities
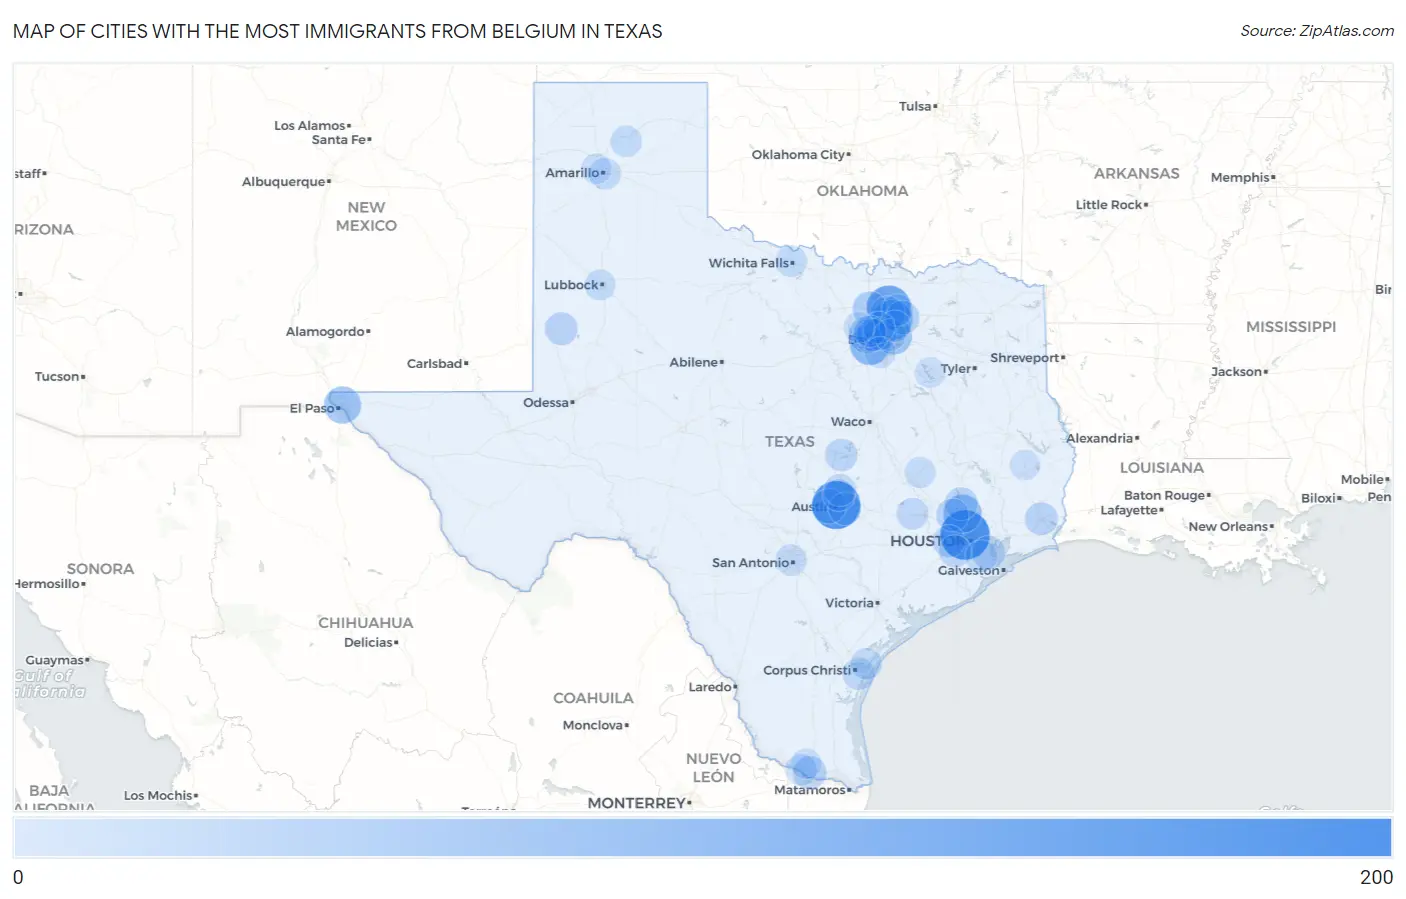
Map of Cities with the Most Immigrants from Belgium in Texas
0
200
Cities with the Most Immigrants from Belgium in Texas
| City | Belgium | vs State | vs National | |
| 1. | Houston | 165 | 1,892(8.72%)#1 | 34,732(0.48%)#17 |
| 2. | Austin | 153 | 1,892(8.09%)#2 | 34,732(0.44%)#20 |
| 3. | Prosper | 117 | 1,892(6.18%)#3 | 34,732(0.34%)#31 |
| 4. | Plano | 85 | 1,892(4.49%)#4 | 34,732(0.24%)#52 |
| 5. | Arlington | 80 | 1,892(4.23%)#5 | 34,732(0.23%)#55 |
| 6. | The Woodlands | 68 | 1,892(3.59%)#6 | 34,732(0.20%)#69 |
| 7. | El Paso | 58 | 1,892(3.07%)#7 | 34,732(0.17%)#89 |
| 8. | Hurst | 56 | 1,892(2.96%)#8 | 34,732(0.16%)#95 |
| 9. | Dallas | 54 | 1,892(2.85%)#9 | 34,732(0.16%)#99 |
| 10. | Frisco | 38 | 1,892(2.01%)#10 | 34,732(0.11%)#138 |
| 11. | Barton Creek | 36 | 1,892(1.90%)#11 | 34,732(0.10%)#158 |
| 12. | Denton | 35 | 1,892(1.85%)#12 | 34,732(0.10%)#161 |
| 13. | Bedford | 30 | 1,892(1.59%)#13 | 34,732(0.09%)#195 |
| 14. | Lucas | 28 | 1,892(1.48%)#14 | 34,732(0.08%)#218 |
| 15. | Pharr | 26 | 1,892(1.37%)#15 | 34,732(0.07%)#231 |
| 16. | El Lago | 25 | 1,892(1.32%)#16 | 34,732(0.07%)#242 |
| 17. | Irving | 24 | 1,892(1.27%)#17 | 34,732(0.07%)#244 |
| 18. | Beaumont | 22 | 1,892(1.16%)#18 | 34,732(0.06%)#269 |
| 19. | Conroe | 22 | 1,892(1.16%)#19 | 34,732(0.06%)#270 |
| 20. | Seagraves | 22 | 1,892(1.16%)#20 | 34,732(0.06%)#284 |
| 21. | Stagecoach | 21 | 1,892(1.11%)#21 | 34,732(0.06%)#299 |
| 22. | Hornsby Bend | 20 | 1,892(1.06%)#22 | 34,732(0.06%)#313 |
| 23. | Harker Heights | 18 | 1,892(0.95%)#23 | 34,732(0.05%)#350 |
| 24. | Cinco Ranch | 17 | 1,892(0.90%)#24 | 34,732(0.05%)#375 |
| 25. | Sugar Land | 16 | 1,892(0.85%)#25 | 34,732(0.05%)#385 |
| 26. | Corpus Christi | 15 | 1,892(0.79%)#26 | 34,732(0.04%)#406 |
| 27. | Round Rock | 15 | 1,892(0.79%)#27 | 34,732(0.04%)#412 |
| 28. | Euless | 15 | 1,892(0.79%)#28 | 34,732(0.04%)#416 |
| 29. | Friendswood | 15 | 1,892(0.79%)#29 | 34,732(0.04%)#421 |
| 30. | Brenham | 14 | 1,892(0.74%)#30 | 34,732(0.04%)#464 |
| 31. | Wells Branch | 14 | 1,892(0.74%)#31 | 34,732(0.04%)#469 |
| 32. | Amarillo | 12 | 1,892(0.63%)#32 | 34,732(0.03%)#510 |
| 33. | Wichita Falls | 12 | 1,892(0.63%)#33 | 34,732(0.03%)#519 |
| 34. | Mission | 12 | 1,892(0.63%)#34 | 34,732(0.03%)#520 |
| 35. | University Park | 12 | 1,892(0.63%)#35 | 34,732(0.03%)#529 |
| 36. | Mckinney | 11 | 1,892(0.58%)#36 | 34,732(0.03%)#550 |
| 37. | Ingleside | 11 | 1,892(0.58%)#37 | 34,732(0.03%)#568 |
| 38. | Richardson | 10 | 1,892(0.53%)#38 | 34,732(0.03%)#588 |
| 39. | Coppell | 10 | 1,892(0.53%)#39 | 34,732(0.03%)#601 |
| 40. | Colleyville | 10 | 1,892(0.53%)#40 | 34,732(0.03%)#607 |
| 41. | Borger | 10 | 1,892(0.53%)#41 | 34,732(0.03%)#615 |
| 42. | San Antonio | 9 | 1,892(0.48%)#42 | 34,732(0.03%)#640 |
| 43. | Cedar Hill | 8 | 1,892(0.42%)#43 | 34,732(0.02%)#705 |
| 44. | Lubbock | 7 | 1,892(0.37%)#44 | 34,732(0.02%)#752 |
| 45. | Kurten | 7 | 1,892(0.37%)#45 | 34,732(0.02%)#797 |
| 46. | Payne Springs | 4 | 1,892(0.21%)#46 | 34,732(0.01%)#897 |
| 47. | Haslet | 3 | 1,892(0.16%)#47 | 34,732(0.01%)#915 |
| 48. | Colmesneil | 3 | 1,892(0.16%)#48 | 34,732(0.01%)#925 |
| 49. | Mcallen | 2 | 1,892(0.11%)#49 | 34,732(0.01%)#930 |
| 50. | Bishop Hills | 2 | 1,892(0.11%)#50 | 34,732(0.01%)#956 |
Common Questions
What are the Top 10 Cities with the Most Immigrants from Belgium in Texas?
Top 10 Cities with the Most Immigrants from Belgium in Texas are:
What city has the Most Immigrants from Belgium in Texas?
Houston has the Most Immigrants from Belgium in Texas with 165.
What is the Total Immigrants from Belgium in the State of Texas?
Total Immigrants from Belgium in Texas is 1,892.
What is the Total Immigrants from Belgium in the United States?
Total Immigrants from Belgium in the United States is 34,732.