Cities with the Highest Percentage of Immigrants from Switzerland in Colorado
RELATED REPORTS & OPTIONS
Switzerland
Colorado
Compare Cities
Map of Cities with the Highest Percentage of Immigrants from Switzerland in Colorado
0.00%
4.00%
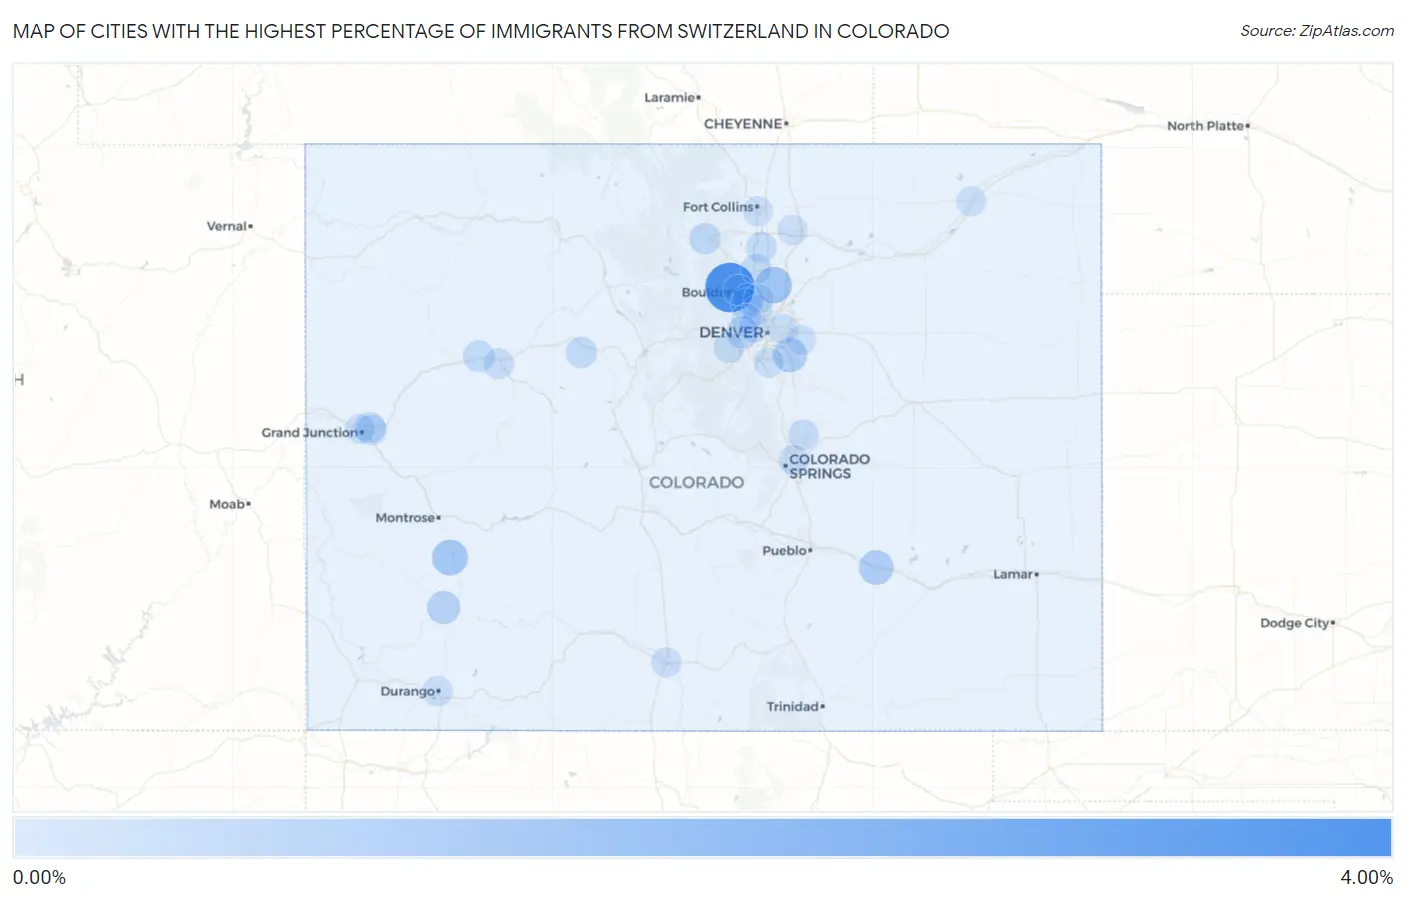
Cities with the Highest Percentage of Immigrants from Switzerland in Colorado
| City | Switzerland | vs State | vs National | |
| 1. | Pine Brook Hill | 3.65% | 0.024%(+3.62)#1 | 0.011%(+3.64)#5 |
| 2. | Dacono | 1.15% | 0.024%(+1.13)#2 | 0.011%(+1.14)#30 |
| 3. | Loghill Village | 1.04% | 0.024%(+1.02)#3 | 0.011%(+1.03)#37 |
| 4. | Fowler | 0.81% | 0.024%(+0.784)#4 | 0.011%(+0.796)#48 |
| 5. | Foxfield | 0.74% | 0.024%(+0.719)#5 | 0.011%(+0.732)#53 |
| 6. | Ophir | 0.56% | 0.024%(+0.532)#6 | 0.011%(+0.544)#72 |
| 7. | Golden | 0.39% | 0.024%(+0.363)#7 | 0.011%(+0.375)#120 |
| 8. | New Castle | 0.27% | 0.024%(+0.243)#8 | 0.011%(+0.255)#185 |
| 9. | Estes Park | 0.22% | 0.024%(+0.197)#9 | 0.011%(+0.209)#220 |
| 10. | Edwards | 0.21% | 0.024%(+0.191)#10 | 0.011%(+0.203)#229 |
| 11. | Louisville | 0.19% | 0.024%(+0.163)#11 | 0.011%(+0.175)#259 |
| 12. | Berthoud | 0.16% | 0.024%(+0.133)#12 | 0.011%(+0.145)#311 |
| 13. | Fruitvale | 0.15% | 0.024%(+0.126)#13 | 0.011%(+0.138)#322 |
| 14. | Clifton | 0.13% | 0.024%(+0.105)#14 | 0.011%(+0.117)#359 |
| 15. | Evergreen | 0.12% | 0.024%(+0.099)#15 | 0.011%(+0.111)#370 |
| 16. | Superior | 0.12% | 0.024%(+0.098)#16 | 0.011%(+0.110)#375 |
| 17. | Longmont | 0.11% | 0.024%(+0.084)#17 | 0.011%(+0.097)#397 |
| 18. | Glenwood Springs | 0.099% | 0.024%(+0.075)#18 | 0.011%(+0.088)#410 |
| 19. | Black Forest | 0.097% | 0.024%(+0.073)#19 | 0.011%(+0.086)#420 |
| 20. | Four Square Mile | 0.084% | 0.024%(+0.060)#20 | 0.011%(+0.073)#462 |
| 21. | Boulder | 0.066% | 0.024%(+0.042)#21 | 0.011%(+0.054)#523 |
| 22. | Colorado Springs | 0.063% | 0.024%(+0.039)#22 | 0.011%(+0.052)#536 |
| 23. | Durango | 0.052% | 0.024%(+0.029)#23 | 0.011%(+0.041)#583 |
| 24. | Alamosa | 0.051% | 0.024%(+0.028)#24 | 0.011%(+0.040)#590 |
| 25. | Wheat Ridge | 0.034% | 0.024%(+0.011)#25 | 0.011%(+0.023)#700 |
| 26. | Denver | 0.028% | 0.024%(+0.004)#26 | 0.011%(+0.017)#762 |
| 27. | Grand Junction | 0.026% | 0.024%(+0.002)#27 | 0.011%(+0.014)#783 |
| 28. | Fort Collins | 0.020% | 0.024%(-0.003)#28 | 0.011%(+0.009)#841 |
| 29. | Westminster | 0.019% | 0.024%(-0.005)#29 | 0.011%(+0.008)#855 |
| 30. | Sterling | 0.015% | 0.024%(-0.009)#30 | 0.011%(+0.004)#899 |
| 31. | Highlands Ranch | 0.011% | 0.024%(-0.013)#31 | 0.011%(-0.000)#942 |
| 32. | Broomfield | 0.0081% | 0.024%(-0.015)#32 | 0.011%(-0.003)#975 |
| 33. | Aurora | 0.0067% | 0.024%(-0.017)#33 | 0.011%(-0.005)#994 |
| 34. | Arvada | 0.0065% | 0.024%(-0.017)#34 | 0.011%(-0.005)#997 |
| 35. | Greeley | 0.0065% | 0.024%(-0.017)#35 | 0.011%(-0.005)#998 |
Common Questions
What are the Top 10 Cities with the Highest Percentage of Immigrants from Switzerland in Colorado?
Top 10 Cities with the Highest Percentage of Immigrants from Switzerland in Colorado are:
#1
3.65%
#2
1.15%
#3
1.04%
#4
0.81%
#5
0.74%
#6
0.56%
#7
0.39%
#8
0.27%
#9
0.22%
#10
0.21%
What city has the Highest Percentage of Immigrants from Switzerland in Colorado?
Pine Brook Hill has the Highest Percentage of Immigrants from Switzerland in Colorado with 3.65%.
What is the Percentage of Immigrants from Switzerland in the State of Colorado?
Percentage of Immigrants from Switzerland in Colorado is 0.024%.
What is the Percentage of Immigrants from Switzerland in the United States?
Percentage of Immigrants from Switzerland in the United States is 0.011%.