Cities with the Highest Percentage of Immigrants from Switzerland in Florida
RELATED REPORTS & OPTIONS
Switzerland
Florida
Compare Cities
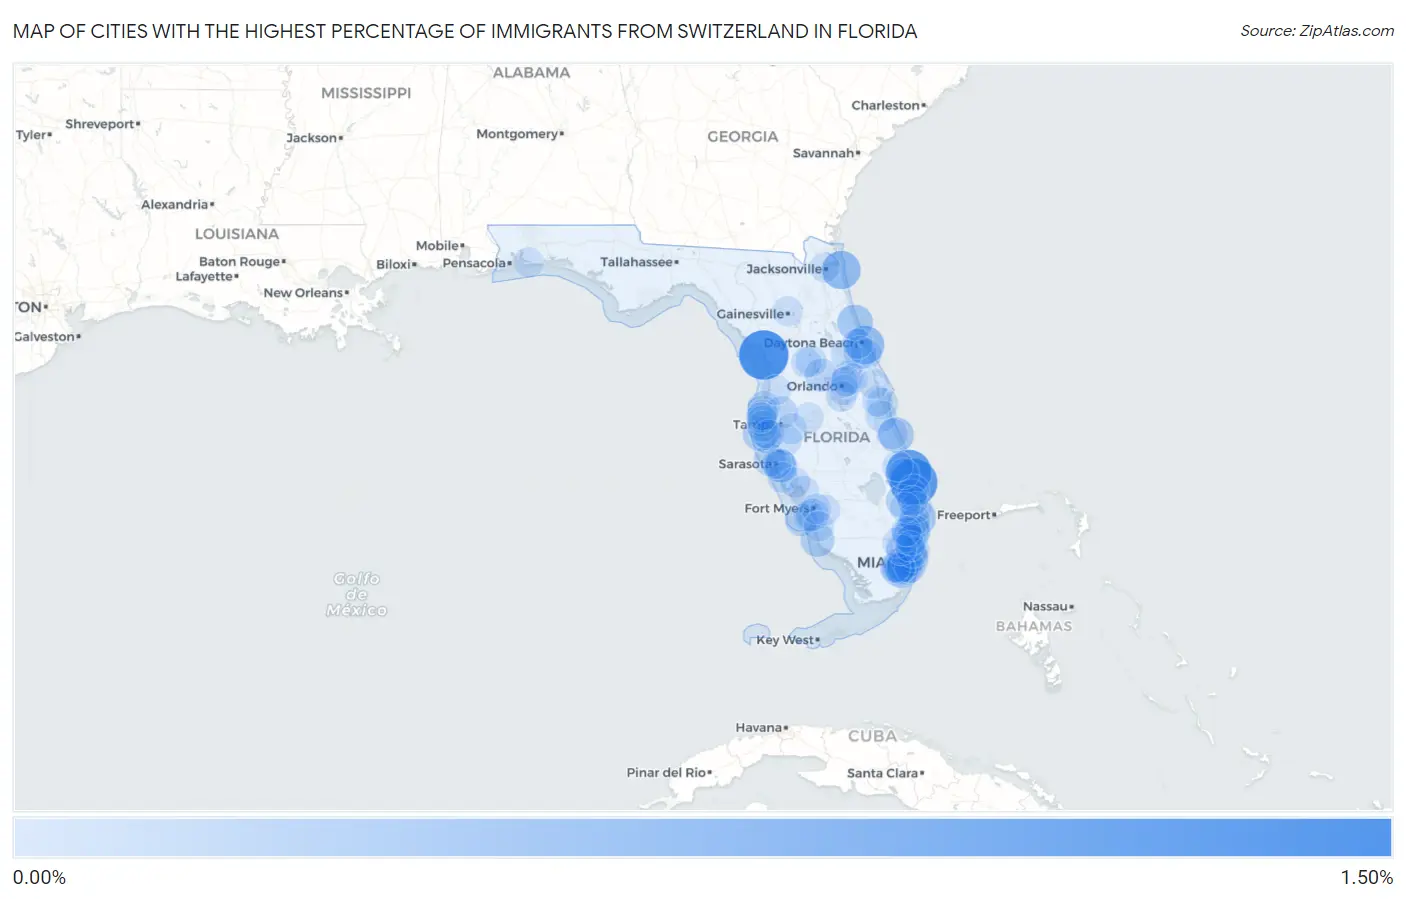
Map of Cities with the Highest Percentage of Immigrants from Switzerland in Florida
0.00%
1.50%
Cities with the Highest Percentage of Immigrants from Switzerland in Florida
| City | Switzerland | vs State | vs National | |
| 1. | Yankeetown | 1.43% | 0.015%(+1.42)#1 | 0.011%(+1.42)#16 |
| 2. | Jupiter Island | 1.27% | 0.015%(+1.25)#2 | 0.011%(+1.26)#24 |
| 3. | Sewall S Point | 1.14% | 0.015%(+1.13)#3 | 0.011%(+1.13)#31 |
| 4. | Daytona Beach Shores | 0.61% | 0.015%(+0.594)#4 | 0.011%(+0.598)#64 |
| 5. | Neptune Beach | 0.61% | 0.015%(+0.593)#5 | 0.011%(+0.597)#65 |
| 6. | Olympia Heights | 0.49% | 0.015%(+0.476)#6 | 0.011%(+0.481)#88 |
| 7. | Gulf Stream | 0.47% | 0.015%(+0.456)#7 | 0.011%(+0.460)#96 |
| 8. | Beverly Beach | 0.40% | 0.015%(+0.389)#8 | 0.011%(+0.393)#110 |
| 9. | Orchid | 0.37% | 0.015%(+0.357)#9 | 0.011%(+0.361)#124 |
| 10. | Redington Beach | 0.30% | 0.015%(+0.288)#10 | 0.011%(+0.292)#158 |
| 11. | Aventura | 0.27% | 0.015%(+0.255)#11 | 0.011%(+0.259)#181 |
| 12. | Naples | 0.27% | 0.015%(+0.254)#12 | 0.011%(+0.258)#183 |
| 13. | South Miami | 0.23% | 0.015%(+0.219)#13 | 0.011%(+0.223)#206 |
| 14. | Westlake | 0.22% | 0.015%(+0.200)#14 | 0.011%(+0.204)#226 |
| 15. | Samsula Spruce Creek | 0.21% | 0.015%(+0.199)#15 | 0.011%(+0.203)#230 |
| 16. | Astatula | 0.19% | 0.015%(+0.179)#16 | 0.011%(+0.183)#252 |
| 17. | Palmer Ranch | 0.19% | 0.015%(+0.174)#17 | 0.011%(+0.178)#255 |
| 18. | The Crossings | 0.18% | 0.015%(+0.165)#18 | 0.011%(+0.169)#271 |
| 19. | Sanibel | 0.17% | 0.015%(+0.156)#19 | 0.011%(+0.160)#287 |
| 20. | Bee Ridge | 0.17% | 0.015%(+0.153)#20 | 0.011%(+0.158)#292 |
| 21. | Beacon Square | 0.16% | 0.015%(+0.148)#21 | 0.011%(+0.152)#296 |
| 22. | Boca Raton | 0.16% | 0.015%(+0.148)#22 | 0.011%(+0.152)#297 |
| 23. | Cypress Lake | 0.16% | 0.015%(+0.147)#23 | 0.011%(+0.151)#299 |
| 24. | Lake Sarasota | 0.16% | 0.015%(+0.147)#24 | 0.011%(+0.151)#301 |
| 25. | Lutz | 0.16% | 0.015%(+0.146)#25 | 0.011%(+0.150)#303 |
| 26. | Longboat Key | 0.16% | 0.015%(+0.145)#26 | 0.011%(+0.149)#306 |
| 27. | Miami Beach | 0.15% | 0.015%(+0.134)#27 | 0.011%(+0.138)#323 |
| 28. | Wilton Manors | 0.12% | 0.015%(+0.107)#28 | 0.011%(+0.111)#371 |
| 29. | Coral Gables | 0.12% | 0.015%(+0.105)#29 | 0.011%(+0.109)#376 |
| 30. | Palmetto Bay | 0.12% | 0.015%(+0.104)#30 | 0.011%(+0.108)#379 |
| 31. | Glenvar Heights | 0.11% | 0.015%(+0.096)#31 | 0.011%(+0.100)#391 |
| 32. | Tarpon Springs | 0.11% | 0.015%(+0.091)#32 | 0.011%(+0.095)#398 |
| 33. | Merritt Island | 0.093% | 0.015%(+0.078)#33 | 0.011%(+0.082)#431 |
| 34. | Palm Beach Gardens | 0.091% | 0.015%(+0.076)#34 | 0.011%(+0.080)#437 |
| 35. | West Melbourne | 0.090% | 0.015%(+0.074)#35 | 0.011%(+0.078)#442 |
| 36. | Deerfield Beach | 0.088% | 0.015%(+0.072)#36 | 0.011%(+0.077)#449 |
| 37. | Margate | 0.087% | 0.015%(+0.072)#37 | 0.011%(+0.076)#450 |
| 38. | Lighthouse Point | 0.086% | 0.015%(+0.070)#38 | 0.011%(+0.074)#456 |
| 39. | Bay Harbor Islands | 0.086% | 0.015%(+0.070)#39 | 0.011%(+0.074)#458 |
| 40. | Lady Lake | 0.081% | 0.015%(+0.066)#40 | 0.011%(+0.070)#474 |
| 41. | Sun City Center | 0.079% | 0.015%(+0.063)#41 | 0.011%(+0.067)#480 |
| 42. | Bloomingdale | 0.075% | 0.015%(+0.059)#42 | 0.011%(+0.063)#490 |
| 43. | Winter Springs | 0.071% | 0.015%(+0.055)#43 | 0.011%(+0.059)#505 |
| 44. | Lakewood Ranch | 0.070% | 0.015%(+0.054)#44 | 0.011%(+0.059)#509 |
| 45. | New Smyrna Beach | 0.069% | 0.015%(+0.053)#45 | 0.011%(+0.058)#513 |
| 46. | Gulfport | 0.068% | 0.015%(+0.052)#46 | 0.011%(+0.056)#517 |
| 47. | Clearwater | 0.063% | 0.015%(+0.048)#47 | 0.011%(+0.052)#533 |
| 48. | West Lealman | 0.063% | 0.015%(+0.048)#48 | 0.011%(+0.052)#535 |
| 49. | Rockledge | 0.058% | 0.015%(+0.042)#49 | 0.011%(+0.046)#555 |
| 50. | Lake Clarke Shores | 0.056% | 0.015%(+0.041)#50 | 0.011%(+0.045)#564 |
| 51. | Iona | 0.056% | 0.015%(+0.040)#51 | 0.011%(+0.045)#565 |
| 52. | Ojus | 0.055% | 0.015%(+0.039)#52 | 0.011%(+0.043)#573 |
| 53. | Deland | 0.055% | 0.015%(+0.039)#53 | 0.011%(+0.043)#574 |
| 54. | Miami | 0.053% | 0.015%(+0.037)#54 | 0.011%(+0.041)#582 |
| 55. | Fruitville | 0.052% | 0.015%(+0.037)#55 | 0.011%(+0.041)#584 |
| 56. | Coconut Creek | 0.052% | 0.015%(+0.037)#56 | 0.011%(+0.041)#586 |
| 57. | Sebastian | 0.051% | 0.015%(+0.036)#57 | 0.011%(+0.040)#587 |
| 58. | Sunset | 0.050% | 0.015%(+0.035)#58 | 0.011%(+0.039)#592 |
| 59. | Lake Worth Beach | 0.050% | 0.015%(+0.034)#59 | 0.011%(+0.038)#597 |
| 60. | Key Biscayne | 0.048% | 0.015%(+0.033)#60 | 0.011%(+0.037)#607 |
| 61. | Venice | 0.047% | 0.015%(+0.031)#61 | 0.011%(+0.035)#616 |
| 62. | Largo | 0.046% | 0.015%(+0.031)#62 | 0.011%(+0.035)#620 |
| 63. | Jupiter | 0.043% | 0.015%(+0.027)#63 | 0.011%(+0.031)#641 |
| 64. | Punta Gorda | 0.041% | 0.015%(+0.025)#64 | 0.011%(+0.029)#654 |
| 65. | Oviedo | 0.040% | 0.015%(+0.025)#65 | 0.011%(+0.029)#656 |
| 66. | Southchase | 0.039% | 0.015%(+0.023)#66 | 0.011%(+0.027)#668 |
| 67. | Palm City | 0.039% | 0.015%(+0.023)#67 | 0.011%(+0.027)#669 |
| 68. | Palm Harbor | 0.031% | 0.015%(+0.015)#68 | 0.011%(+0.020)#728 |
| 69. | The Villages | 0.028% | 0.015%(+0.012)#69 | 0.011%(+0.016)#763 |
| 70. | Sunny Isles Beach | 0.027% | 0.015%(+0.012)#70 | 0.011%(+0.016)#769 |
| 71. | Pembroke Pines | 0.026% | 0.015%(+0.010)#71 | 0.011%(+0.014)#781 |
| 72. | Orlando | 0.026% | 0.015%(+0.010)#72 | 0.011%(+0.014)#786 |
| 73. | Kendall | 0.026% | 0.015%(+0.010)#73 | 0.011%(+0.014)#789 |
| 74. | Lehigh Acres | 0.024% | 0.015%(+0.009)#74 | 0.011%(+0.013)#799 |
| 75. | Tamarac | 0.024% | 0.015%(+0.008)#75 | 0.011%(+0.012)#803 |
| 76. | St Petersburg | 0.023% | 0.015%(+0.008)#76 | 0.011%(+0.012)#812 |
| 77. | Fort Myers | 0.023% | 0.015%(+0.007)#77 | 0.011%(+0.011)#820 |
| 78. | Weston | 0.022% | 0.015%(+0.007)#78 | 0.011%(+0.011)#824 |
| 79. | Delray Beach | 0.021% | 0.015%(+0.006)#79 | 0.011%(+0.010)#831 |
| 80. | Daytona Beach | 0.020% | 0.015%(+0.005)#80 | 0.011%(+0.009)#836 |
| 81. | Winter Park | 0.020% | 0.015%(+0.005)#81 | 0.011%(+0.009)#843 |
| 82. | Kendall West | 0.020% | 0.015%(+0.004)#82 | 0.011%(+0.008)#846 |
| 83. | Fort Lauderdale | 0.018% | 0.015%(+0.002)#83 | 0.011%(+0.006)#872 |
| 84. | Port St Lucie | 0.017% | 0.015%(+0.002)#84 | 0.011%(+0.006)#877 |
| 85. | West Palm Beach | 0.017% | 0.015%(+0.002)#85 | 0.011%(+0.006)#880 |
| 86. | Goldenrod | 0.016% | 0.015%(+0.001)#86 | 0.011%(+0.005)#886 |
| 87. | Wellington | 0.015% | 0.015%(-0.001)#87 | 0.011%(+0.003)#903 |
| 88. | North Port | 0.013% | 0.015%(-0.002)#88 | 0.011%(+0.002)#918 |
| 89. | Titusville | 0.012% | 0.015%(-0.003)#89 | 0.011%(+0.001)#926 |
| 90. | Gainesville | 0.012% | 0.015%(-0.004)#90 | 0.011%(+0.001)#928 |
| 91. | Miramar | 0.012% | 0.015%(-0.004)#91 | 0.011%(+0.001)#930 |
| 92. | Lakeland | 0.011% | 0.015%(-0.004)#92 | 0.011%(+0.000)#937 |
| 93. | Bonita Springs | 0.011% | 0.015%(-0.004)#93 | 0.011%(-0.000)#938 |
| 94. | Sarasota | 0.0090% | 0.015%(-0.006)#94 | 0.011%(-0.002)#965 |
| 95. | Hollywood | 0.0072% | 0.015%(-0.008)#95 | 0.011%(-0.004)#985 |
| 96. | Spring Hill | 0.0060% | 0.015%(-0.009)#96 | 0.011%(-0.005)#1,003 |
| 97. | Dunedin | 0.0055% | 0.015%(-0.010)#97 | 0.011%(-0.006)#1,006 |
| 98. | Navarre | 0.0051% | 0.015%(-0.010)#98 | 0.011%(-0.006)#1,011 |
| 99. | Coral Springs | 0.0045% | 0.015%(-0.011)#99 | 0.011%(-0.007)#1,022 |
| 100. | Jacksonville | 0.0014% | 0.015%(-0.014)#100 | 0.011%(-0.010)#1,049 |
Common Questions
What are the Top 10 Cities with the Highest Percentage of Immigrants from Switzerland in Florida?
Top 10 Cities with the Highest Percentage of Immigrants from Switzerland in Florida are:
#1
1.43%
#2
1.27%
#3
1.14%
#4
0.61%
#5
0.61%
#6
0.49%
#7
0.47%
#8
0.40%
#9
0.37%
#10
0.30%
What city has the Highest Percentage of Immigrants from Switzerland in Florida?
Yankeetown has the Highest Percentage of Immigrants from Switzerland in Florida with 1.43%.
What is the Percentage of Immigrants from Switzerland in the State of Florida?
Percentage of Immigrants from Switzerland in Florida is 0.015%.
What is the Percentage of Immigrants from Switzerland in the United States?
Percentage of Immigrants from Switzerland in the United States is 0.011%.