Fort Johnson, NY Map & Demographics
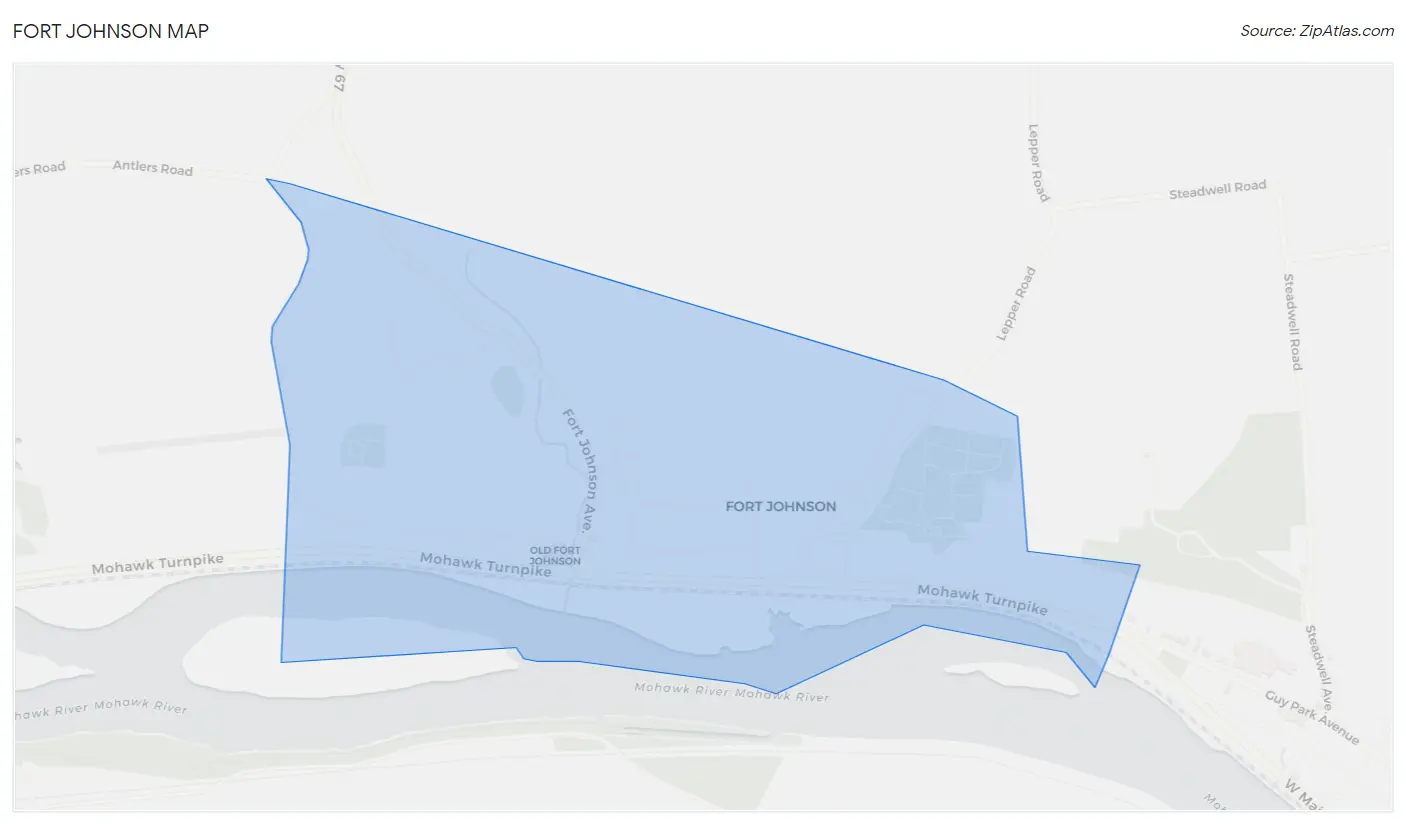
Fort Johnson Map
Fort Johnson Overview
$35,309
PER CAPITA INCOME
$75,250
AVG FAMILY INCOME
$61,071
AVG HOUSEHOLD INCOME
5.0%
WAGE / INCOME GAP [ % ]
95.0¢/ $1
WAGE / INCOME GAP [ $ ]
0.41
INEQUALITY / GINI INDEX
510
TOTAL POPULATION
267
MALE POPULATION
243
FEMALE POPULATION
109.88
MALES / 100 FEMALES
91.01
FEMALES / 100 MALES
39.6
MEDIAN AGE
3.5
AVG FAMILY SIZE
2.6
AVG HOUSEHOLD SIZE
267
LABOR FORCE [ PEOPLE ]
64.3%
PERCENT IN LABOR FORCE
10.6%
UNEMPLOYMENT RATE
Fort Johnson Zip Codes
Fort Johnson Area Codes
Income in Fort Johnson
Income Overview in Fort Johnson
Per Capita Income in Fort Johnson is $35,309, while median incomes of families and households are $75,250 and $61,071 respectively.
| Characteristic | Number | Measure |
| Per Capita Income | 510 | $35,309 |
| Median Family Income | 117 | $75,250 |
| Mean Family Income | 117 | $103,095 |
| Median Household Income | 196 | $61,071 |
| Mean Household Income | 196 | $88,933 |
| Income Deficit | 117 | $0 |
| Wage / Income Gap (%) | 510 | 4.96% |
| Wage / Income Gap ($) | 510 | 95.04¢ per $1 |
| Gini / Inequality Index | 510 | 0.41 |
Earnings by Sex in Fort Johnson
Average Earnings in Fort Johnson are $45,750, $44,671 for men and $47,000 for women, a difference of 5.0%.
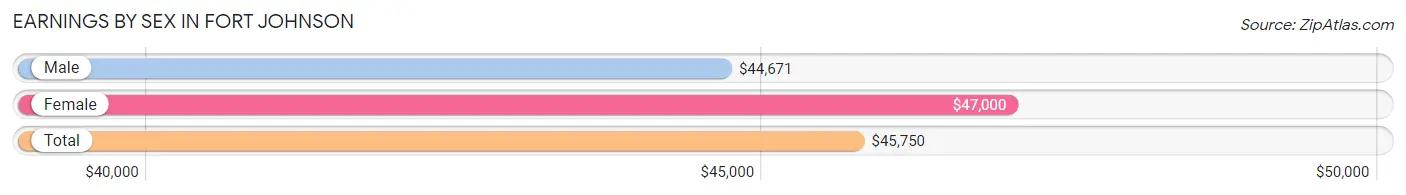
| Sex | Number | Average Earnings |
| Male | 149 (54.6%) | $44,671 |
| Female | 124 (45.4%) | $47,000 |
| Total | 273 (100.0%) | $45,750 |
Earnings by Sex by Income Bracket in Fort Johnson
The most common earnings brackets in Fort Johnson are $100,000+ for men (29 | 19.5%) and $55,000 to $64,999 for women (28 | 22.6%).
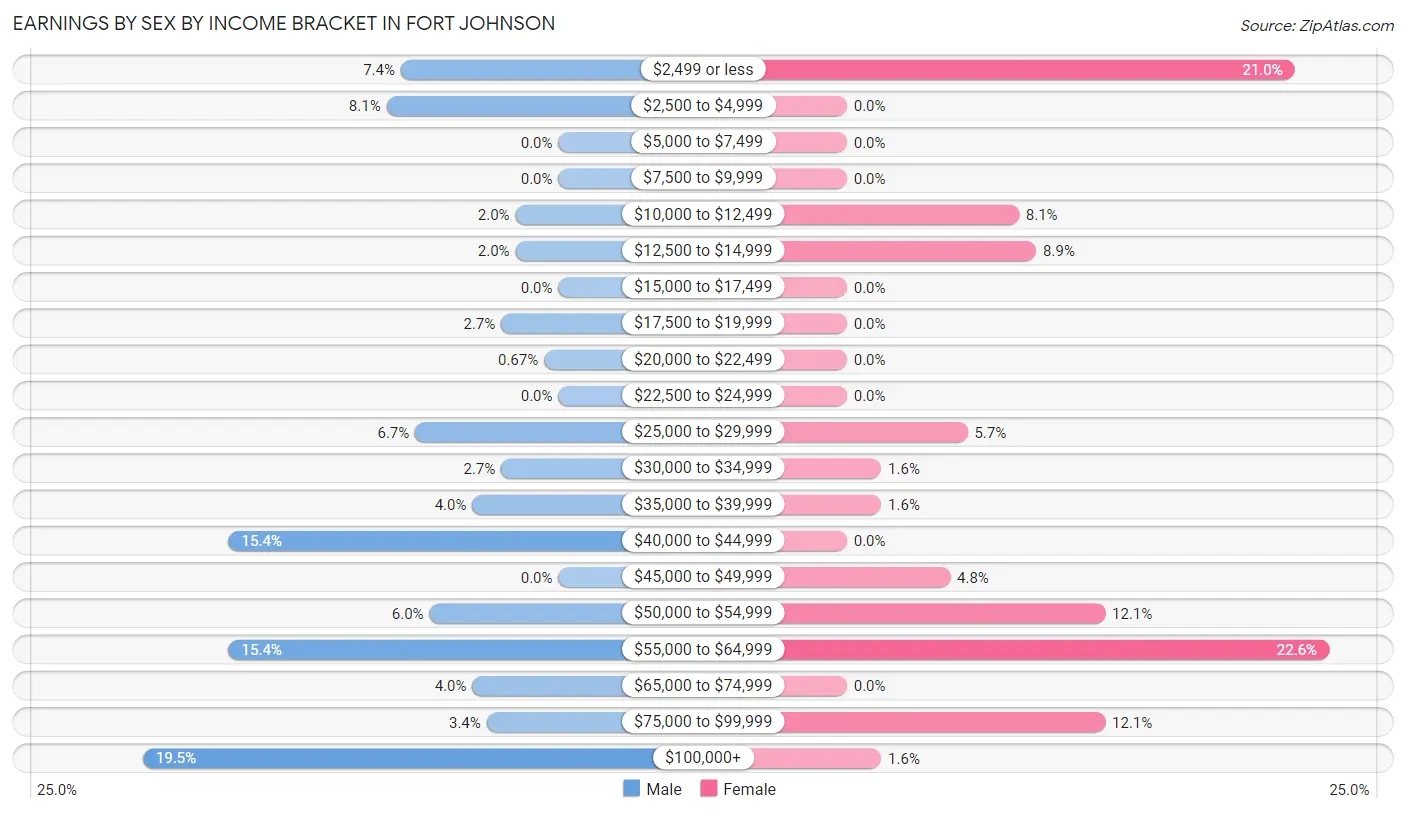
| Income | Male | Female |
| $2,499 or less | 11 (7.4%) | 26 (21.0%) |
| $2,500 to $4,999 | 12 (8.1%) | 0 (0.0%) |
| $5,000 to $7,499 | 0 (0.0%) | 0 (0.0%) |
| $7,500 to $9,999 | 0 (0.0%) | 0 (0.0%) |
| $10,000 to $12,499 | 3 (2.0%) | 10 (8.1%) |
| $12,500 to $14,999 | 3 (2.0%) | 11 (8.9%) |
| $15,000 to $17,499 | 0 (0.0%) | 0 (0.0%) |
| $17,500 to $19,999 | 4 (2.7%) | 0 (0.0%) |
| $20,000 to $22,499 | 1 (0.7%) | 0 (0.0%) |
| $22,500 to $24,999 | 0 (0.0%) | 0 (0.0%) |
| $25,000 to $29,999 | 10 (6.7%) | 7 (5.7%) |
| $30,000 to $34,999 | 4 (2.7%) | 2 (1.6%) |
| $35,000 to $39,999 | 6 (4.0%) | 2 (1.6%) |
| $40,000 to $44,999 | 23 (15.4%) | 0 (0.0%) |
| $45,000 to $49,999 | 0 (0.0%) | 6 (4.8%) |
| $50,000 to $54,999 | 9 (6.0%) | 15 (12.1%) |
| $55,000 to $64,999 | 23 (15.4%) | 28 (22.6%) |
| $65,000 to $74,999 | 6 (4.0%) | 0 (0.0%) |
| $75,000 to $99,999 | 5 (3.4%) | 15 (12.1%) |
| $100,000+ | 29 (19.5%) | 2 (1.6%) |
| Total | 149 (100.0%) | 124 (100.0%) |
Earnings by Sex by Educational Attainment in Fort Johnson
Average earnings in Fort Johnson are $51,667 for men and $51,923 for women, a difference of 0.5%. Men with an educational attainment of bachelor's degree enjoy the highest average annual earnings of $59,250, while those with graduate degree education earn the least with $43,618. Women with an educational attainment of graduate degree earn the most with the average annual earnings of $64,583, while those with high school diploma education have the smallest earnings of $50,865.
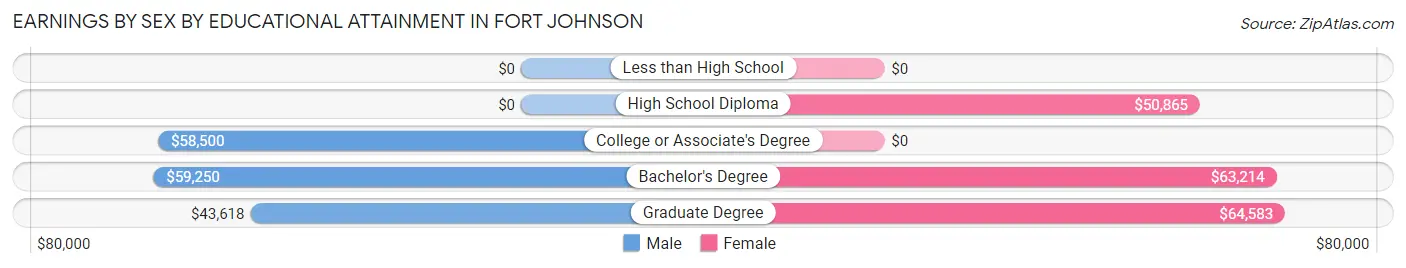
| Educational Attainment | Male Income | Female Income |
| Less than High School | - | - |
| High School Diploma | - | - |
| College or Associate's Degree | $58,500 | $0 |
| Bachelor's Degree | $59,250 | $63,214 |
| Graduate Degree | $43,618 | $64,583 |
| Total | $51,667 | $51,923 |
Family Income in Fort Johnson
Family Income Brackets in Fort Johnson
According to the Fort Johnson family income data, there are 27 families falling into the $100,000 to $149,999 income range, which is the most common income bracket and makes up 23.1% of all families.
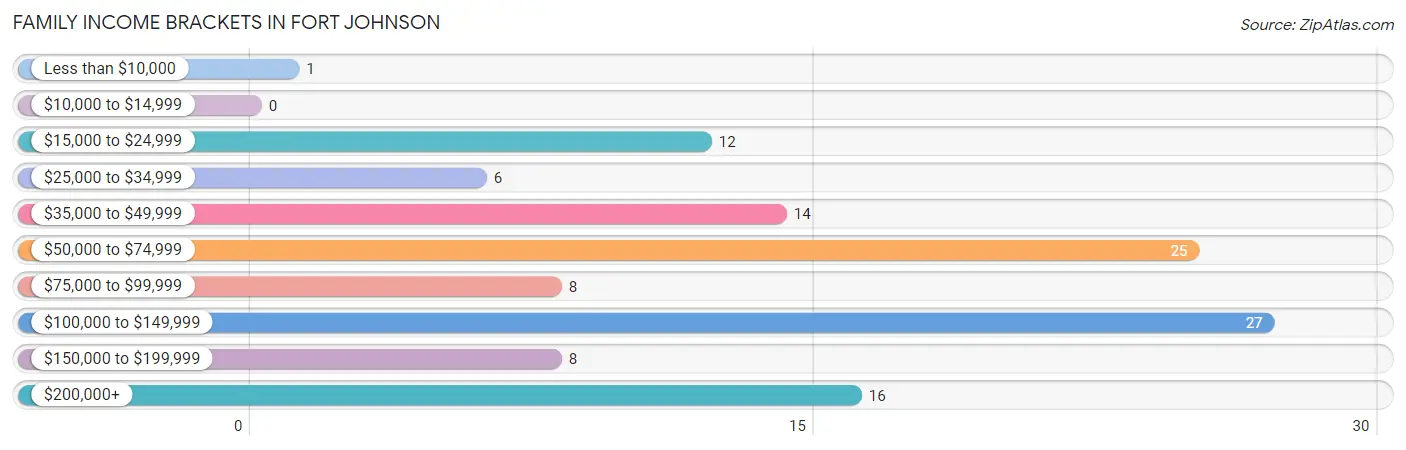
| Income Bracket | # Families | % Families |
| Less than $10,000 | 1 | 0.9% |
| $10,000 to $14,999 | 0 | 0.0% |
| $15,000 to $24,999 | 12 | 10.3% |
| $25,000 to $34,999 | 6 | 5.1% |
| $35,000 to $49,999 | 14 | 12.0% |
| $50,000 to $74,999 | 25 | 21.4% |
| $75,000 to $99,999 | 8 | 6.8% |
| $100,000 to $149,999 | 27 | 23.1% |
| $150,000 to $199,999 | 8 | 6.8% |
| $200,000+ | 16 | 13.7% |
Family Income by Famaliy Size in Fort Johnson
4-person families (35 | 29.9%) account for the highest median family income in Fort Johnson with $122,188 per family, while 2-person families (55 | 47.0%) have the highest median income of $32,188 per family member.
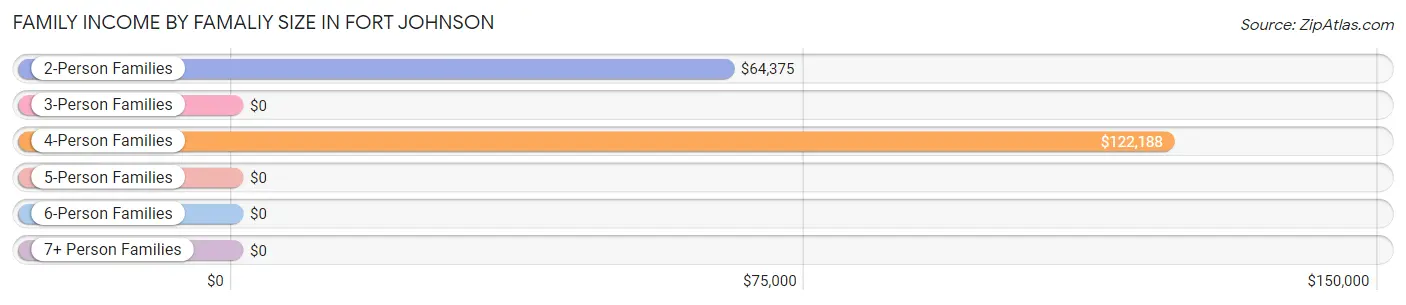
| Income Bracket | # Families | Median Income |
| 2-Person Families | 55 (47.0%) | $64,375 |
| 3-Person Families | 10 (8.6%) | $0 |
| 4-Person Families | 35 (29.9%) | $122,188 |
| 5-Person Families | 7 (6.0%) | $0 |
| 6-Person Families | 10 (8.6%) | $0 |
| 7+ Person Families | 0 (0.0%) | $0 |
| Total | 117 (100.0%) | $75,250 |
Family Income by Number of Earners in Fort Johnson
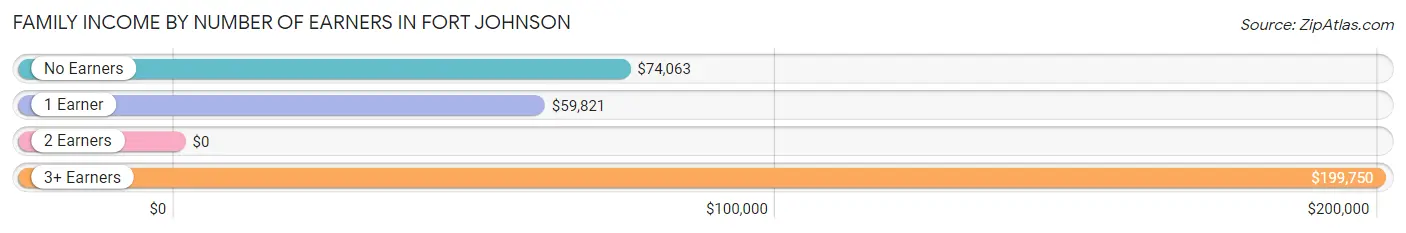
| Number of Earners | # Families | Median Income |
| No Earners | 19 (16.2%) | $74,063 |
| 1 Earner | 40 (34.2%) | $59,821 |
| 2 Earners | 37 (31.6%) | $0 |
| 3+ Earners | 21 (17.9%) | $199,750 |
| Total | 117 (100.0%) | $75,250 |
Household Income in Fort Johnson
Household Income Brackets in Fort Johnson
With 45 households falling in the category, the $50,000 to $74,999 income range is the most frequent in Fort Johnson, accounting for 23.0% of all households. In contrast, only 2 households (1.0%) fall into the $10,000 to $14,999 income bracket, making it the least populous group.
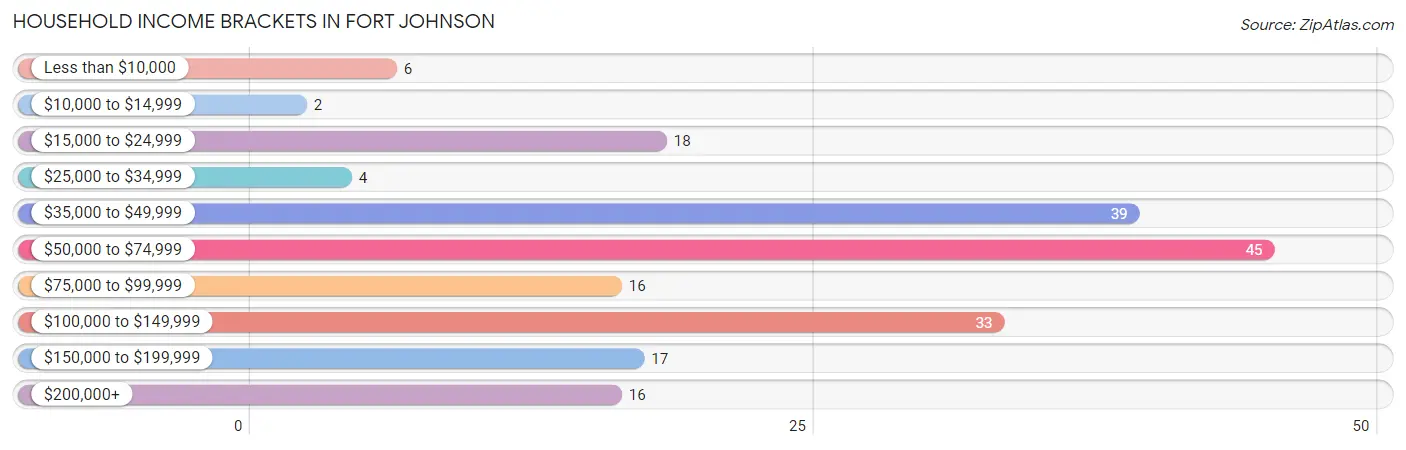
| Income Bracket | # Households | % Households |
| Less than $10,000 | 6 | 3.1% |
| $10,000 to $14,999 | 2 | 1.0% |
| $15,000 to $24,999 | 18 | 9.2% |
| $25,000 to $34,999 | 4 | 2.0% |
| $35,000 to $49,999 | 39 | 19.9% |
| $50,000 to $74,999 | 45 | 23.0% |
| $75,000 to $99,999 | 16 | 8.2% |
| $100,000 to $149,999 | 33 | 16.8% |
| $150,000 to $199,999 | 17 | 8.7% |
| $200,000+ | 16 | 8.2% |
Household Income by Householder Age in Fort Johnson
The median household income in Fort Johnson is $61,071, with the highest median household income of $75,469 found in the 45 to 64 years age bracket for the primary householder. A total of 83 households (42.3%) fall into this category. Meanwhile, the 15 to 24 years age bracket for the primary householder has the lowest median household income of $0, with 5 households (2.5%) in this group.
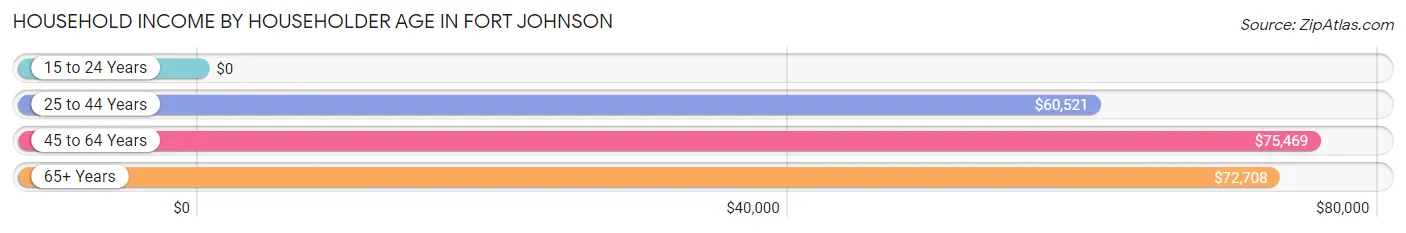
| Income Bracket | # Households | Median Income |
| 15 to 24 Years | 5 (2.5%) | $0 |
| 25 to 44 Years | 67 (34.2%) | $60,521 |
| 45 to 64 Years | 83 (42.3%) | $75,469 |
| 65+ Years | 41 (20.9%) | $72,708 |
| Total | 196 (100.0%) | $61,071 |
Poverty in Fort Johnson
Income Below Poverty by Sex and Age in Fort Johnson
With 6.4% poverty level for males and 6.7% for females among the residents of Fort Johnson, 25 to 34 year old males and 18 to 24 year old females are the most vulnerable to poverty, with 5 males (23.8%) and 5 females (26.3%) in their respective age groups living below the poverty level.
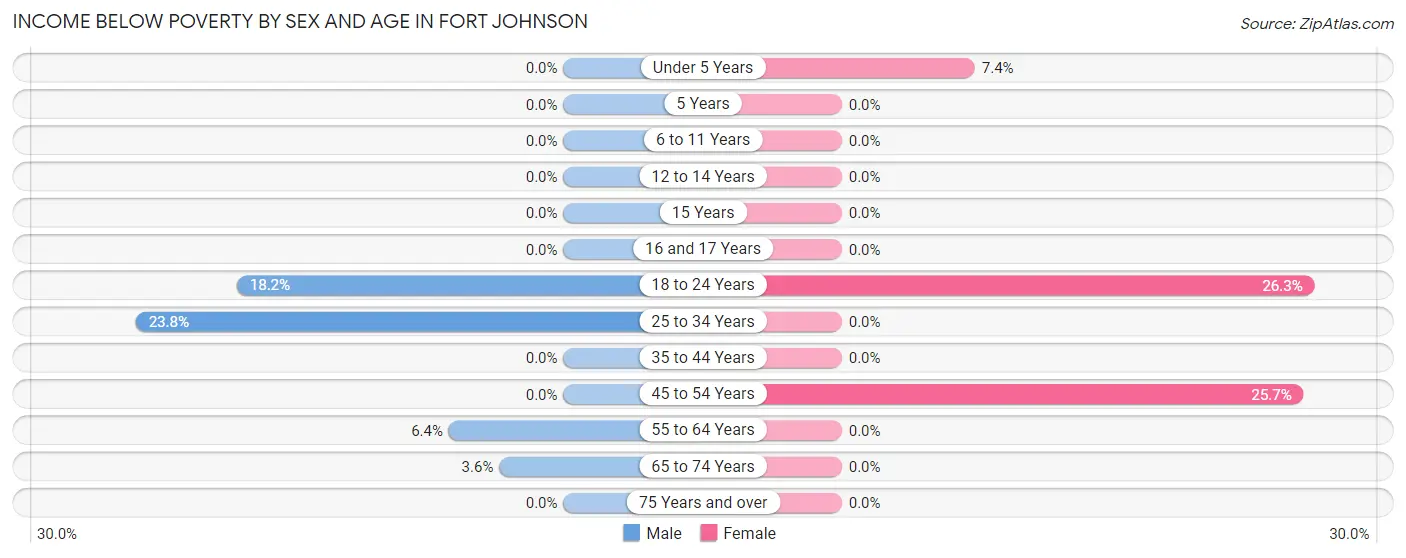
| Age Bracket | Male | Female |
| Under 5 Years | 0 (0.0%) | 2 (7.4%) |
| 5 Years | 0 (0.0%) | 0 (0.0%) |
| 6 to 11 Years | 0 (0.0%) | 0 (0.0%) |
| 12 to 14 Years | 0 (0.0%) | 0 (0.0%) |
| 15 Years | 0 (0.0%) | 0 (0.0%) |
| 16 and 17 Years | 0 (0.0%) | 0 (0.0%) |
| 18 to 24 Years | 8 (18.2%) | 5 (26.3%) |
| 25 to 34 Years | 5 (23.8%) | 0 (0.0%) |
| 35 to 44 Years | 0 (0.0%) | 0 (0.0%) |
| 45 to 54 Years | 0 (0.0%) | 9 (25.7%) |
| 55 to 64 Years | 3 (6.4%) | 0 (0.0%) |
| 65 to 74 Years | 1 (3.6%) | 0 (0.0%) |
| 75 Years and over | 0 (0.0%) | 0 (0.0%) |
| Total | 17 (6.4%) | 16 (6.7%) |
Income Above Poverty by Sex and Age in Fort Johnson
According to the poverty statistics in Fort Johnson, males aged under 5 years and females aged 5 years are the age groups that are most secure financially, with 100.0% of males and 100.0% of females in these age groups living above the poverty line.
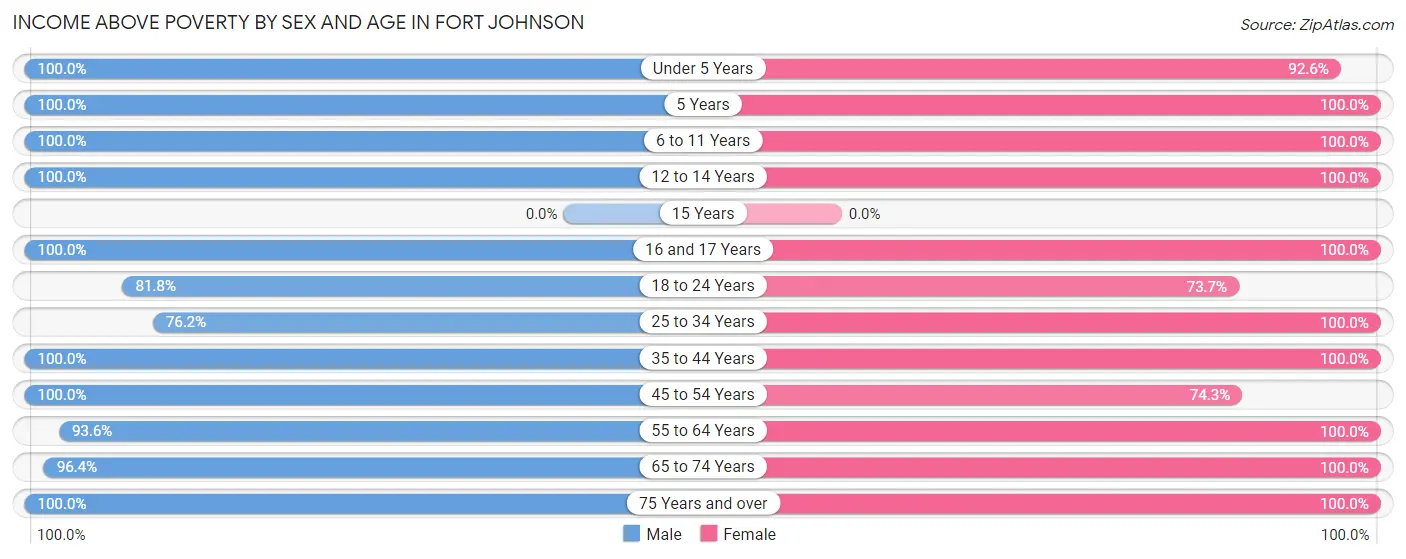
| Age Bracket | Male | Female |
| Under 5 Years | 9 (100.0%) | 25 (92.6%) |
| 5 Years | 10 (100.0%) | 3 (100.0%) |
| 6 to 11 Years | 4 (100.0%) | 8 (100.0%) |
| 12 to 14 Years | 17 (100.0%) | 12 (100.0%) |
| 15 Years | 0 (0.0%) | 0 (0.0%) |
| 16 and 17 Years | 12 (100.0%) | 13 (100.0%) |
| 18 to 24 Years | 36 (81.8%) | 14 (73.7%) |
| 25 to 34 Years | 16 (76.2%) | 22 (100.0%) |
| 35 to 44 Years | 39 (100.0%) | 48 (100.0%) |
| 45 to 54 Years | 26 (100.0%) | 26 (74.3%) |
| 55 to 64 Years | 44 (93.6%) | 22 (100.0%) |
| 65 to 74 Years | 27 (96.4%) | 15 (100.0%) |
| 75 Years and over | 10 (100.0%) | 14 (100.0%) |
| Total | 250 (93.6%) | 222 (93.3%) |
Income Below Poverty Among Married-Couple Families in Fort Johnson
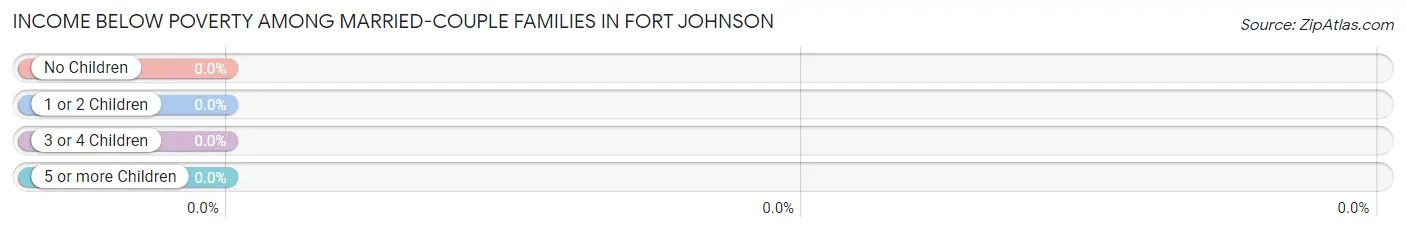
| Children | Above Poverty | Below Poverty |
| No Children | 48 (100.0%) | 0 (0.0%) |
| 1 or 2 Children | 43 (100.0%) | 0 (0.0%) |
| 3 or 4 Children | 7 (100.0%) | 0 (0.0%) |
| 5 or more Children | 0 (0.0%) | 0 (0.0%) |
| Total | 98 (100.0%) | 0 (0.0%) |
Income Below Poverty Among Single-Parent Households in Fort Johnson
According to the poverty data in Fort Johnson, 20.0% or 1 single-father households and 64.3% or 9 single-mother households are living below the poverty line. Among single-father households, those with 1 or 2 children have the highest poverty rate, with 1 households (20.0%) experiencing poverty. Likewise, among single-mother households, those with no children have the highest poverty rate, with 9 households (64.3%) falling below the poverty line.
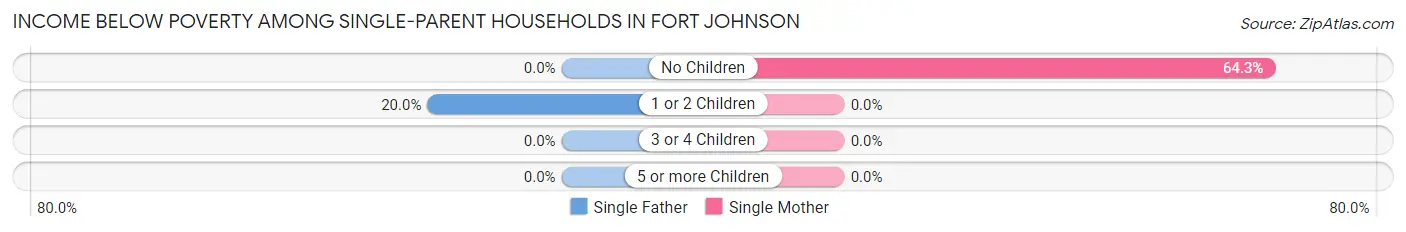
| Children | Single Father | Single Mother |
| No Children | 0 (0.0%) | 9 (64.3%) |
| 1 or 2 Children | 1 (20.0%) | 0 (0.0%) |
| 3 or 4 Children | 0 (0.0%) | 0 (0.0%) |
| 5 or more Children | 0 (0.0%) | 0 (0.0%) |
| Total | 1 (20.0%) | 9 (64.3%) |
Income Below Poverty Among Married-Couple vs Single-Parent Households in Fort Johnson
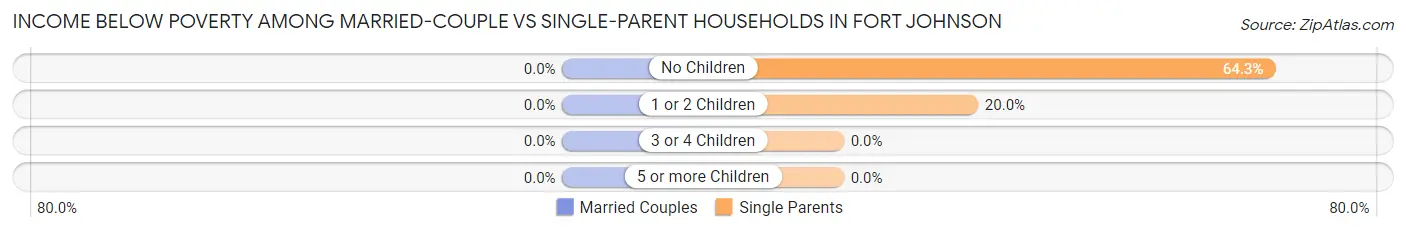
| Children | Married-Couple Families | Single-Parent Households |
| No Children | 0 (0.0%) | 9 (64.3%) |
| 1 or 2 Children | 0 (0.0%) | 1 (20.0%) |
| 3 or 4 Children | 0 (0.0%) | 0 (0.0%) |
| 5 or more Children | 0 (0.0%) | 0 (0.0%) |
| Total | 0 (0.0%) | 10 (52.6%) |
Race in Fort Johnson
The most populous races in Fort Johnson are White / Caucasian (510 | 100.0%), and Hispanic or Latino (97 | 19.0%).
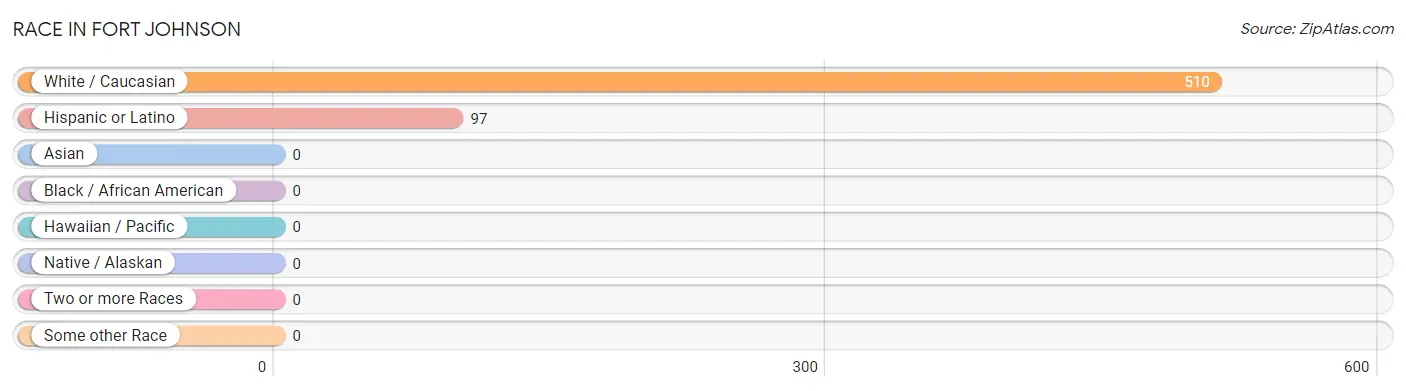
| Race | # Population | % Population |
| Asian | 0 | 0.0% |
| Black / African American | 0 | 0.0% |
| Hawaiian / Pacific | 0 | 0.0% |
| Hispanic or Latino | 97 | 19.0% |
| Native / Alaskan | 0 | 0.0% |
| White / Caucasian | 510 | 100.0% |
| Two or more Races | 0 | 0.0% |
| Some other Race | 0 | 0.0% |
| Total | 510 | 100.0% |
Ancestry in Fort Johnson
The most populous ancestries reported in Fort Johnson are Irish (68 | 13.3%), Puerto Rican (68 | 13.3%), Italian (64 | 12.6%), Scottish (61 | 12.0%), and Polish (60 | 11.8%), together accounting for 62.9% of all Fort Johnson residents.
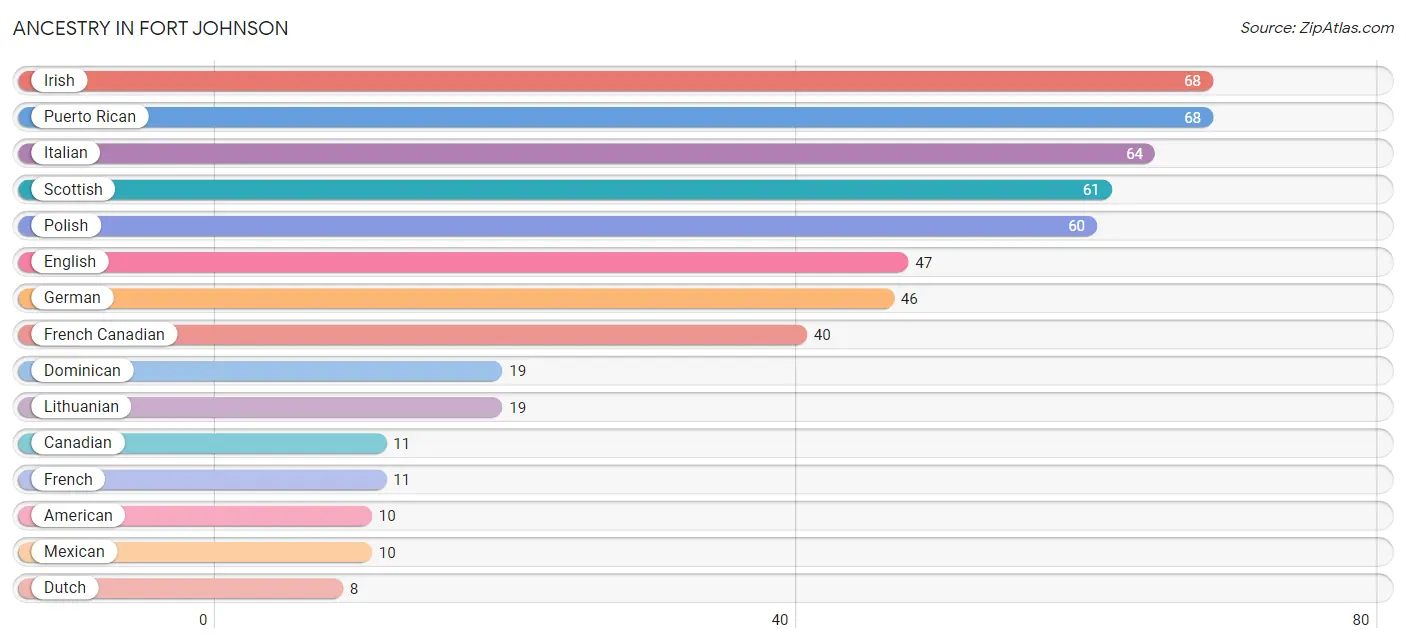
| Ancestry | # Population | % Population |
| American | 10 | 2.0% |
| Austrian | 4 | 0.8% |
| British | 2 | 0.4% |
| Canadian | 11 | 2.2% |
| Czechoslovakian | 3 | 0.6% |
| Dominican | 19 | 3.7% |
| Dutch | 8 | 1.6% |
| English | 47 | 9.2% |
| European | 2 | 0.4% |
| French | 11 | 2.2% |
| French Canadian | 40 | 7.8% |
| German | 46 | 9.0% |
| Irish | 68 | 13.3% |
| Italian | 64 | 12.6% |
| Lithuanian | 19 | 3.7% |
| Mexican | 10 | 2.0% |
| Polish | 60 | 11.8% |
| Puerto Rican | 68 | 13.3% |
| Russian | 1 | 0.2% |
| Scottish | 61 | 12.0% |
| Swedish | 2 | 0.4% | View All 21 Rows |
Immigrants in Fort Johnson
The most numerous immigrant groups reported in Fort Johnson came from England (2 | 0.4%), Europe (2 | 0.4%), and Northern Europe (2 | 0.4%), together accounting for 1.2% of all Fort Johnson residents.
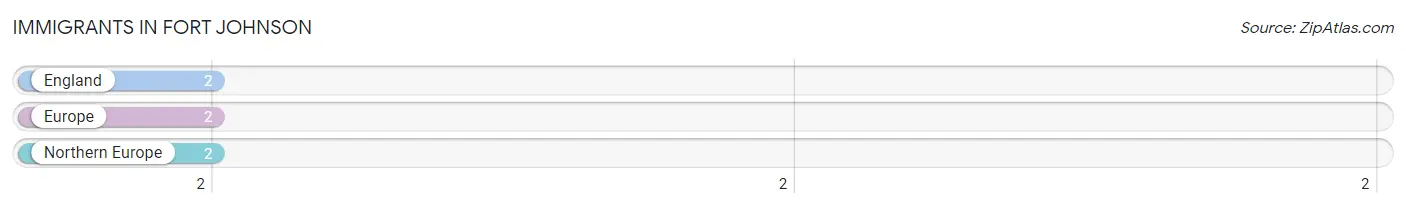
| Immigration Origin | # Population | % Population |
| England | 2 | 0.4% |
| Europe | 2 | 0.4% |
| Northern Europe | 2 | 0.4% | View All 3 Rows |
Sex and Age in Fort Johnson
Sex and Age in Fort Johnson
The most populous age groups in Fort Johnson are 55 to 59 Years (33 | 12.4%) for men and 40 to 44 Years (32 | 13.2%) for women.
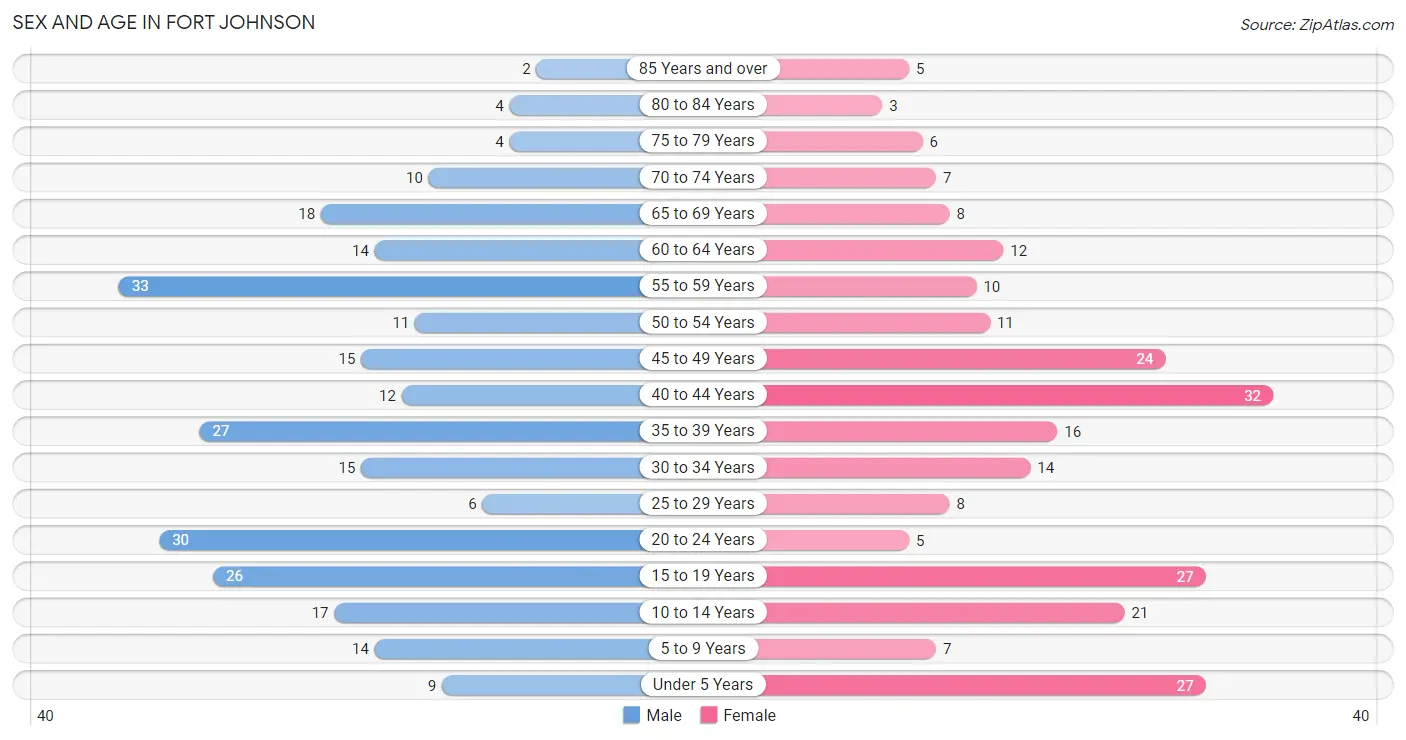
| Age Bracket | Male | Female |
| Under 5 Years | 9 (3.4%) | 27 (11.1%) |
| 5 to 9 Years | 14 (5.2%) | 7 (2.9%) |
| 10 to 14 Years | 17 (6.4%) | 21 (8.6%) |
| 15 to 19 Years | 26 (9.7%) | 27 (11.1%) |
| 20 to 24 Years | 30 (11.2%) | 5 (2.1%) |
| 25 to 29 Years | 6 (2.2%) | 8 (3.3%) |
| 30 to 34 Years | 15 (5.6%) | 14 (5.8%) |
| 35 to 39 Years | 27 (10.1%) | 16 (6.6%) |
| 40 to 44 Years | 12 (4.5%) | 32 (13.2%) |
| 45 to 49 Years | 15 (5.6%) | 24 (9.9%) |
| 50 to 54 Years | 11 (4.1%) | 11 (4.5%) |
| 55 to 59 Years | 33 (12.4%) | 10 (4.1%) |
| 60 to 64 Years | 14 (5.2%) | 12 (4.9%) |
| 65 to 69 Years | 18 (6.7%) | 8 (3.3%) |
| 70 to 74 Years | 10 (3.7%) | 7 (2.9%) |
| 75 to 79 Years | 4 (1.5%) | 6 (2.5%) |
| 80 to 84 Years | 4 (1.5%) | 3 (1.2%) |
| 85 Years and over | 2 (0.7%) | 5 (2.1%) |
| Total | 267 (100.0%) | 243 (100.0%) |
Families and Households in Fort Johnson
Median Family Size in Fort Johnson
The median family size in Fort Johnson is 3.50 persons per family, with married-couple families (98 | 83.8%) accounting for the largest median family size of 3.7 persons per family. On the other hand, single male/father families (5 | 4.3%) represent the smallest median family size with 2.20 persons per family.
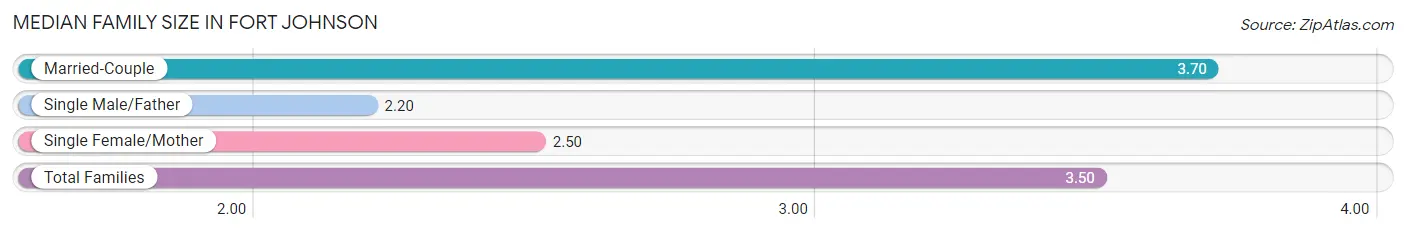
| Family Type | # Families | Family Size |
| Married-Couple | 98 (83.8%) | 3.70 |
| Single Male/Father | 5 (4.3%) | 2.20 |
| Single Female/Mother | 14 (12.0%) | 2.50 |
| Total Families | 117 (100.0%) | 3.50 |
Median Household Size in Fort Johnson
The median household size in Fort Johnson is 2.60 persons per household, with single male/father households (5 | 2.5%) accounting for the largest median household size of 4.2 persons per household. non-family households (79 | 40.3%) represent the smallest median household size with 1.15 persons per household.
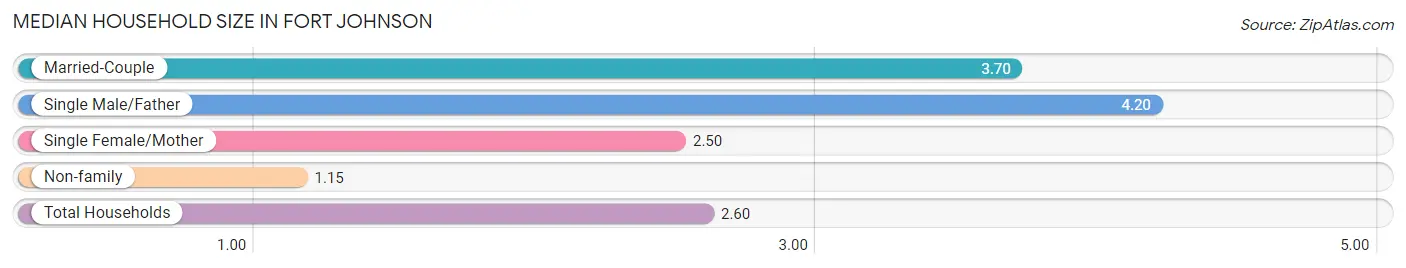
| Household Type | # Households | Household Size |
| Married-Couple | 98 (50.0%) | 3.70 |
| Single Male/Father | 5 (2.5%) | 4.20 |
| Single Female/Mother | 14 (7.1%) | 2.50 |
| Non-family | 79 (40.3%) | 1.15 |
| Total Households | 196 (100.0%) | 2.60 |
Household Size by Marriage Status in Fort Johnson
Out of a total of 196 households in Fort Johnson, 117 (59.7%) are family households, while 79 (40.3%) are nonfamily households. The most numerous type of family households are 2-person households, comprising 51, and the most common type of nonfamily households are 1-person households, comprising 67.
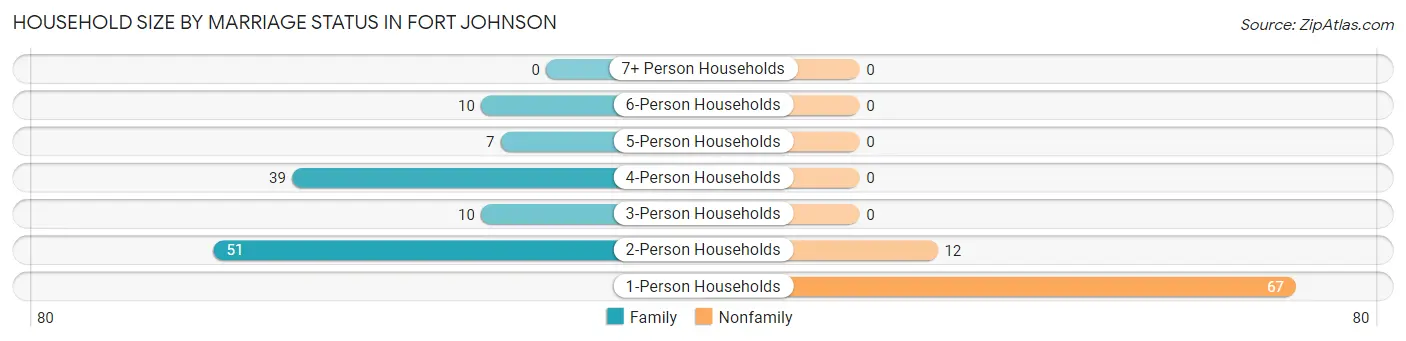
| Household Size | Family Households | Nonfamily Households |
| 1-Person Households | - | 67 (34.2%) |
| 2-Person Households | 51 (26.0%) | 12 (6.1%) |
| 3-Person Households | 10 (5.1%) | 0 (0.0%) |
| 4-Person Households | 39 (19.9%) | 0 (0.0%) |
| 5-Person Households | 7 (3.6%) | 0 (0.0%) |
| 6-Person Households | 10 (5.1%) | 0 (0.0%) |
| 7+ Person Households | 0 (0.0%) | 0 (0.0%) |
| Total | 117 (59.7%) | 79 (40.3%) |
Female Fertility in Fort Johnson
Fertility by Age in Fort Johnson
Average fertility rate in Fort Johnson is 24.0 births per 1,000 women. Women in the age bracket of 35 to 50 years have the highest fertility rate with 42.0 births per 1,000 women. Women in the age bracket of 35 to 50 years acount for 100.0% of all women with births.
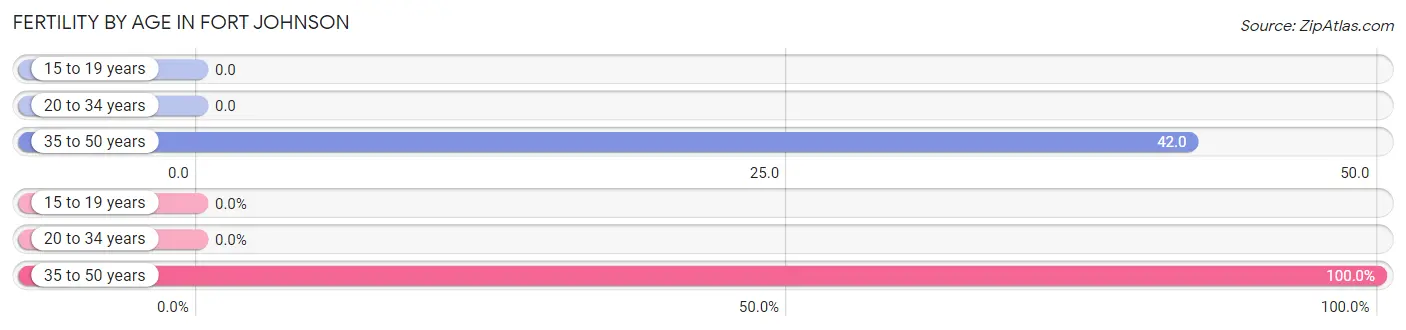
| Age Bracket | Women with Births | Births / 1,000 Women |
| 15 to 19 years | 0 (0.0%) | 0.0 |
| 20 to 34 years | 0 (0.0%) | 0.0 |
| 35 to 50 years | 3 (100.0%) | 42.0 |
| Total | 3 (100.0%) | 24.0 |
Fertility by Age by Marriage Status in Fort Johnson
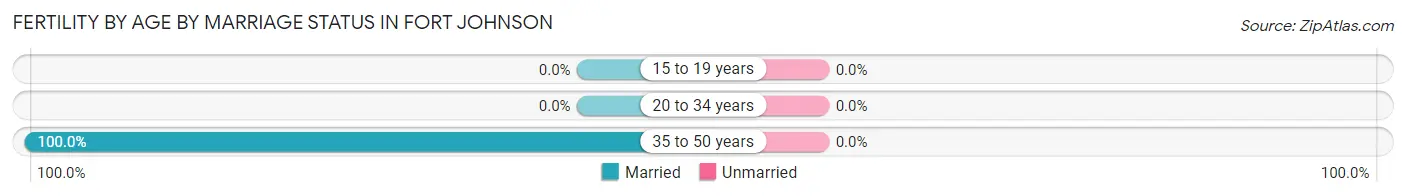
| Age Bracket | Married | Unmarried |
| 15 to 19 years | 0 (0.0%) | 0 (0.0%) |
| 20 to 34 years | 0 (0.0%) | 0 (0.0%) |
| 35 to 50 years | 3 (100.0%) | 0 (0.0%) |
| Total | 3 (100.0%) | 0 (0.0%) |
Fertility by Education in Fort Johnson
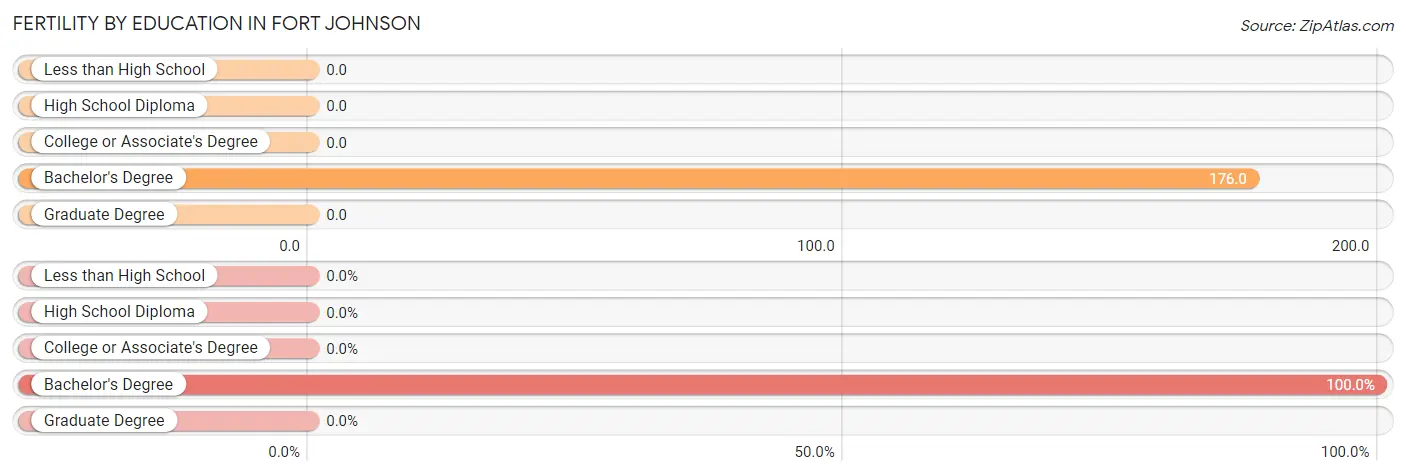
| Educational Attainment | Women with Births | Births / 1,000 Women |
| Less than High School | 0 (0.0%) | 0.0 |
| High School Diploma | 0 (0.0%) | 0.0 |
| College or Associate's Degree | 0 (0.0%) | 0.0 |
| Bachelor's Degree | 3 (100.0%) | 176.0 |
| Graduate Degree | 0 (0.0%) | 0.0 |
| Total | 3 (100.0%) | 24.0 |
Fertility by Education by Marriage Status in Fort Johnson
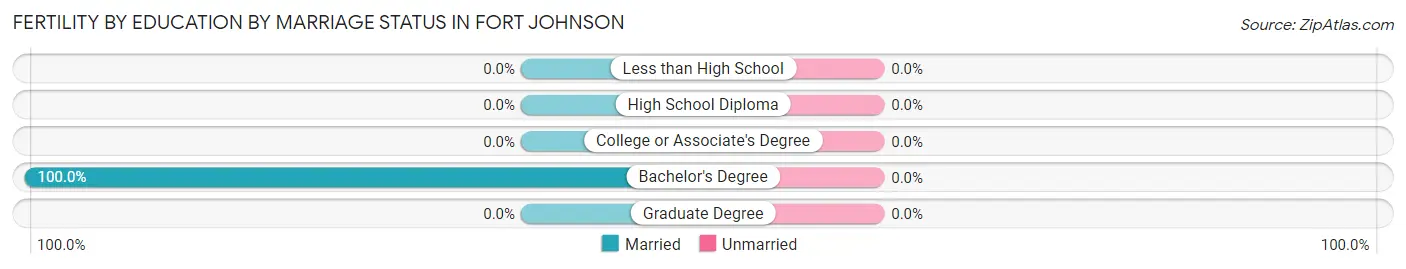
| Educational Attainment | Married | Unmarried |
| Less than High School | 0 (0.0%) | 0 (0.0%) |
| High School Diploma | 0 (0.0%) | 0 (0.0%) |
| College or Associate's Degree | 0 (0.0%) | 0 (0.0%) |
| Bachelor's Degree | 3 (100.0%) | 0 (0.0%) |
| Graduate Degree | 0 (0.0%) | 0 (0.0%) |
| Total | 3 (100.0%) | 0 (0.0%) |
Employment Characteristics in Fort Johnson
Employment by Class of Employer in Fort Johnson
Among the 238 employed individuals in Fort Johnson, private company employees (109 | 45.8%), not-for-profit organizations (61 | 25.6%), and self-employed (not incorporated) (28 | 11.8%) make up the most common classes of employment.
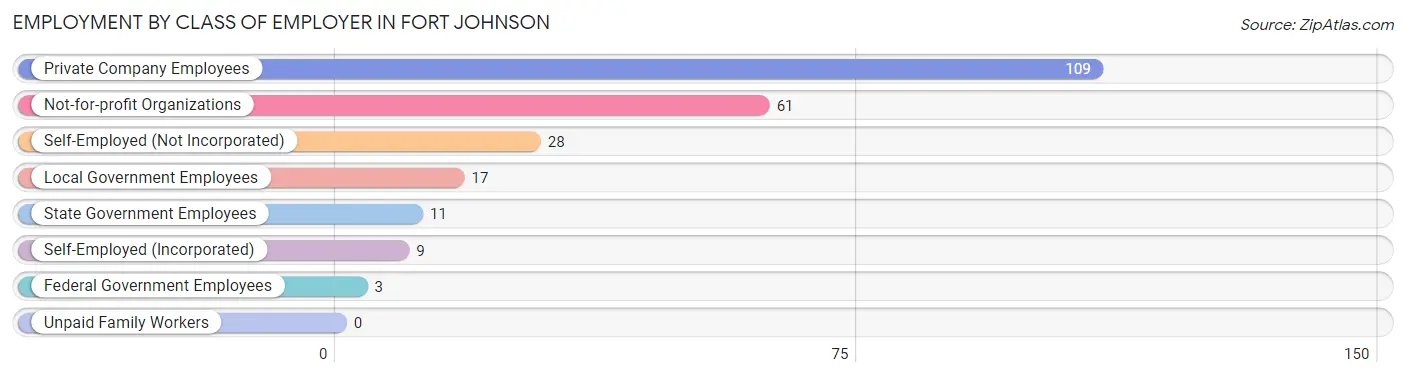
| Employer Class | # Employees | % Employees |
| Private Company Employees | 109 | 45.8% |
| Self-Employed (Incorporated) | 9 | 3.8% |
| Self-Employed (Not Incorporated) | 28 | 11.8% |
| Not-for-profit Organizations | 61 | 25.6% |
| Local Government Employees | 17 | 7.1% |
| State Government Employees | 11 | 4.6% |
| Federal Government Employees | 3 | 1.3% |
| Unpaid Family Workers | 0 | 0.0% |
| Total | 238 | 100.0% |
Employment Status by Age in Fort Johnson
According to the labor force statistics for Fort Johnson, out of the total population over 16 years of age (415), 64.3% or 267 individuals are in the labor force, with 10.6% or 28 of them unemployed. The age group with the highest labor force participation rate is 25 to 29 years, with 100.0% or 14 individuals in the labor force. Within the labor force, the 20 to 24 years age range has the highest percentage of unemployed individuals, with 62.5% or 5 of them being unemployed.
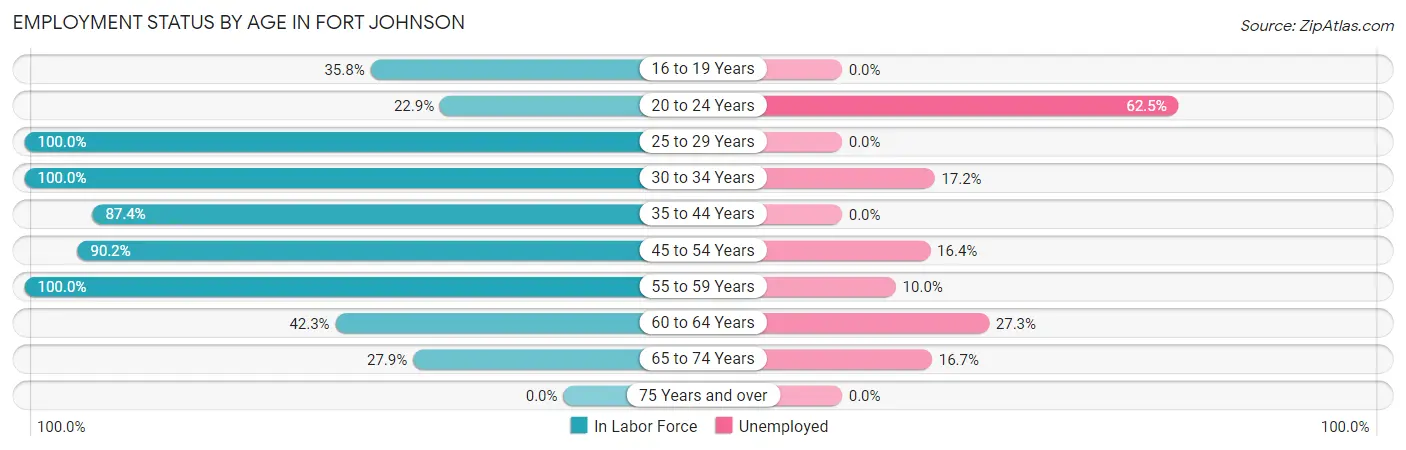
| Age Bracket | In Labor Force | Unemployed |
| 16 to 19 Years | 19 (35.8%) | 0 (0.0%) |
| 20 to 24 Years | 8 (22.9%) | 5 (62.5%) |
| 25 to 29 Years | 14 (100.0%) | 0 (0.0%) |
| 30 to 34 Years | 29 (100.0%) | 5 (17.2%) |
| 35 to 44 Years | 76 (87.4%) | 0 (0.0%) |
| 45 to 54 Years | 55 (90.2%) | 9 (16.4%) |
| 55 to 59 Years | 43 (100.0%) | 4 (10.0%) |
| 60 to 64 Years | 11 (42.3%) | 3 (27.3%) |
| 65 to 74 Years | 12 (27.9%) | 2 (16.7%) |
| 75 Years and over | 0 (0.0%) | 0 (0.0%) |
| Total | 267 (64.3%) | 28 (10.6%) |
Employment Status by Educational Attainment in Fort Johnson
According to labor force statistics for Fort Johnson, 87.7% of individuals (228) out of the total population between 25 and 64 years of age (260) are in the labor force, with 9.3% or 21 of them being unemployed. The group with the highest labor force participation rate are those with the educational attainment of less than high school, with 100.0% or 16 individuals in the labor force. Within the labor force, individuals with high school diploma education have the highest percentage of unemployment, with 15.7% or 8 of them being unemployed.
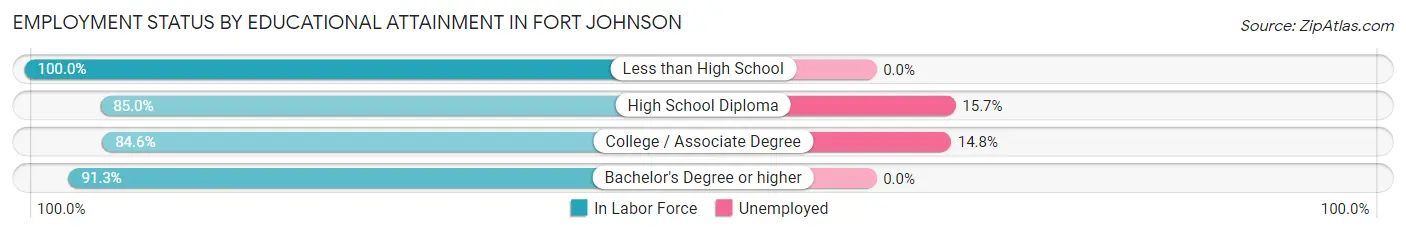
| Educational Attainment | In Labor Force | Unemployed |
| Less than High School | 16 (100.0%) | 0 (0.0%) |
| High School Diploma | 51 (85.0%) | 9 (15.7%) |
| College / Associate Degree | 88 (84.6%) | 15 (14.8%) |
| Bachelor's Degree or higher | 73 (91.3%) | 0 (0.0%) |
| Total | 228 (87.7%) | 24 (9.3%) |
Employment Occupations by Sex in Fort Johnson
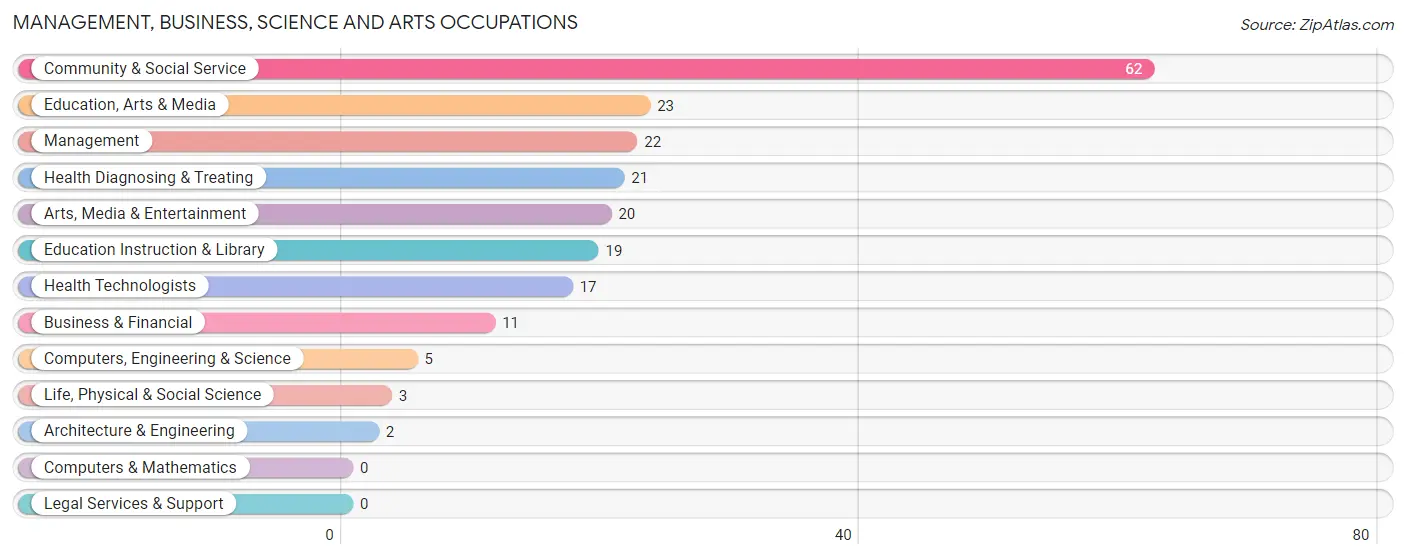
Management, Business, Science and Arts Occupations
The most common Management, Business, Science and Arts occupations in Fort Johnson are Community & Social Service (62 | 26.3%), Education, Arts & Media (23 | 9.8%), Management (22 | 9.3%), Health Diagnosing & Treating (21 | 8.9%), and Arts, Media & Entertainment (20 | 8.5%).
Management, Business, Science and Arts Occupations by Sex
Within the Management, Business, Science and Arts occupations in Fort Johnson, the most male-oriented occupations are Computers, Engineering & Science (100.0%), Architecture & Engineering (100.0%), and Life, Physical & Social Science (100.0%), while the most female-oriented occupations are Health Technologists (100.0%), Education Instruction & Library (94.7%), and Health Diagnosing & Treating (80.9%).
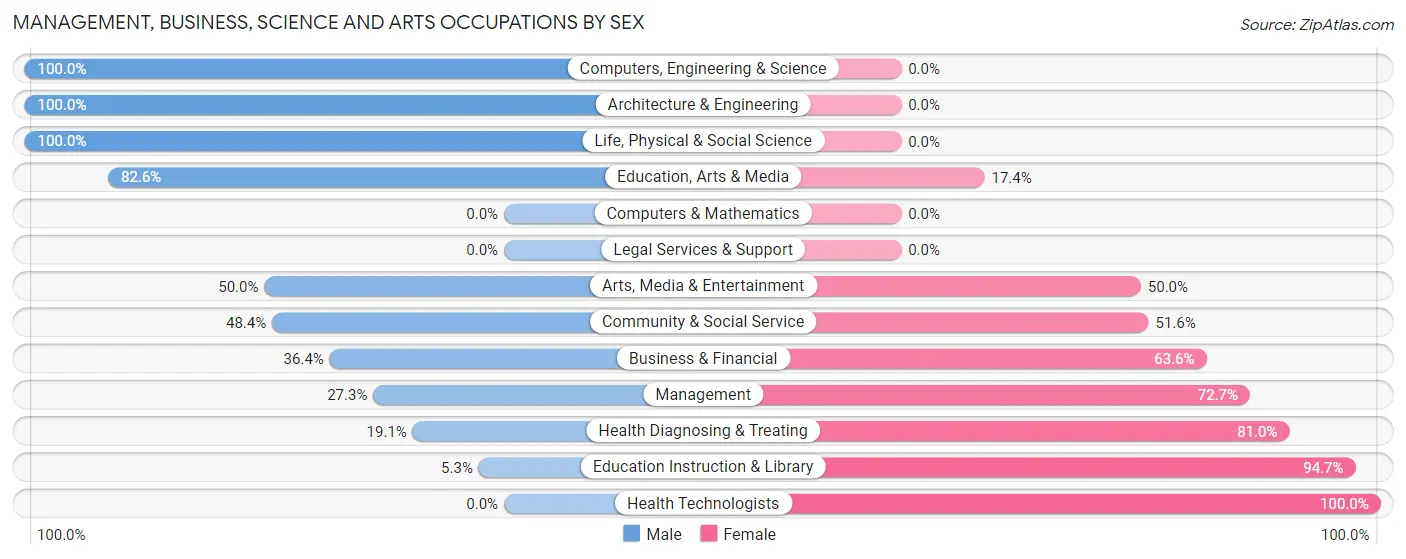
| Occupation | Male | Female |
| Management | 6 (27.3%) | 16 (72.7%) |
| Business & Financial | 4 (36.4%) | 7 (63.6%) |
| Computers, Engineering & Science | 5 (100.0%) | 0 (0.0%) |
| Computers & Mathematics | 0 (0.0%) | 0 (0.0%) |
| Architecture & Engineering | 2 (100.0%) | 0 (0.0%) |
| Life, Physical & Social Science | 3 (100.0%) | 0 (0.0%) |
| Community & Social Service | 30 (48.4%) | 32 (51.6%) |
| Education, Arts & Media | 19 (82.6%) | 4 (17.4%) |
| Legal Services & Support | 0 (0.0%) | 0 (0.0%) |
| Education Instruction & Library | 1 (5.3%) | 18 (94.7%) |
| Arts, Media & Entertainment | 10 (50.0%) | 10 (50.0%) |
| Health Diagnosing & Treating | 4 (19.1%) | 17 (80.9%) |
| Health Technologists | 0 (0.0%) | 17 (100.0%) |
| Total (Category) | 49 (40.5%) | 72 (59.5%) |
| Total (Overall) | 134 (56.8%) | 102 (43.2%) |
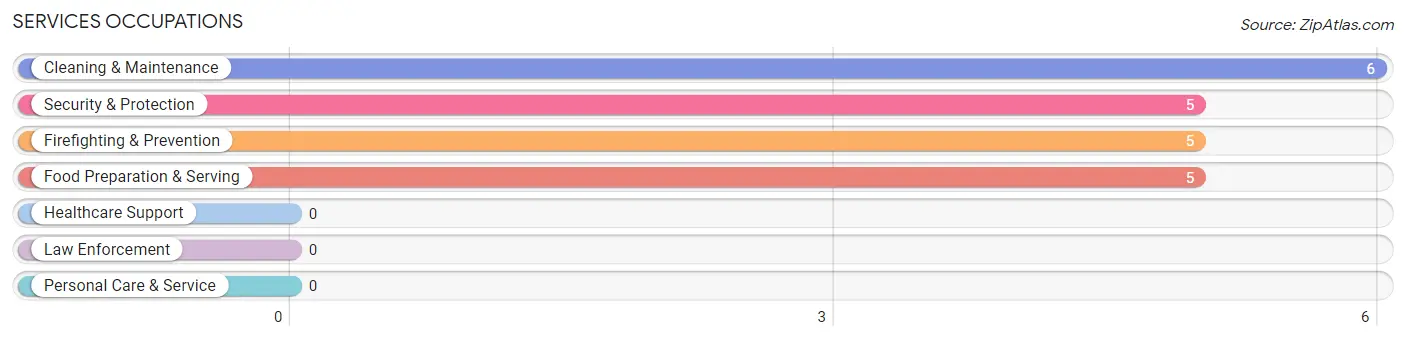
Services Occupations
The most common Services occupations in Fort Johnson are Cleaning & Maintenance (6 | 2.5%), Security & Protection (5 | 2.1%), Firefighting & Prevention (5 | 2.1%), and Food Preparation & Serving (5 | 2.1%).
Services Occupations by Sex
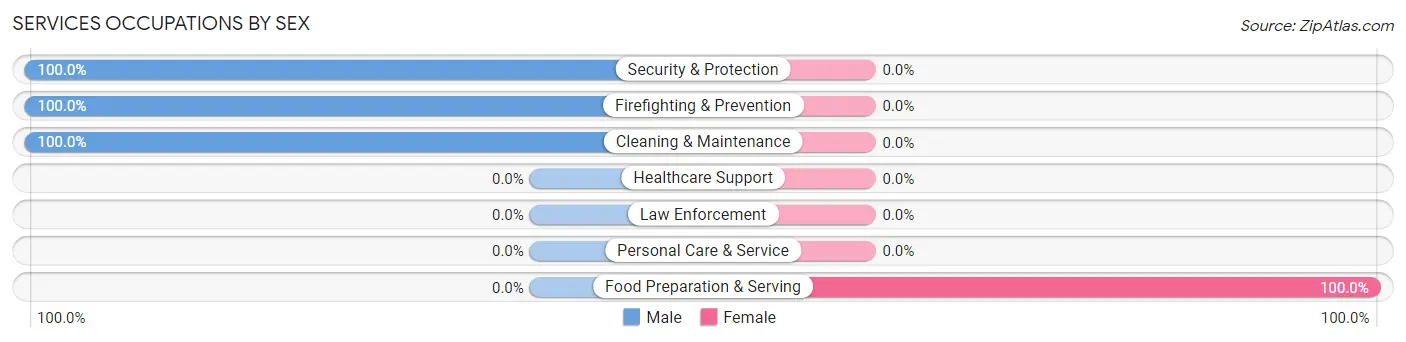
| Occupation | Male | Female |
| Healthcare Support | 0 (0.0%) | 0 (0.0%) |
| Security & Protection | 5 (100.0%) | 0 (0.0%) |
| Firefighting & Prevention | 5 (100.0%) | 0 (0.0%) |
| Law Enforcement | 0 (0.0%) | 0 (0.0%) |
| Food Preparation & Serving | 0 (0.0%) | 5 (100.0%) |
| Cleaning & Maintenance | 6 (100.0%) | 0 (0.0%) |
| Personal Care & Service | 0 (0.0%) | 0 (0.0%) |
| Total (Category) | 11 (68.8%) | 5 (31.2%) |
| Total (Overall) | 134 (56.8%) | 102 (43.2%) |
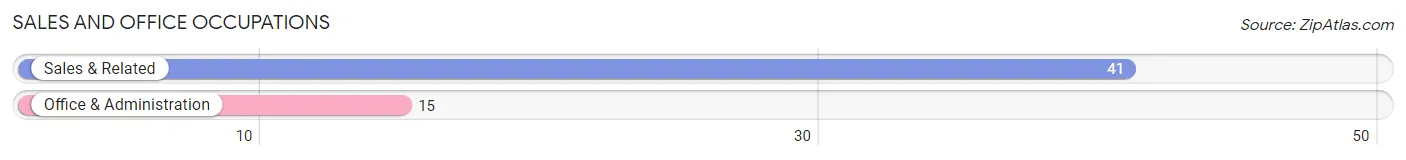
Sales and Office Occupations
The most common Sales and Office occupations in Fort Johnson are Sales & Related (41 | 17.4%), and Office & Administration (15 | 6.4%).
Sales and Office Occupations by Sex
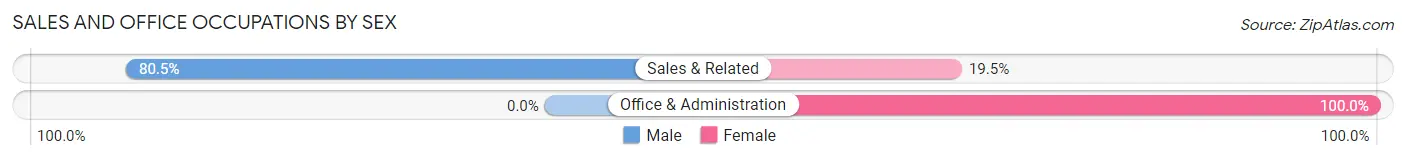
| Occupation | Male | Female |
| Sales & Related | 33 (80.5%) | 8 (19.5%) |
| Office & Administration | 0 (0.0%) | 15 (100.0%) |
| Total (Category) | 33 (58.9%) | 23 (41.1%) |
| Total (Overall) | 134 (56.8%) | 102 (43.2%) |
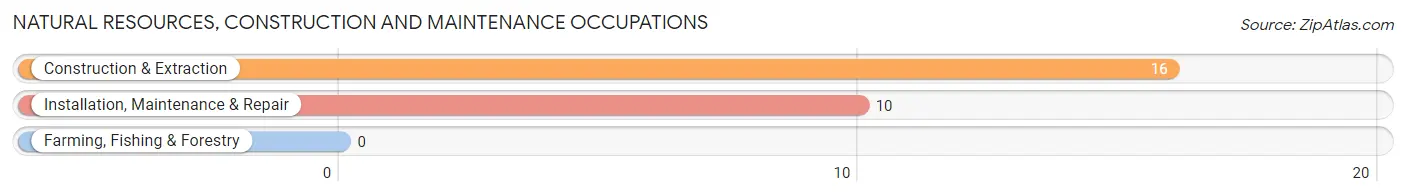
Natural Resources, Construction and Maintenance Occupations
The most common Natural Resources, Construction and Maintenance occupations in Fort Johnson are Construction & Extraction (16 | 6.8%), and Installation, Maintenance & Repair (10 | 4.2%).
Natural Resources, Construction and Maintenance Occupations by Sex
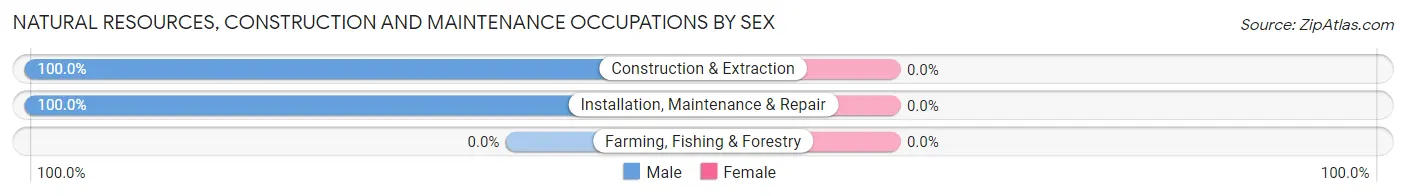
| Occupation | Male | Female |
| Farming, Fishing & Forestry | 0 (0.0%) | 0 (0.0%) |
| Construction & Extraction | 16 (100.0%) | 0 (0.0%) |
| Installation, Maintenance & Repair | 10 (100.0%) | 0 (0.0%) |
| Total (Category) | 26 (100.0%) | 0 (0.0%) |
| Total (Overall) | 134 (56.8%) | 102 (43.2%) |
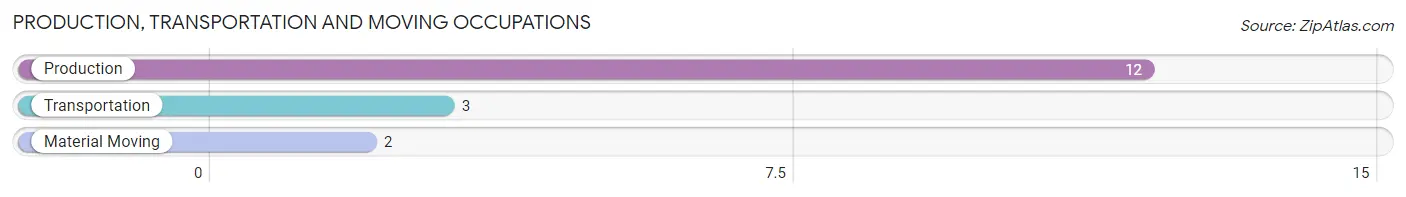
Production, Transportation and Moving Occupations
The most common Production, Transportation and Moving occupations in Fort Johnson are Production (12 | 5.1%), Transportation (3 | 1.3%), and Material Moving (2 | 0.9%).
Production, Transportation and Moving Occupations by Sex
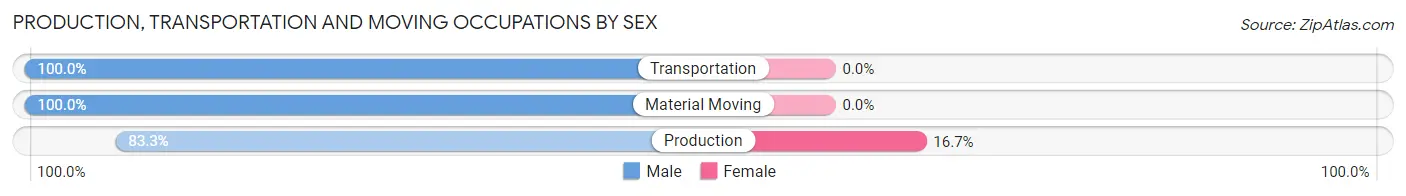
| Occupation | Male | Female |
| Production | 10 (83.3%) | 2 (16.7%) |
| Transportation | 3 (100.0%) | 0 (0.0%) |
| Material Moving | 2 (100.0%) | 0 (0.0%) |
| Total (Category) | 15 (88.2%) | 2 (11.8%) |
| Total (Overall) | 134 (56.8%) | 102 (43.2%) |
Employment Industries by Sex in Fort Johnson
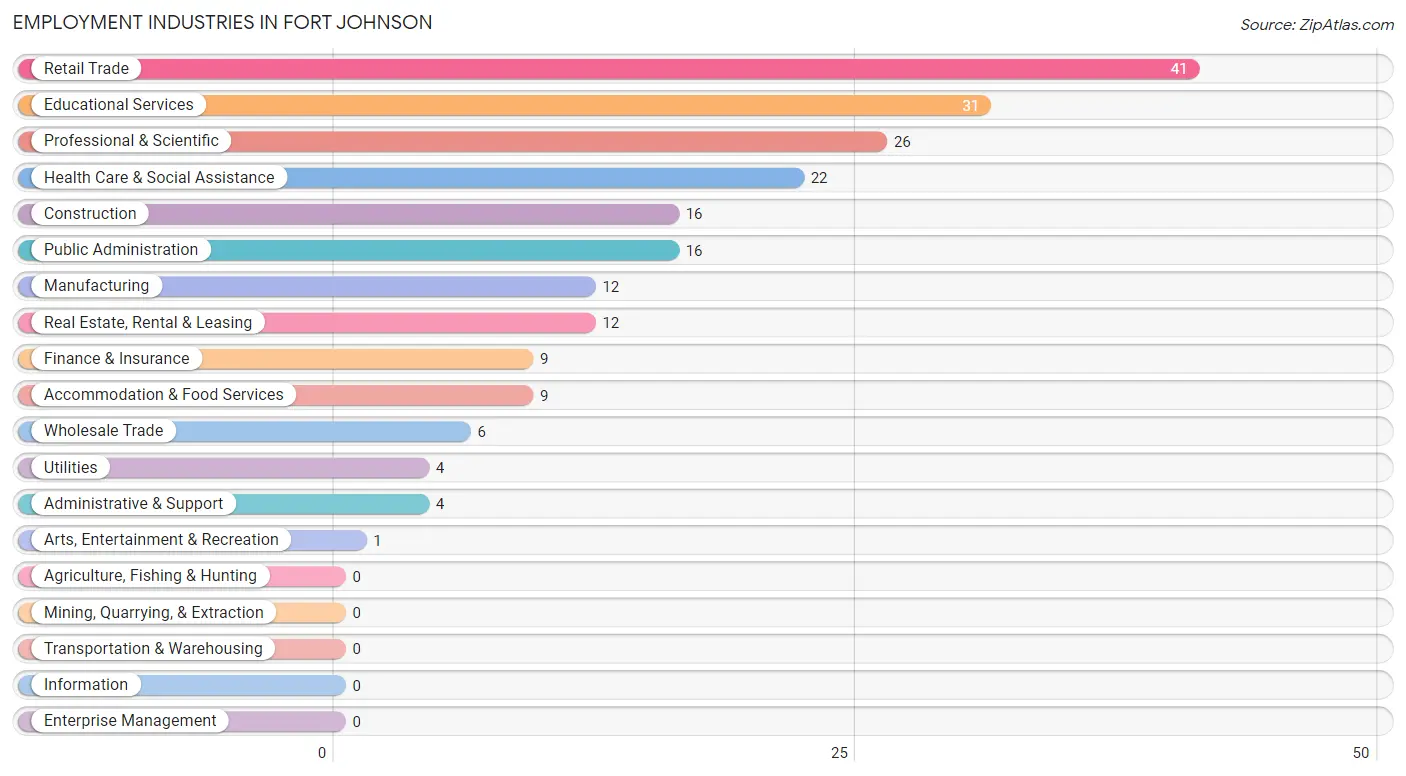
Employment Industries in Fort Johnson
The major employment industries in Fort Johnson include Retail Trade (41 | 17.4%), Educational Services (31 | 13.1%), Professional & Scientific (26 | 11.0%), Health Care & Social Assistance (22 | 9.3%), and Construction (16 | 6.8%).
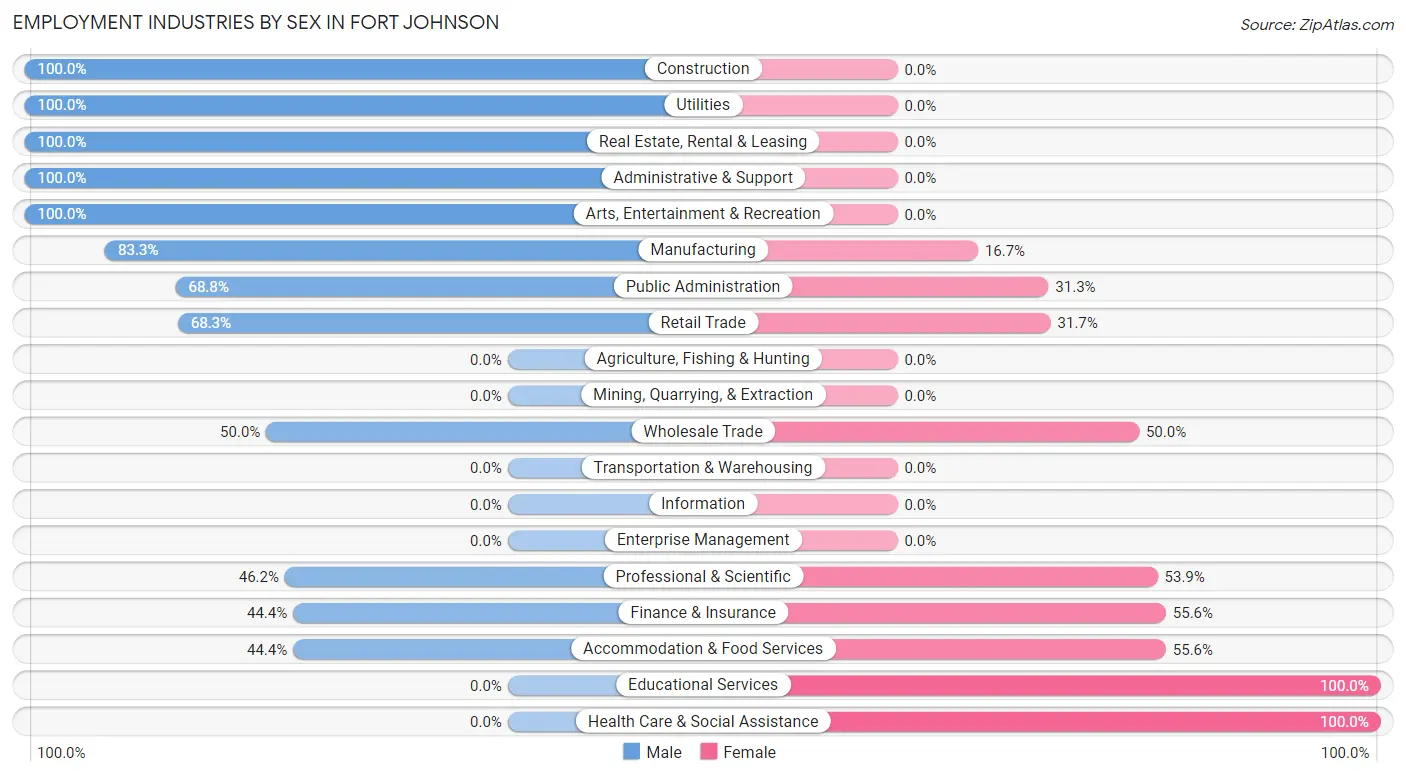
Employment Industries by Sex in Fort Johnson
The Fort Johnson industries that see more men than women are Construction (100.0%), Utilities (100.0%), and Real Estate, Rental & Leasing (100.0%), whereas the industries that tend to have a higher number of women are Educational Services (100.0%), Health Care & Social Assistance (100.0%), and Finance & Insurance (55.6%).
| Industry | Male | Female |
| Agriculture, Fishing & Hunting | 0 (0.0%) | 0 (0.0%) |
| Mining, Quarrying, & Extraction | 0 (0.0%) | 0 (0.0%) |
| Construction | 16 (100.0%) | 0 (0.0%) |
| Manufacturing | 10 (83.3%) | 2 (16.7%) |
| Wholesale Trade | 3 (50.0%) | 3 (50.0%) |
| Retail Trade | 28 (68.3%) | 13 (31.7%) |
| Transportation & Warehousing | 0 (0.0%) | 0 (0.0%) |
| Utilities | 4 (100.0%) | 0 (0.0%) |
| Information | 0 (0.0%) | 0 (0.0%) |
| Finance & Insurance | 4 (44.4%) | 5 (55.6%) |
| Real Estate, Rental & Leasing | 12 (100.0%) | 0 (0.0%) |
| Professional & Scientific | 12 (46.2%) | 14 (53.8%) |
| Enterprise Management | 0 (0.0%) | 0 (0.0%) |
| Administrative & Support | 4 (100.0%) | 0 (0.0%) |
| Educational Services | 0 (0.0%) | 31 (100.0%) |
| Health Care & Social Assistance | 0 (0.0%) | 22 (100.0%) |
| Arts, Entertainment & Recreation | 1 (100.0%) | 0 (0.0%) |
| Accommodation & Food Services | 4 (44.4%) | 5 (55.6%) |
| Public Administration | 11 (68.8%) | 5 (31.2%) |
| Total | 134 (56.8%) | 102 (43.2%) |
Education in Fort Johnson
School Enrollment in Fort Johnson
The most common levels of schooling among the 144 students in Fort Johnson are college / undergraduate (45 | 31.2%), high school (38 | 26.4%), and middle school (28 | 19.4%).
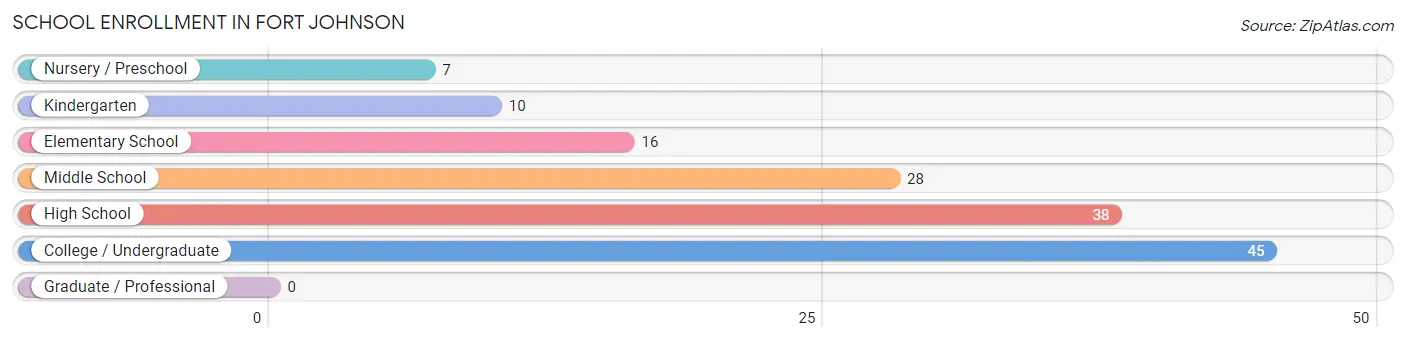
| School Level | # Students | % Students |
| Nursery / Preschool | 7 | 4.9% |
| Kindergarten | 10 | 6.9% |
| Elementary School | 16 | 11.1% |
| Middle School | 28 | 19.4% |
| High School | 38 | 26.4% |
| College / Undergraduate | 45 | 31.2% |
| Graduate / Professional | 0 | 0.0% |
| Total | 144 | 100.0% |
School Enrollment by Age by Funding Source in Fort Johnson
Out of a total of 144 students who are enrolled in schools in Fort Johnson, 20 (13.9%) attend a private institution, while the remaining 124 (86.1%) are enrolled in public schools. The age group of 3 to 4 year olds has the highest likelihood of being enrolled in private schools, with 7 (100.0% in the age bracket) enrolled. Conversely, the age group of 10 to 14 year olds has the lowest likelihood of being enrolled in a private school, with 38 (100.0% in the age bracket) attending a public institution.
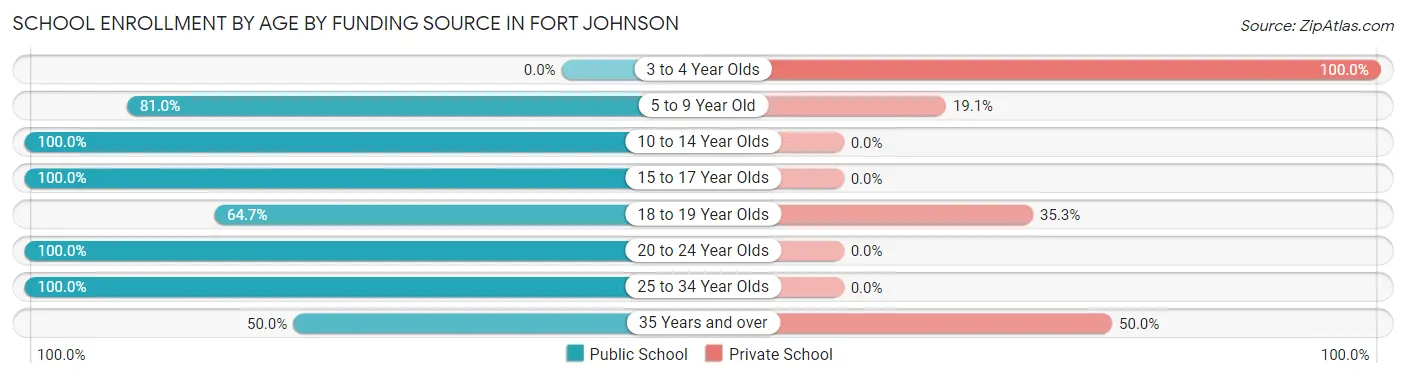
| Age Bracket | Public School | Private School |
| 3 to 4 Year Olds | 0 (0.0%) | 7 (100.0%) |
| 5 to 9 Year Old | 17 (80.9%) | 4 (19.1%) |
| 10 to 14 Year Olds | 38 (100.0%) | 0 (0.0%) |
| 15 to 17 Year Olds | 25 (100.0%) | 0 (0.0%) |
| 18 to 19 Year Olds | 11 (64.7%) | 6 (35.3%) |
| 20 to 24 Year Olds | 27 (100.0%) | 0 (0.0%) |
| 25 to 34 Year Olds | 3 (100.0%) | 0 (0.0%) |
| 35 Years and over | 3 (50.0%) | 3 (50.0%) |
| Total | 124 (86.1%) | 20 (13.9%) |
Educational Attainment by Field of Study in Fort Johnson
Liberal arts & history (34 | 27.4%), science & technology (25 | 20.2%), social sciences (24 | 19.4%), education (11 | 8.9%), and engineering (8 | 6.5%) are the most common fields of study among 124 individuals in Fort Johnson who have obtained a bachelor's degree or higher.
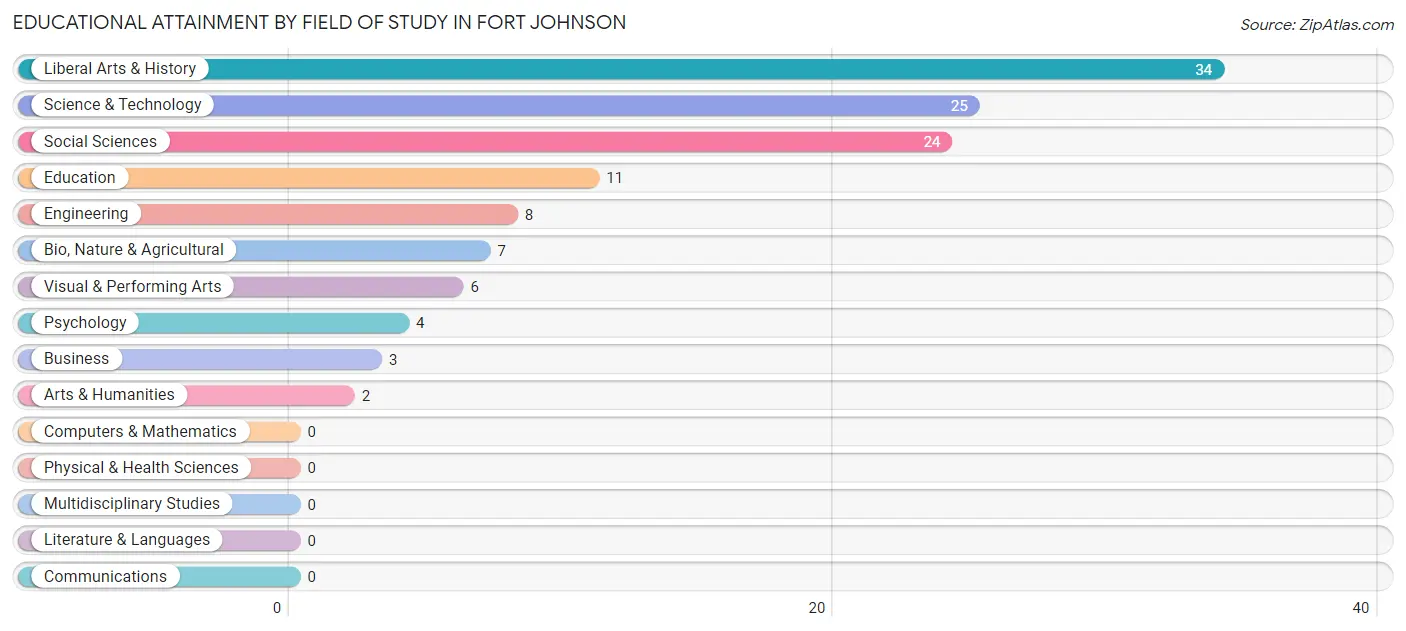
| Field of Study | # Graduates | % Graduates |
| Computers & Mathematics | 0 | 0.0% |
| Bio, Nature & Agricultural | 7 | 5.7% |
| Physical & Health Sciences | 0 | 0.0% |
| Psychology | 4 | 3.2% |
| Social Sciences | 24 | 19.4% |
| Engineering | 8 | 6.5% |
| Multidisciplinary Studies | 0 | 0.0% |
| Science & Technology | 25 | 20.2% |
| Business | 3 | 2.4% |
| Education | 11 | 8.9% |
| Literature & Languages | 0 | 0.0% |
| Liberal Arts & History | 34 | 27.4% |
| Visual & Performing Arts | 6 | 4.8% |
| Communications | 0 | 0.0% |
| Arts & Humanities | 2 | 1.6% |
| Total | 124 | 100.0% |
Transportation & Commute in Fort Johnson
Vehicle Availability by Sex in Fort Johnson
The most prevalent vehicle ownership categories in Fort Johnson are males with 1 vehicle (67, accounting for 49.3%) and females with 1 vehicle (17, making up 65.7%).
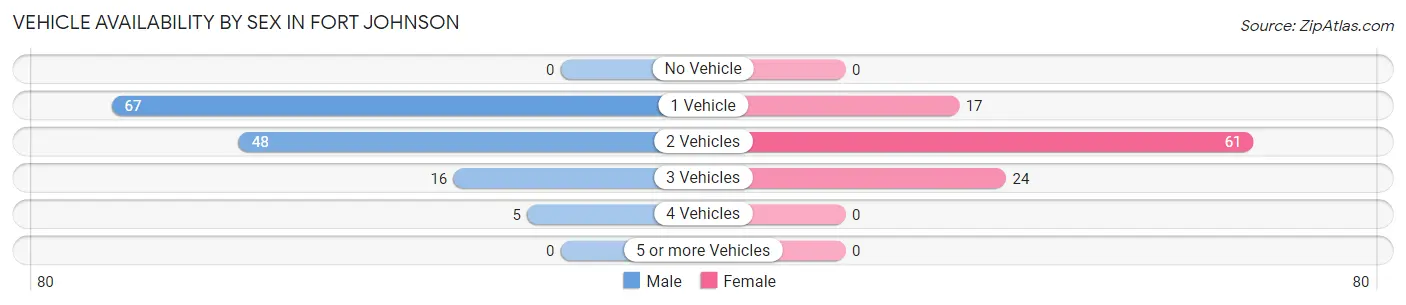
| Vehicles Available | Male | Female |
| No Vehicle | 0 (0.0%) | 0 (0.0%) |
| 1 Vehicle | 67 (49.3%) | 17 (16.7%) |
| 2 Vehicles | 48 (35.3%) | 61 (59.8%) |
| 3 Vehicles | 16 (11.8%) | 24 (23.5%) |
| 4 Vehicles | 5 (3.7%) | 0 (0.0%) |
| 5 or more Vehicles | 0 (0.0%) | 0 (0.0%) |
| Total | 136 (100.0%) | 102 (100.0%) |
Commute Time in Fort Johnson
The most frequently occuring commute durations in Fort Johnson are 10 to 14 minutes (56 commuters, 27.5%), 15 to 19 minutes (36 commuters, 17.6%), and 45 to 59 minutes (25 commuters, 12.2%).
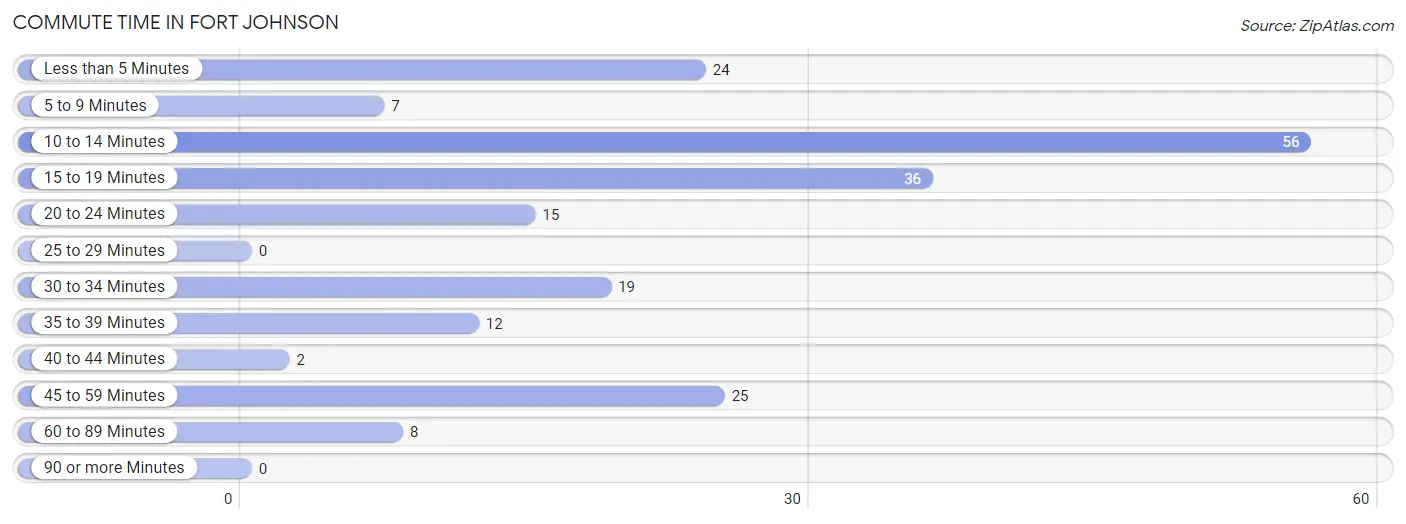
| Commute Time | # Commuters | % Commuters |
| Less than 5 Minutes | 24 | 11.8% |
| 5 to 9 Minutes | 7 | 3.4% |
| 10 to 14 Minutes | 56 | 27.5% |
| 15 to 19 Minutes | 36 | 17.6% |
| 20 to 24 Minutes | 15 | 7.3% |
| 25 to 29 Minutes | 0 | 0.0% |
| 30 to 34 Minutes | 19 | 9.3% |
| 35 to 39 Minutes | 12 | 5.9% |
| 40 to 44 Minutes | 2 | 1.0% |
| 45 to 59 Minutes | 25 | 12.2% |
| 60 to 89 Minutes | 8 | 3.9% |
| 90 or more Minutes | 0 | 0.0% |
Commute Time by Sex in Fort Johnson
The most common commute times in Fort Johnson are 15 to 19 minutes (25 commuters, 20.7%) for males and 10 to 14 minutes (49 commuters, 59.0%) for females.
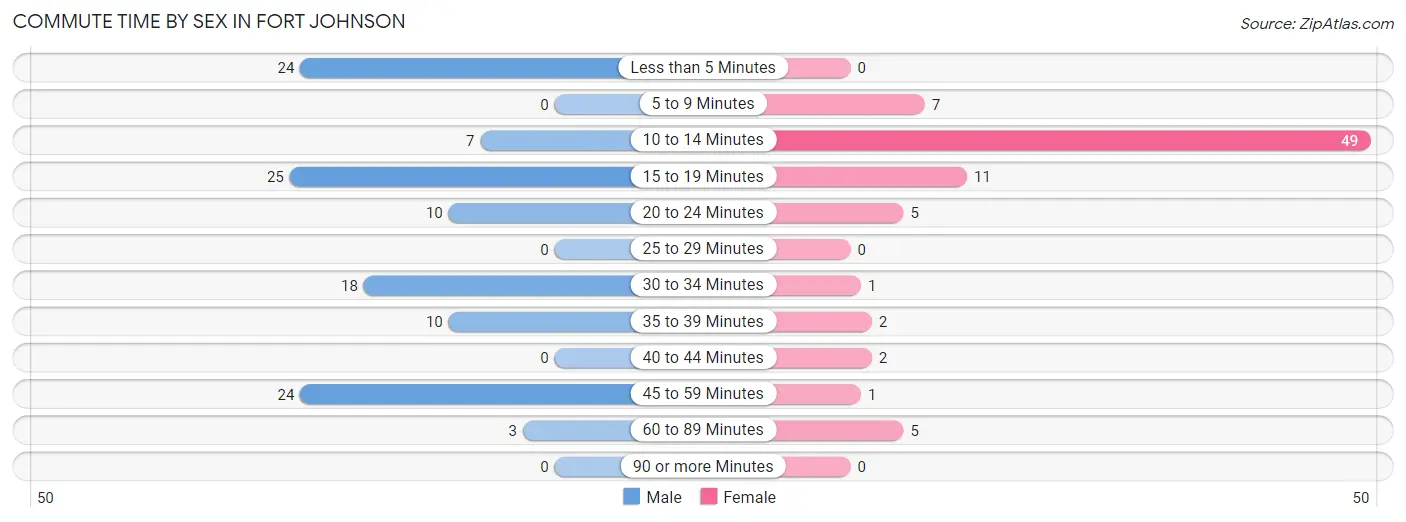
| Commute Time | Male | Female |
| Less than 5 Minutes | 24 (19.8%) | 0 (0.0%) |
| 5 to 9 Minutes | 0 (0.0%) | 7 (8.4%) |
| 10 to 14 Minutes | 7 (5.8%) | 49 (59.0%) |
| 15 to 19 Minutes | 25 (20.7%) | 11 (13.3%) |
| 20 to 24 Minutes | 10 (8.3%) | 5 (6.0%) |
| 25 to 29 Minutes | 0 (0.0%) | 0 (0.0%) |
| 30 to 34 Minutes | 18 (14.9%) | 1 (1.2%) |
| 35 to 39 Minutes | 10 (8.3%) | 2 (2.4%) |
| 40 to 44 Minutes | 0 (0.0%) | 2 (2.4%) |
| 45 to 59 Minutes | 24 (19.8%) | 1 (1.2%) |
| 60 to 89 Minutes | 3 (2.5%) | 5 (6.0%) |
| 90 or more Minutes | 0 (0.0%) | 0 (0.0%) |
Time of Departure to Work by Sex in Fort Johnson
The most frequent times of departure to work in Fort Johnson are 6:30 AM to 6:59 AM (19, 15.7%) for males and 7:00 AM to 7:29 AM (43, 51.8%) for females.
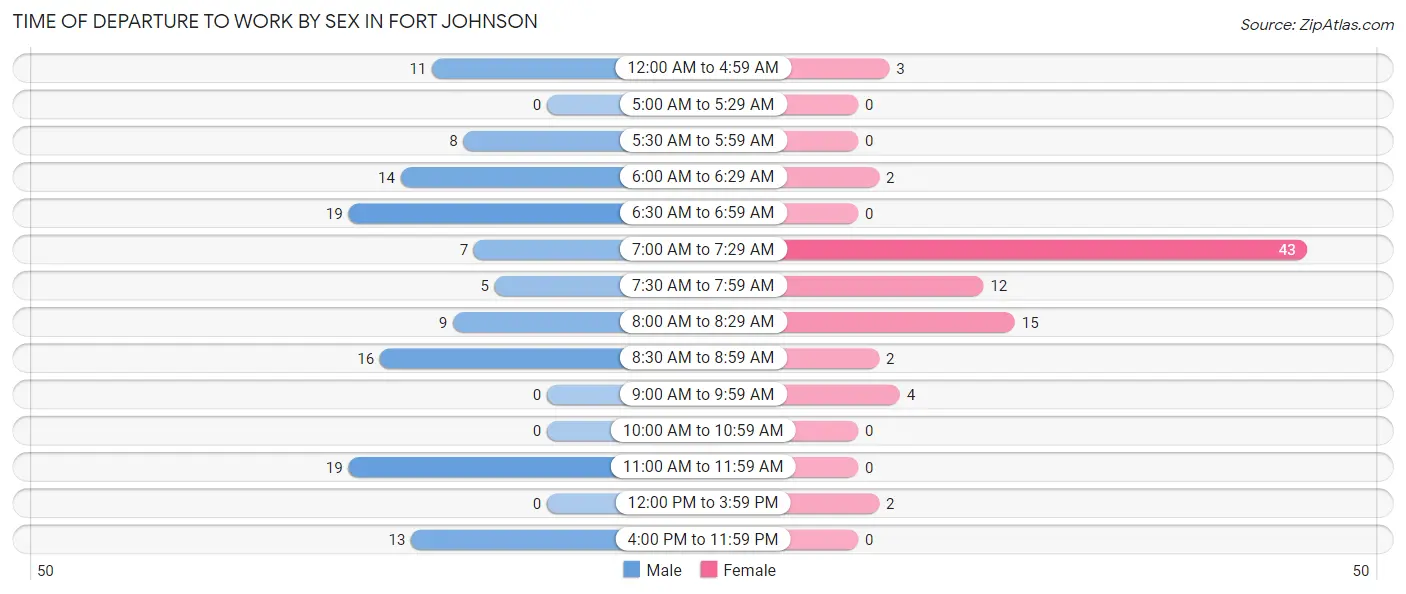
| Time of Departure | Male | Female |
| 12:00 AM to 4:59 AM | 11 (9.1%) | 3 (3.6%) |
| 5:00 AM to 5:29 AM | 0 (0.0%) | 0 (0.0%) |
| 5:30 AM to 5:59 AM | 8 (6.6%) | 0 (0.0%) |
| 6:00 AM to 6:29 AM | 14 (11.6%) | 2 (2.4%) |
| 6:30 AM to 6:59 AM | 19 (15.7%) | 0 (0.0%) |
| 7:00 AM to 7:29 AM | 7 (5.8%) | 43 (51.8%) |
| 7:30 AM to 7:59 AM | 5 (4.1%) | 12 (14.5%) |
| 8:00 AM to 8:29 AM | 9 (7.4%) | 15 (18.1%) |
| 8:30 AM to 8:59 AM | 16 (13.2%) | 2 (2.4%) |
| 9:00 AM to 9:59 AM | 0 (0.0%) | 4 (4.8%) |
| 10:00 AM to 10:59 AM | 0 (0.0%) | 0 (0.0%) |
| 11:00 AM to 11:59 AM | 19 (15.7%) | 0 (0.0%) |
| 12:00 PM to 3:59 PM | 0 (0.0%) | 2 (2.4%) |
| 4:00 PM to 11:59 PM | 13 (10.7%) | 0 (0.0%) |
| Total | 121 (100.0%) | 83 (100.0%) |
Housing Occupancy in Fort Johnson
Occupancy by Ownership in Fort Johnson
Of the total 196 dwellings in Fort Johnson, owner-occupied units account for 143 (73.0%), while renter-occupied units make up 53 (27.0%).
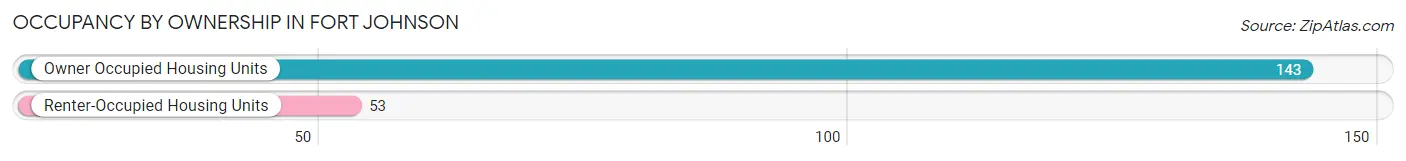
| Occupancy | # Housing Units | % Housing Units |
| Owner Occupied Housing Units | 143 | 73.0% |
| Renter-Occupied Housing Units | 53 | 27.0% |
| Total Occupied Housing Units | 196 | 100.0% |
Occupancy by Household Size in Fort Johnson
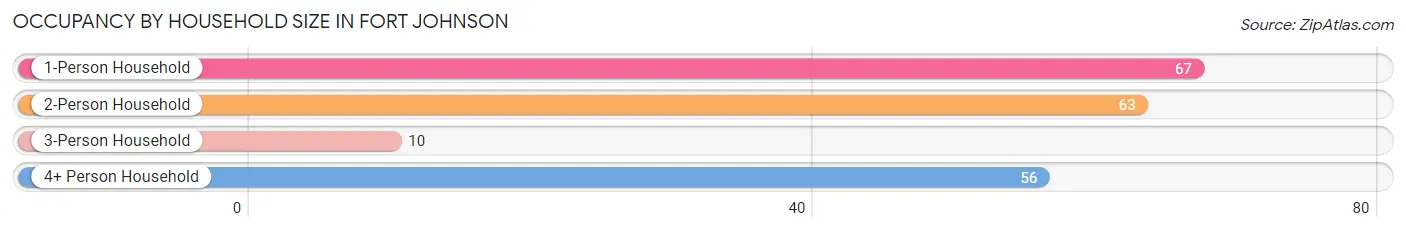
| Household Size | # Housing Units | % Housing Units |
| 1-Person Household | 67 | 34.2% |
| 2-Person Household | 63 | 32.1% |
| 3-Person Household | 10 | 5.1% |
| 4+ Person Household | 56 | 28.6% |
| Total Housing Units | 196 | 100.0% |
Occupancy by Ownership by Household Size in Fort Johnson
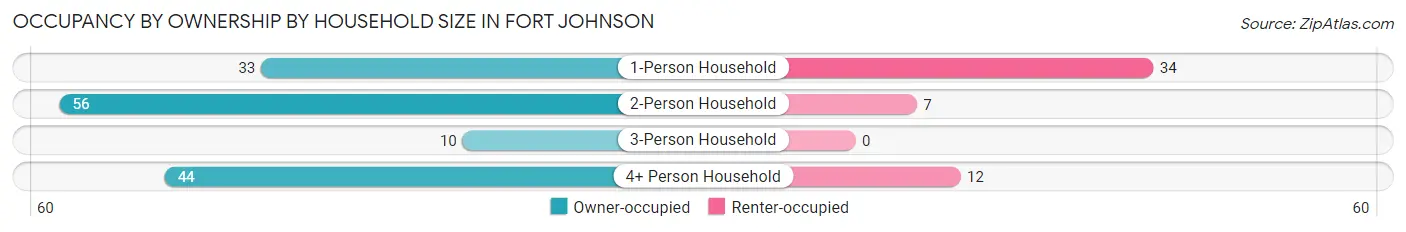
| Household Size | Owner-occupied | Renter-occupied |
| 1-Person Household | 33 (49.2%) | 34 (50.7%) |
| 2-Person Household | 56 (88.9%) | 7 (11.1%) |
| 3-Person Household | 10 (100.0%) | 0 (0.0%) |
| 4+ Person Household | 44 (78.6%) | 12 (21.4%) |
| Total Housing Units | 143 (73.0%) | 53 (27.0%) |
Occupancy by Educational Attainment in Fort Johnson
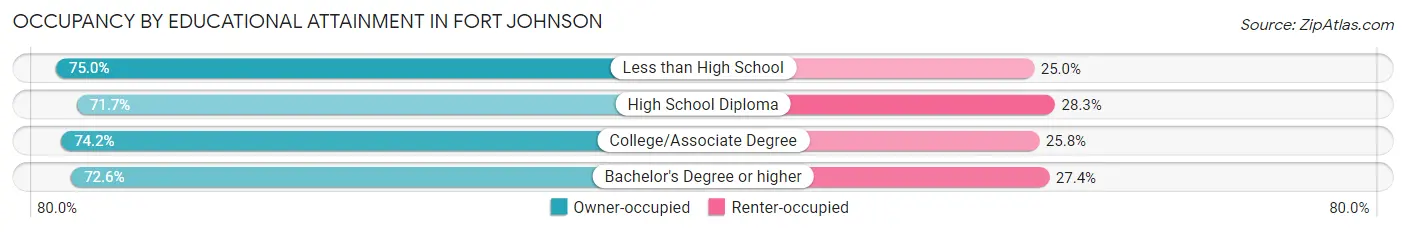
| Household Size | Owner-occupied | Renter-occupied |
| Less than High School | 6 (75.0%) | 2 (25.0%) |
| High School Diploma | 38 (71.7%) | 15 (28.3%) |
| College/Associate Degree | 46 (74.2%) | 16 (25.8%) |
| Bachelor's Degree or higher | 53 (72.6%) | 20 (27.4%) |
Occupancy by Age of Householder in Fort Johnson
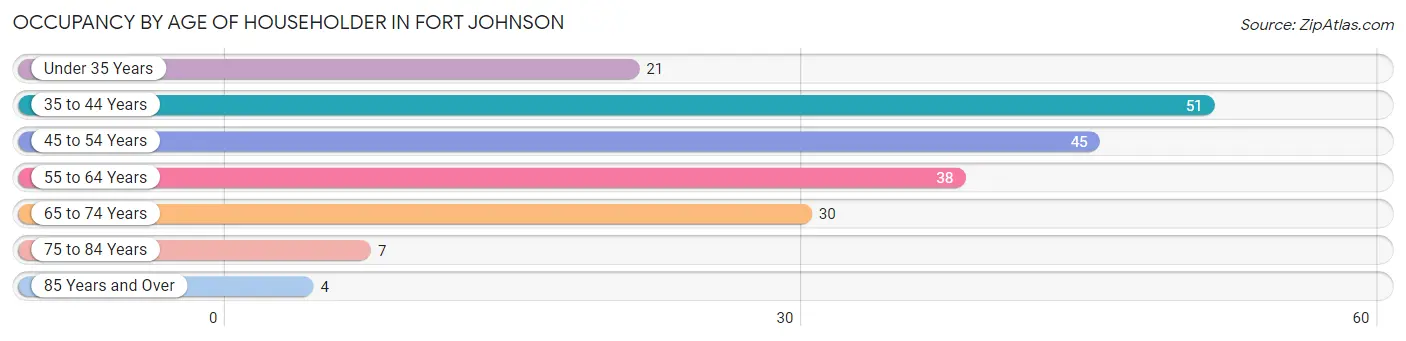
| Age Bracket | # Households | % Households |
| Under 35 Years | 21 | 10.7% |
| 35 to 44 Years | 51 | 26.0% |
| 45 to 54 Years | 45 | 23.0% |
| 55 to 64 Years | 38 | 19.4% |
| 65 to 74 Years | 30 | 15.3% |
| 75 to 84 Years | 7 | 3.6% |
| 85 Years and Over | 4 | 2.0% |
| Total | 196 | 100.0% |
Housing Finances in Fort Johnson
Median Income by Occupancy in Fort Johnson
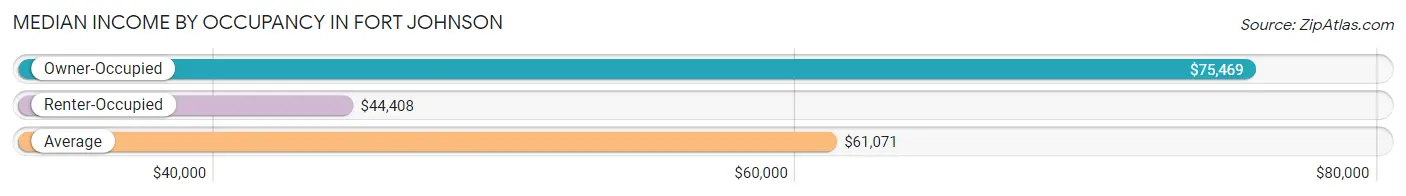
| Occupancy Type | # Households | Median Income |
| Owner-Occupied | 143 (73.0%) | $75,469 |
| Renter-Occupied | 53 (27.0%) | $44,408 |
| Average | 196 (100.0%) | $61,071 |
Occupancy by Householder Income Bracket in Fort Johnson
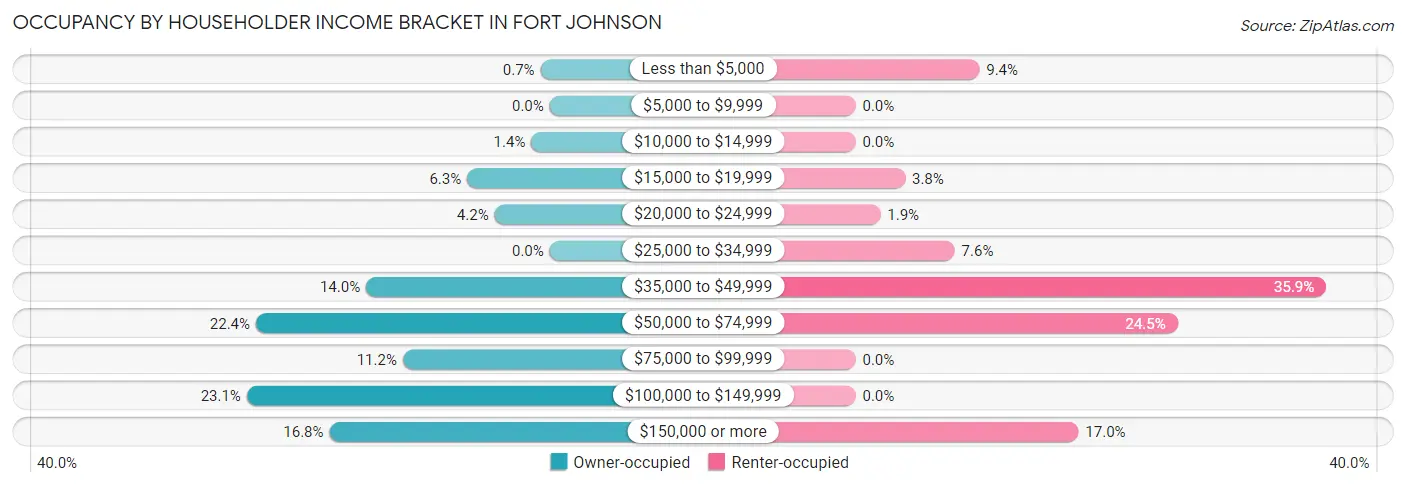
| Income Bracket | Owner-occupied | Renter-occupied |
| Less than $5,000 | 1 (0.7%) | 5 (9.4%) |
| $5,000 to $9,999 | 0 (0.0%) | 0 (0.0%) |
| $10,000 to $14,999 | 2 (1.4%) | 0 (0.0%) |
| $15,000 to $19,999 | 9 (6.3%) | 2 (3.8%) |
| $20,000 to $24,999 | 6 (4.2%) | 1 (1.9%) |
| $25,000 to $34,999 | 0 (0.0%) | 4 (7.5%) |
| $35,000 to $49,999 | 20 (14.0%) | 19 (35.8%) |
| $50,000 to $74,999 | 32 (22.4%) | 13 (24.5%) |
| $75,000 to $99,999 | 16 (11.2%) | 0 (0.0%) |
| $100,000 to $149,999 | 33 (23.1%) | 0 (0.0%) |
| $150,000 or more | 24 (16.8%) | 9 (17.0%) |
| Total | 143 (100.0%) | 53 (100.0%) |
Monthly Housing Cost Tiers in Fort Johnson
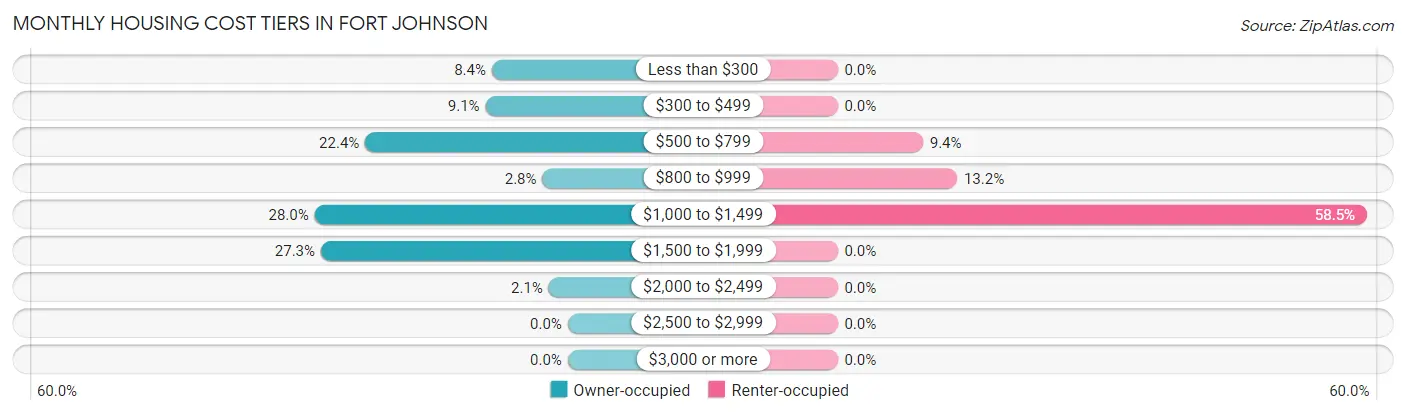
| Monthly Cost | Owner-occupied | Renter-occupied |
| Less than $300 | 12 (8.4%) | 0 (0.0%) |
| $300 to $499 | 13 (9.1%) | 0 (0.0%) |
| $500 to $799 | 32 (22.4%) | 5 (9.4%) |
| $800 to $999 | 4 (2.8%) | 7 (13.2%) |
| $1,000 to $1,499 | 40 (28.0%) | 31 (58.5%) |
| $1,500 to $1,999 | 39 (27.3%) | 0 (0.0%) |
| $2,000 to $2,499 | 3 (2.1%) | 0 (0.0%) |
| $2,500 to $2,999 | 0 (0.0%) | 0 (0.0%) |
| $3,000 or more | 0 (0.0%) | 0 (0.0%) |
| Total | 143 (100.0%) | 53 (100.0%) |
Physical Housing Characteristics in Fort Johnson
Housing Structures in Fort Johnson
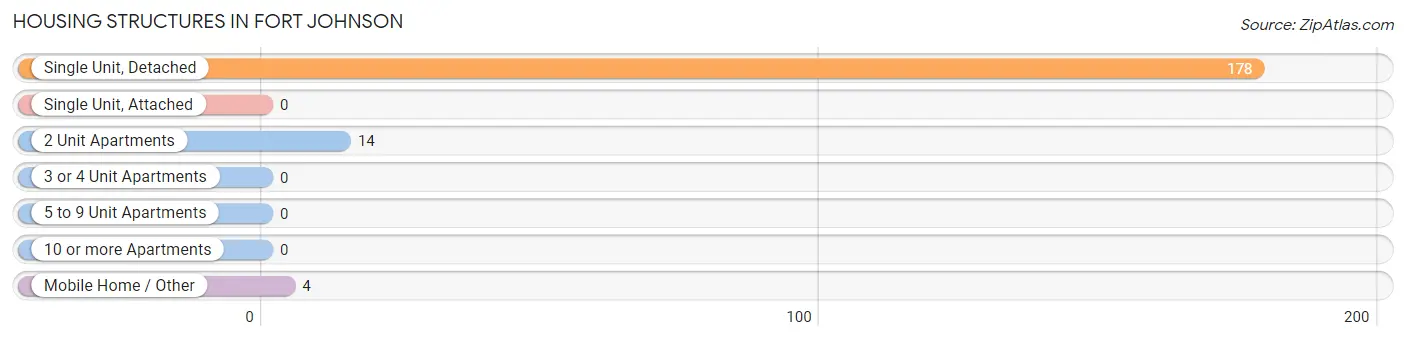
| Structure Type | # Housing Units | % Housing Units |
| Single Unit, Detached | 178 | 90.8% |
| Single Unit, Attached | 0 | 0.0% |
| 2 Unit Apartments | 14 | 7.1% |
| 3 or 4 Unit Apartments | 0 | 0.0% |
| 5 to 9 Unit Apartments | 0 | 0.0% |
| 10 or more Apartments | 0 | 0.0% |
| Mobile Home / Other | 4 | 2.0% |
| Total | 196 | 100.0% |
Housing Structures by Occupancy in Fort Johnson
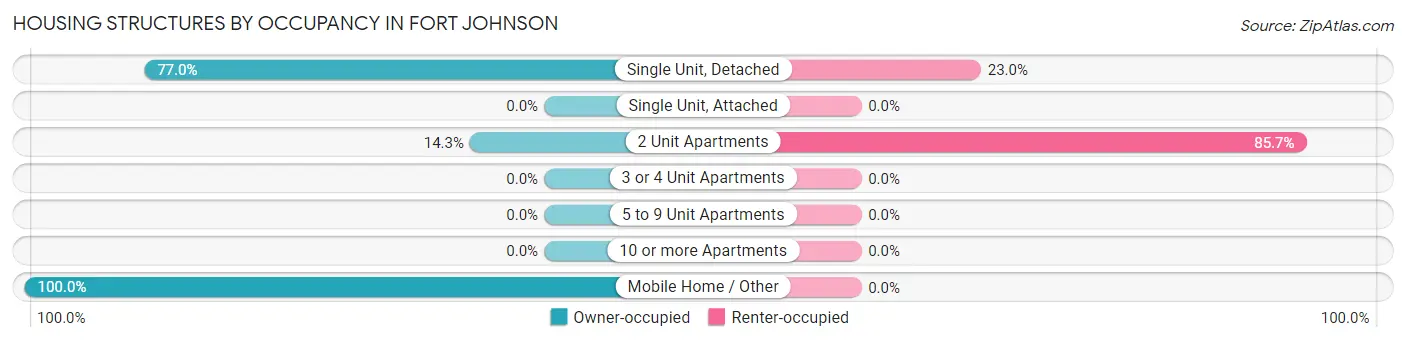
| Structure Type | Owner-occupied | Renter-occupied |
| Single Unit, Detached | 137 (77.0%) | 41 (23.0%) |
| Single Unit, Attached | 0 (0.0%) | 0 (0.0%) |
| 2 Unit Apartments | 2 (14.3%) | 12 (85.7%) |
| 3 or 4 Unit Apartments | 0 (0.0%) | 0 (0.0%) |
| 5 to 9 Unit Apartments | 0 (0.0%) | 0 (0.0%) |
| 10 or more Apartments | 0 (0.0%) | 0 (0.0%) |
| Mobile Home / Other | 4 (100.0%) | 0 (0.0%) |
| Total | 143 (73.0%) | 53 (27.0%) |
Housing Structures by Number of Rooms in Fort Johnson
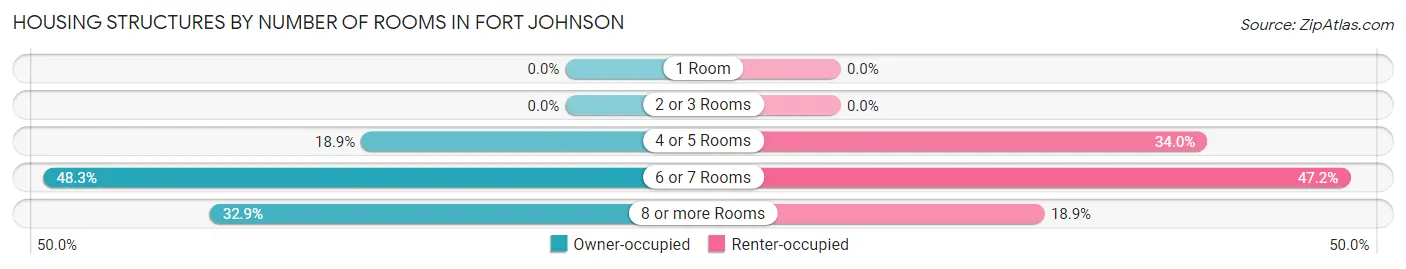
| Number of Rooms | Owner-occupied | Renter-occupied |
| 1 Room | 0 (0.0%) | 0 (0.0%) |
| 2 or 3 Rooms | 0 (0.0%) | 0 (0.0%) |
| 4 or 5 Rooms | 27 (18.9%) | 18 (34.0%) |
| 6 or 7 Rooms | 69 (48.2%) | 25 (47.2%) |
| 8 or more Rooms | 47 (32.9%) | 10 (18.9%) |
| Total | 143 (100.0%) | 53 (100.0%) |
Housing Structure by Heating Type in Fort Johnson
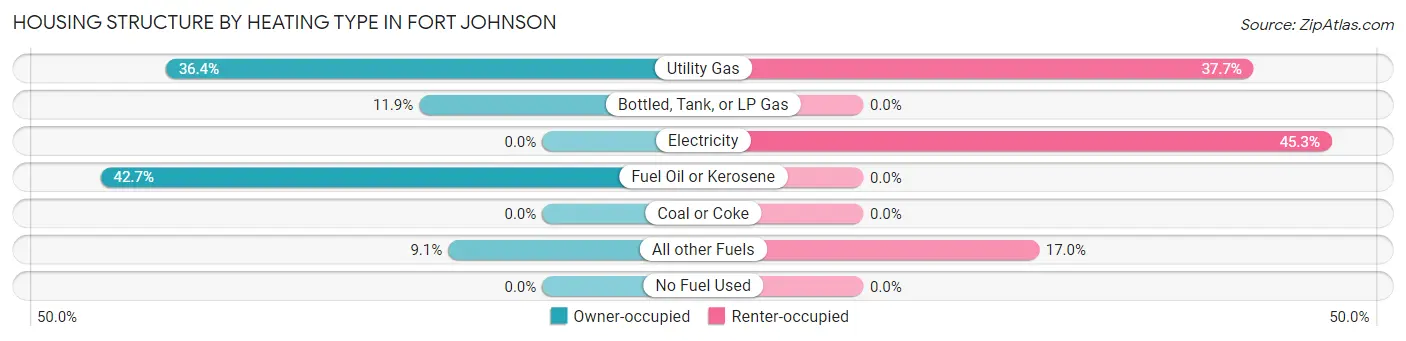
| Heating Type | Owner-occupied | Renter-occupied |
| Utility Gas | 52 (36.4%) | 20 (37.7%) |
| Bottled, Tank, or LP Gas | 17 (11.9%) | 0 (0.0%) |
| Electricity | 0 (0.0%) | 24 (45.3%) |
| Fuel Oil or Kerosene | 61 (42.7%) | 0 (0.0%) |
| Coal or Coke | 0 (0.0%) | 0 (0.0%) |
| All other Fuels | 13 (9.1%) | 9 (17.0%) |
| No Fuel Used | 0 (0.0%) | 0 (0.0%) |
| Total | 143 (100.0%) | 53 (100.0%) |
Household Vehicle Usage in Fort Johnson
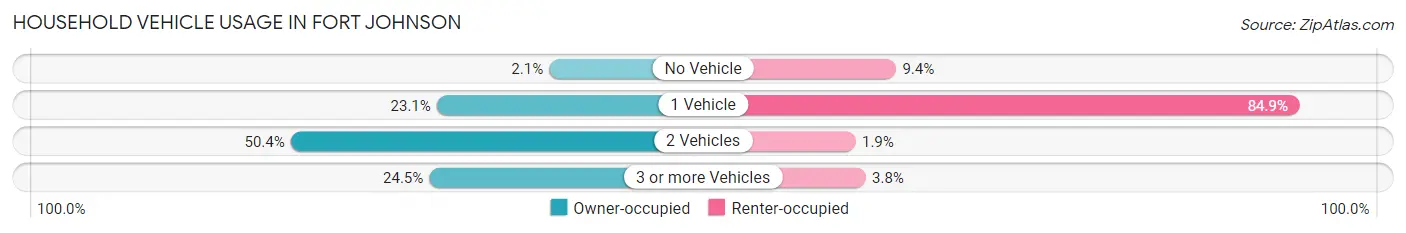
| Vehicles per Household | Owner-occupied | Renter-occupied |
| No Vehicle | 3 (2.1%) | 5 (9.4%) |
| 1 Vehicle | 33 (23.1%) | 45 (84.9%) |
| 2 Vehicles | 72 (50.3%) | 1 (1.9%) |
| 3 or more Vehicles | 35 (24.5%) | 2 (3.8%) |
| Total | 143 (100.0%) | 53 (100.0%) |
Real Estate & Mortgages in Fort Johnson
Real Estate and Mortgage Overview in Fort Johnson
| Characteristic | Without Mortgage | With Mortgage |
| Housing Units | 47 | 96 |
| Median Property Value | $96,900 | $130,000 |
| Median Household Income | $61,875 | $22 |
| Monthly Housing Costs | $488 | $0 |
| Real Estate Taxes | $2,188 | $0 |
Property Value by Mortgage Status in Fort Johnson
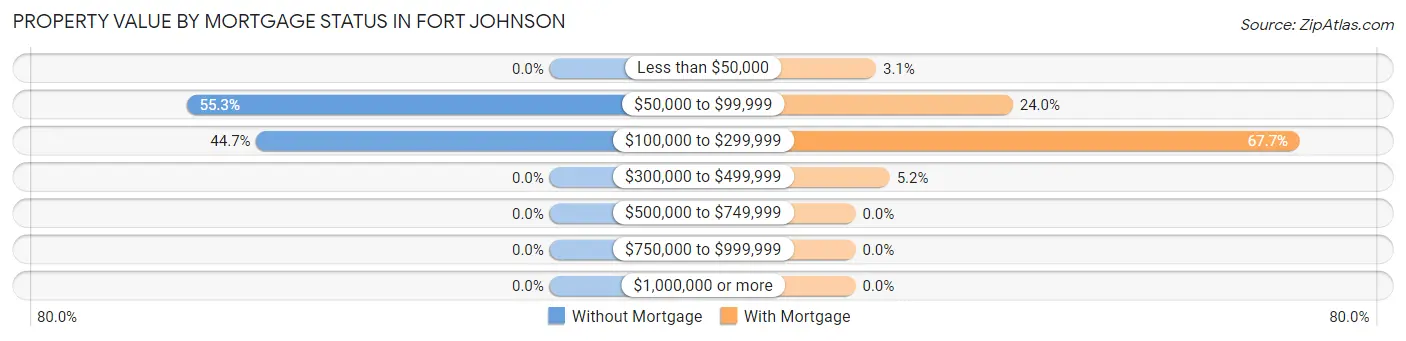
| Property Value | Without Mortgage | With Mortgage |
| Less than $50,000 | 0 (0.0%) | 3 (3.1%) |
| $50,000 to $99,999 | 26 (55.3%) | 23 (24.0%) |
| $100,000 to $299,999 | 21 (44.7%) | 65 (67.7%) |
| $300,000 to $499,999 | 0 (0.0%) | 5 (5.2%) |
| $500,000 to $749,999 | 0 (0.0%) | 0 (0.0%) |
| $750,000 to $999,999 | 0 (0.0%) | 0 (0.0%) |
| $1,000,000 or more | 0 (0.0%) | 0 (0.0%) |
| Total | 47 (100.0%) | 96 (100.0%) |
Household Income by Mortgage Status in Fort Johnson
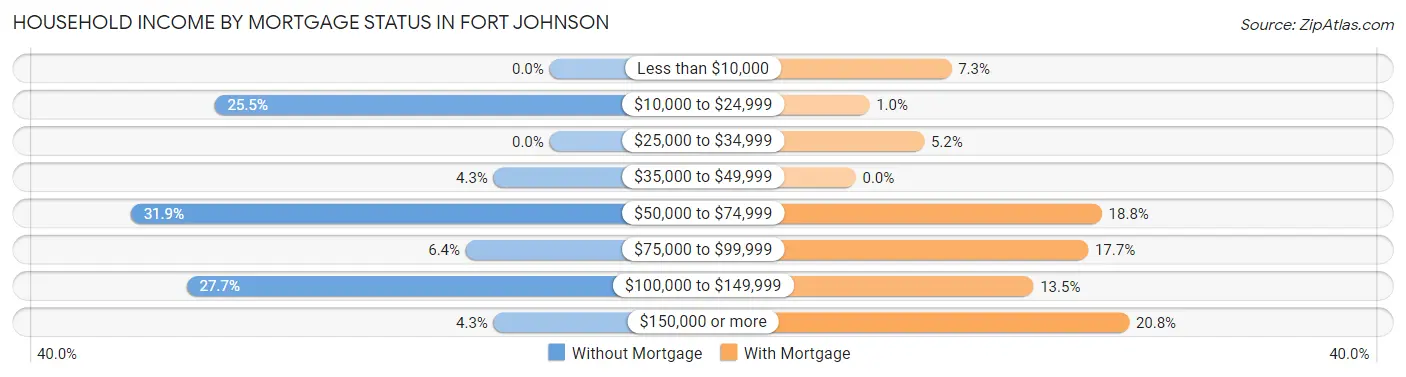
| Household Income | Without Mortgage | With Mortgage |
| Less than $10,000 | 0 (0.0%) | 7 (7.3%) |
| $10,000 to $24,999 | 12 (25.5%) | 1 (1.0%) |
| $25,000 to $34,999 | 0 (0.0%) | 5 (5.2%) |
| $35,000 to $49,999 | 2 (4.3%) | 0 (0.0%) |
| $50,000 to $74,999 | 15 (31.9%) | 18 (18.8%) |
| $75,000 to $99,999 | 3 (6.4%) | 17 (17.7%) |
| $100,000 to $149,999 | 13 (27.7%) | 13 (13.5%) |
| $150,000 or more | 2 (4.3%) | 20 (20.8%) |
| Total | 47 (100.0%) | 96 (100.0%) |
Property Value to Household Income Ratio in Fort Johnson
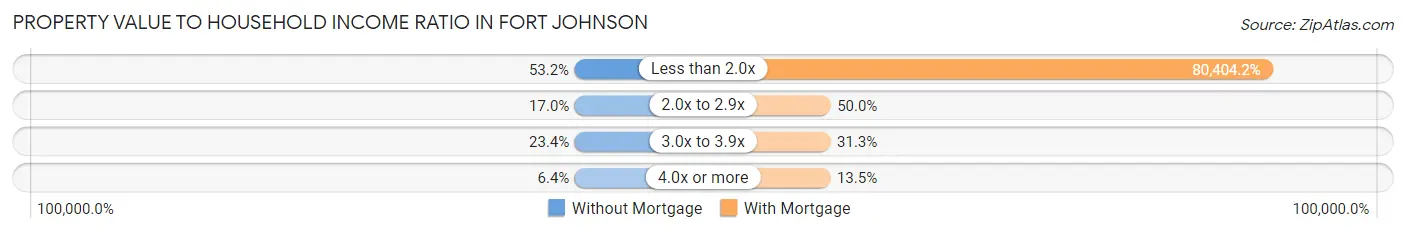
| Value-to-Income Ratio | Without Mortgage | With Mortgage |
| Less than 2.0x | 25 (53.2%) | 77,188 (80,404.2%) |
| 2.0x to 2.9x | 8 (17.0%) | 48 (50.0%) |
| 3.0x to 3.9x | 11 (23.4%) | 30 (31.2%) |
| 4.0x or more | 3 (6.4%) | 13 (13.5%) |
| Total | 47 (100.0%) | 96 (100.0%) |
Real Estate Taxes by Mortgage Status in Fort Johnson
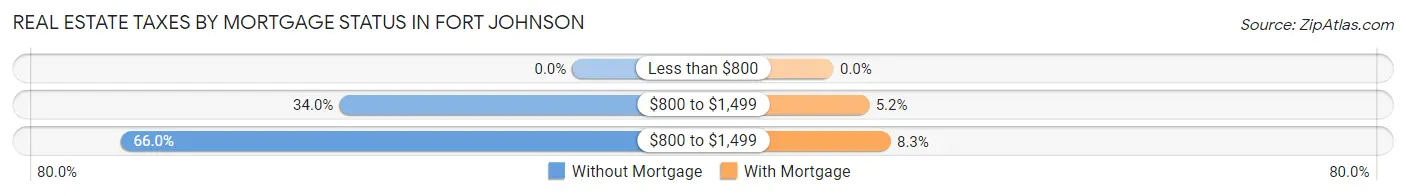
| Property Taxes | Without Mortgage | With Mortgage |
| Less than $800 | 0 (0.0%) | 0 (0.0%) |
| $800 to $1,499 | 16 (34.0%) | 5 (5.2%) |
| $800 to $1,499 | 31 (66.0%) | 8 (8.3%) |
| Total | 47 (100.0%) | 96 (100.0%) |
Health & Disability in Fort Johnson
Health Insurance Coverage by Age in Fort Johnson
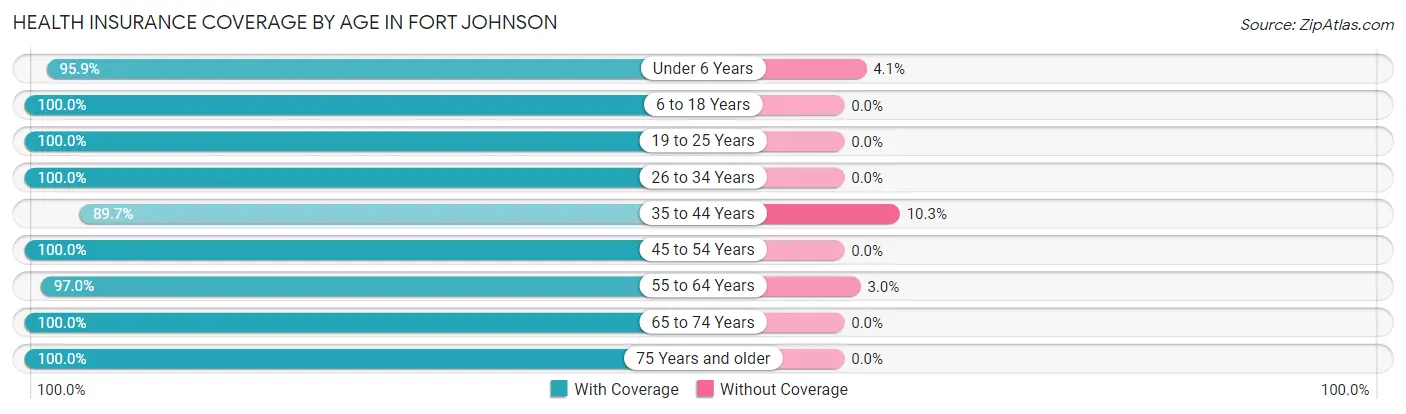
| Age Bracket | With Coverage | Without Coverage |
| Under 6 Years | 47 (95.9%) | 2 (4.1%) |
| 6 to 18 Years | 88 (100.0%) | 0 (0.0%) |
| 19 to 25 Years | 46 (100.0%) | 0 (0.0%) |
| 26 to 34 Years | 43 (100.0%) | 0 (0.0%) |
| 35 to 44 Years | 78 (89.7%) | 9 (10.3%) |
| 45 to 54 Years | 61 (100.0%) | 0 (0.0%) |
| 55 to 64 Years | 64 (97.0%) | 2 (3.0%) |
| 65 to 74 Years | 43 (100.0%) | 0 (0.0%) |
| 75 Years and older | 24 (100.0%) | 0 (0.0%) |
| Total | 494 (97.4%) | 13 (2.6%) |
Health Insurance Coverage by Citizenship Status in Fort Johnson
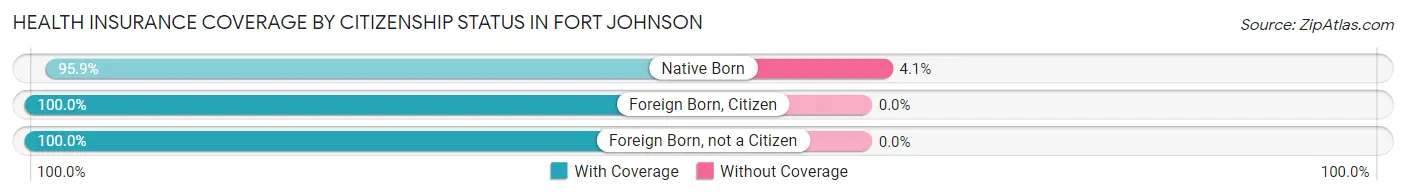
| Citizenship Status | With Coverage | Without Coverage |
| Native Born | 47 (95.9%) | 2 (4.1%) |
| Foreign Born, Citizen | 88 (100.0%) | 0 (0.0%) |
| Foreign Born, not a Citizen | 46 (100.0%) | 0 (0.0%) |
Health Insurance Coverage by Household Income in Fort Johnson
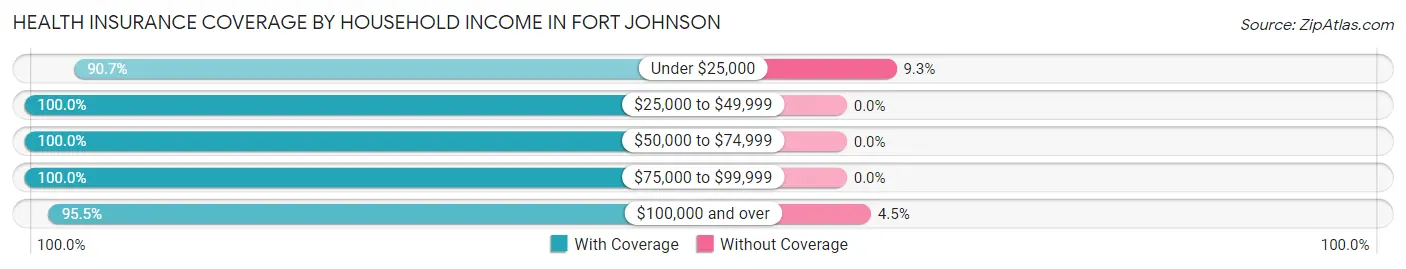
| Household Income | With Coverage | Without Coverage |
| Under $25,000 | 39 (90.7%) | 4 (9.3%) |
| $25,000 to $49,999 | 119 (100.0%) | 0 (0.0%) |
| $50,000 to $74,999 | 116 (100.0%) | 0 (0.0%) |
| $75,000 to $99,999 | 30 (100.0%) | 0 (0.0%) |
| $100,000 and over | 190 (95.5%) | 9 (4.5%) |
Public vs Private Health Insurance Coverage by Age in Fort Johnson
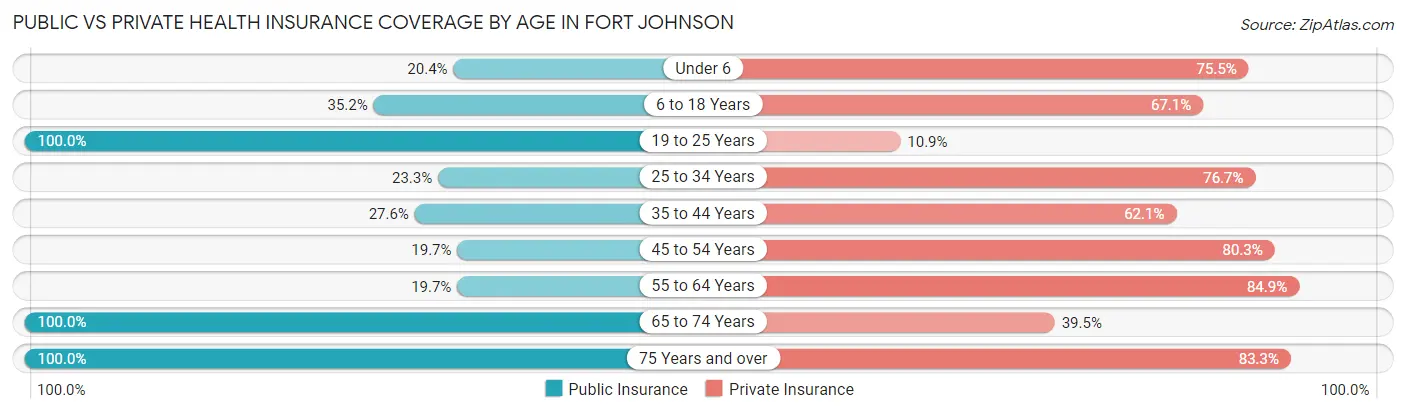
| Age Bracket | Public Insurance | Private Insurance |
| Under 6 | 10 (20.4%) | 37 (75.5%) |
| 6 to 18 Years | 31 (35.2%) | 59 (67.0%) |
| 19 to 25 Years | 46 (100.0%) | 5 (10.9%) |
| 25 to 34 Years | 10 (23.3%) | 33 (76.7%) |
| 35 to 44 Years | 24 (27.6%) | 54 (62.1%) |
| 45 to 54 Years | 12 (19.7%) | 49 (80.3%) |
| 55 to 64 Years | 13 (19.7%) | 56 (84.9%) |
| 65 to 74 Years | 43 (100.0%) | 17 (39.5%) |
| 75 Years and over | 24 (100.0%) | 20 (83.3%) |
| Total | 213 (42.0%) | 330 (65.1%) |
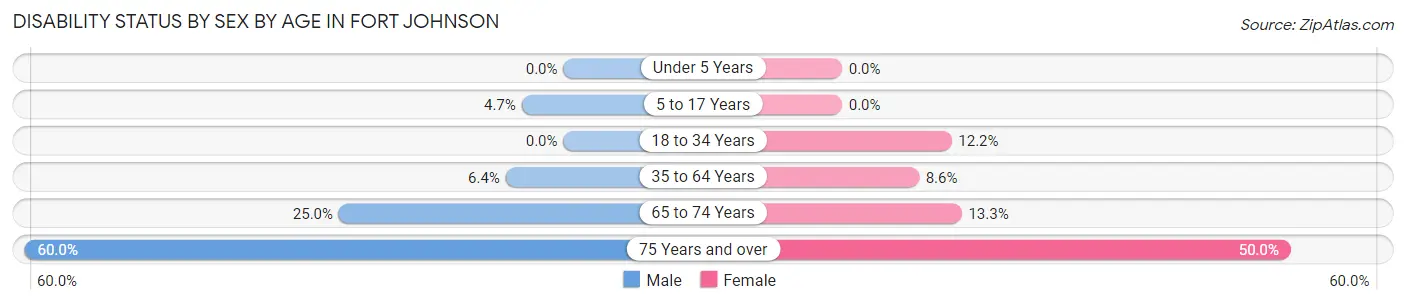
Disability Status by Sex by Age in Fort Johnson
| Age Bracket | Male | Female |
| Under 5 Years | 0 (0.0%) | 0 (0.0%) |
| 5 to 17 Years | 2 (4.6%) | 0 (0.0%) |
| 18 to 34 Years | 0 (0.0%) | 5 (12.2%) |
| 35 to 64 Years | 7 (6.4%) | 9 (8.6%) |
| 65 to 74 Years | 7 (25.0%) | 2 (13.3%) |
| 75 Years and over | 6 (60.0%) | 7 (50.0%) |
Disability Class by Sex by Age in Fort Johnson
Disability Class: Hearing Difficulty
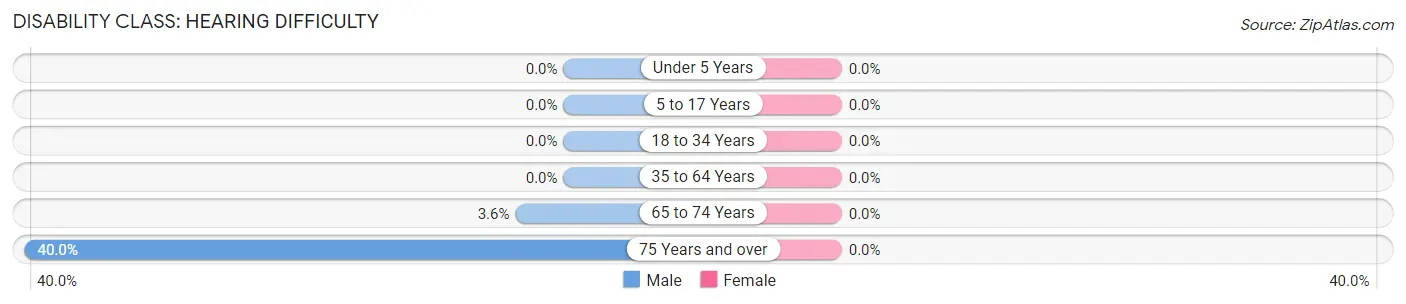
| Age Bracket | Male | Female |
| Under 5 Years | 0 (0.0%) | 0 (0.0%) |
| 5 to 17 Years | 0 (0.0%) | 0 (0.0%) |
| 18 to 34 Years | 0 (0.0%) | 0 (0.0%) |
| 35 to 64 Years | 0 (0.0%) | 0 (0.0%) |
| 65 to 74 Years | 1 (3.6%) | 0 (0.0%) |
| 75 Years and over | 4 (40.0%) | 0 (0.0%) |
Disability Class: Vision Difficulty
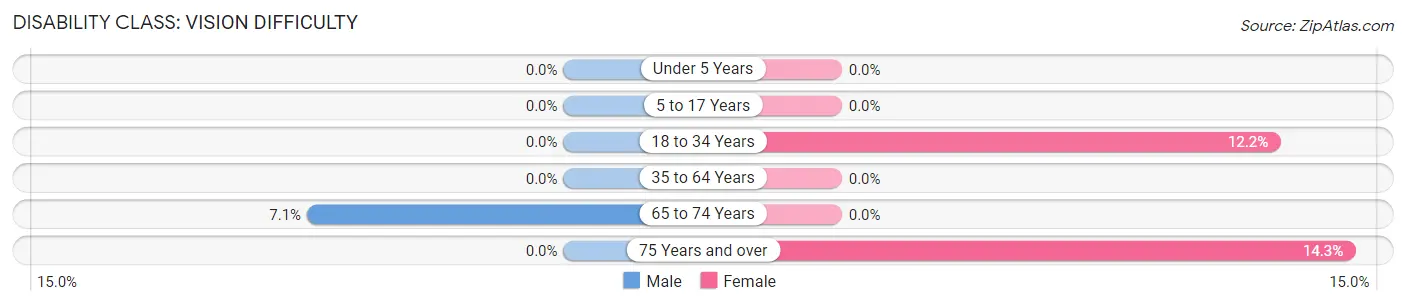
| Age Bracket | Male | Female |
| Under 5 Years | 0 (0.0%) | 0 (0.0%) |
| 5 to 17 Years | 0 (0.0%) | 0 (0.0%) |
| 18 to 34 Years | 0 (0.0%) | 5 (12.2%) |
| 35 to 64 Years | 0 (0.0%) | 0 (0.0%) |
| 65 to 74 Years | 2 (7.1%) | 0 (0.0%) |
| 75 Years and over | 0 (0.0%) | 2 (14.3%) |
Disability Class: Cognitive Difficulty
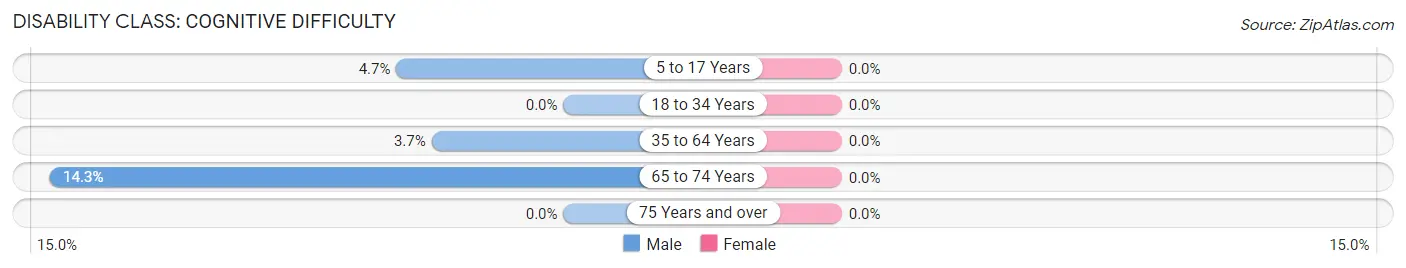
| Age Bracket | Male | Female |
| 5 to 17 Years | 2 (4.6%) | 0 (0.0%) |
| 18 to 34 Years | 0 (0.0%) | 0 (0.0%) |
| 35 to 64 Years | 4 (3.7%) | 0 (0.0%) |
| 65 to 74 Years | 4 (14.3%) | 0 (0.0%) |
| 75 Years and over | 0 (0.0%) | 0 (0.0%) |
Disability Class: Ambulatory Difficulty
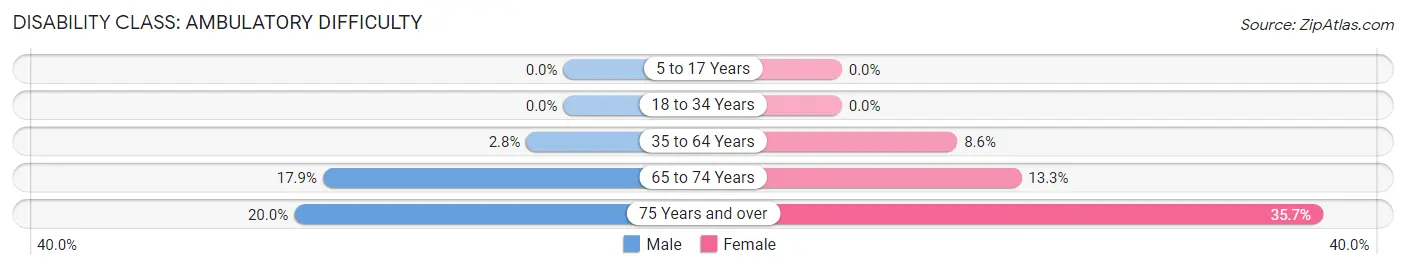
| Age Bracket | Male | Female |
| 5 to 17 Years | 0 (0.0%) | 0 (0.0%) |
| 18 to 34 Years | 0 (0.0%) | 0 (0.0%) |
| 35 to 64 Years | 3 (2.8%) | 9 (8.6%) |
| 65 to 74 Years | 5 (17.9%) | 2 (13.3%) |
| 75 Years and over | 2 (20.0%) | 5 (35.7%) |
Disability Class: Self-Care Difficulty
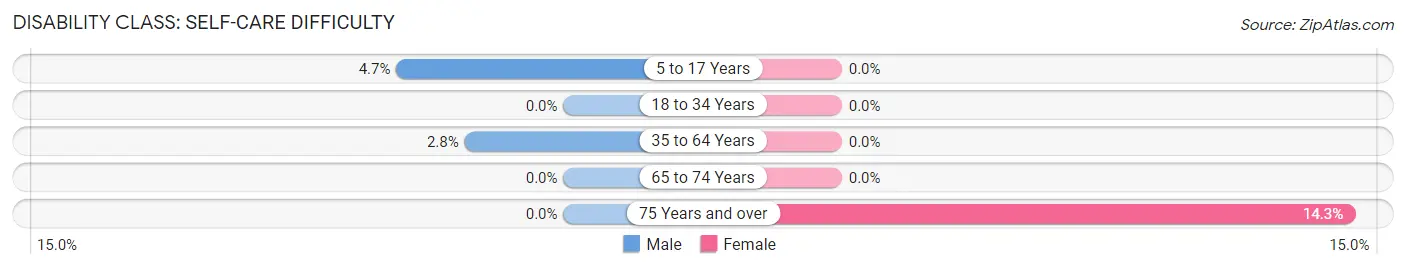
| Age Bracket | Male | Female |
| 5 to 17 Years | 2 (4.6%) | 0 (0.0%) |
| 18 to 34 Years | 0 (0.0%) | 0 (0.0%) |
| 35 to 64 Years | 3 (2.8%) | 0 (0.0%) |
| 65 to 74 Years | 0 (0.0%) | 0 (0.0%) |
| 75 Years and over | 0 (0.0%) | 2 (14.3%) |
Technology Access in Fort Johnson
Computing Device Access in Fort Johnson
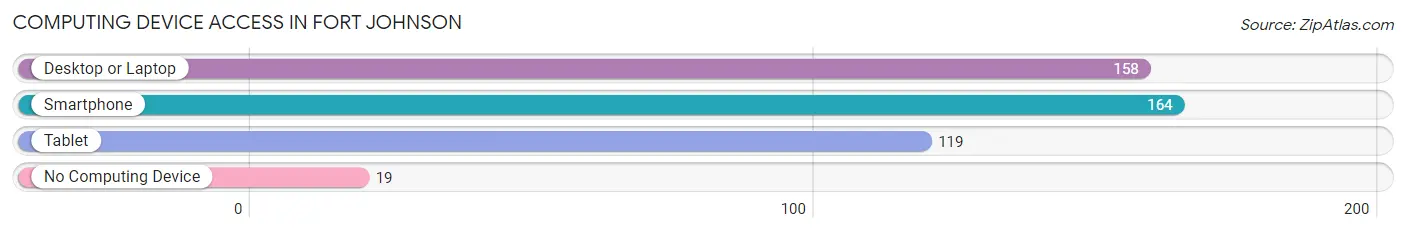
| Device Type | # Households | % Households |
| Desktop or Laptop | 158 | 80.6% |
| Smartphone | 164 | 83.7% |
| Tablet | 119 | 60.7% |
| No Computing Device | 19 | 9.7% |
| Total | 196 | 100.0% |
Internet Access in Fort Johnson
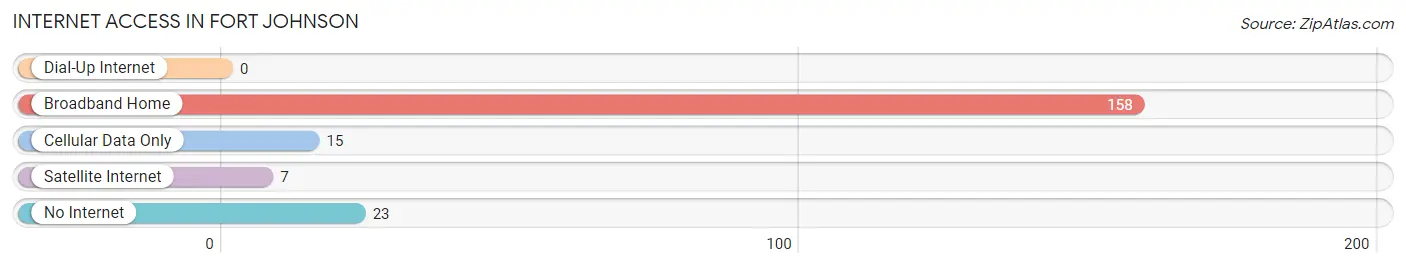
| Internet Type | # Households | % Households |
| Dial-Up Internet | 0 | 0.0% |
| Broadband Home | 158 | 80.6% |
| Cellular Data Only | 15 | 7.6% |
| Satellite Internet | 7 | 3.6% |
| No Internet | 23 | 11.7% |
| Total | 196 | 100.0% |
Fort Johnson Summary
Johnson, New York is a small hamlet located in Montgomery County, New York. It is situated on the Mohawk River, just south of the city of Amsterdam. The hamlet is part of the town of Amsterdam, and is located in the Mohawk Valley region of the state. The population of Johnson was 1,845 at the 2010 census.
History
Johnson was first settled in 1725 by Dutch settlers, who named it after the Dutch city of Amsterdam. The hamlet was originally known as "Veeder's Bush," after the first settler, Johannes Veeder. The hamlet was later renamed Johnson, after the Johnson family, who were prominent in the area.
In the late 19th century, Johnson was a thriving industrial center, with several factories and mills located in the area. The hamlet was also home to a number of churches, including the Dutch Reformed Church, the Methodist Episcopal Church, and the Roman Catholic Church.
Geography
Johnson is located at 42°59'N 74°37'W (42.983, -74.619). The hamlet is situated on the Mohawk River, just south of the city of Amsterdam. The hamlet is part of the town of Amsterdam, and is located in the Mohawk Valley region of the state.
The total area of Johnson is 0.9 square miles, all of which is land. The hamlet is located in a rural area, with the nearest major city being Albany, which is about 40 miles away.
Economy
The economy of Johnson is largely based on agriculture and tourism. The hamlet is home to several farms, which produce a variety of crops, including corn, soybeans, and hay. The hamlet is also home to several wineries, which produce a variety of wines.
Tourism is also an important part of the economy of Johnson. The hamlet is home to several historic sites, including the Johnson-Veeder House, which was built in 1725 and is listed on the National Register of Historic Places. The hamlet is also home to several parks, including the Johnson-Veeder Park, which offers a variety of recreational activities.
Demographics
As of the 2010 census, the population of Johnson was 1,845. The racial makeup of the hamlet was 94.2% White, 1.2% African American, 0.2% Native American, 0.7% Asian, 0.1% Pacific Islander, 1.7% from other races, and 1.9% from two or more races. Hispanic or Latino of any race were 4.2% of the population.
The median income for a household in Johnson was $45,938, and the median income for a family was $50,938. The per capita income for the hamlet was $20,938. About 8.2% of families and 10.2% of the population were below the poverty line, including 14.2% of those under age 18 and 5.2% of those age 65 or over.
Common Questions
What is Per Capita Income in Fort Johnson?
Per Capita income in Fort Johnson is $35,309.
What is the Median Family Income in Fort Johnson?
Median Family Income in Fort Johnson is $75,250.
What is the Median Household income in Fort Johnson?
Median Household Income in Fort Johnson is $61,071.
What is Income or Wage Gap in Fort Johnson?
Income or Wage Gap in Fort Johnson is 5.0%.
Women in Fort Johnson earn 95.0 cents for every dollar earned by a man.
What is Inequality or Gini Index in Fort Johnson?
Inequality or Gini Index in Fort Johnson is 0.41.
What is the Total Population of Fort Johnson?
Total Population of Fort Johnson is 510.
What is the Total Male Population of Fort Johnson?
Total Male Population of Fort Johnson is 267.
What is the Total Female Population of Fort Johnson?
Total Female Population of Fort Johnson is 243.
What is the Ratio of Males per 100 Females in Fort Johnson?
There are 109.88 Males per 100 Females in Fort Johnson.
What is the Ratio of Females per 100 Males in Fort Johnson?
There are 91.01 Females per 100 Males in Fort Johnson.
What is the Median Population Age in Fort Johnson?
Median Population Age in Fort Johnson is 39.6 Years.
What is the Average Family Size in Fort Johnson
Average Family Size in Fort Johnson is 3.5 People.
What is the Average Household Size in Fort Johnson
Average Household Size in Fort Johnson is 2.6 People.
How Large is the Labor Force in Fort Johnson?
There are 267 People in the Labor Forcein in Fort Johnson.
What is the Percentage of People in the Labor Force in Fort Johnson?
64.3% of People are in the Labor Force in Fort Johnson.
What is the Unemployment Rate in Fort Johnson?
Unemployment Rate in Fort Johnson is 10.6%.