Westfield, NY Map & Demographics
Westfield Map
Westfield Overview
$26,624
PER CAPITA INCOME
$69,000
AVG FAMILY INCOME
$43,369
AVG HOUSEHOLD INCOME
43.4%
WAGE / INCOME GAP [ % ]
56.6¢/ $1
WAGE / INCOME GAP [ $ ]
0.39
INEQUALITY / GINI INDEX
2,714
TOTAL POPULATION
1,404
MALE POPULATION
1,310
FEMALE POPULATION
107.18
MALES / 100 FEMALES
93.30
FEMALES / 100 MALES
49.9
MEDIAN AGE
3.7
AVG FAMILY SIZE
2.0
AVG HOUSEHOLD SIZE
1,061
LABOR FORCE [ PEOPLE ]
51.2%
PERCENT IN LABOR FORCE
7.0%
UNEMPLOYMENT RATE
Westfield Zip Codes
Westfield Area Codes
Income in Westfield
Income Overview in Westfield
Per Capita Income in Westfield is $26,624, while median incomes of families and households are $69,000 and $43,369 respectively.
| Characteristic | Number | Measure |
| Per Capita Income | 2,714 | $26,624 |
| Median Family Income | 432 | $69,000 |
| Mean Family Income | 432 | $70,609 |
| Median Household Income | 1,312 | $43,369 |
| Mean Household Income | 1,312 | $52,997 |
| Income Deficit | 432 | $0 |
| Wage / Income Gap (%) | 2,714 | 43.41% |
| Wage / Income Gap ($) | 2,714 | 56.59¢ per $1 |
| Gini / Inequality Index | 2,714 | 0.39 |
Earnings by Sex in Westfield
Average Earnings in Westfield are $35,813, $24,621 for men and $43,508 for women, a difference of 43.4%.
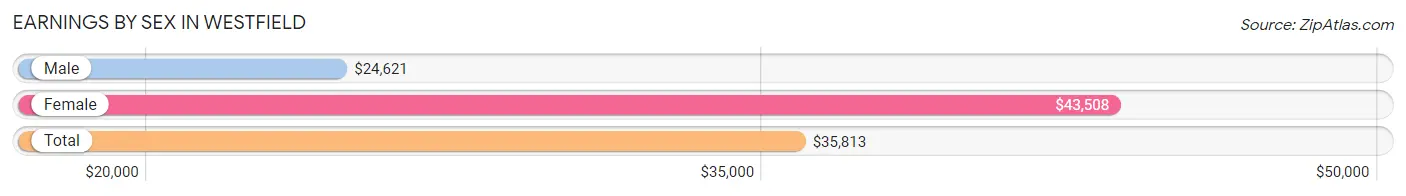
| Sex | Number | Average Earnings |
| Male | 707 (65.6%) | $24,621 |
| Female | 370 (34.4%) | $43,508 |
| Total | 1,077 (100.0%) | $35,813 |
Earnings by Sex by Income Bracket in Westfield
The most common earnings brackets in Westfield are $5,000 to $7,499 for men (163 | 23.1%) and $40,000 to $44,999 for women (119 | 32.2%).
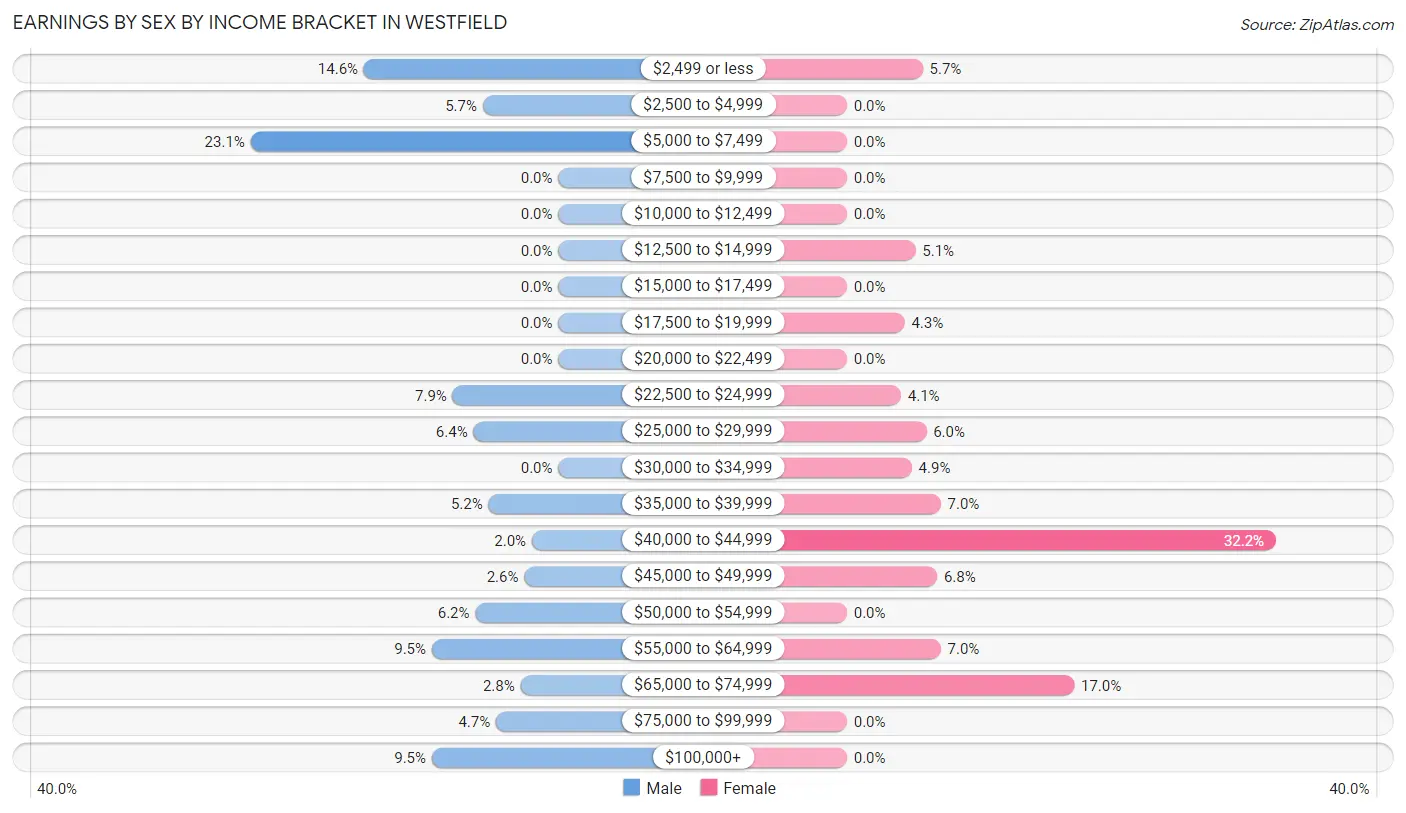
| Income | Male | Female |
| $2,499 or less | 103 (14.6%) | 21 (5.7%) |
| $2,500 to $4,999 | 40 (5.7%) | 0 (0.0%) |
| $5,000 to $7,499 | 163 (23.1%) | 0 (0.0%) |
| $7,500 to $9,999 | 0 (0.0%) | 0 (0.0%) |
| $10,000 to $12,499 | 0 (0.0%) | 0 (0.0%) |
| $12,500 to $14,999 | 0 (0.0%) | 19 (5.1%) |
| $15,000 to $17,499 | 0 (0.0%) | 0 (0.0%) |
| $17,500 to $19,999 | 0 (0.0%) | 16 (4.3%) |
| $20,000 to $22,499 | 0 (0.0%) | 0 (0.0%) |
| $22,500 to $24,999 | 56 (7.9%) | 15 (4.1%) |
| $25,000 to $29,999 | 45 (6.4%) | 22 (5.9%) |
| $30,000 to $34,999 | 0 (0.0%) | 18 (4.9%) |
| $35,000 to $39,999 | 37 (5.2%) | 26 (7.0%) |
| $40,000 to $44,999 | 14 (2.0%) | 119 (32.2%) |
| $45,000 to $49,999 | 18 (2.5%) | 25 (6.8%) |
| $50,000 to $54,999 | 44 (6.2%) | 0 (0.0%) |
| $55,000 to $64,999 | 67 (9.5%) | 26 (7.0%) |
| $65,000 to $74,999 | 20 (2.8%) | 63 (17.0%) |
| $75,000 to $99,999 | 33 (4.7%) | 0 (0.0%) |
| $100,000+ | 67 (9.5%) | 0 (0.0%) |
| Total | 707 (100.0%) | 370 (100.0%) |
Earnings by Sex by Educational Attainment in Westfield
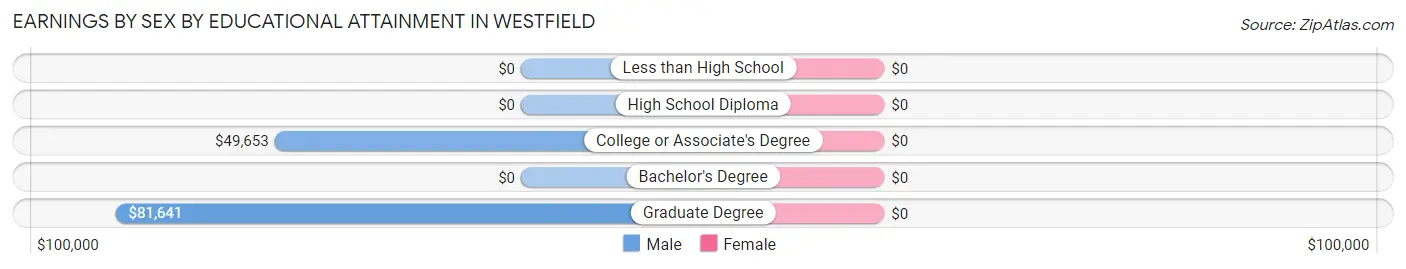
| Educational Attainment | Male Income | Female Income |
| Less than High School | - | - |
| High School Diploma | - | - |
| College or Associate's Degree | $49,653 | $0 |
| Bachelor's Degree | - | - |
| Graduate Degree | $81,641 | $0 |
| Total | $25,556 | $43,729 |
Family Income in Westfield
Family Income Brackets in Westfield
According to the Westfield family income data, there are 102 families falling into the $50,000 to $74,999 income range, which is the most common income bracket and makes up 23.6% of all families.
| Income Bracket | # Families | % Families |
| Less than $10,000 | 42 | 9.7% |
| $10,000 to $14,999 | 0 | 0.0% |
| $15,000 to $24,999 | 0 | 0.0% |
| $25,000 to $34,999 | 39 | 9.0% |
| $35,000 to $49,999 | 56 | 13.0% |
| $50,000 to $74,999 | 102 | 23.6% |
| $75,000 to $99,999 | 92 | 21.3% |
| $100,000 to $149,999 | 86 | 19.9% |
| $150,000 to $199,999 | 15 | 3.5% |
| $200,000+ | 0 | 0.0% |
Family Income by Famaliy Size in Westfield
3-person families (52 | 12.0%) account for the highest median family income in Westfield with $95,882 per family, while 2-person families (145 | 33.6%) have the highest median income of $40,840 per family member.
| Income Bracket | # Families | Median Income |
| 2-Person Families | 145 (33.6%) | $81,679 |
| 3-Person Families | 52 (12.0%) | $95,882 |
| 4-Person Families | 137 (31.7%) | $43,728 |
| 5-Person Families | 53 (12.3%) | $0 |
| 6-Person Families | 25 (5.8%) | $0 |
| 7+ Person Families | 20 (4.6%) | $0 |
| Total | 432 (100.0%) | $69,000 |
Family Income by Number of Earners in Westfield
| Number of Earners | # Families | Median Income |
| No Earners | 49 (11.3%) | $68,750 |
| 1 Earner | 267 (61.8%) | $0 |
| 2 Earners | 70 (16.2%) | $0 |
| 3+ Earners | 46 (10.6%) | $0 |
| Total | 432 (100.0%) | $69,000 |
Household Income in Westfield
Household Income Brackets in Westfield
With 383 households falling in the category, the $35,000 to $49,999 income range is the most frequent in Westfield, accounting for 29.2% of all households.
| Income Bracket | # Households | % Households |
| Less than $10,000 | 59 | 4.5% |
| $10,000 to $14,999 | 12 | 0.9% |
| $15,000 to $24,999 | 333 | 25.4% |
| $25,000 to $34,999 | 39 | 3.0% |
| $35,000 to $49,999 | 383 | 29.2% |
| $50,000 to $74,999 | 165 | 12.6% |
| $75,000 to $99,999 | 161 | 12.3% |
| $100,000 to $149,999 | 118 | 9.0% |
| $150,000 to $199,999 | 41 | 3.1% |
| $200,000+ | 0 | 0.0% |
Household Income by Householder Age in Westfield
The median household income in Westfield is $43,369, with the highest median household income of $44,485 found in the 45 to 64 years age bracket for the primary householder. A total of 579 households (44.1%) fall into this category.
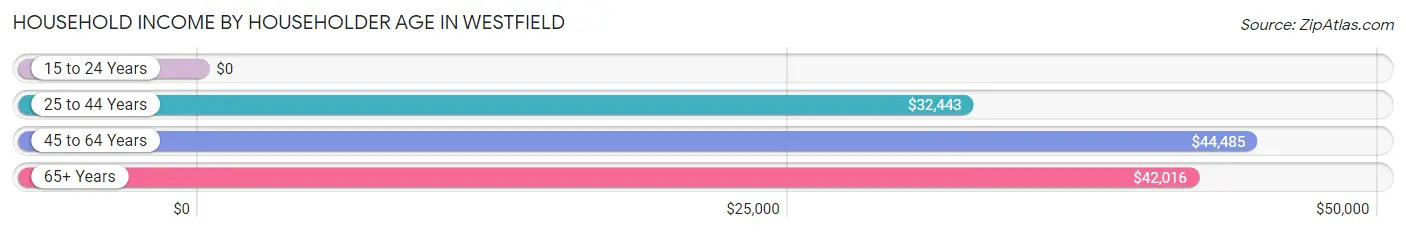
| Income Bracket | # Households | Median Income |
| 15 to 24 Years | 0 (0.0%) | $0 |
| 25 to 44 Years | 163 (12.4%) | $32,443 |
| 45 to 64 Years | 579 (44.1%) | $44,485 |
| 65+ Years | 570 (43.4%) | $42,016 |
| Total | 1,312 (100.0%) | $43,369 |
Poverty in Westfield
Income Below Poverty by Sex and Age in Westfield
With 13.0% poverty level for males and 14.5% for females among the residents of Westfield, under 5 year old males and 18 to 24 year old females are the most vulnerable to poverty, with 19 males (37.2%) and 19 females (100.0%) in their respective age groups living below the poverty level.
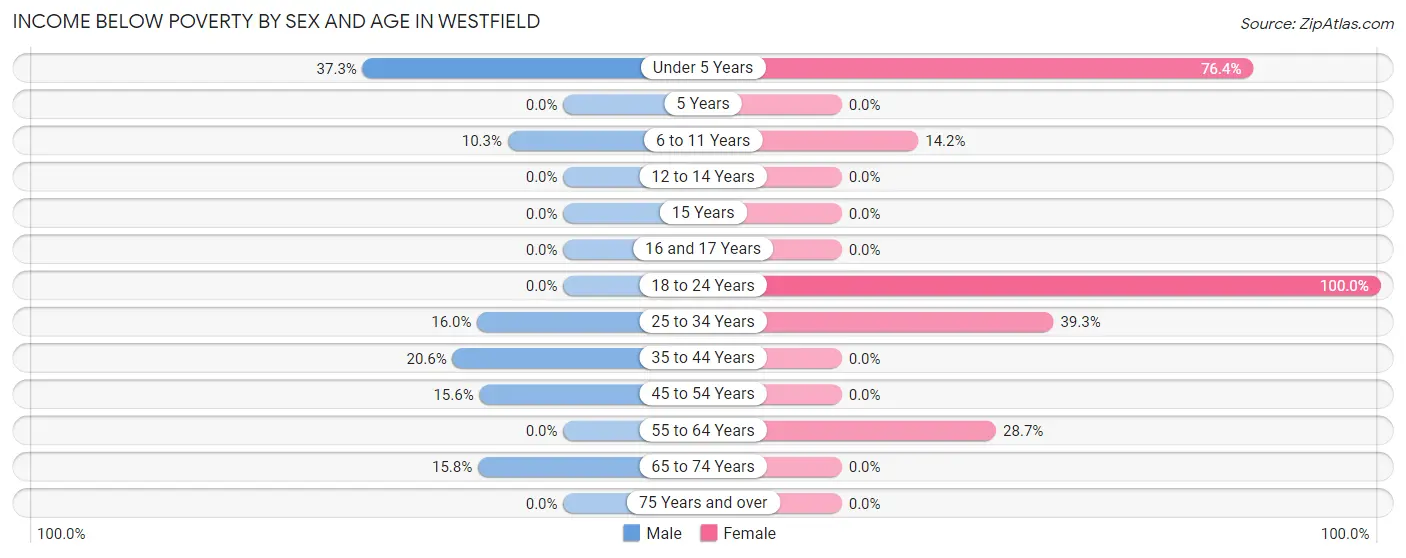
| Age Bracket | Male | Female |
| Under 5 Years | 19 (37.2%) | 42 (76.4%) |
| 5 Years | 0 (0.0%) | 0 (0.0%) |
| 6 to 11 Years | 23 (10.3%) | 23 (14.2%) |
| 12 to 14 Years | 0 (0.0%) | 0 (0.0%) |
| 15 Years | 0 (0.0%) | 0 (0.0%) |
| 16 and 17 Years | 0 (0.0%) | 0 (0.0%) |
| 18 to 24 Years | 0 (0.0%) | 19 (100.0%) |
| 25 to 34 Years | 19 (16.0%) | 44 (39.3%) |
| 35 to 44 Years | 22 (20.6%) | 0 (0.0%) |
| 45 to 54 Years | 45 (15.6%) | 0 (0.0%) |
| 55 to 64 Years | 0 (0.0%) | 53 (28.6%) |
| 65 to 74 Years | 51 (15.8%) | 0 (0.0%) |
| 75 Years and over | 0 (0.0%) | 0 (0.0%) |
| Total | 179 (13.0%) | 181 (14.5%) |
Income Above Poverty by Sex and Age in Westfield
According to the poverty statistics in Westfield, males aged 12 to 14 years and females aged 12 to 14 years are the age groups that are most secure financially, with 100.0% of males and 100.0% of females in these age groups living above the poverty line.
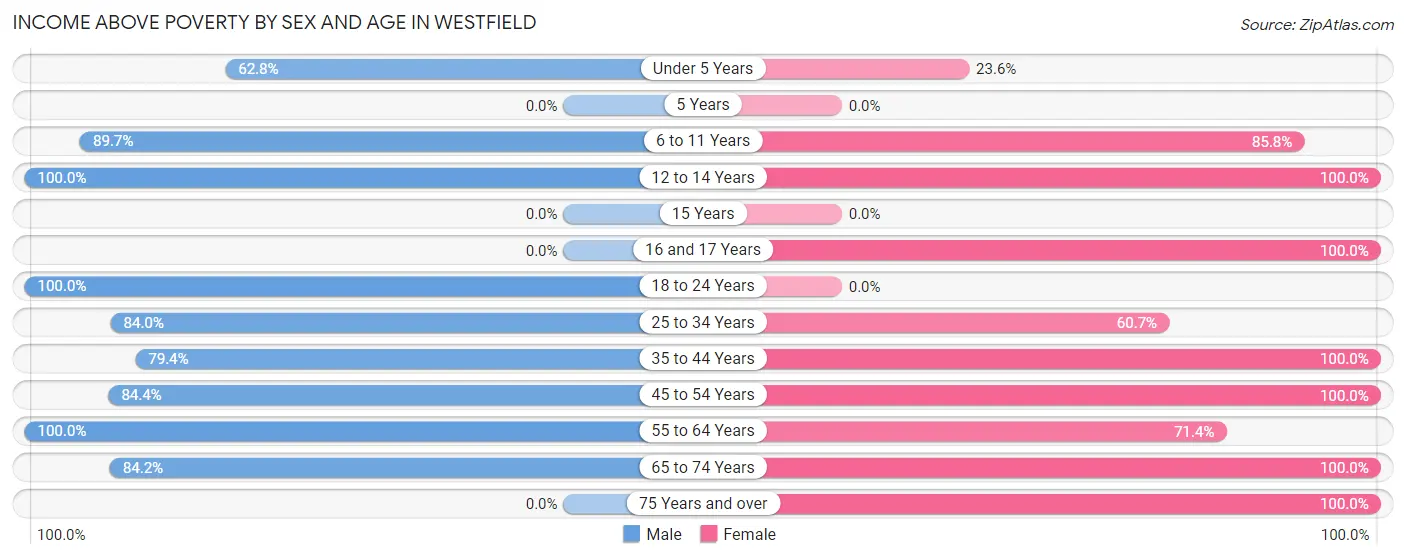
| Age Bracket | Male | Female |
| Under 5 Years | 32 (62.7%) | 13 (23.6%) |
| 5 Years | 0 (0.0%) | 0 (0.0%) |
| 6 to 11 Years | 200 (89.7%) | 139 (85.8%) |
| 12 to 14 Years | 127 (100.0%) | 23 (100.0%) |
| 15 Years | 0 (0.0%) | 0 (0.0%) |
| 16 and 17 Years | 0 (0.0%) | 21 (100.0%) |
| 18 to 24 Years | 37 (100.0%) | 0 (0.0%) |
| 25 to 34 Years | 100 (84.0%) | 68 (60.7%) |
| 35 to 44 Years | 85 (79.4%) | 48 (100.0%) |
| 45 to 54 Years | 244 (84.4%) | 256 (100.0%) |
| 55 to 64 Years | 100 (100.0%) | 132 (71.4%) |
| 65 to 74 Years | 271 (84.2%) | 165 (100.0%) |
| 75 Years and over | 0 (0.0%) | 201 (100.0%) |
| Total | 1,196 (87.0%) | 1,066 (85.5%) |
Income Below Poverty Among Married-Couple Families in Westfield
The poverty statistics for married-couple families in Westfield show that 8.3% or 23 of the total 277 families live below the poverty line. Families with 3 or 4 children have the highest poverty rate of 29.5%, comprising of 23 families. On the other hand, families with no children have the lowest poverty rate of 0.0%, which includes 0 families.
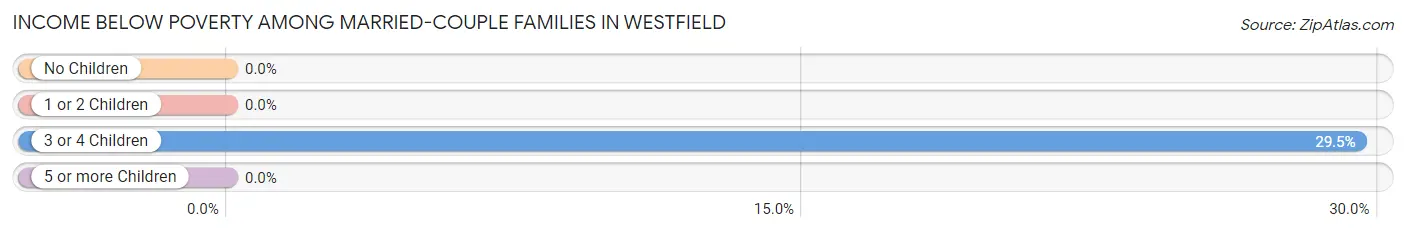
| Children | Above Poverty | Below Poverty |
| No Children | 143 (100.0%) | 0 (0.0%) |
| 1 or 2 Children | 36 (100.0%) | 0 (0.0%) |
| 3 or 4 Children | 55 (70.5%) | 23 (29.5%) |
| 5 or more Children | 20 (100.0%) | 0 (0.0%) |
| Total | 254 (91.7%) | 23 (8.3%) |
Income Below Poverty Among Single-Parent Households in Westfield
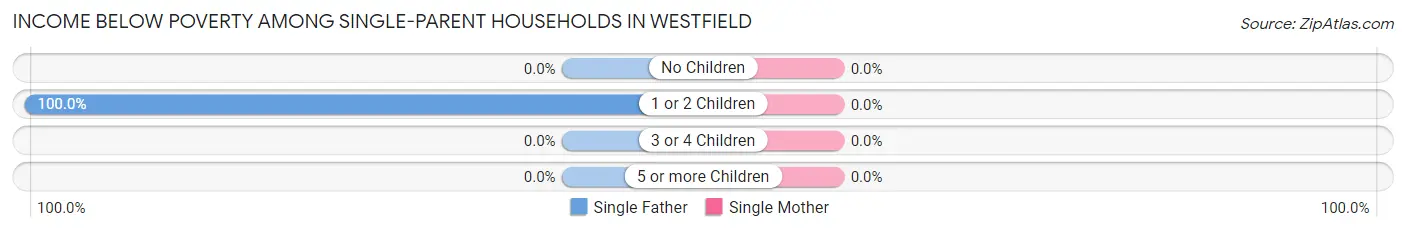
| Children | Single Father | Single Mother |
| No Children | 0 (0.0%) | 0 (0.0%) |
| 1 or 2 Children | 19 (100.0%) | 0 (0.0%) |
| 3 or 4 Children | 0 (0.0%) | 0 (0.0%) |
| 5 or more Children | 0 (0.0%) | 0 (0.0%) |
| Total | 19 (52.8%) | 0 (0.0%) |
Income Below Poverty Among Married-Couple vs Single-Parent Households in Westfield
The poverty data for Westfield shows that 23 of the married-couple family households (8.3%) and 19 of the single-parent households (12.3%) are living below the poverty level. Within the married-couple family households, those with 3 or 4 children have the highest poverty rate, with 23 households (29.5%) falling below the poverty line. Among the single-parent households, those with 1 or 2 children have the highest poverty rate, with 19 household (30.6%) living below poverty.
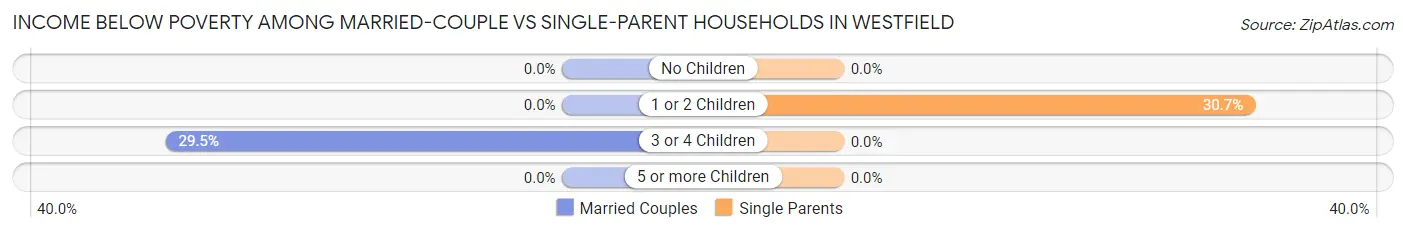
| Children | Married-Couple Families | Single-Parent Households |
| No Children | 0 (0.0%) | 0 (0.0%) |
| 1 or 2 Children | 0 (0.0%) | 19 (30.6%) |
| 3 or 4 Children | 23 (29.5%) | 0 (0.0%) |
| 5 or more Children | 0 (0.0%) | 0 (0.0%) |
| Total | 23 (8.3%) | 19 (12.3%) |
Race in Westfield
The most populous races in Westfield are White / Caucasian (2,434 | 89.7%), Asian (144 | 5.3%), and Hispanic or Latino (109 | 4.0%).
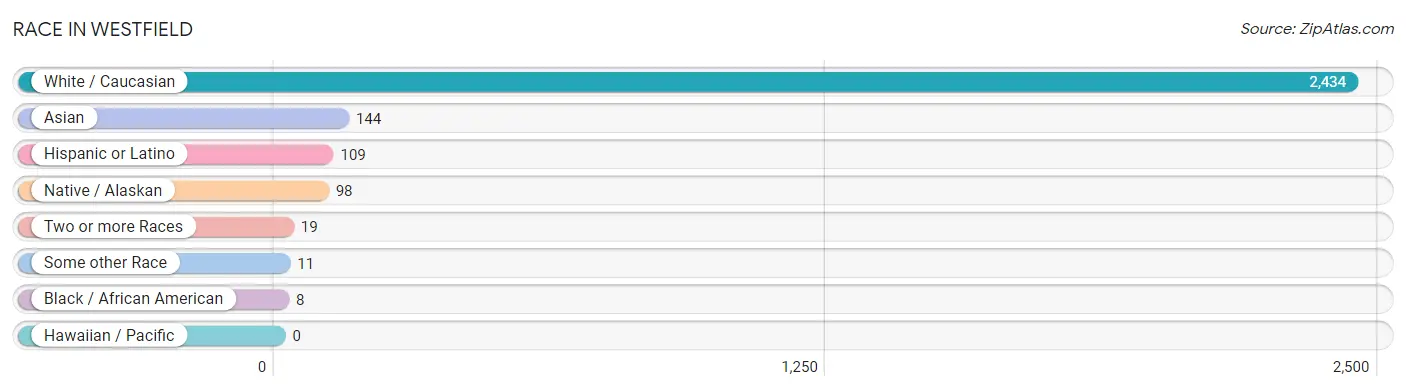
| Race | # Population | % Population |
| Asian | 144 | 5.3% |
| Black / African American | 8 | 0.3% |
| Hawaiian / Pacific | 0 | 0.0% |
| Hispanic or Latino | 109 | 4.0% |
| Native / Alaskan | 98 | 3.6% |
| White / Caucasian | 2,434 | 89.7% |
| Two or more Races | 19 | 0.7% |
| Some other Race | 11 | 0.4% |
| Total | 2,714 | 100.0% |
Ancestry in Westfield
The most populous ancestries reported in Westfield are German (634 | 23.4%), English (517 | 19.1%), Italian (279 | 10.3%), Irish (171 | 6.3%), and Slovene (138 | 5.1%), together accounting for 64.1% of all Westfield residents.
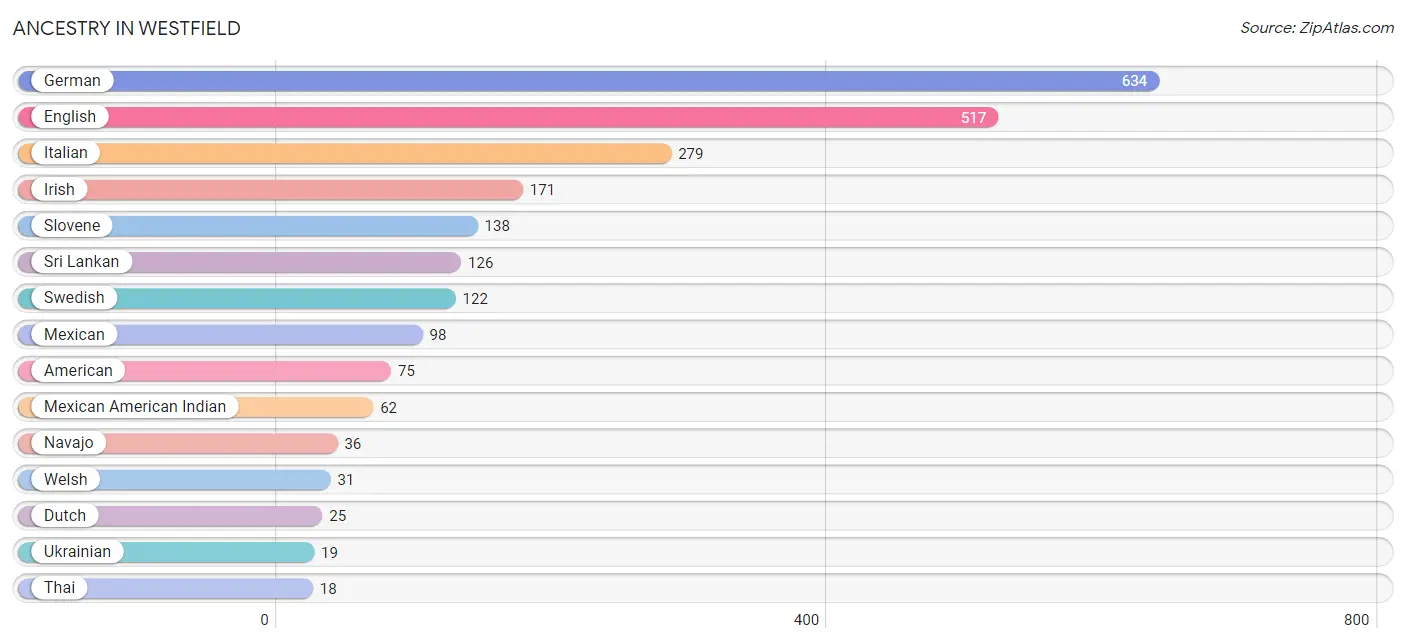
| Ancestry | # Population | % Population |
| American | 75 | 2.8% |
| Dutch | 25 | 0.9% |
| English | 517 | 19.1% |
| European | 17 | 0.6% |
| German | 634 | 23.4% |
| Irish | 171 | 6.3% |
| Italian | 279 | 10.3% |
| Mexican | 98 | 3.6% |
| Mexican American Indian | 62 | 2.3% |
| Navajo | 36 | 1.3% |
| Polish | 12 | 0.4% |
| Puerto Rican | 11 | 0.4% |
| Slovene | 138 | 5.1% |
| Sri Lankan | 126 | 4.6% |
| Swedish | 122 | 4.5% |
| Swiss | 15 | 0.5% |
| Thai | 18 | 0.7% |
| Ukrainian | 19 | 0.7% |
| Welsh | 31 | 1.1% | View All 19 Rows |
Immigrants in Westfield
The most numerous immigrant groups reported in Westfield came from Asia (82 | 3.0%), South Eastern Asia (64 | 2.4%), Vietnam (64 | 2.4%), Europe (55 | 2.0%), and Italy (23 | 0.9%), together accounting for 10.6% of all Westfield residents.
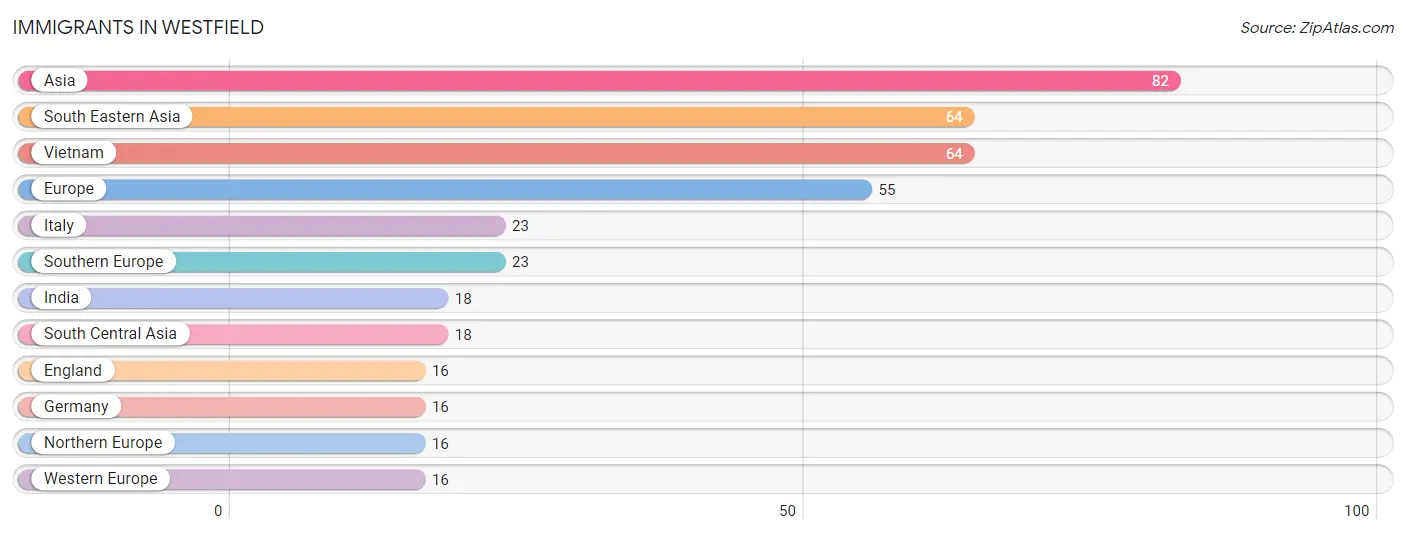
| Immigration Origin | # Population | % Population |
| Asia | 82 | 3.0% |
| England | 16 | 0.6% |
| Europe | 55 | 2.0% |
| Germany | 16 | 0.6% |
| India | 18 | 0.7% |
| Italy | 23 | 0.9% |
| Northern Europe | 16 | 0.6% |
| South Central Asia | 18 | 0.7% |
| South Eastern Asia | 64 | 2.4% |
| Southern Europe | 23 | 0.9% |
| Vietnam | 64 | 2.4% |
| Western Europe | 16 | 0.6% | View All 12 Rows |
Sex and Age in Westfield
Sex and Age in Westfield
The most populous age groups in Westfield are 70 to 74 Years (282 | 20.1%) for men and 45 to 49 Years (149 | 11.4%) for women.
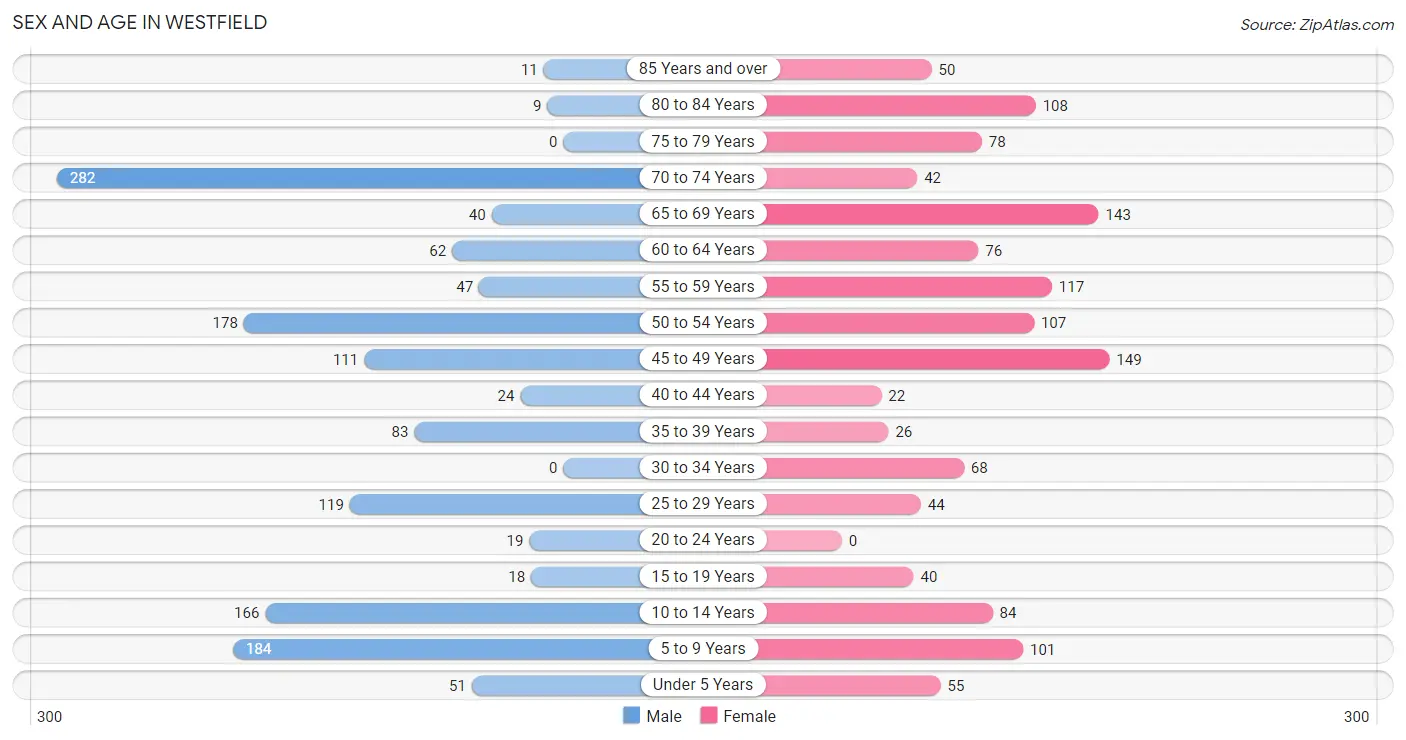
| Age Bracket | Male | Female |
| Under 5 Years | 51 (3.6%) | 55 (4.2%) |
| 5 to 9 Years | 184 (13.1%) | 101 (7.7%) |
| 10 to 14 Years | 166 (11.8%) | 84 (6.4%) |
| 15 to 19 Years | 18 (1.3%) | 40 (3.0%) |
| 20 to 24 Years | 19 (1.3%) | 0 (0.0%) |
| 25 to 29 Years | 119 (8.5%) | 44 (3.4%) |
| 30 to 34 Years | 0 (0.0%) | 68 (5.2%) |
| 35 to 39 Years | 83 (5.9%) | 26 (2.0%) |
| 40 to 44 Years | 24 (1.7%) | 22 (1.7%) |
| 45 to 49 Years | 111 (7.9%) | 149 (11.4%) |
| 50 to 54 Years | 178 (12.7%) | 107 (8.2%) |
| 55 to 59 Years | 47 (3.4%) | 117 (8.9%) |
| 60 to 64 Years | 62 (4.4%) | 76 (5.8%) |
| 65 to 69 Years | 40 (2.9%) | 143 (10.9%) |
| 70 to 74 Years | 282 (20.1%) | 42 (3.2%) |
| 75 to 79 Years | 0 (0.0%) | 78 (5.9%) |
| 80 to 84 Years | 9 (0.6%) | 108 (8.2%) |
| 85 Years and over | 11 (0.8%) | 50 (3.8%) |
| Total | 1,404 (100.0%) | 1,310 (100.0%) |
Families and Households in Westfield
Median Family Size in Westfield
The median family size in Westfield is 3.69 persons per family, with single female/mother families (119 | 27.6%) accounting for the largest median family size of 4.02 persons per family. On the other hand, single male/father families (36 | 8.3%) represent the smallest median family size with 3.25 persons per family.
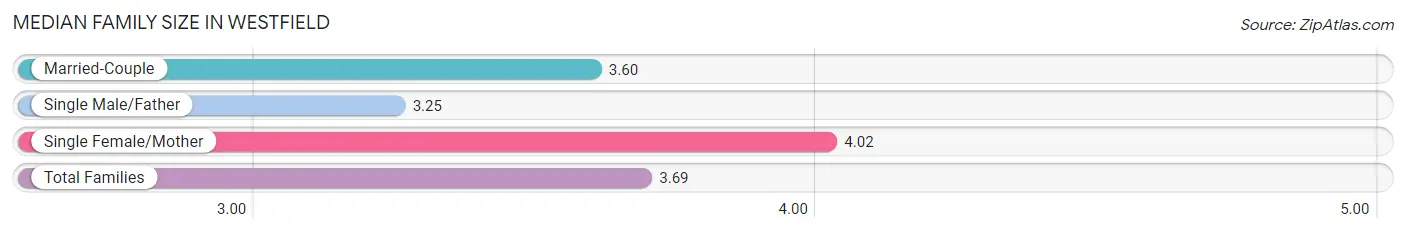
| Family Type | # Families | Family Size |
| Married-Couple | 277 (64.1%) | 3.60 |
| Single Male/Father | 36 (8.3%) | 3.25 |
| Single Female/Mother | 119 (27.6%) | 4.02 |
| Total Families | 432 (100.0%) | 3.69 |
Median Household Size in Westfield
The median household size in Westfield is 1.99 persons per household, with single female/mother households (119 | 9.1%) accounting for the largest median household size of 4.2 persons per household. non-family households (880 | 67.1%) represent the smallest median household size with 1.11 persons per household.
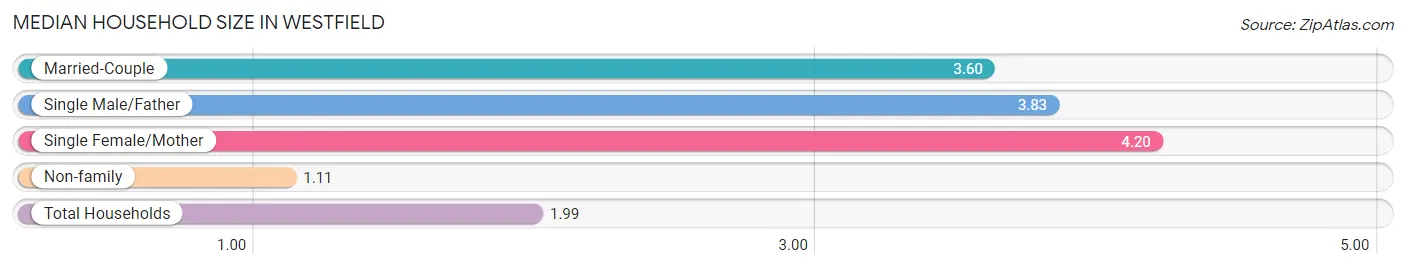
| Household Type | # Households | Household Size |
| Married-Couple | 277 (21.1%) | 3.60 |
| Single Male/Father | 36 (2.7%) | 3.83 |
| Single Female/Mother | 119 (9.1%) | 4.20 |
| Non-family | 880 (67.1%) | 1.11 |
| Total Households | 1,312 (100.0%) | 1.99 |
Household Size by Marriage Status in Westfield
Out of a total of 1,312 households in Westfield, 432 (32.9%) are family households, while 880 (67.1%) are nonfamily households. The most numerous type of family households are 2-person households, comprising 145, and the most common type of nonfamily households are 1-person households, comprising 787.
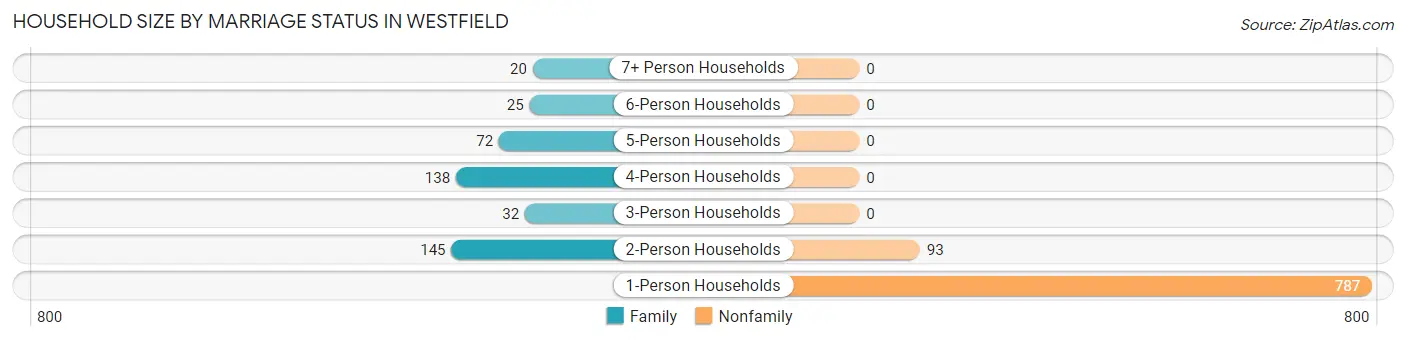
| Household Size | Family Households | Nonfamily Households |
| 1-Person Households | - | 787 (60.0%) |
| 2-Person Households | 145 (11.1%) | 93 (7.1%) |
| 3-Person Households | 32 (2.4%) | 0 (0.0%) |
| 4-Person Households | 138 (10.5%) | 0 (0.0%) |
| 5-Person Households | 72 (5.5%) | 0 (0.0%) |
| 6-Person Households | 25 (1.9%) | 0 (0.0%) |
| 7+ Person Households | 20 (1.5%) | 0 (0.0%) |
| Total | 432 (32.9%) | 880 (67.1%) |
Female Fertility in Westfield
Fertility by Age in Westfield
Average fertility rate in Westfield is 33.0 births per 1,000 women. Women in the age bracket of 20 to 34 years have the highest fertility rate with 107.0 births per 1,000 women. Women in the age bracket of 20 to 34 years acount for 100.0% of all women with births.
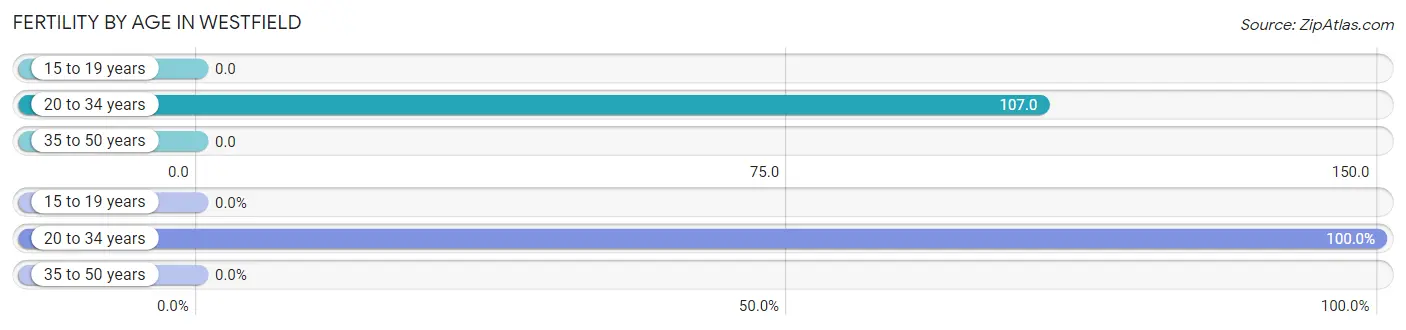
| Age Bracket | Women with Births | Births / 1,000 Women |
| 15 to 19 years | 0 (0.0%) | 0.0 |
| 20 to 34 years | 12 (100.0%) | 107.0 |
| 35 to 50 years | 0 (0.0%) | 0.0 |
| Total | 12 (100.0%) | 33.0 |
Fertility by Age by Marriage Status in Westfield
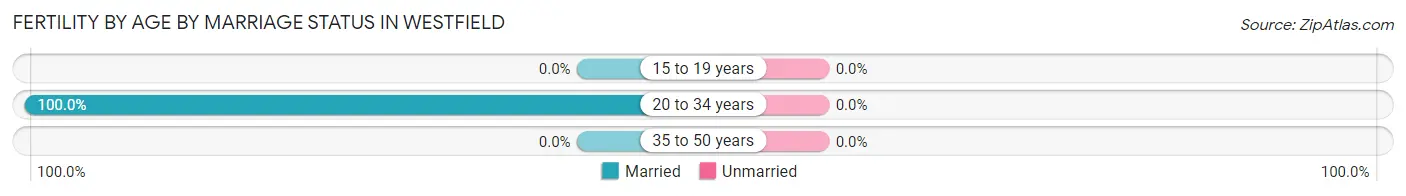
| Age Bracket | Married | Unmarried |
| 15 to 19 years | 0 (0.0%) | 0 (0.0%) |
| 20 to 34 years | 12 (100.0%) | 0 (0.0%) |
| 35 to 50 years | 0 (0.0%) | 0 (0.0%) |
| Total | 12 (100.0%) | 0 (0.0%) |
Fertility by Education in Westfield
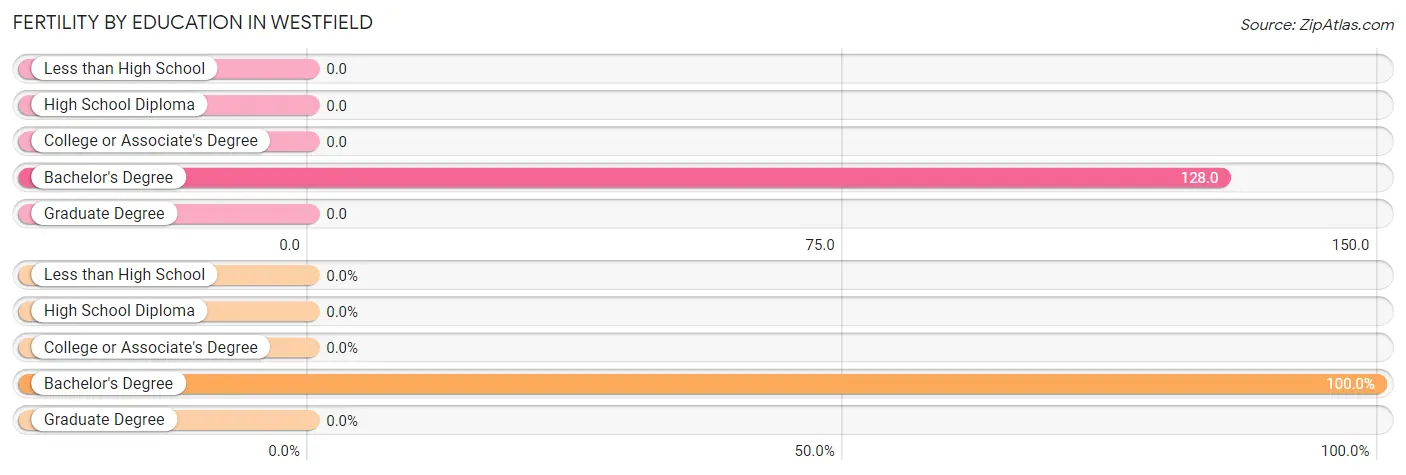
| Educational Attainment | Women with Births | Births / 1,000 Women |
| Less than High School | 0 (0.0%) | 0.0 |
| High School Diploma | 0 (0.0%) | 0.0 |
| College or Associate's Degree | 0 (0.0%) | 0.0 |
| Bachelor's Degree | 12 (100.0%) | 128.0 |
| Graduate Degree | 0 (0.0%) | 0.0 |
| Total | 12 (100.0%) | 33.0 |
Fertility by Education by Marriage Status in Westfield
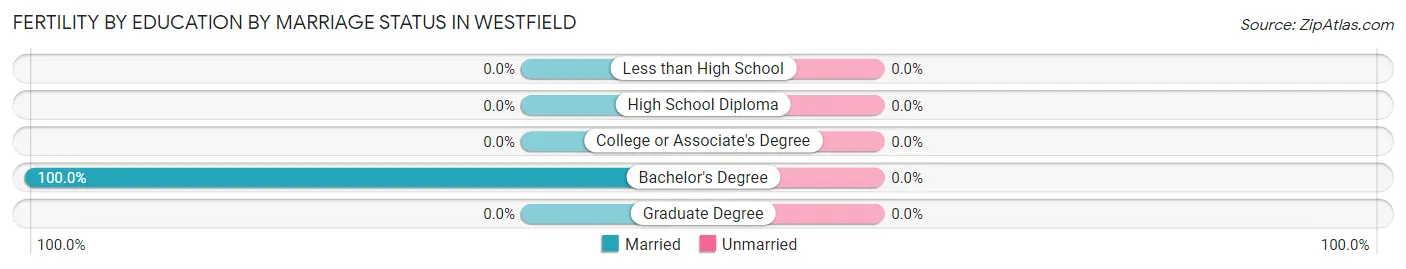
| Educational Attainment | Married | Unmarried |
| Less than High School | 0 (0.0%) | 0 (0.0%) |
| High School Diploma | 0 (0.0%) | 0 (0.0%) |
| College or Associate's Degree | 0 (0.0%) | 0 (0.0%) |
| Bachelor's Degree | 12 (100.0%) | 0 (0.0%) |
| Graduate Degree | 0 (0.0%) | 0 (0.0%) |
| Total | 12 (100.0%) | 0 (0.0%) |
Employment Characteristics in Westfield
Employment by Class of Employer in Westfield
Among the 950 employed individuals in Westfield, private company employees (337 | 35.5%), local government employees (184 | 19.4%), and state government employees (180 | 19.0%) make up the most common classes of employment.
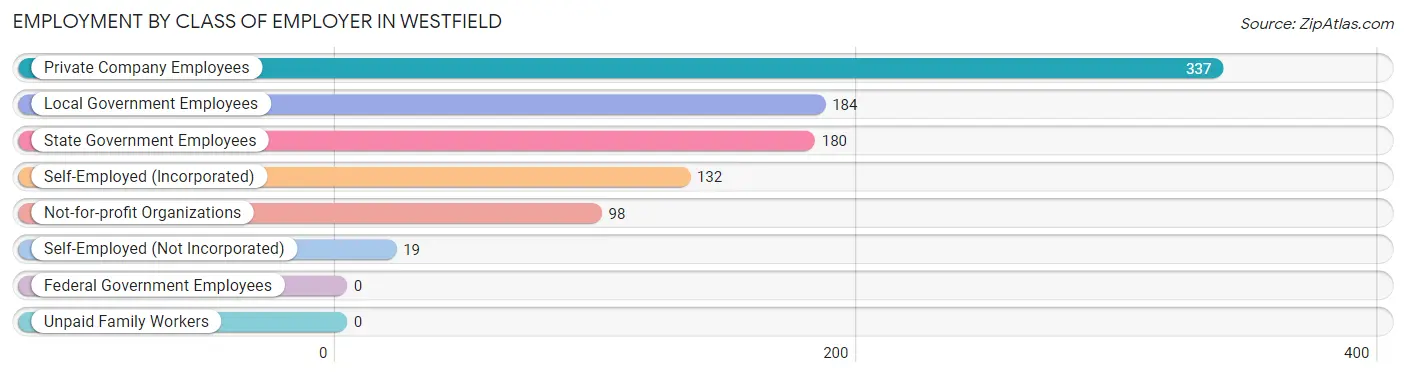
| Employer Class | # Employees | % Employees |
| Private Company Employees | 337 | 35.5% |
| Self-Employed (Incorporated) | 132 | 13.9% |
| Self-Employed (Not Incorporated) | 19 | 2.0% |
| Not-for-profit Organizations | 98 | 10.3% |
| Local Government Employees | 184 | 19.4% |
| State Government Employees | 180 | 19.0% |
| Federal Government Employees | 0 | 0.0% |
| Unpaid Family Workers | 0 | 0.0% |
| Total | 950 | 100.0% |
Employment Status by Age in Westfield
According to the labor force statistics for Westfield, out of the total population over 16 years of age (2,073), 51.2% or 1,061 individuals are in the labor force, with 7.0% or 74 of them unemployed. The age group with the highest labor force participation rate is 20 to 24 years, with 100.0% or 19 individuals in the labor force. Within the labor force, the 25 to 29 years age range has the highest percentage of unemployed individuals, with 48.7% or 58 of them being unemployed.
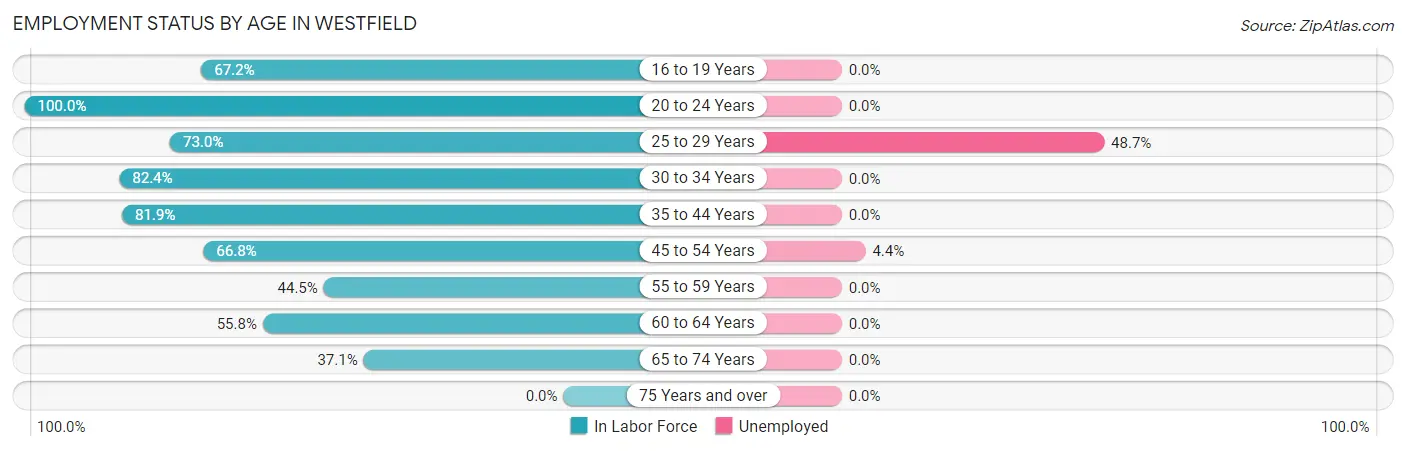
| Age Bracket | In Labor Force | Unemployed |
| 16 to 19 Years | 39 (67.2%) | 0 (0.0%) |
| 20 to 24 Years | 19 (100.0%) | 0 (0.0%) |
| 25 to 29 Years | 119 (73.0%) | 58 (48.7%) |
| 30 to 34 Years | 56 (82.4%) | 0 (0.0%) |
| 35 to 44 Years | 127 (81.9%) | 0 (0.0%) |
| 45 to 54 Years | 364 (66.8%) | 16 (4.4%) |
| 55 to 59 Years | 73 (44.5%) | 0 (0.0%) |
| 60 to 64 Years | 77 (55.8%) | 0 (0.0%) |
| 65 to 74 Years | 188 (37.1%) | 0 (0.0%) |
| 75 Years and over | 0 (0.0%) | 0 (0.0%) |
| Total | 1,061 (51.2%) | 74 (7.0%) |
Employment Status by Educational Attainment in Westfield
According to labor force statistics for Westfield, 66.2% of individuals (816) out of the total population between 25 and 64 years of age (1,233) are in the labor force, with 9.1% or 74 of them being unemployed. The group with the highest labor force participation rate are those with the educational attainment of college / associate degree, with 78.9% or 224 individuals in the labor force. Within the labor force, individuals with less than high school education have the highest percentage of unemployment, with 40.4% or 74 of them being unemployed.
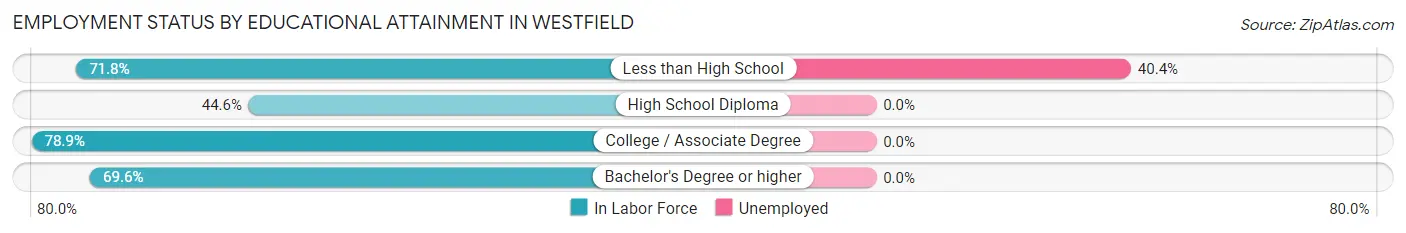
| Educational Attainment | In Labor Force | Unemployed |
| Less than High School | 183 (71.8%) | 103 (40.4%) |
| High School Diploma | 132 (44.6%) | 0 (0.0%) |
| College / Associate Degree | 224 (78.9%) | 0 (0.0%) |
| Bachelor's Degree or higher | 277 (69.6%) | 0 (0.0%) |
| Total | 816 (66.2%) | 112 (9.1%) |
Employment Occupations by Sex in Westfield
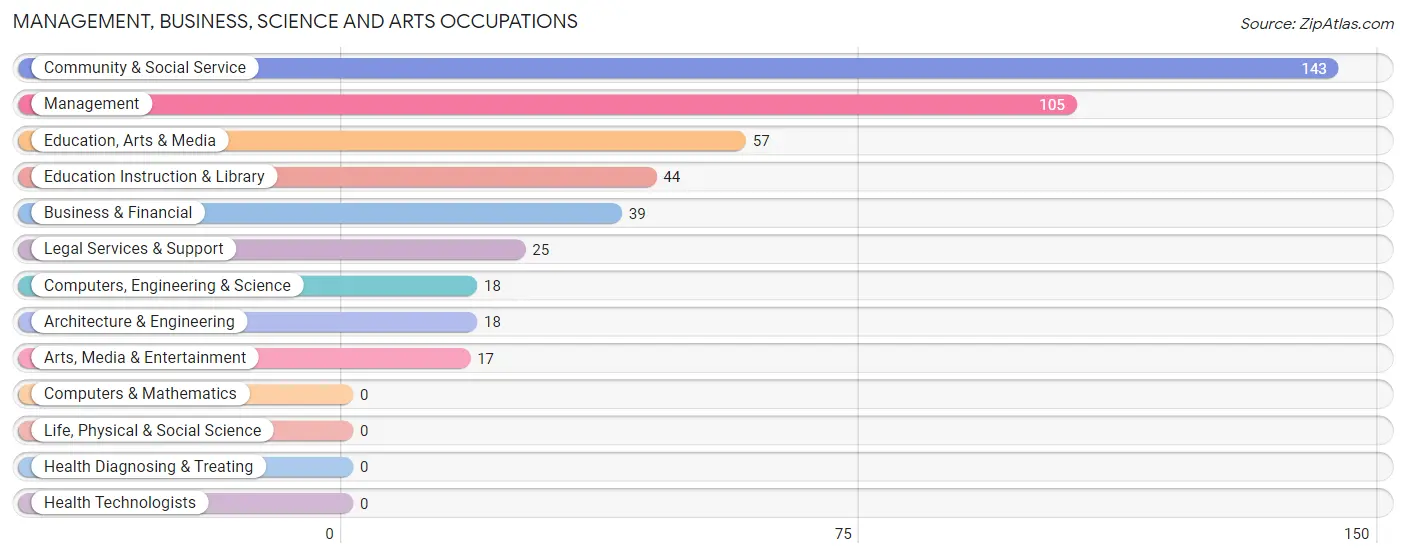
Management, Business, Science and Arts Occupations
The most common Management, Business, Science and Arts occupations in Westfield are Community & Social Service (143 | 14.5%), Management (105 | 10.6%), Education, Arts & Media (57 | 5.8%), Education Instruction & Library (44 | 4.4%), and Business & Financial (39 | 4.0%).
Management, Business, Science and Arts Occupations by Sex
Within the Management, Business, Science and Arts occupations in Westfield, the most male-oriented occupations are Management (100.0%), Computers, Engineering & Science (100.0%), and Architecture & Engineering (100.0%), while the most female-oriented occupations are Education Instruction & Library (100.0%), Business & Financial (56.4%), and Community & Social Service (30.8%).
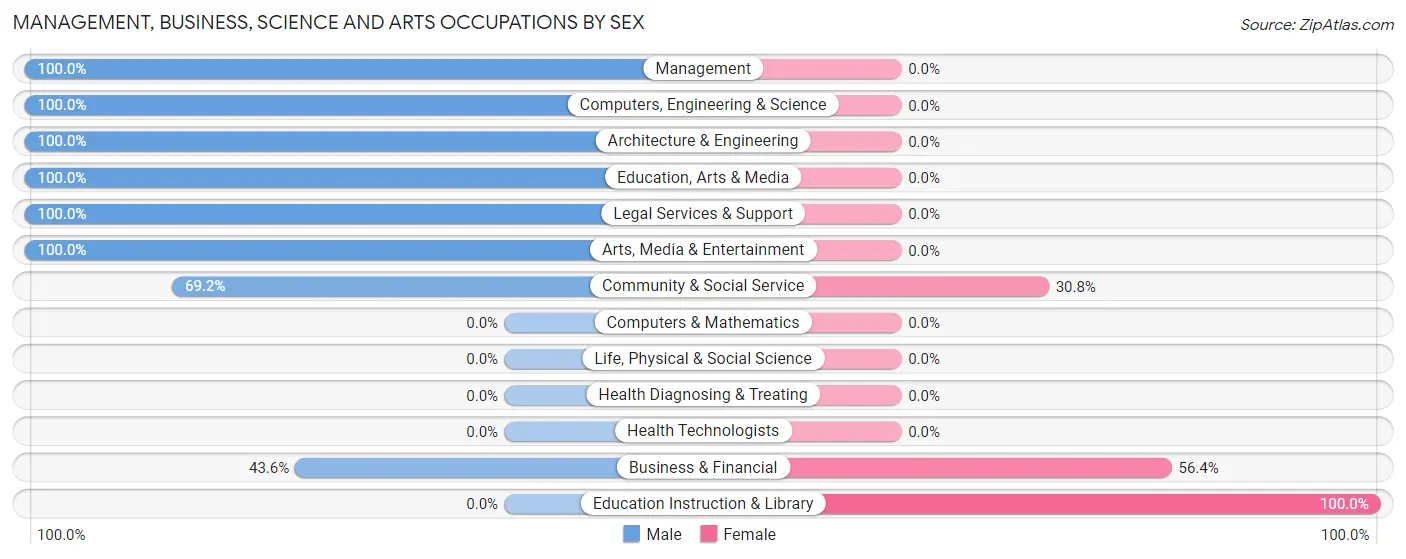
| Occupation | Male | Female |
| Management | 105 (100.0%) | 0 (0.0%) |
| Business & Financial | 17 (43.6%) | 22 (56.4%) |
| Computers, Engineering & Science | 18 (100.0%) | 0 (0.0%) |
| Computers & Mathematics | 0 (0.0%) | 0 (0.0%) |
| Architecture & Engineering | 18 (100.0%) | 0 (0.0%) |
| Life, Physical & Social Science | 0 (0.0%) | 0 (0.0%) |
| Community & Social Service | 99 (69.2%) | 44 (30.8%) |
| Education, Arts & Media | 57 (100.0%) | 0 (0.0%) |
| Legal Services & Support | 25 (100.0%) | 0 (0.0%) |
| Education Instruction & Library | 0 (0.0%) | 44 (100.0%) |
| Arts, Media & Entertainment | 17 (100.0%) | 0 (0.0%) |
| Health Diagnosing & Treating | 0 (0.0%) | 0 (0.0%) |
| Health Technologists | 0 (0.0%) | 0 (0.0%) |
| Total (Category) | 239 (78.4%) | 66 (21.6%) |
| Total (Overall) | 633 (64.1%) | 355 (35.9%) |
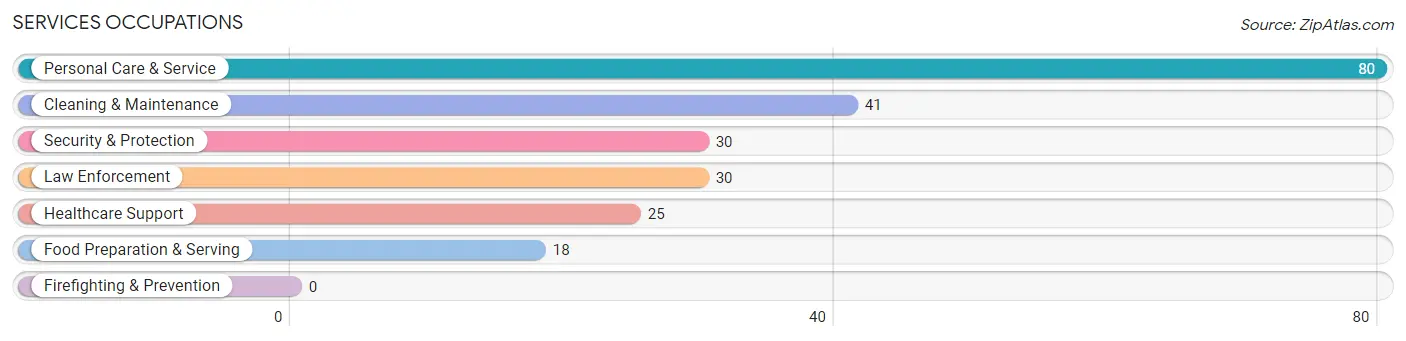
Services Occupations
The most common Services occupations in Westfield are Personal Care & Service (80 | 8.1%), Cleaning & Maintenance (41 | 4.2%), Security & Protection (30 | 3.0%), Law Enforcement (30 | 3.0%), and Healthcare Support (25 | 2.5%).
Services Occupations by Sex
Within the Services occupations in Westfield, the most male-oriented occupations are Security & Protection (100.0%), Law Enforcement (100.0%), and Food Preparation & Serving (100.0%), while the most female-oriented occupations are Healthcare Support (100.0%), Cleaning & Maintenance (63.4%), and Personal Care & Service (23.7%).
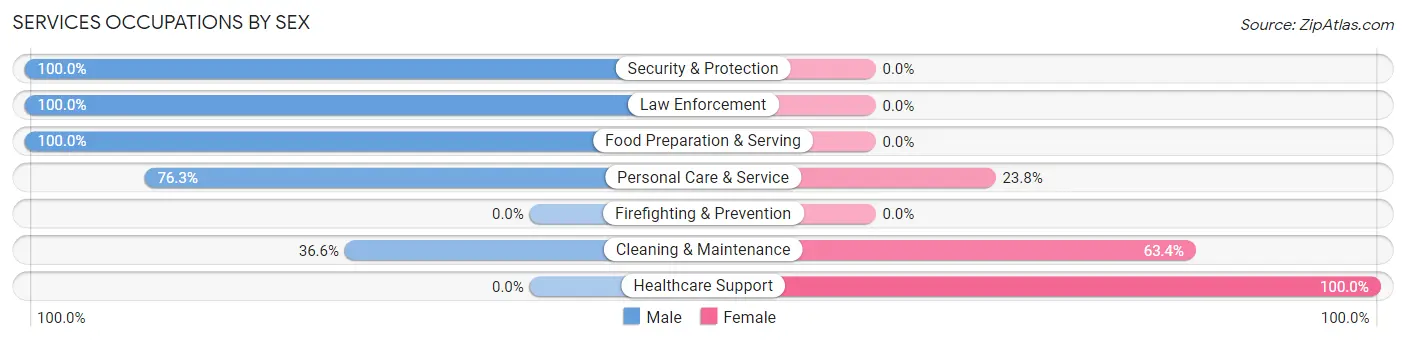
| Occupation | Male | Female |
| Healthcare Support | 0 (0.0%) | 25 (100.0%) |
| Security & Protection | 30 (100.0%) | 0 (0.0%) |
| Firefighting & Prevention | 0 (0.0%) | 0 (0.0%) |
| Law Enforcement | 30 (100.0%) | 0 (0.0%) |
| Food Preparation & Serving | 18 (100.0%) | 0 (0.0%) |
| Cleaning & Maintenance | 15 (36.6%) | 26 (63.4%) |
| Personal Care & Service | 61 (76.2%) | 19 (23.7%) |
| Total (Category) | 124 (63.9%) | 70 (36.1%) |
| Total (Overall) | 633 (64.1%) | 355 (35.9%) |
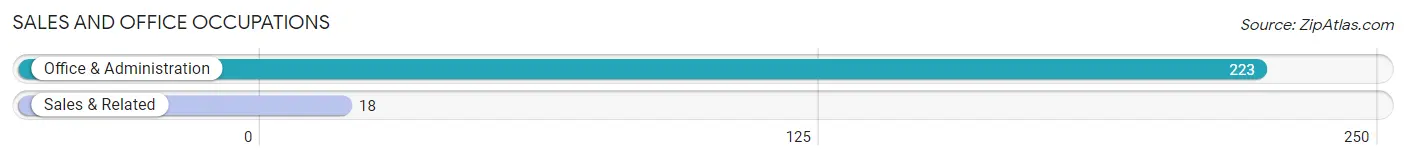
Sales and Office Occupations
The most common Sales and Office occupations in Westfield are Office & Administration (223 | 22.6%), and Sales & Related (18 | 1.8%).
Sales and Office Occupations by Sex
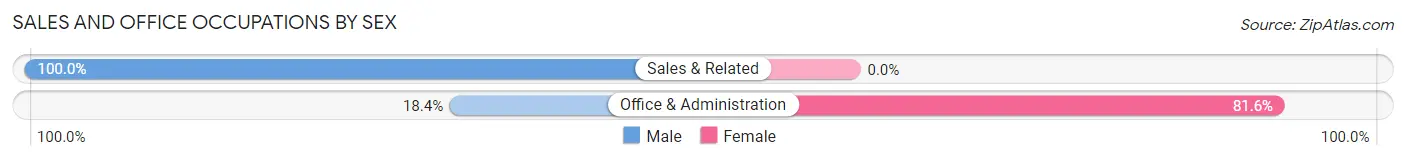
| Occupation | Male | Female |
| Sales & Related | 18 (100.0%) | 0 (0.0%) |
| Office & Administration | 41 (18.4%) | 182 (81.6%) |
| Total (Category) | 59 (24.5%) | 182 (75.5%) |
| Total (Overall) | 633 (64.1%) | 355 (35.9%) |
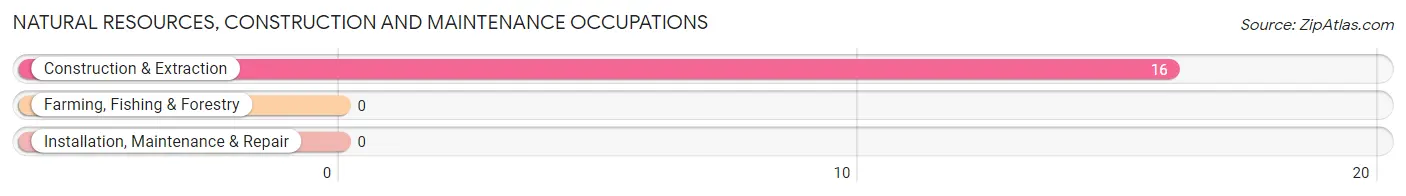
Natural Resources, Construction and Maintenance Occupations
The most common Natural Resources, Construction and Maintenance occupations in Westfield are , and Construction & Extraction (16 | 1.6%).
Natural Resources, Construction and Maintenance Occupations by Sex
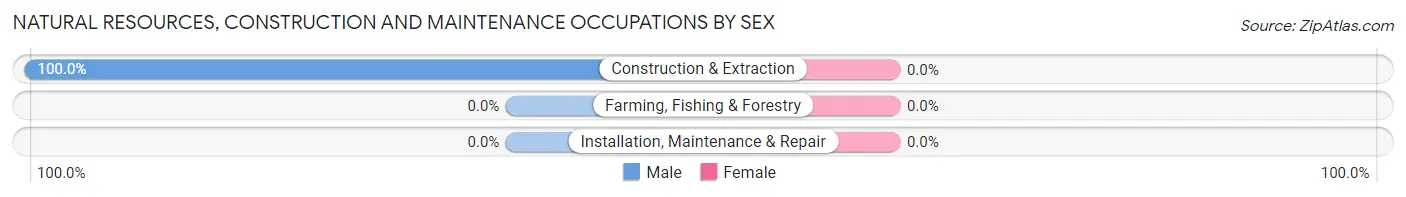
| Occupation | Male | Female |
| Farming, Fishing & Forestry | 0 (0.0%) | 0 (0.0%) |
| Construction & Extraction | 16 (100.0%) | 0 (0.0%) |
| Installation, Maintenance & Repair | 0 (0.0%) | 0 (0.0%) |
| Total (Category) | 16 (100.0%) | 0 (0.0%) |
| Total (Overall) | 633 (64.1%) | 355 (35.9%) |
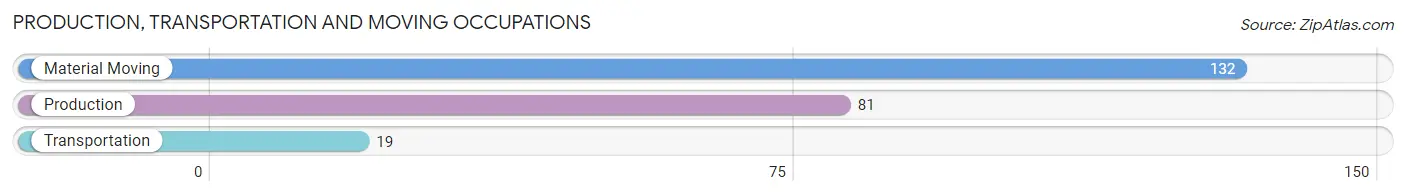
Production, Transportation and Moving Occupations
The most common Production, Transportation and Moving occupations in Westfield are Material Moving (132 | 13.4%), Production (81 | 8.2%), and Transportation (19 | 1.9%).
Production, Transportation and Moving Occupations by Sex
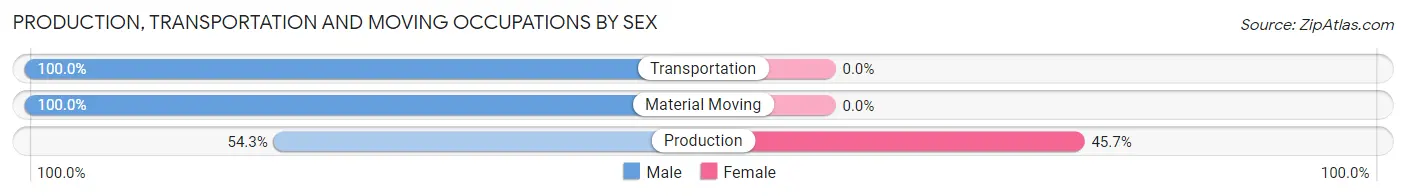
| Occupation | Male | Female |
| Production | 44 (54.3%) | 37 (45.7%) |
| Transportation | 19 (100.0%) | 0 (0.0%) |
| Material Moving | 132 (100.0%) | 0 (0.0%) |
| Total (Category) | 195 (84.1%) | 37 (16.0%) |
| Total (Overall) | 633 (64.1%) | 355 (35.9%) |
Employment Industries by Sex in Westfield
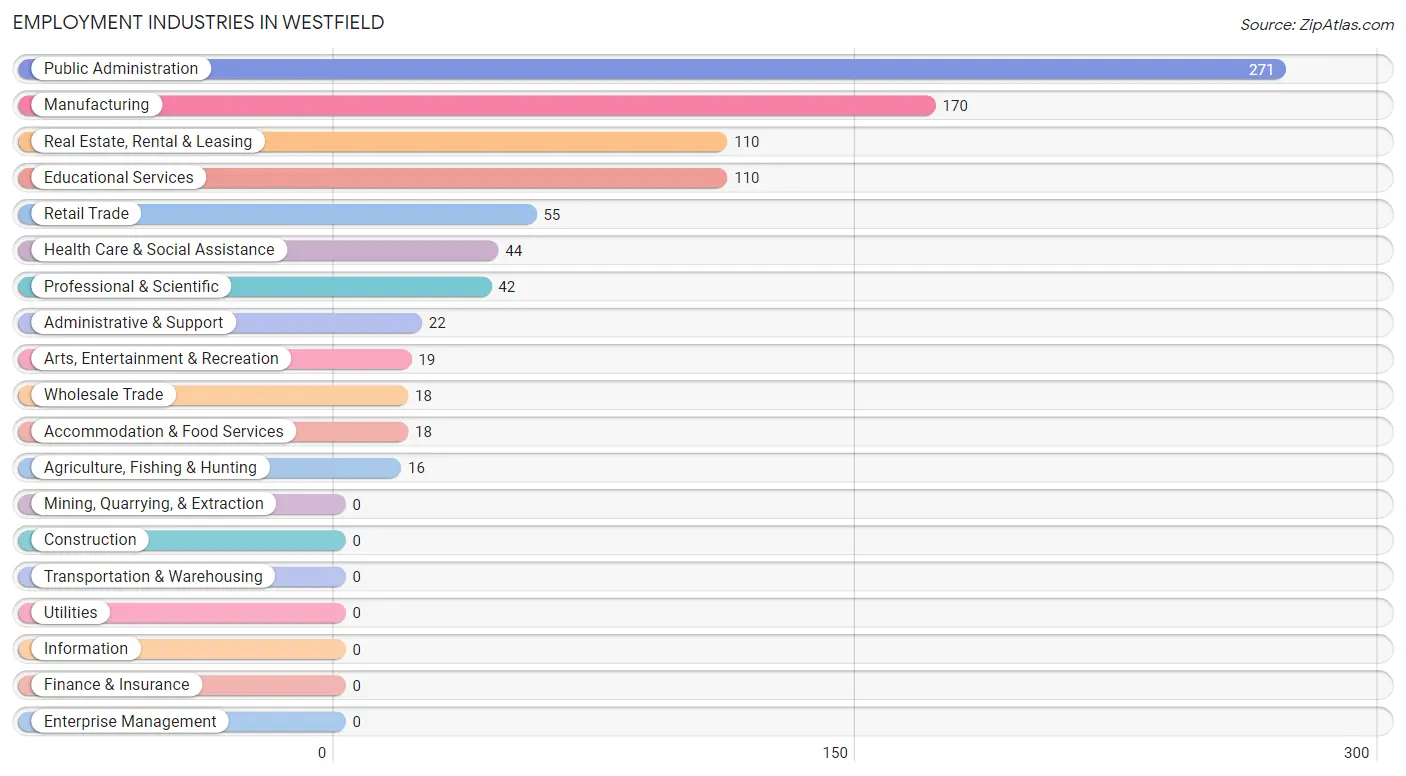
Employment Industries in Westfield
The major employment industries in Westfield include Public Administration (271 | 27.4%), Manufacturing (170 | 17.2%), Real Estate, Rental & Leasing (110 | 11.1%), Educational Services (110 | 11.1%), and Retail Trade (55 | 5.6%).
Employment Industries by Sex in Westfield
The Westfield industries that see more men than women are Agriculture, Fishing & Hunting (100.0%), Wholesale Trade (100.0%), and Retail Trade (100.0%), whereas the industries that tend to have a higher number of women are Health Care & Social Assistance (100.0%), Public Administration (67.2%), and Educational Services (63.6%).
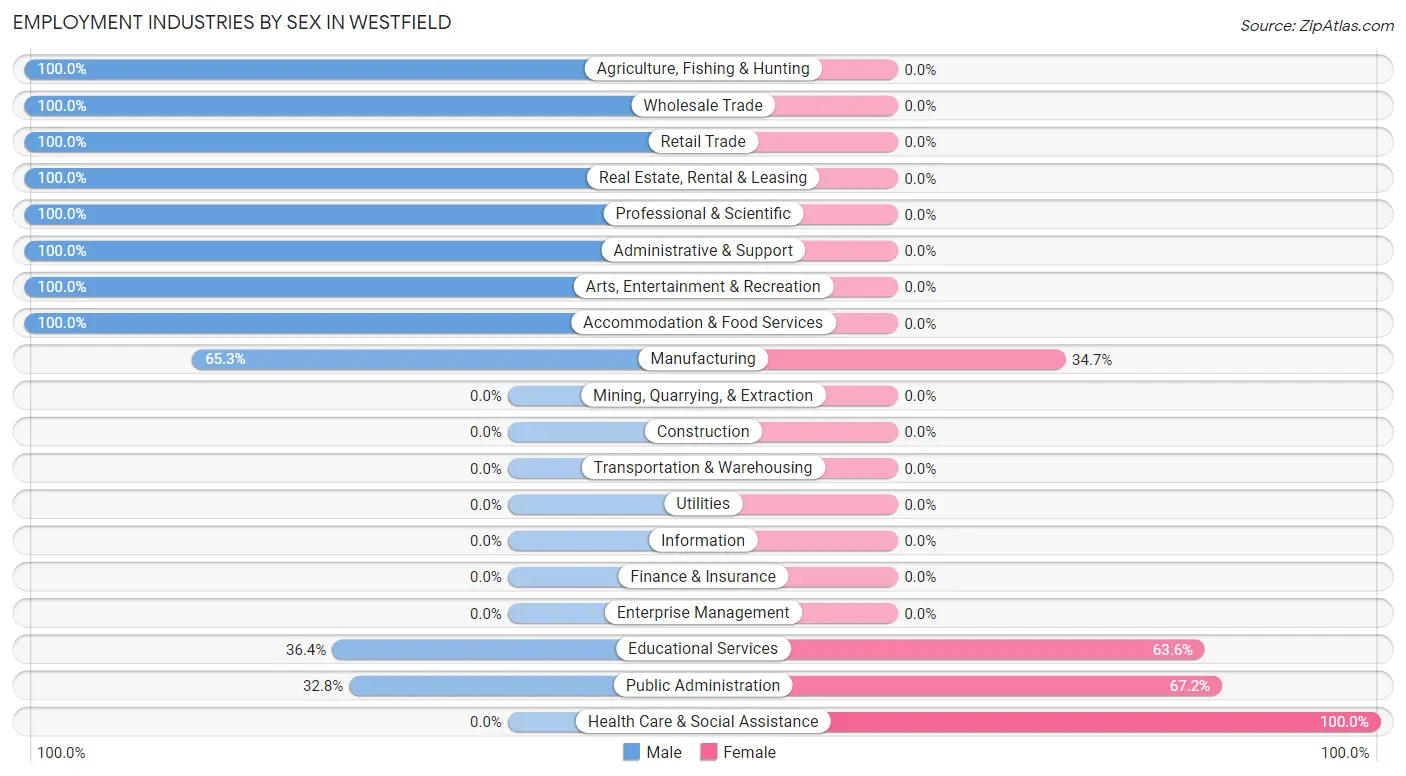
| Industry | Male | Female |
| Agriculture, Fishing & Hunting | 16 (100.0%) | 0 (0.0%) |
| Mining, Quarrying, & Extraction | 0 (0.0%) | 0 (0.0%) |
| Construction | 0 (0.0%) | 0 (0.0%) |
| Manufacturing | 111 (65.3%) | 59 (34.7%) |
| Wholesale Trade | 18 (100.0%) | 0 (0.0%) |
| Retail Trade | 55 (100.0%) | 0 (0.0%) |
| Transportation & Warehousing | 0 (0.0%) | 0 (0.0%) |
| Utilities | 0 (0.0%) | 0 (0.0%) |
| Information | 0 (0.0%) | 0 (0.0%) |
| Finance & Insurance | 0 (0.0%) | 0 (0.0%) |
| Real Estate, Rental & Leasing | 110 (100.0%) | 0 (0.0%) |
| Professional & Scientific | 42 (100.0%) | 0 (0.0%) |
| Enterprise Management | 0 (0.0%) | 0 (0.0%) |
| Administrative & Support | 22 (100.0%) | 0 (0.0%) |
| Educational Services | 40 (36.4%) | 70 (63.6%) |
| Health Care & Social Assistance | 0 (0.0%) | 44 (100.0%) |
| Arts, Entertainment & Recreation | 19 (100.0%) | 0 (0.0%) |
| Accommodation & Food Services | 18 (100.0%) | 0 (0.0%) |
| Public Administration | 89 (32.8%) | 182 (67.2%) |
| Total | 633 (64.1%) | 355 (35.9%) |
Education in Westfield
School Enrollment in Westfield
The most common levels of schooling among the 650 students in Westfield are elementary school (385 | 59.2%), middle school (125 | 19.2%), and high school (64 | 9.9%).
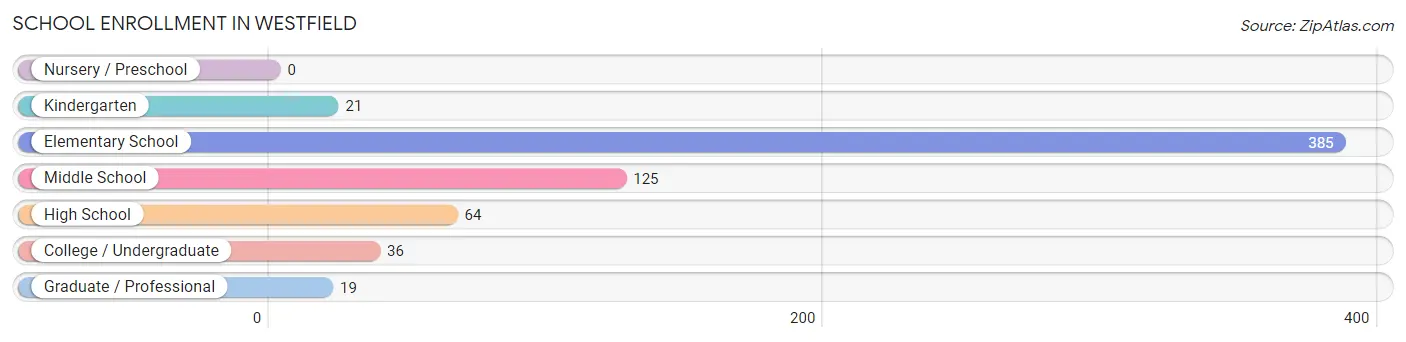
| School Level | # Students | % Students |
| Nursery / Preschool | 0 | 0.0% |
| Kindergarten | 21 | 3.2% |
| Elementary School | 385 | 59.2% |
| Middle School | 125 | 19.2% |
| High School | 64 | 9.9% |
| College / Undergraduate | 36 | 5.5% |
| Graduate / Professional | 19 | 2.9% |
| Total | 650 | 100.0% |
School Enrollment by Age by Funding Source in Westfield
Out of a total of 650 students who are enrolled in schools in Westfield, 83 (12.8%) attend a private institution, while the remaining 567 (87.2%) are enrolled in public schools. The age group of 20 to 24 year olds has the highest likelihood of being enrolled in private schools, with 19 (100.0% in the age bracket) enrolled. Conversely, the age group of 3 to 4 year olds has the lowest likelihood of being enrolled in a private school, with 21 (100.0% in the age bracket) attending a public institution.
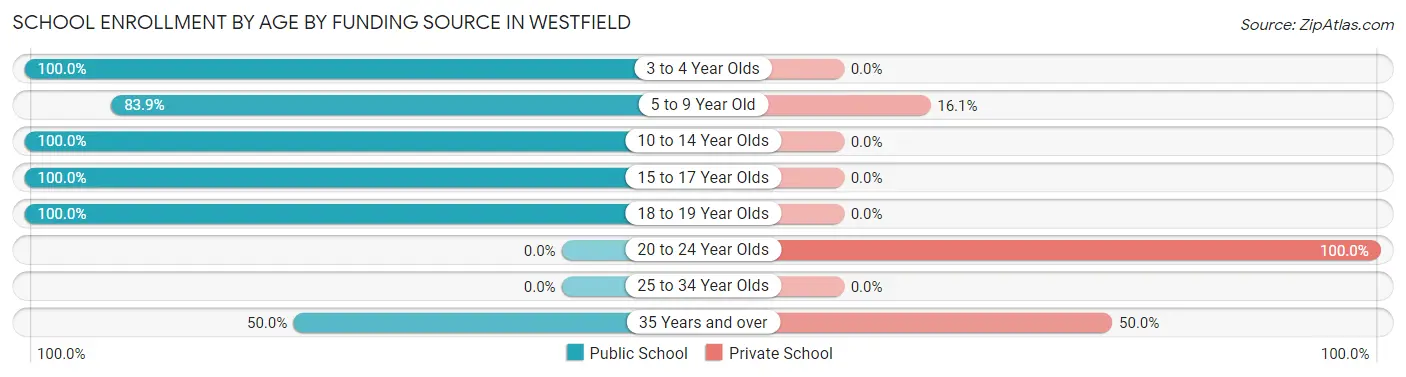
| Age Bracket | Public School | Private School |
| 3 to 4 Year Olds | 21 (100.0%) | 0 (0.0%) |
| 5 to 9 Year Old | 239 (83.9%) | 46 (16.1%) |
| 10 to 14 Year Olds | 250 (100.0%) | 0 (0.0%) |
| 15 to 17 Year Olds | 21 (100.0%) | 0 (0.0%) |
| 18 to 19 Year Olds | 18 (100.0%) | 0 (0.0%) |
| 20 to 24 Year Olds | 0 (0.0%) | 19 (100.0%) |
| 25 to 34 Year Olds | 0 (0.0%) | 0 (0.0%) |
| 35 Years and over | 18 (50.0%) | 18 (50.0%) |
| Total | 567 (87.2%) | 83 (12.8%) |
Educational Attainment by Field of Study in Westfield
Education (162 | 22.2%), business (116 | 15.9%), liberal arts & history (96 | 13.2%), literature & languages (84 | 11.5%), and science & technology (83 | 11.4%) are the most common fields of study among 729 individuals in Westfield who have obtained a bachelor's degree or higher.
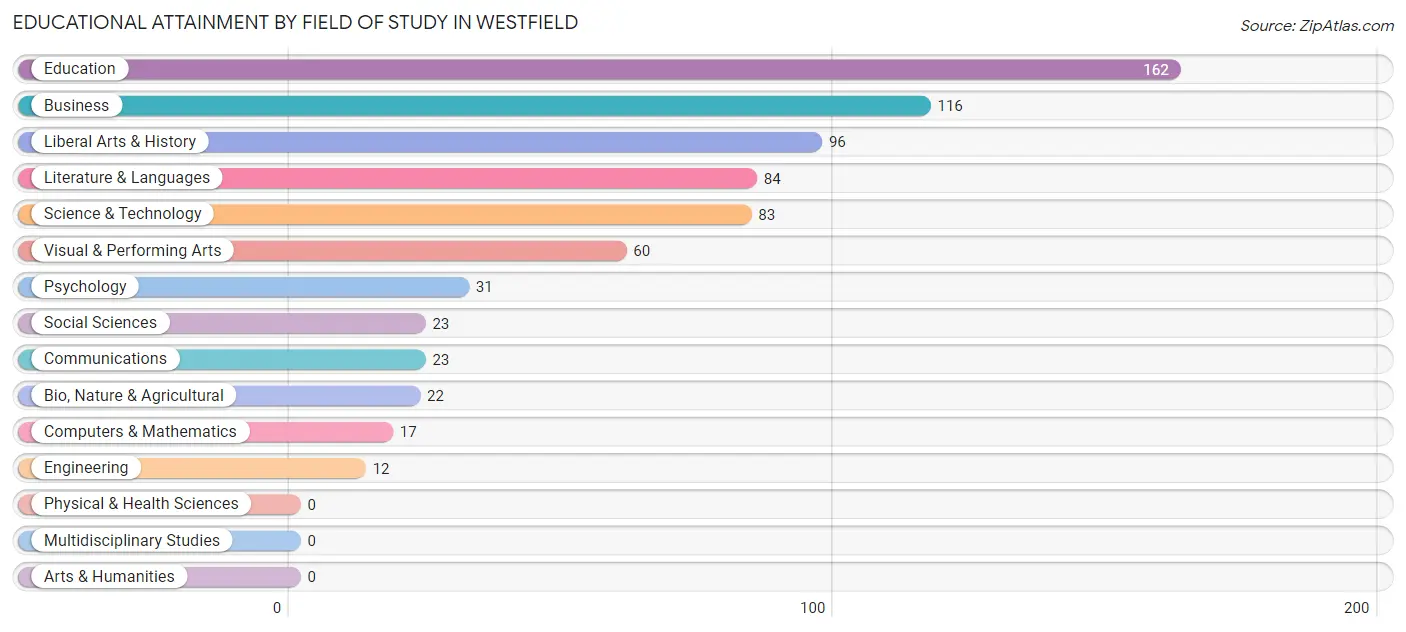
| Field of Study | # Graduates | % Graduates |
| Computers & Mathematics | 17 | 2.3% |
| Bio, Nature & Agricultural | 22 | 3.0% |
| Physical & Health Sciences | 0 | 0.0% |
| Psychology | 31 | 4.3% |
| Social Sciences | 23 | 3.2% |
| Engineering | 12 | 1.7% |
| Multidisciplinary Studies | 0 | 0.0% |
| Science & Technology | 83 | 11.4% |
| Business | 116 | 15.9% |
| Education | 162 | 22.2% |
| Literature & Languages | 84 | 11.5% |
| Liberal Arts & History | 96 | 13.2% |
| Visual & Performing Arts | 60 | 8.2% |
| Communications | 23 | 3.2% |
| Arts & Humanities | 0 | 0.0% |
| Total | 729 | 100.0% |
Transportation & Commute in Westfield
Vehicle Availability by Sex in Westfield
The most prevalent vehicle ownership categories in Westfield are males with 2 vehicles (345, accounting for 58.0%) and females with 2 vehicles (82, making up 97.2%).
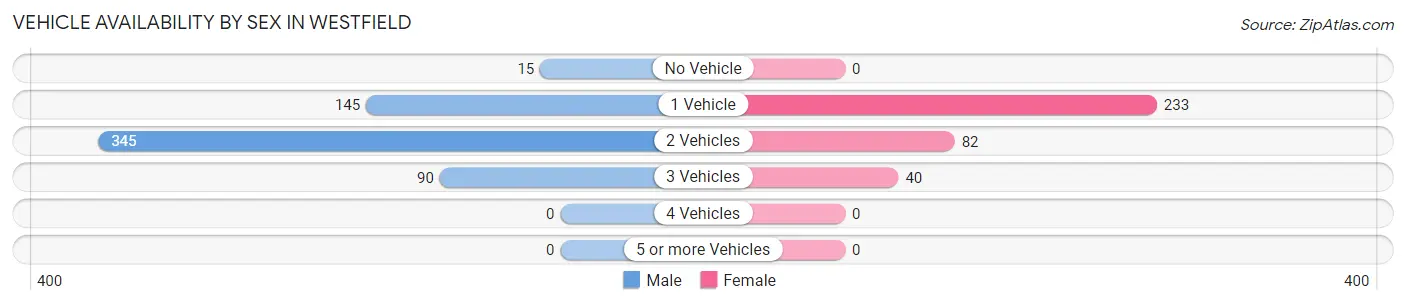
| Vehicles Available | Male | Female |
| No Vehicle | 15 (2.5%) | 0 (0.0%) |
| 1 Vehicle | 145 (24.4%) | 233 (65.6%) |
| 2 Vehicles | 345 (58.0%) | 82 (23.1%) |
| 3 Vehicles | 90 (15.1%) | 40 (11.3%) |
| 4 Vehicles | 0 (0.0%) | 0 (0.0%) |
| 5 or more Vehicles | 0 (0.0%) | 0 (0.0%) |
| Total | 595 (100.0%) | 355 (100.0%) |
Commute Time in Westfield
The most frequently occuring commute durations in Westfield are 5 to 9 minutes (285 commuters, 32.5%), 20 to 24 minutes (167 commuters, 19.0%), and 25 to 29 minutes (93 commuters, 10.6%).
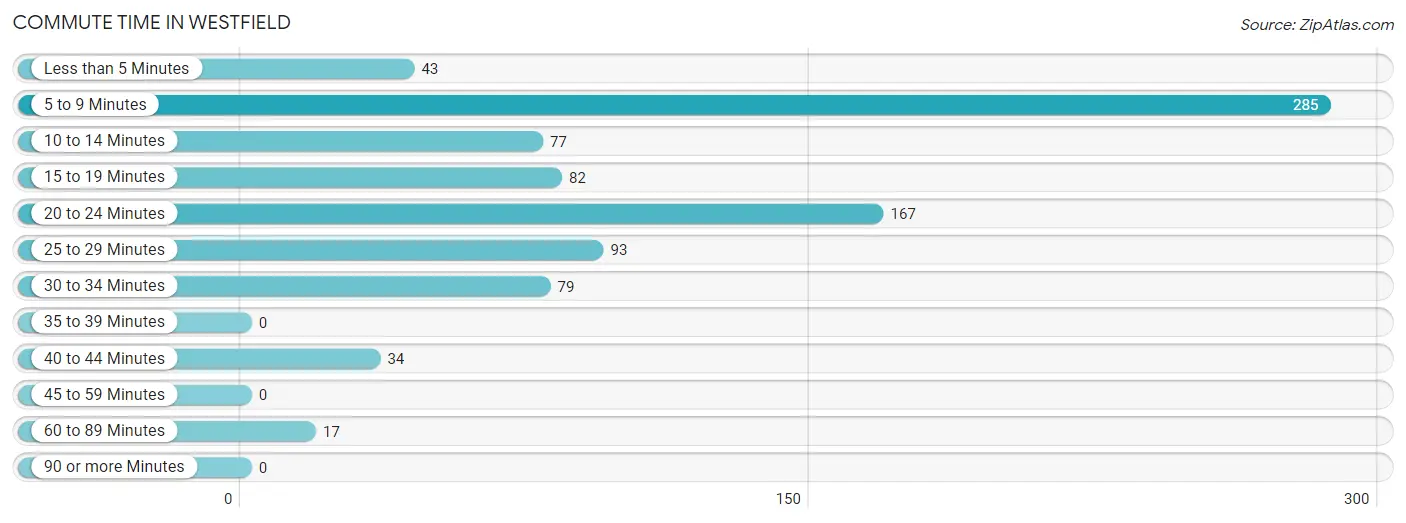
| Commute Time | # Commuters | % Commuters |
| Less than 5 Minutes | 43 | 4.9% |
| 5 to 9 Minutes | 285 | 32.5% |
| 10 to 14 Minutes | 77 | 8.8% |
| 15 to 19 Minutes | 82 | 9.3% |
| 20 to 24 Minutes | 167 | 19.0% |
| 25 to 29 Minutes | 93 | 10.6% |
| 30 to 34 Minutes | 79 | 9.0% |
| 35 to 39 Minutes | 0 | 0.0% |
| 40 to 44 Minutes | 34 | 3.9% |
| 45 to 59 Minutes | 0 | 0.0% |
| 60 to 89 Minutes | 17 | 1.9% |
| 90 or more Minutes | 0 | 0.0% |
Commute Time by Sex in Westfield
The most common commute times in Westfield are 5 to 9 minutes (150 commuters, 27.7%) for males and 5 to 9 minutes (135 commuters, 40.2%) for females.
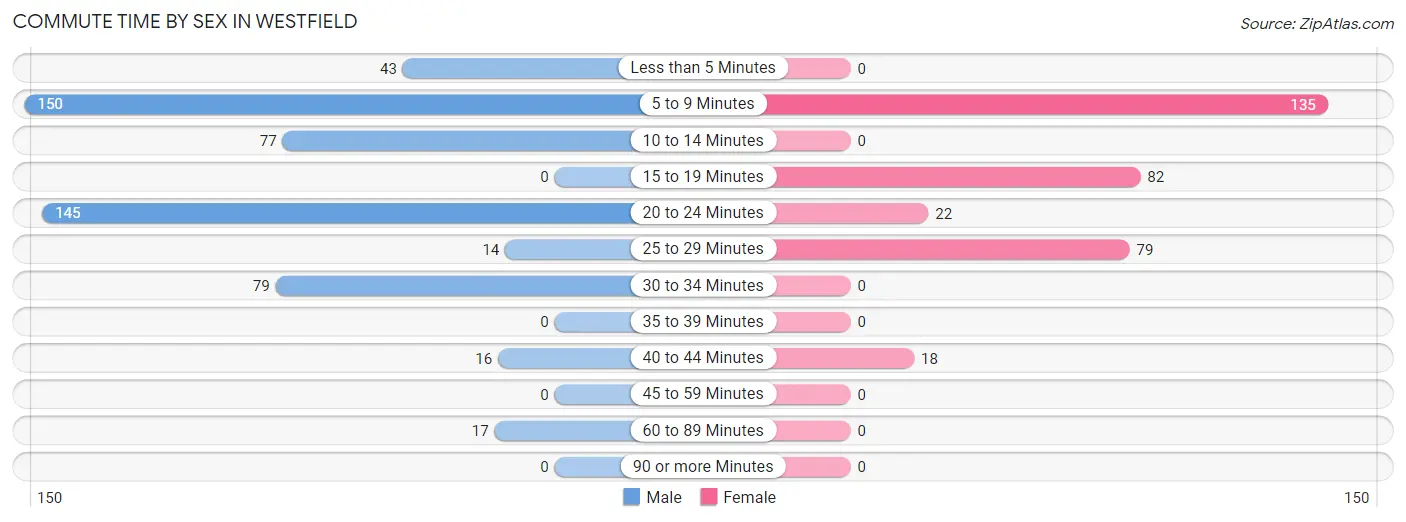
| Commute Time | Male | Female |
| Less than 5 Minutes | 43 (8.0%) | 0 (0.0%) |
| 5 to 9 Minutes | 150 (27.7%) | 135 (40.2%) |
| 10 to 14 Minutes | 77 (14.2%) | 0 (0.0%) |
| 15 to 19 Minutes | 0 (0.0%) | 82 (24.4%) |
| 20 to 24 Minutes | 145 (26.8%) | 22 (6.6%) |
| 25 to 29 Minutes | 14 (2.6%) | 79 (23.5%) |
| 30 to 34 Minutes | 79 (14.6%) | 0 (0.0%) |
| 35 to 39 Minutes | 0 (0.0%) | 0 (0.0%) |
| 40 to 44 Minutes | 16 (3.0%) | 18 (5.4%) |
| 45 to 59 Minutes | 0 (0.0%) | 0 (0.0%) |
| 60 to 89 Minutes | 17 (3.1%) | 0 (0.0%) |
| 90 or more Minutes | 0 (0.0%) | 0 (0.0%) |
Time of Departure to Work by Sex in Westfield
The most frequent times of departure to work in Westfield are 4:00 PM to 11:59 PM (162, 29.9%) for males and 12:00 PM to 3:59 PM (94, 28.0%) for females.
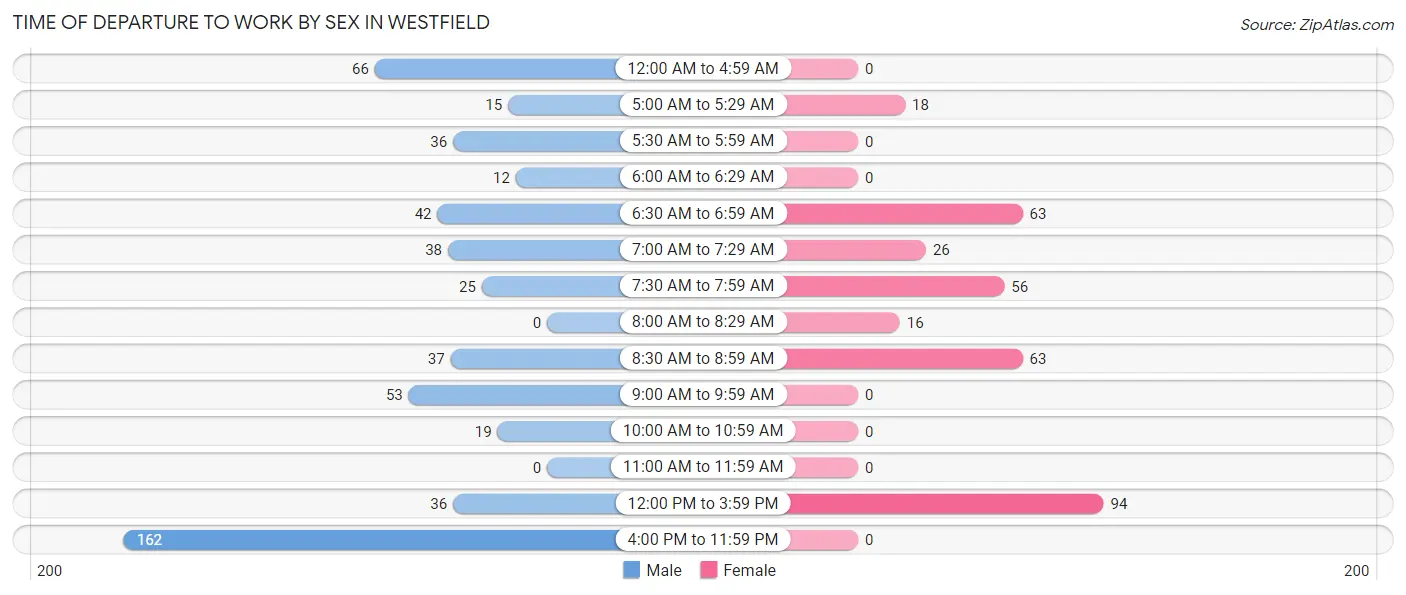
| Time of Departure | Male | Female |
| 12:00 AM to 4:59 AM | 66 (12.2%) | 0 (0.0%) |
| 5:00 AM to 5:29 AM | 15 (2.8%) | 18 (5.4%) |
| 5:30 AM to 5:59 AM | 36 (6.7%) | 0 (0.0%) |
| 6:00 AM to 6:29 AM | 12 (2.2%) | 0 (0.0%) |
| 6:30 AM to 6:59 AM | 42 (7.8%) | 63 (18.8%) |
| 7:00 AM to 7:29 AM | 38 (7.0%) | 26 (7.7%) |
| 7:30 AM to 7:59 AM | 25 (4.6%) | 56 (16.7%) |
| 8:00 AM to 8:29 AM | 0 (0.0%) | 16 (4.8%) |
| 8:30 AM to 8:59 AM | 37 (6.8%) | 63 (18.8%) |
| 9:00 AM to 9:59 AM | 53 (9.8%) | 0 (0.0%) |
| 10:00 AM to 10:59 AM | 19 (3.5%) | 0 (0.0%) |
| 11:00 AM to 11:59 AM | 0 (0.0%) | 0 (0.0%) |
| 12:00 PM to 3:59 PM | 36 (6.7%) | 94 (28.0%) |
| 4:00 PM to 11:59 PM | 162 (29.9%) | 0 (0.0%) |
| Total | 541 (100.0%) | 336 (100.0%) |
Housing Occupancy in Westfield
Occupancy by Ownership in Westfield
Of the total 1,312 dwellings in Westfield, owner-occupied units account for 871 (66.4%), while renter-occupied units make up 441 (33.6%).
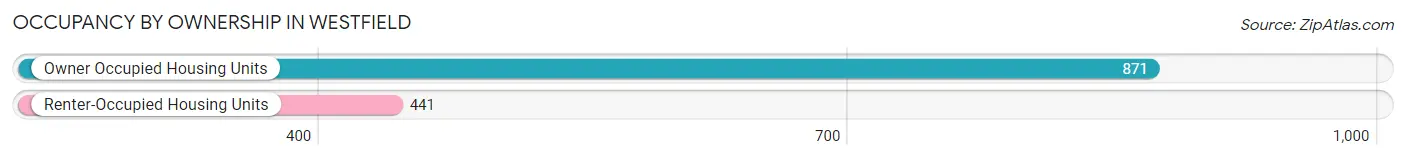
| Occupancy | # Housing Units | % Housing Units |
| Owner Occupied Housing Units | 871 | 66.4% |
| Renter-Occupied Housing Units | 441 | 33.6% |
| Total Occupied Housing Units | 1,312 | 100.0% |
Occupancy by Household Size in Westfield
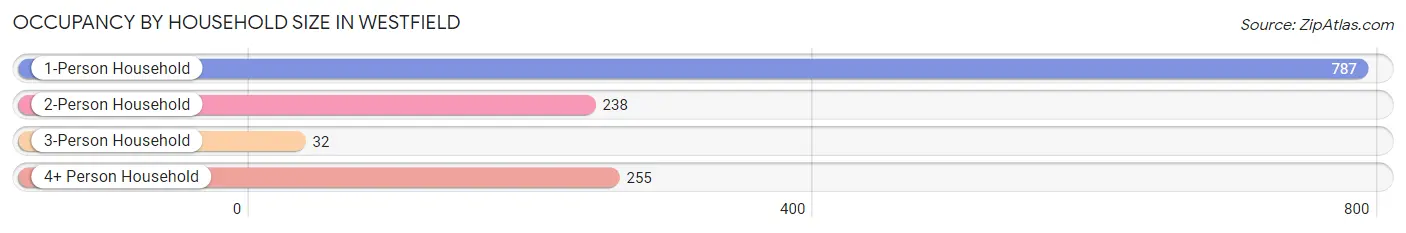
| Household Size | # Housing Units | % Housing Units |
| 1-Person Household | 787 | 60.0% |
| 2-Person Household | 238 | 18.1% |
| 3-Person Household | 32 | 2.4% |
| 4+ Person Household | 255 | 19.4% |
| Total Housing Units | 1,312 | 100.0% |
Occupancy by Ownership by Household Size in Westfield
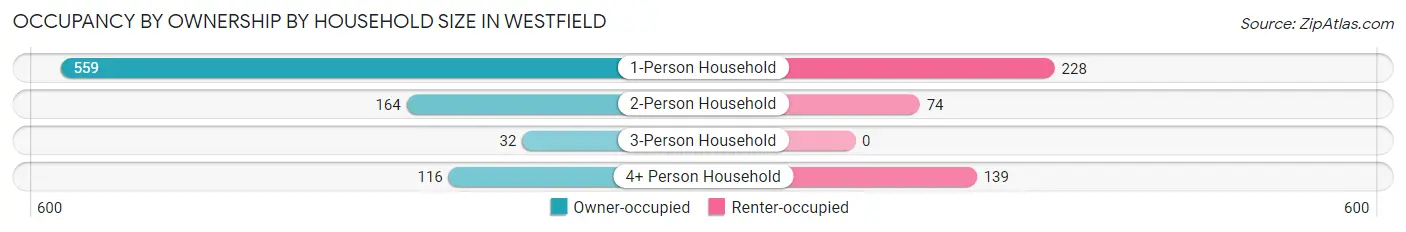
| Household Size | Owner-occupied | Renter-occupied |
| 1-Person Household | 559 (71.0%) | 228 (29.0%) |
| 2-Person Household | 164 (68.9%) | 74 (31.1%) |
| 3-Person Household | 32 (100.0%) | 0 (0.0%) |
| 4+ Person Household | 116 (45.5%) | 139 (54.5%) |
| Total Housing Units | 871 (66.4%) | 441 (33.6%) |
Occupancy by Educational Attainment in Westfield
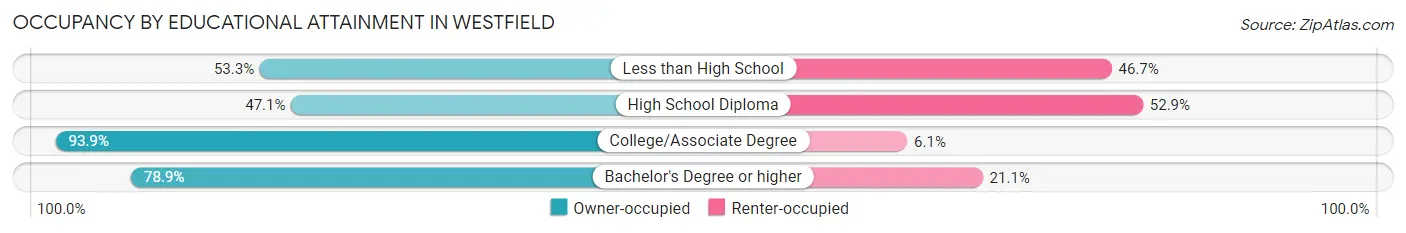
| Household Size | Owner-occupied | Renter-occupied |
| Less than High School | 80 (53.3%) | 70 (46.7%) |
| High School Diploma | 237 (47.1%) | 266 (52.9%) |
| College/Associate Degree | 214 (93.9%) | 14 (6.1%) |
| Bachelor's Degree or higher | 340 (78.9%) | 91 (21.1%) |
Occupancy by Age of Householder in Westfield
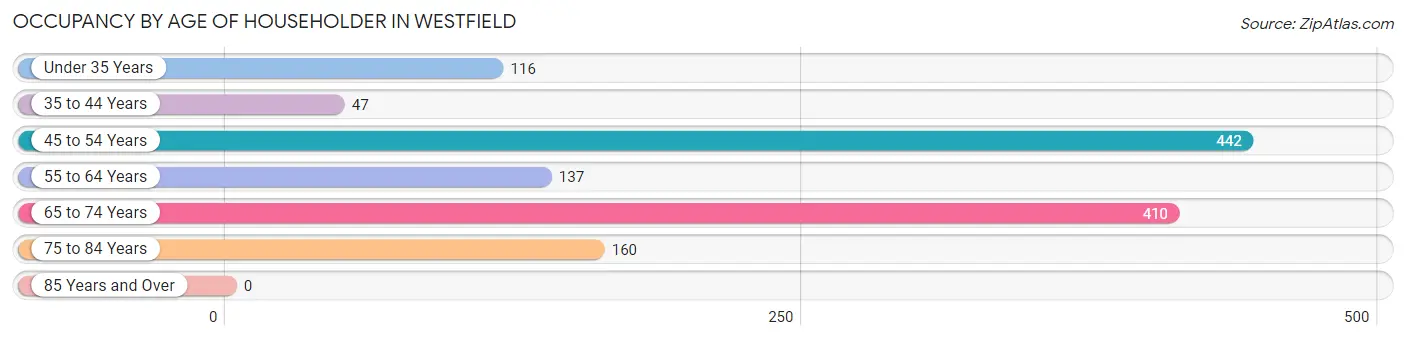
| Age Bracket | # Households | % Households |
| Under 35 Years | 116 | 8.8% |
| 35 to 44 Years | 47 | 3.6% |
| 45 to 54 Years | 442 | 33.7% |
| 55 to 64 Years | 137 | 10.4% |
| 65 to 74 Years | 410 | 31.2% |
| 75 to 84 Years | 160 | 12.2% |
| 85 Years and Over | 0 | 0.0% |
| Total | 1,312 | 100.0% |
Housing Finances in Westfield
Median Income by Occupancy in Westfield
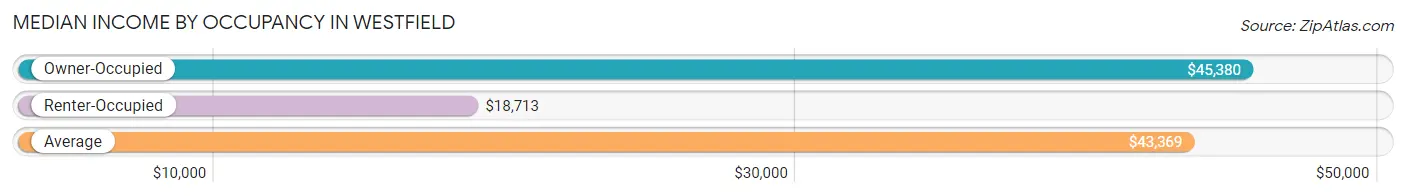
| Occupancy Type | # Households | Median Income |
| Owner-Occupied | 871 (66.4%) | $45,380 |
| Renter-Occupied | 441 (33.6%) | $18,713 |
| Average | 1,312 (100.0%) | $43,369 |
Occupancy by Householder Income Bracket in Westfield
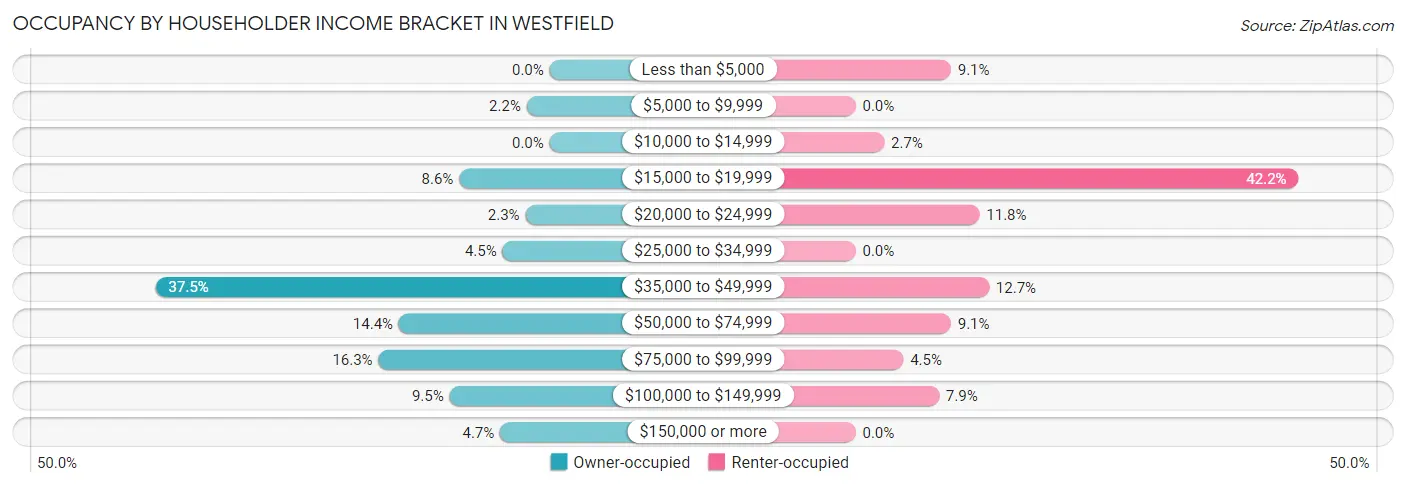
| Income Bracket | Owner-occupied | Renter-occupied |
| Less than $5,000 | 0 (0.0%) | 40 (9.1%) |
| $5,000 to $9,999 | 19 (2.2%) | 0 (0.0%) |
| $10,000 to $14,999 | 0 (0.0%) | 12 (2.7%) |
| $15,000 to $19,999 | 75 (8.6%) | 186 (42.2%) |
| $20,000 to $24,999 | 20 (2.3%) | 52 (11.8%) |
| $25,000 to $34,999 | 39 (4.5%) | 0 (0.0%) |
| $35,000 to $49,999 | 327 (37.5%) | 56 (12.7%) |
| $50,000 to $74,999 | 125 (14.3%) | 40 (9.1%) |
| $75,000 to $99,999 | 142 (16.3%) | 20 (4.5%) |
| $100,000 to $149,999 | 83 (9.5%) | 35 (7.9%) |
| $150,000 or more | 41 (4.7%) | 0 (0.0%) |
| Total | 871 (100.0%) | 441 (100.0%) |
Monthly Housing Cost Tiers in Westfield
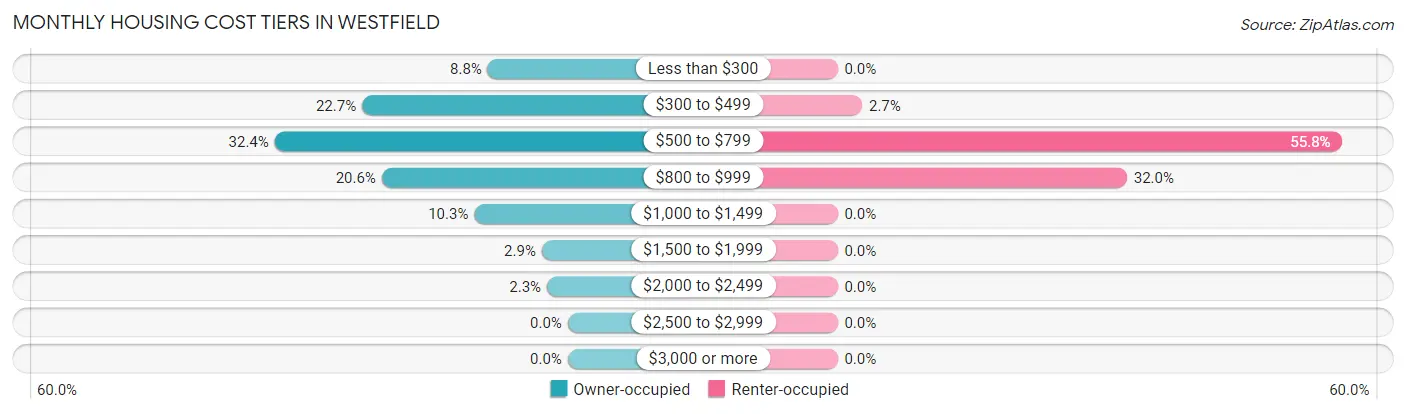
| Monthly Cost | Owner-occupied | Renter-occupied |
| Less than $300 | 77 (8.8%) | 0 (0.0%) |
| $300 to $499 | 198 (22.7%) | 12 (2.7%) |
| $500 to $799 | 282 (32.4%) | 246 (55.8%) |
| $800 to $999 | 179 (20.5%) | 141 (32.0%) |
| $1,000 to $1,499 | 90 (10.3%) | 0 (0.0%) |
| $1,500 to $1,999 | 25 (2.9%) | 0 (0.0%) |
| $2,000 to $2,499 | 20 (2.3%) | 0 (0.0%) |
| $2,500 to $2,999 | 0 (0.0%) | 0 (0.0%) |
| $3,000 or more | 0 (0.0%) | 0 (0.0%) |
| Total | 871 (100.0%) | 441 (100.0%) |
Physical Housing Characteristics in Westfield
Housing Structures in Westfield
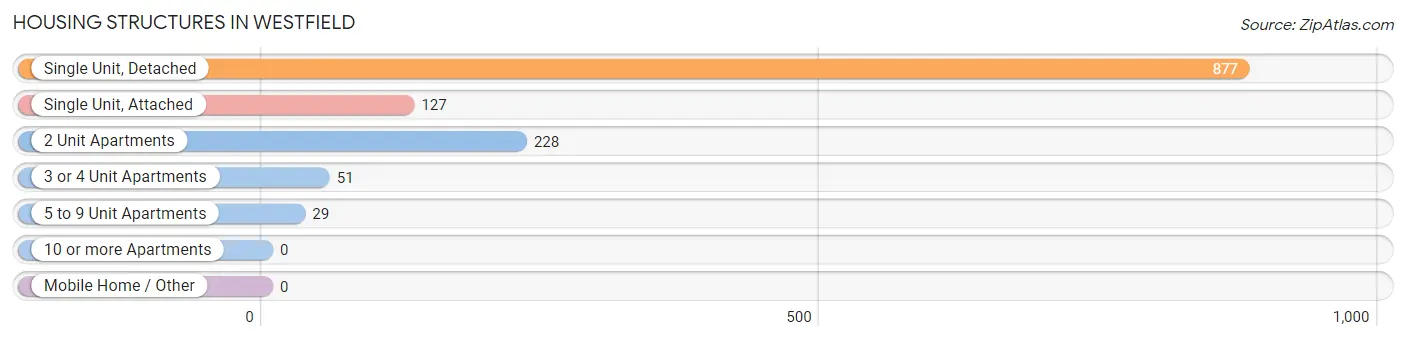
| Structure Type | # Housing Units | % Housing Units |
| Single Unit, Detached | 877 | 66.8% |
| Single Unit, Attached | 127 | 9.7% |
| 2 Unit Apartments | 228 | 17.4% |
| 3 or 4 Unit Apartments | 51 | 3.9% |
| 5 to 9 Unit Apartments | 29 | 2.2% |
| 10 or more Apartments | 0 | 0.0% |
| Mobile Home / Other | 0 | 0.0% |
| Total | 1,312 | 100.0% |
Housing Structures by Occupancy in Westfield
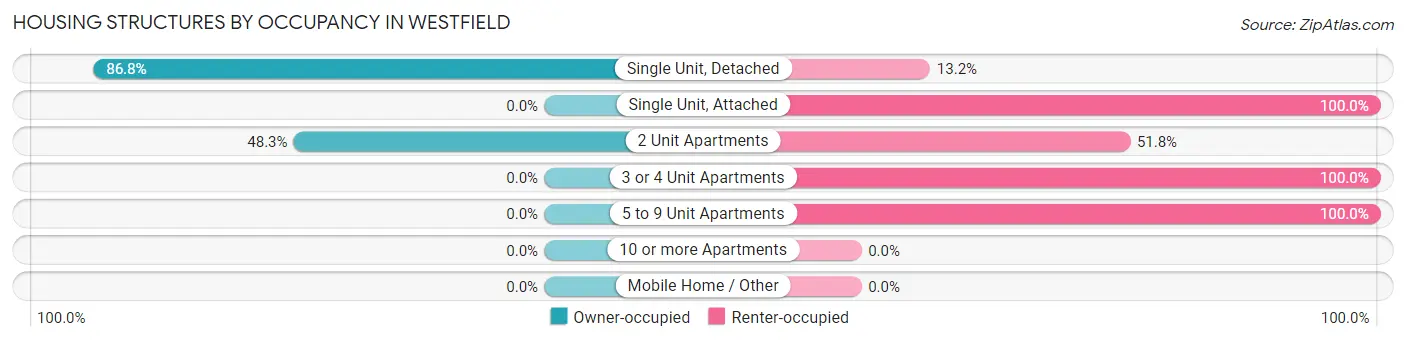
| Structure Type | Owner-occupied | Renter-occupied |
| Single Unit, Detached | 761 (86.8%) | 116 (13.2%) |
| Single Unit, Attached | 0 (0.0%) | 127 (100.0%) |
| 2 Unit Apartments | 110 (48.2%) | 118 (51.7%) |
| 3 or 4 Unit Apartments | 0 (0.0%) | 51 (100.0%) |
| 5 to 9 Unit Apartments | 0 (0.0%) | 29 (100.0%) |
| 10 or more Apartments | 0 (0.0%) | 0 (0.0%) |
| Mobile Home / Other | 0 (0.0%) | 0 (0.0%) |
| Total | 871 (66.4%) | 441 (33.6%) |
Housing Structures by Number of Rooms in Westfield
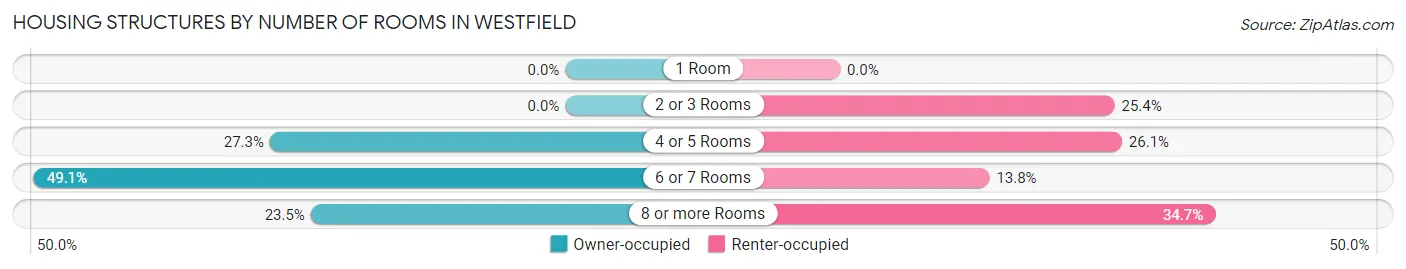
| Number of Rooms | Owner-occupied | Renter-occupied |
| 1 Room | 0 (0.0%) | 0 (0.0%) |
| 2 or 3 Rooms | 0 (0.0%) | 112 (25.4%) |
| 4 or 5 Rooms | 238 (27.3%) | 115 (26.1%) |
| 6 or 7 Rooms | 428 (49.1%) | 61 (13.8%) |
| 8 or more Rooms | 205 (23.5%) | 153 (34.7%) |
| Total | 871 (100.0%) | 441 (100.0%) |
Housing Structure by Heating Type in Westfield
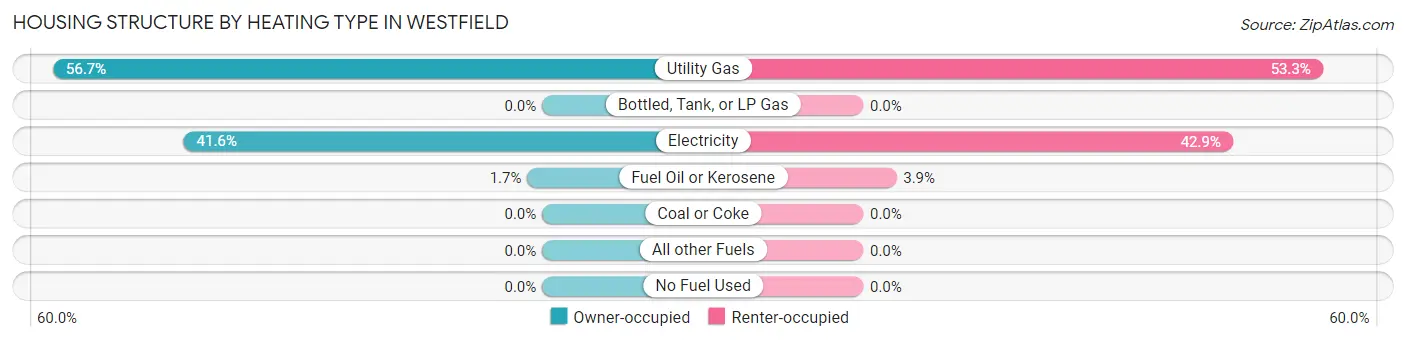
| Heating Type | Owner-occupied | Renter-occupied |
| Utility Gas | 494 (56.7%) | 235 (53.3%) |
| Bottled, Tank, or LP Gas | 0 (0.0%) | 0 (0.0%) |
| Electricity | 362 (41.6%) | 189 (42.9%) |
| Fuel Oil or Kerosene | 15 (1.7%) | 17 (3.8%) |
| Coal or Coke | 0 (0.0%) | 0 (0.0%) |
| All other Fuels | 0 (0.0%) | 0 (0.0%) |
| No Fuel Used | 0 (0.0%) | 0 (0.0%) |
| Total | 871 (100.0%) | 441 (100.0%) |
Household Vehicle Usage in Westfield
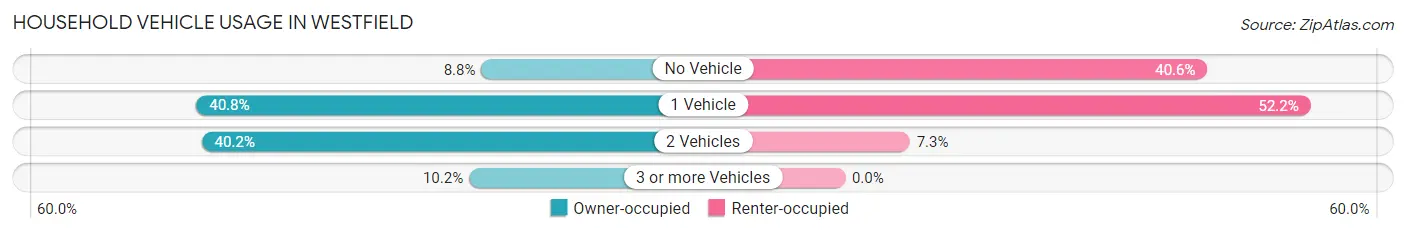
| Vehicles per Household | Owner-occupied | Renter-occupied |
| No Vehicle | 77 (8.8%) | 179 (40.6%) |
| 1 Vehicle | 355 (40.8%) | 230 (52.1%) |
| 2 Vehicles | 350 (40.2%) | 32 (7.3%) |
| 3 or more Vehicles | 89 (10.2%) | 0 (0.0%) |
| Total | 871 (100.0%) | 441 (100.0%) |
Real Estate & Mortgages in Westfield
Real Estate and Mortgage Overview in Westfield
| Characteristic | Without Mortgage | With Mortgage |
| Housing Units | 574 | 297 |
| Median Property Value | $85,500 | $95,900 |
| Median Household Income | $44,149 | $41 |
| Monthly Housing Costs | $507 | $0 |
| Real Estate Taxes | $2,737 | $0 |
Property Value by Mortgage Status in Westfield
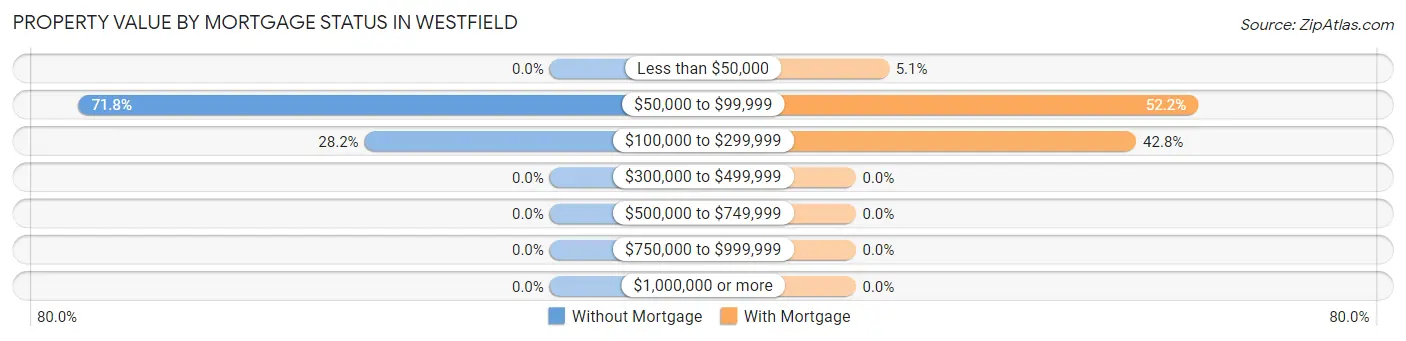
| Property Value | Without Mortgage | With Mortgage |
| Less than $50,000 | 0 (0.0%) | 15 (5.1%) |
| $50,000 to $99,999 | 412 (71.8%) | 155 (52.2%) |
| $100,000 to $299,999 | 162 (28.2%) | 127 (42.8%) |
| $300,000 to $499,999 | 0 (0.0%) | 0 (0.0%) |
| $500,000 to $749,999 | 0 (0.0%) | 0 (0.0%) |
| $750,000 to $999,999 | 0 (0.0%) | 0 (0.0%) |
| $1,000,000 or more | 0 (0.0%) | 0 (0.0%) |
| Total | 574 (100.0%) | 297 (100.0%) |
Household Income by Mortgage Status in Westfield
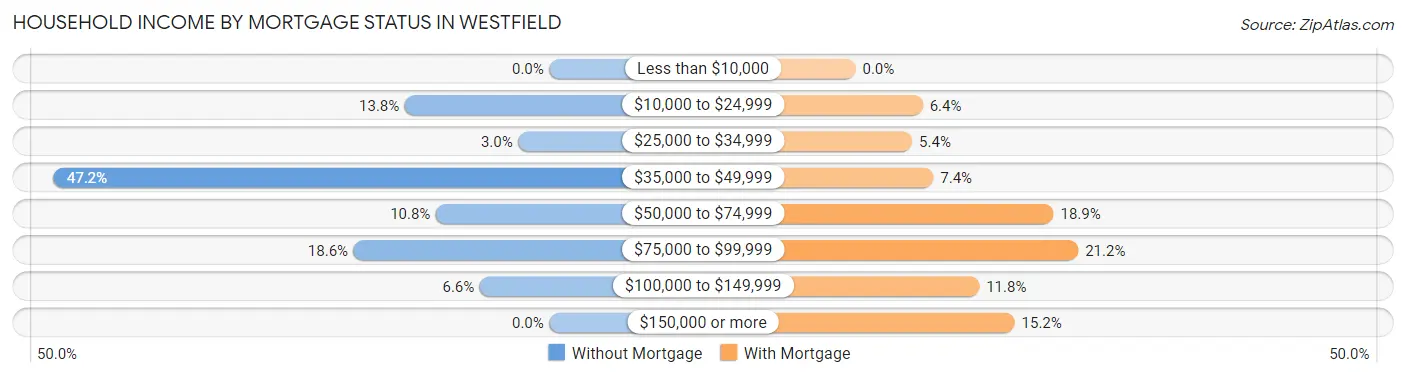
| Household Income | Without Mortgage | With Mortgage |
| Less than $10,000 | 0 (0.0%) | 0 (0.0%) |
| $10,000 to $24,999 | 79 (13.8%) | 19 (6.4%) |
| $25,000 to $34,999 | 17 (3.0%) | 16 (5.4%) |
| $35,000 to $49,999 | 271 (47.2%) | 22 (7.4%) |
| $50,000 to $74,999 | 62 (10.8%) | 56 (18.9%) |
| $75,000 to $99,999 | 107 (18.6%) | 63 (21.2%) |
| $100,000 to $149,999 | 38 (6.6%) | 35 (11.8%) |
| $150,000 or more | 0 (0.0%) | 45 (15.1%) |
| Total | 574 (100.0%) | 297 (100.0%) |
Property Value to Household Income Ratio in Westfield
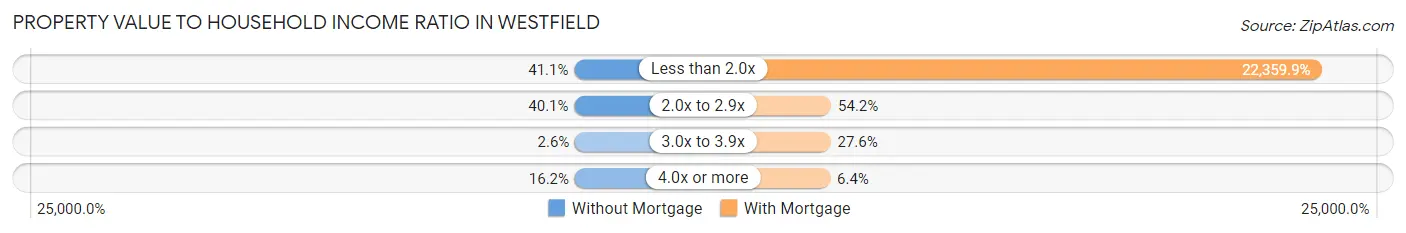
| Value-to-Income Ratio | Without Mortgage | With Mortgage |
| Less than 2.0x | 236 (41.1%) | 66,409 (22,359.9%) |
| 2.0x to 2.9x | 230 (40.1%) | 161 (54.2%) |
| 3.0x to 3.9x | 15 (2.6%) | 82 (27.6%) |
| 4.0x or more | 93 (16.2%) | 19 (6.4%) |
| Total | 574 (100.0%) | 297 (100.0%) |
Real Estate Taxes by Mortgage Status in Westfield
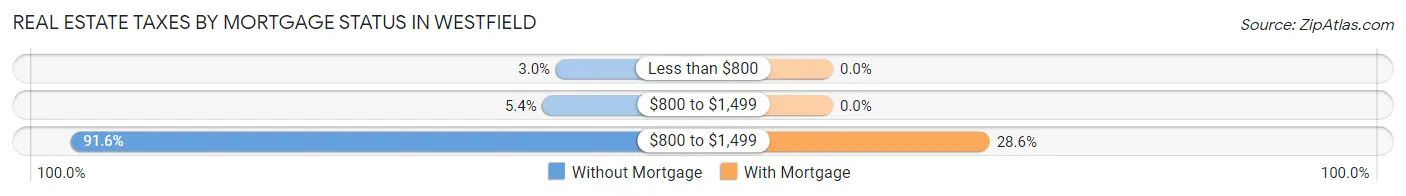
| Property Taxes | Without Mortgage | With Mortgage |
| Less than $800 | 17 (3.0%) | 0 (0.0%) |
| $800 to $1,499 | 31 (5.4%) | 0 (0.0%) |
| $800 to $1,499 | 526 (91.6%) | 85 (28.6%) |
| Total | 574 (100.0%) | 297 (100.0%) |
Health & Disability in Westfield
Health Insurance Coverage by Age in Westfield
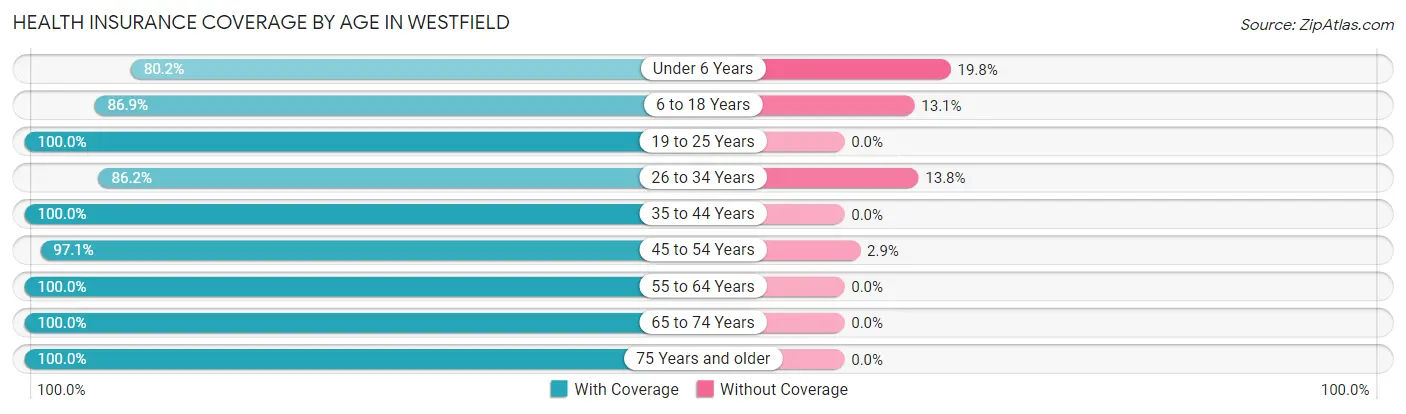
| Age Bracket | With Coverage | Without Coverage |
| Under 6 Years | 85 (80.2%) | 21 (19.8%) |
| 6 to 18 Years | 499 (86.9%) | 75 (13.1%) |
| 19 to 25 Years | 59 (100.0%) | 0 (0.0%) |
| 26 to 34 Years | 181 (86.2%) | 29 (13.8%) |
| 35 to 44 Years | 155 (100.0%) | 0 (0.0%) |
| 45 to 54 Years | 529 (97.1%) | 16 (2.9%) |
| 55 to 64 Years | 285 (100.0%) | 0 (0.0%) |
| 65 to 74 Years | 487 (100.0%) | 0 (0.0%) |
| 75 Years and older | 201 (100.0%) | 0 (0.0%) |
| Total | 2,481 (94.6%) | 141 (5.4%) |
Health Insurance Coverage by Citizenship Status in Westfield
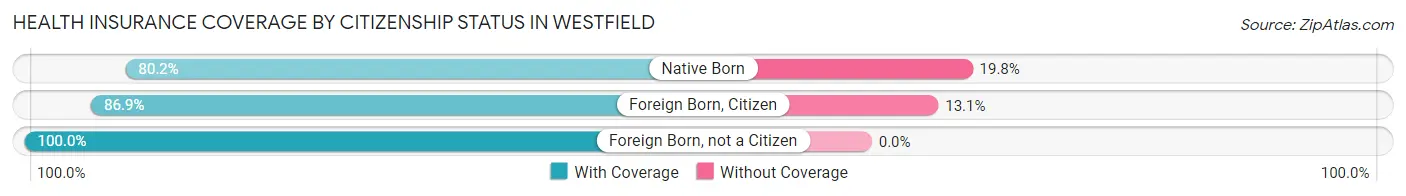
| Citizenship Status | With Coverage | Without Coverage |
| Native Born | 85 (80.2%) | 21 (19.8%) |
| Foreign Born, Citizen | 499 (86.9%) | 75 (13.1%) |
| Foreign Born, not a Citizen | 59 (100.0%) | 0 (0.0%) |
Health Insurance Coverage by Household Income in Westfield
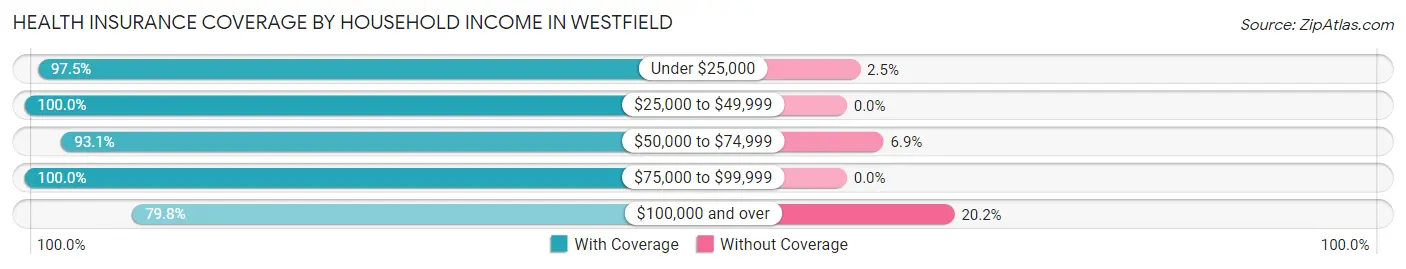
| Household Income | With Coverage | Without Coverage |
| Under $25,000 | 624 (97.5%) | 16 (2.5%) |
| $25,000 to $49,999 | 701 (100.0%) | 0 (0.0%) |
| $50,000 to $74,999 | 391 (93.1%) | 29 (6.9%) |
| $75,000 to $99,999 | 376 (100.0%) | 0 (0.0%) |
| $100,000 and over | 380 (79.8%) | 96 (20.2%) |
Public vs Private Health Insurance Coverage by Age in Westfield
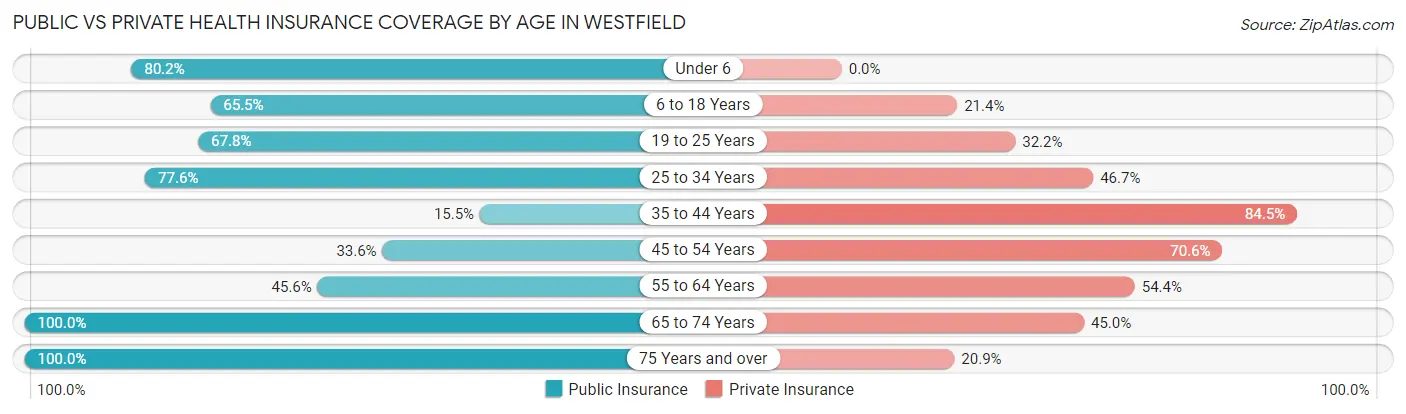
| Age Bracket | Public Insurance | Private Insurance |
| Under 6 | 85 (80.2%) | 0 (0.0%) |
| 6 to 18 Years | 376 (65.5%) | 123 (21.4%) |
| 19 to 25 Years | 40 (67.8%) | 19 (32.2%) |
| 25 to 34 Years | 163 (77.6%) | 98 (46.7%) |
| 35 to 44 Years | 24 (15.5%) | 131 (84.5%) |
| 45 to 54 Years | 183 (33.6%) | 385 (70.6%) |
| 55 to 64 Years | 130 (45.6%) | 155 (54.4%) |
| 65 to 74 Years | 487 (100.0%) | 219 (45.0%) |
| 75 Years and over | 201 (100.0%) | 42 (20.9%) |
| Total | 1,689 (64.4%) | 1,172 (44.7%) |
Disability Status by Sex by Age in Westfield
| Age Bracket | Male | Female |
| Under 5 Years | 0 (0.0%) | 0 (0.0%) |
| 5 to 17 Years | 0 (0.0%) | 0 (0.0%) |
| 18 to 34 Years | 19 (12.2%) | 19 (14.5%) |
| 35 to 64 Years | 133 (26.8%) | 4 (0.8%) |
| 65 to 74 Years | 68 (21.1%) | 39 (23.6%) |
| 75 Years and over | 0 (0.0%) | 80 (39.8%) |
Disability Class by Sex by Age in Westfield
Disability Class: Hearing Difficulty
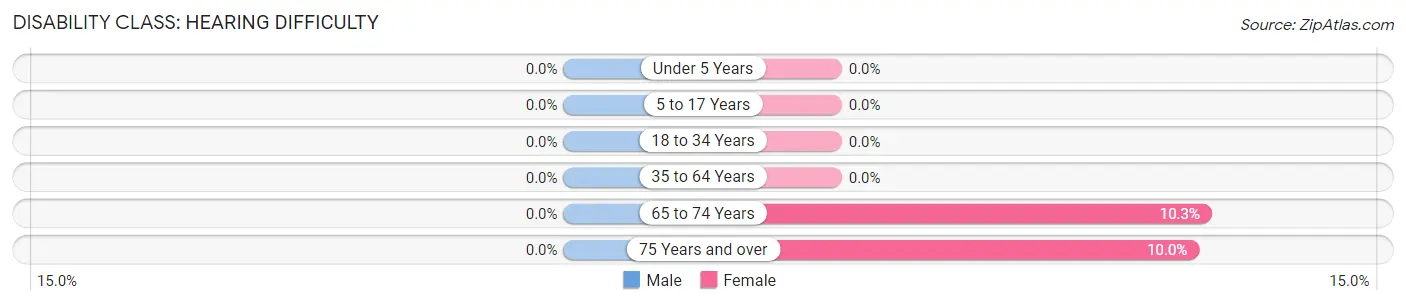
| Age Bracket | Male | Female |
| Under 5 Years | 0 (0.0%) | 0 (0.0%) |
| 5 to 17 Years | 0 (0.0%) | 0 (0.0%) |
| 18 to 34 Years | 0 (0.0%) | 0 (0.0%) |
| 35 to 64 Years | 0 (0.0%) | 0 (0.0%) |
| 65 to 74 Years | 0 (0.0%) | 17 (10.3%) |
| 75 Years and over | 0 (0.0%) | 20 (10.0%) |
Disability Class: Vision Difficulty
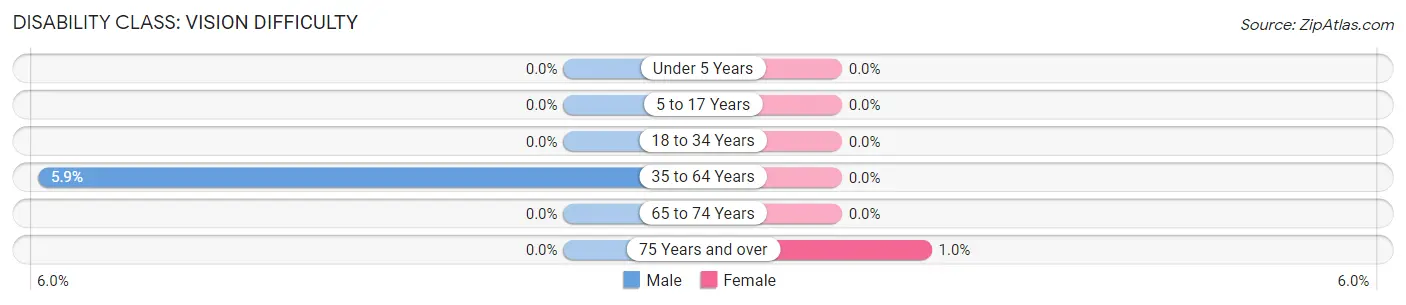
| Age Bracket | Male | Female |
| Under 5 Years | 0 (0.0%) | 0 (0.0%) |
| 5 to 17 Years | 0 (0.0%) | 0 (0.0%) |
| 18 to 34 Years | 0 (0.0%) | 0 (0.0%) |
| 35 to 64 Years | 29 (5.9%) | 0 (0.0%) |
| 65 to 74 Years | 0 (0.0%) | 0 (0.0%) |
| 75 Years and over | 0 (0.0%) | 2 (1.0%) |
Disability Class: Cognitive Difficulty
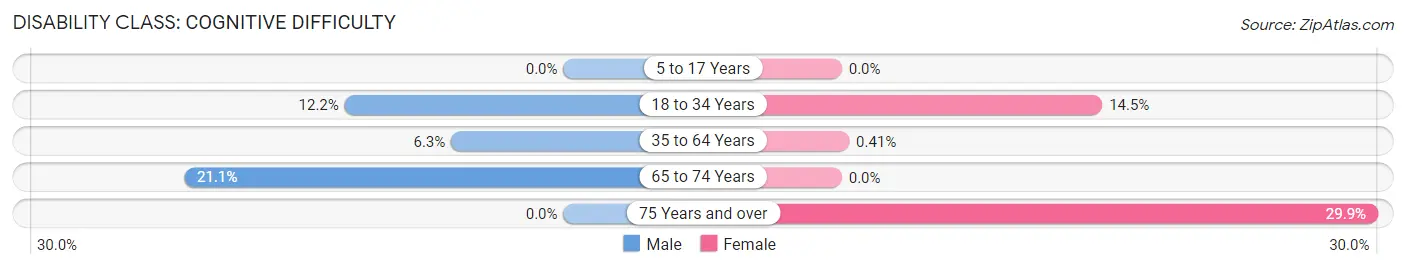
| Age Bracket | Male | Female |
| 5 to 17 Years | 0 (0.0%) | 0 (0.0%) |
| 18 to 34 Years | 19 (12.2%) | 19 (14.5%) |
| 35 to 64 Years | 31 (6.2%) | 2 (0.4%) |
| 65 to 74 Years | 68 (21.1%) | 0 (0.0%) |
| 75 Years and over | 0 (0.0%) | 60 (29.8%) |
Disability Class: Ambulatory Difficulty
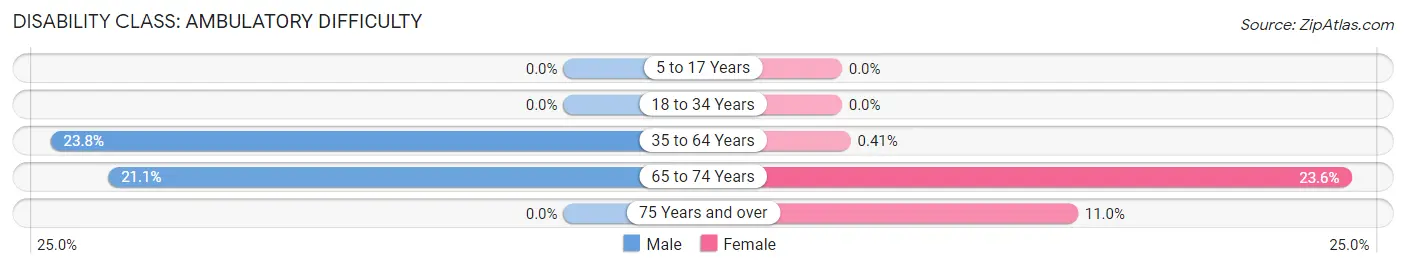
| Age Bracket | Male | Female |
| 5 to 17 Years | 0 (0.0%) | 0 (0.0%) |
| 18 to 34 Years | 0 (0.0%) | 0 (0.0%) |
| 35 to 64 Years | 118 (23.8%) | 2 (0.4%) |
| 65 to 74 Years | 68 (21.1%) | 39 (23.6%) |
| 75 Years and over | 0 (0.0%) | 22 (11.0%) |
Disability Class: Self-Care Difficulty
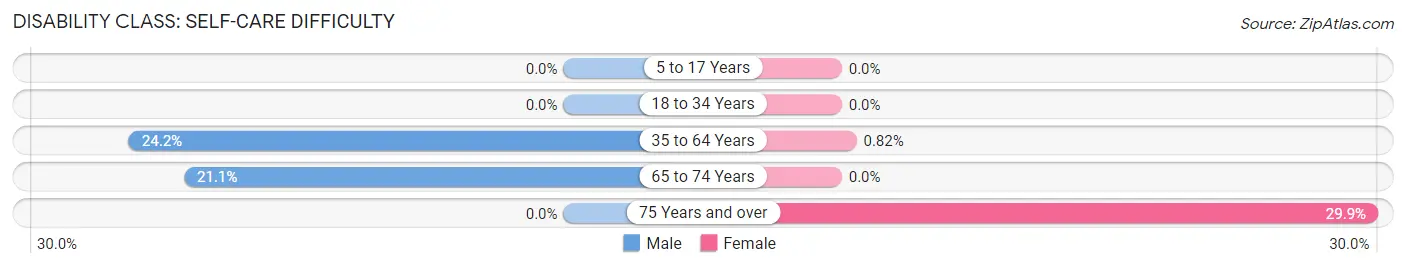
| Age Bracket | Male | Female |
| 5 to 17 Years | 0 (0.0%) | 0 (0.0%) |
| 18 to 34 Years | 0 (0.0%) | 0 (0.0%) |
| 35 to 64 Years | 120 (24.2%) | 4 (0.8%) |
| 65 to 74 Years | 68 (21.1%) | 0 (0.0%) |
| 75 Years and over | 0 (0.0%) | 60 (29.8%) |
Technology Access in Westfield
Computing Device Access in Westfield
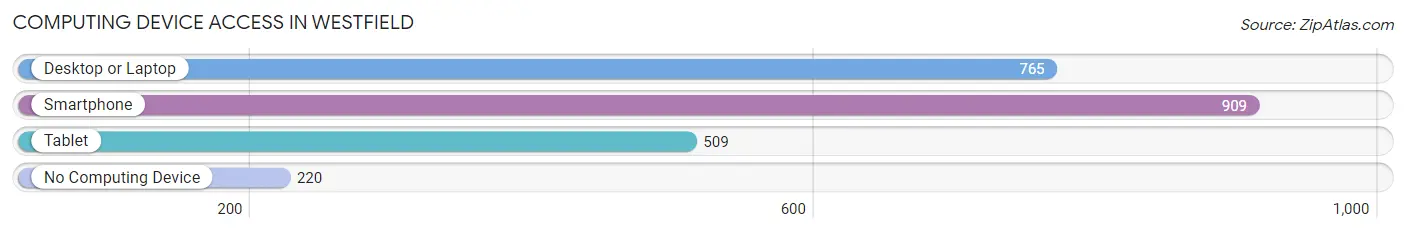
| Device Type | # Households | % Households |
| Desktop or Laptop | 765 | 58.3% |
| Smartphone | 909 | 69.3% |
| Tablet | 509 | 38.8% |
| No Computing Device | 220 | 16.8% |
| Total | 1,312 | 100.0% |
Internet Access in Westfield
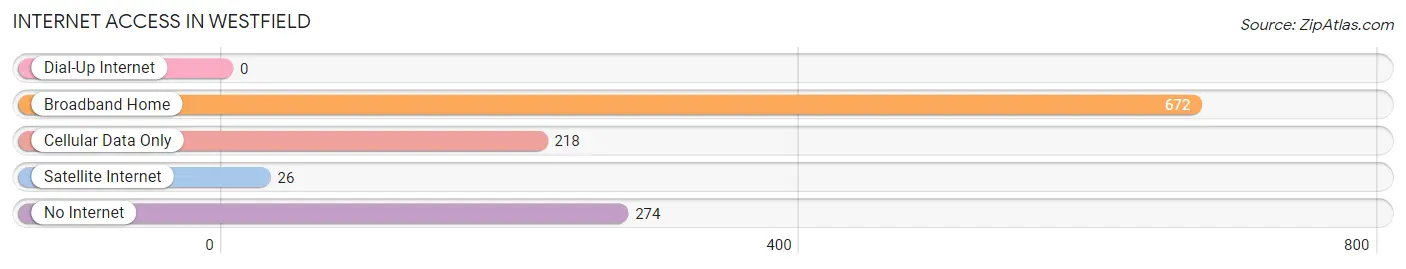
| Internet Type | # Households | % Households |
| Dial-Up Internet | 0 | 0.0% |
| Broadband Home | 672 | 51.2% |
| Cellular Data Only | 218 | 16.6% |
| Satellite Internet | 26 | 2.0% |
| No Internet | 274 | 20.9% |
| Total | 1,312 | 100.0% |
Westfield Summary
History
Westfield, New York is a small town located in Chautauqua County, in the western part of the state. It is situated on the shores of Lake Erie, and is part of the Jamestown-Salamanca-Westfield Metropolitan Statistical Area. The town was first settled in 1810 by a group of settlers from Connecticut, and was originally known as Westfield Center. The town was officially incorporated in 1828, and was named after Westfield, Massachusetts.
The town of Westfield has a rich history, and has been home to many notable people throughout its history. The most famous of these is the author and naturalist, John Burroughs, who was born in Westfield in 1837. Burroughs wrote extensively about the natural beauty of the area, and his writings helped to bring attention to the region.
The town of Westfield has also been home to several notable businesses throughout its history. The most famous of these is the Westfield Woolen Mill, which was established in 1845 and was one of the first woolen mills in the United States. The mill was a major employer in the area for many years, and was a major contributor to the local economy.
Geography
Westfield is located in the western part of Chautauqua County, in the western part of New York State. It is situated on the shores of Lake Erie, and is part of the Jamestown-Salamanca-Westfield Metropolitan Statistical Area. The town covers an area of approximately 11.3 square miles, and has a population of approximately 5,000 people.
The town of Westfield is located in a region of rolling hills and valleys, and is surrounded by forests and farmland. The town is located near several major highways, including Interstate 90, which runs through the town. The town is also located near several major cities, including Buffalo, Rochester, and Cleveland.
Economy
The economy of Westfield is largely based on agriculture and tourism. The town is home to several farms, which produce a variety of crops, including corn, soybeans, and wheat. The town is also home to several wineries, which produce a variety of wines.
The town is also home to several tourist attractions, including the Westfield Woolen Mill, which is a historic woolen mill that is open to the public. The town is also home to several museums, including the Westfield Historical Society Museum, which is dedicated to the history of the town.
Demographics
As of the 2010 census, the population of Westfield was 5,072. The racial makeup of the town was 97.2% White, 0.7% African American, 0.2% Native American, 0.3% Asian, 0.1% Pacific Islander, 0.4% from other races, and 1.1% from two or more races. Hispanic or Latino of any race were 1.7% of the population.
The median income for a household in Westfield was $41,944, and the median income for a family was $50,917. The per capita income for the town was $20,945. About 8.2% of families and 10.3% of the population were below the poverty line, including 14.2% of those under age 18 and 5.2% of those age 65 or over.
Common Questions
What is Per Capita Income in Westfield?
Per Capita income in Westfield is $26,624.
What is the Median Family Income in Westfield?
Median Family Income in Westfield is $69,000.
What is the Median Household income in Westfield?
Median Household Income in Westfield is $43,369.
What is Income or Wage Gap in Westfield?
Income or Wage Gap in Westfield is 43.4%.
Women in Westfield earn 56.6 cents for every dollar earned by a man.
What is Inequality or Gini Index in Westfield?
Inequality or Gini Index in Westfield is 0.39.
What is the Total Population of Westfield?
Total Population of Westfield is 2,714.
What is the Total Male Population of Westfield?
Total Male Population of Westfield is 1,404.
What is the Total Female Population of Westfield?
Total Female Population of Westfield is 1,310.
What is the Ratio of Males per 100 Females in Westfield?
There are 107.18 Males per 100 Females in Westfield.
What is the Ratio of Females per 100 Males in Westfield?
There are 93.30 Females per 100 Males in Westfield.
What is the Median Population Age in Westfield?
Median Population Age in Westfield is 49.9 Years.
What is the Average Family Size in Westfield
Average Family Size in Westfield is 3.7 People.
What is the Average Household Size in Westfield
Average Household Size in Westfield is 2.0 People.
How Large is the Labor Force in Westfield?
There are 1,061 People in the Labor Forcein in Westfield.
What is the Percentage of People in the Labor Force in Westfield?
51.2% of People are in the Labor Force in Westfield.
What is the Unemployment Rate in Westfield?
Unemployment Rate in Westfield is 7.0%.