Walker Valley, NY Map & Demographics
Walker Valley Map
Walker Valley Overview
$38,123
PER CAPITA INCOME
$90,984
AVG FAMILY INCOME
$91,004
AVG HOUSEHOLD INCOME
0.31
INEQUALITY / GINI INDEX
1,440
TOTAL POPULATION
722
MALE POPULATION
718
FEMALE POPULATION
100.56
MALES / 100 FEMALES
99.45
FEMALES / 100 MALES
36.8
MEDIAN AGE
3.1
AVG FAMILY SIZE
2.9
AVG HOUSEHOLD SIZE
828
LABOR FORCE [ PEOPLE ]
70.3%
PERCENT IN LABOR FORCE
0.7%
UNEMPLOYMENT RATE
Walker Valley Area Codes
Income in Walker Valley
Income Overview in Walker Valley
Per Capita Income in Walker Valley is $38,123, while median incomes of families and households are $90,984 and $91,004 respectively.
| Characteristic | Number | Measure |
| Per Capita Income | 1,440 | $38,123 |
| Median Family Income | 386 | $90,984 |
| Mean Family Income | 386 | $117,279 |
| Median Household Income | 483 | $91,004 |
| Mean Household Income | 483 | $114,263 |
| Income Deficit | 386 | $0 |
| Wage / Income Gap (%) | 1,440 | 0.00% |
| Wage / Income Gap ($) | 1,440 | 100.00¢ per $1 |
| Gini / Inequality Index | 1,440 | 0.31 |
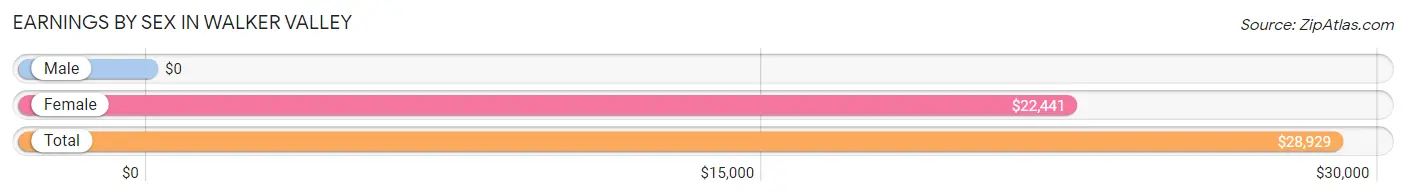
Earnings by Sex in Walker Valley
| Sex | Number | Average Earnings |
| Male | 406 (48.6%) | $0 |
| Female | 430 (51.4%) | $22,441 |
| Total | 836 (100.0%) | $28,929 |
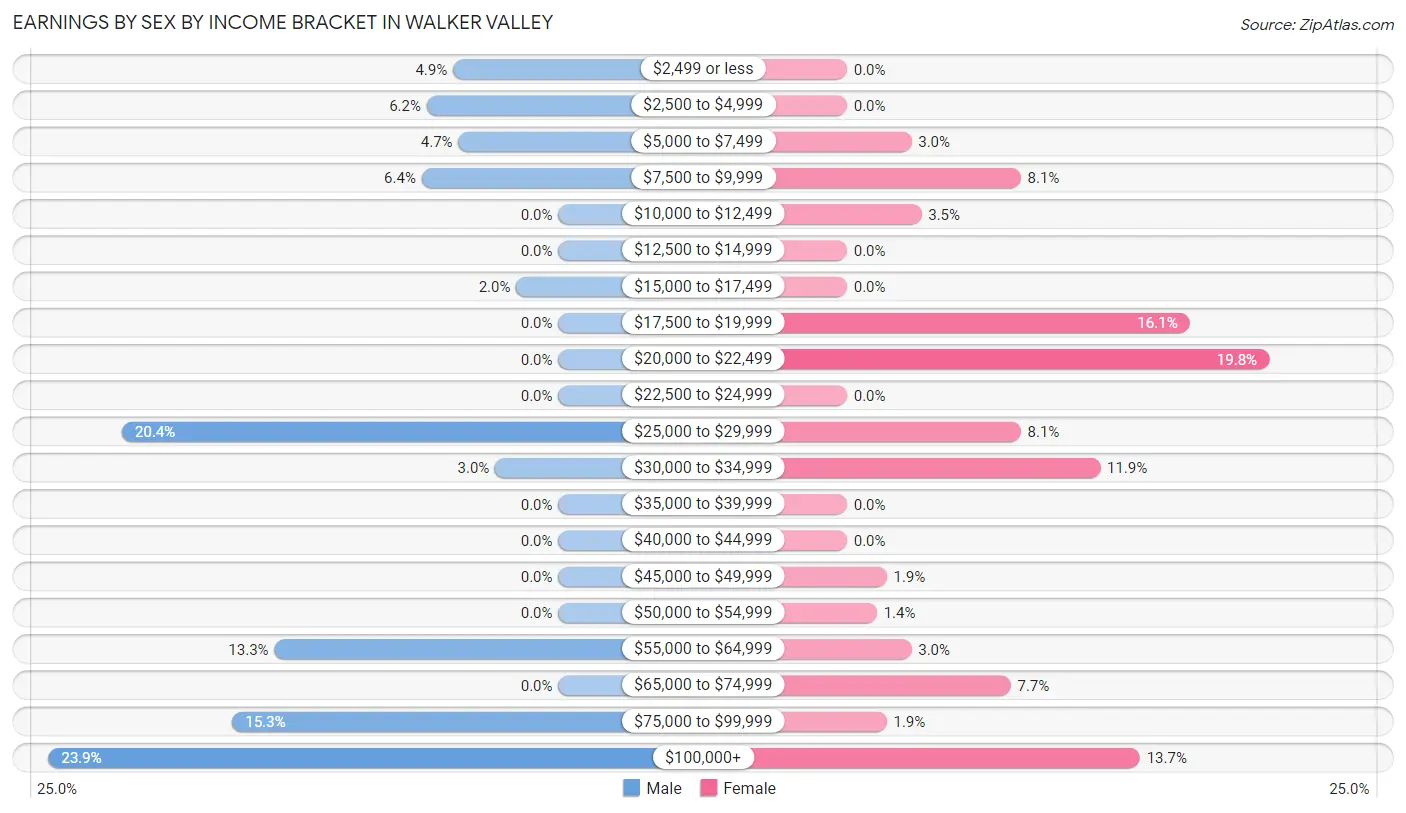
Earnings by Sex by Income Bracket in Walker Valley
The most common earnings brackets in Walker Valley are $100,000+ for men (97 | 23.9%) and $20,000 to $22,499 for women (85 | 19.8%).
| Income | Male | Female |
| $2,499 or less | 20 (4.9%) | 0 (0.0%) |
| $2,500 to $4,999 | 25 (6.2%) | 0 (0.0%) |
| $5,000 to $7,499 | 19 (4.7%) | 13 (3.0%) |
| $7,500 to $9,999 | 26 (6.4%) | 35 (8.1%) |
| $10,000 to $12,499 | 0 (0.0%) | 15 (3.5%) |
| $12,500 to $14,999 | 0 (0.0%) | 0 (0.0%) |
| $15,000 to $17,499 | 8 (2.0%) | 0 (0.0%) |
| $17,500 to $19,999 | 0 (0.0%) | 69 (16.1%) |
| $20,000 to $22,499 | 0 (0.0%) | 85 (19.8%) |
| $22,500 to $24,999 | 0 (0.0%) | 0 (0.0%) |
| $25,000 to $29,999 | 83 (20.4%) | 35 (8.1%) |
| $30,000 to $34,999 | 12 (3.0%) | 51 (11.9%) |
| $35,000 to $39,999 | 0 (0.0%) | 0 (0.0%) |
| $40,000 to $44,999 | 0 (0.0%) | 0 (0.0%) |
| $45,000 to $49,999 | 0 (0.0%) | 8 (1.9%) |
| $50,000 to $54,999 | 0 (0.0%) | 6 (1.4%) |
| $55,000 to $64,999 | 54 (13.3%) | 13 (3.0%) |
| $65,000 to $74,999 | 0 (0.0%) | 33 (7.7%) |
| $75,000 to $99,999 | 62 (15.3%) | 8 (1.9%) |
| $100,000+ | 97 (23.9%) | 59 (13.7%) |
| Total | 406 (100.0%) | 430 (100.0%) |
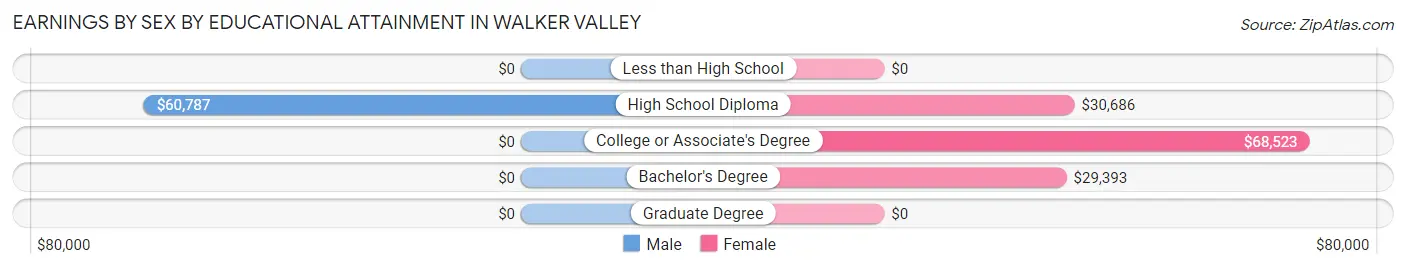
Earnings by Sex by Educational Attainment in Walker Valley
Average earnings in Walker Valley are $61,806 for men and $30,784 for women, a difference of 50.2%. Men with an educational attainment of high school diploma enjoy the highest average annual earnings of $60,787, while those with high school diploma education earn the least with $60,787. Women with an educational attainment of college or associate's degree earn the most with the average annual earnings of $68,523, while those with bachelor's degree education have the smallest earnings of $29,393.
| Educational Attainment | Male Income | Female Income |
| Less than High School | - | - |
| High School Diploma | $60,787 | $30,686 |
| College or Associate's Degree | - | - |
| Bachelor's Degree | - | - |
| Graduate Degree | - | - |
| Total | $61,806 | $30,784 |
Family Income in Walker Valley
Family Income Brackets in Walker Valley
According to the Walker Valley family income data, there are 112 families falling into the $50,000 to $74,999 income range, which is the most common income bracket and makes up 29.0% of all families.
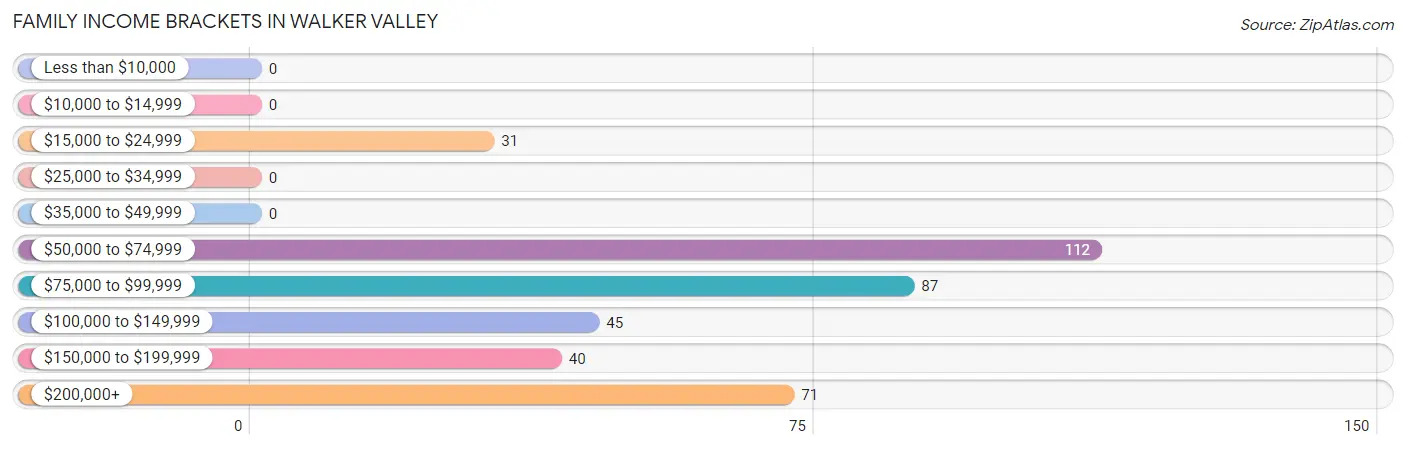
| Income Bracket | # Families | % Families |
| Less than $10,000 | 0 | 0.0% |
| $10,000 to $14,999 | 0 | 0.0% |
| $15,000 to $24,999 | 31 | 8.0% |
| $25,000 to $34,999 | 0 | 0.0% |
| $35,000 to $49,999 | 0 | 0.0% |
| $50,000 to $74,999 | 112 | 29.0% |
| $75,000 to $99,999 | 87 | 22.5% |
| $100,000 to $149,999 | 45 | 11.7% |
| $150,000 to $199,999 | 40 | 10.4% |
| $200,000+ | 71 | 18.4% |
Family Income by Famaliy Size in Walker Valley
6-person families (22 | 5.7%) account for the highest median family income in Walker Valley with $221,250 per family, while 4-person families (40 | 10.4%) have the highest median income of $39,062 per family member.
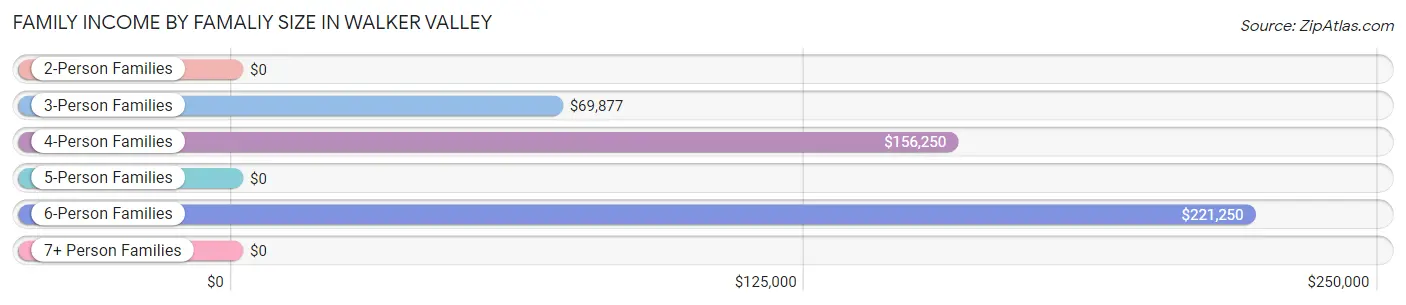
| Income Bracket | # Families | Median Income |
| 2-Person Families | 136 (35.2%) | $0 |
| 3-Person Families | 175 (45.3%) | $69,877 |
| 4-Person Families | 40 (10.4%) | $156,250 |
| 5-Person Families | 13 (3.4%) | $0 |
| 6-Person Families | 22 (5.7%) | $221,250 |
| 7+ Person Families | 0 (0.0%) | $0 |
| Total | 386 (100.0%) | $90,984 |
Family Income by Number of Earners in Walker Valley
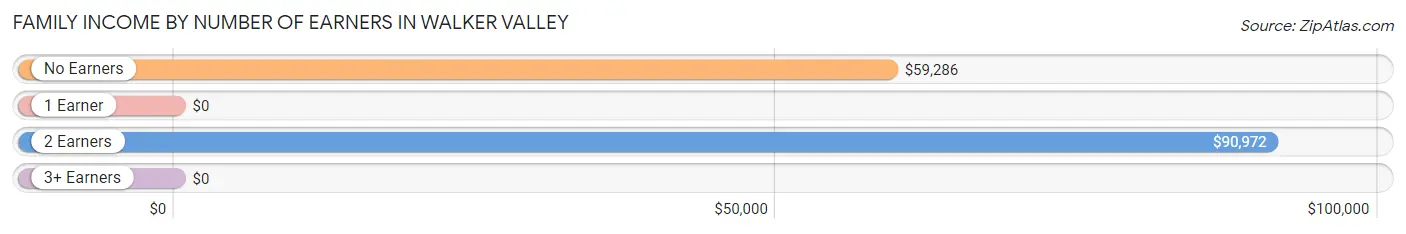
| Number of Earners | # Families | Median Income |
| No Earners | 64 (16.6%) | $59,286 |
| 1 Earner | 32 (8.3%) | $0 |
| 2 Earners | 252 (65.3%) | $90,972 |
| 3+ Earners | 38 (9.8%) | $0 |
| Total | 386 (100.0%) | $90,984 |
Household Income in Walker Valley
Household Income Brackets in Walker Valley
With 158 households falling in the category, the $75,000 to $99,999 income range is the most frequent in Walker Valley, accounting for 32.7% of all households.
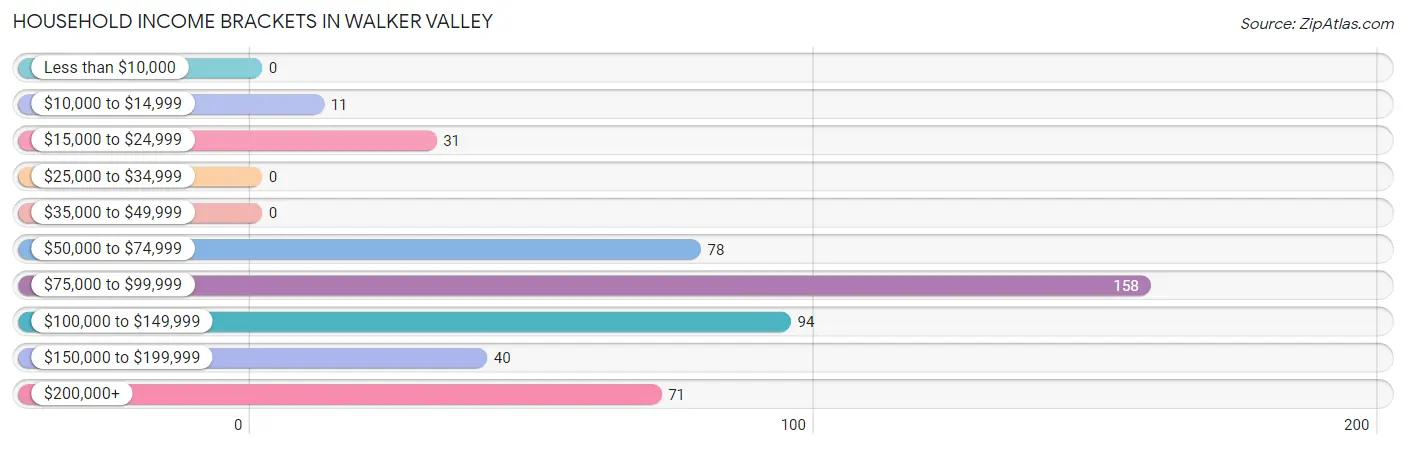
| Income Bracket | # Households | % Households |
| Less than $10,000 | 0 | 0.0% |
| $10,000 to $14,999 | 11 | 2.3% |
| $15,000 to $24,999 | 31 | 6.4% |
| $25,000 to $34,999 | 0 | 0.0% |
| $35,000 to $49,999 | 0 | 0.0% |
| $50,000 to $74,999 | 78 | 16.1% |
| $75,000 to $99,999 | 158 | 32.7% |
| $100,000 to $149,999 | 94 | 19.5% |
| $150,000 to $199,999 | 40 | 8.3% |
| $200,000+ | 71 | 14.7% |
Household Income by Householder Age in Walker Valley
The median household income in Walker Valley is $91,004, with the highest median household income of $114,883 found in the 45 to 64 years age bracket for the primary householder. A total of 249 households (51.5%) fall into this category.
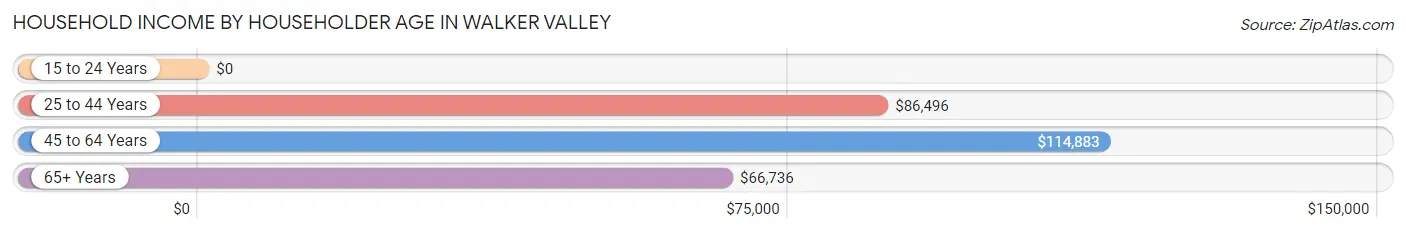
| Income Bracket | # Households | Median Income |
| 15 to 24 Years | 0 (0.0%) | $0 |
| 25 to 44 Years | 111 (23.0%) | $86,496 |
| 45 to 64 Years | 249 (51.5%) | $114,883 |
| 65+ Years | 123 (25.5%) | $66,736 |
| Total | 483 (100.0%) | $91,004 |
Poverty in Walker Valley
Income Below Poverty by Sex and Age in Walker Valley
With 3.2% poverty level for males and 4.2% for females among the residents of Walker Valley, 35 to 44 year old males and 65 to 74 year old females are the most vulnerable to poverty, with 6 males (42.9%) and 11 females (31.4%) in their respective age groups living below the poverty level.
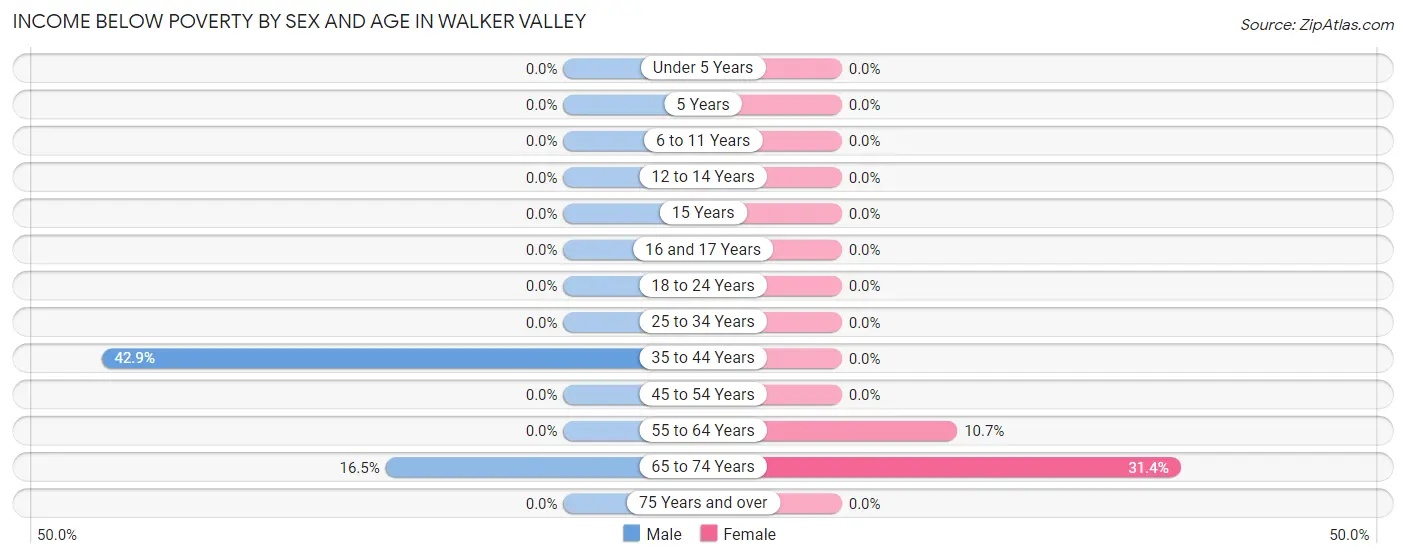
| Age Bracket | Male | Female |
| Under 5 Years | 0 (0.0%) | 0 (0.0%) |
| 5 Years | 0 (0.0%) | 0 (0.0%) |
| 6 to 11 Years | 0 (0.0%) | 0 (0.0%) |
| 12 to 14 Years | 0 (0.0%) | 0 (0.0%) |
| 15 Years | 0 (0.0%) | 0 (0.0%) |
| 16 and 17 Years | 0 (0.0%) | 0 (0.0%) |
| 18 to 24 Years | 0 (0.0%) | 0 (0.0%) |
| 25 to 34 Years | 0 (0.0%) | 0 (0.0%) |
| 35 to 44 Years | 6 (42.9%) | 0 (0.0%) |
| 45 to 54 Years | 0 (0.0%) | 0 (0.0%) |
| 55 to 64 Years | 0 (0.0%) | 18 (10.7%) |
| 65 to 74 Years | 17 (16.5%) | 11 (31.4%) |
| 75 Years and over | 0 (0.0%) | 0 (0.0%) |
| Total | 23 (3.2%) | 29 (4.2%) |
Income Above Poverty by Sex and Age in Walker Valley
According to the poverty statistics in Walker Valley, males aged under 5 years and females aged under 5 years are the age groups that are most secure financially, with 100.0% of males and 100.0% of females in these age groups living above the poverty line.
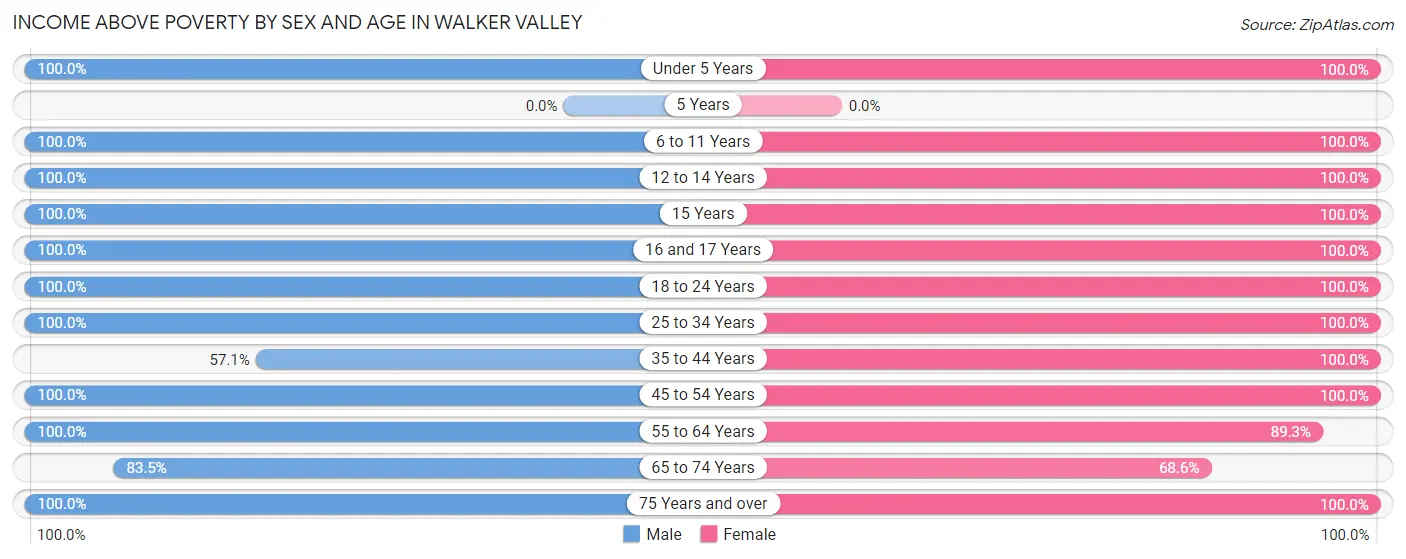
| Age Bracket | Male | Female |
| Under 5 Years | 7 (100.0%) | 6 (100.0%) |
| 5 Years | 0 (0.0%) | 0 (0.0%) |
| 6 to 11 Years | 84 (100.0%) | 18 (100.0%) |
| 12 to 14 Years | 14 (100.0%) | 21 (100.0%) |
| 15 Years | 69 (100.0%) | 22 (100.0%) |
| 16 and 17 Years | 20 (100.0%) | 36 (100.0%) |
| 18 to 24 Years | 45 (100.0%) | 100 (100.0%) |
| 25 to 34 Years | 119 (100.0%) | 121 (100.0%) |
| 35 to 44 Years | 8 (57.1%) | 50 (100.0%) |
| 45 to 54 Years | 87 (100.0%) | 99 (100.0%) |
| 55 to 64 Years | 141 (100.0%) | 150 (89.3%) |
| 65 to 74 Years | 86 (83.5%) | 24 (68.6%) |
| 75 Years and over | 19 (100.0%) | 21 (100.0%) |
| Total | 699 (96.8%) | 668 (95.8%) |
Income Below Poverty Among Married-Couple Families in Walker Valley
The poverty statistics for married-couple families in Walker Valley show that 4.5% or 17 of the total 379 families live below the poverty line. Families with no children have the highest poverty rate of 8.8%, comprising of 17 families. On the other hand, families with 1 or 2 children have the lowest poverty rate of 0.0%, which includes 0 families.
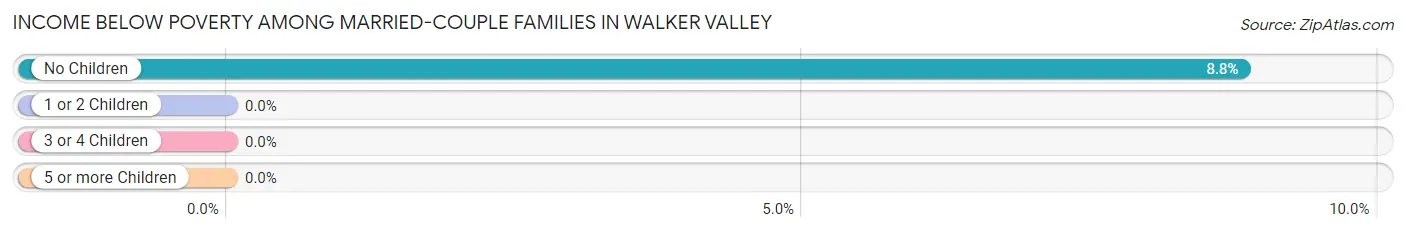
| Children | Above Poverty | Below Poverty |
| No Children | 176 (91.2%) | 17 (8.8%) |
| 1 or 2 Children | 186 (100.0%) | 0 (0.0%) |
| 3 or 4 Children | 0 (0.0%) | 0 (0.0%) |
| 5 or more Children | 0 (0.0%) | 0 (0.0%) |
| Total | 362 (95.5%) | 17 (4.5%) |
Income Below Poverty Among Single-Parent Households in Walker Valley
| Children | Single Father | Single Mother |
| No Children | 0 (0.0%) | 0 (0.0%) |
| 1 or 2 Children | 0 (0.0%) | 0 (0.0%) |
| 3 or 4 Children | 0 (0.0%) | 0 (0.0%) |
| 5 or more Children | 0 (0.0%) | 0 (0.0%) |
| Total | 0 (0.0%) | 0 (0.0%) |
Income Below Poverty Among Married-Couple vs Single-Parent Households in Walker Valley
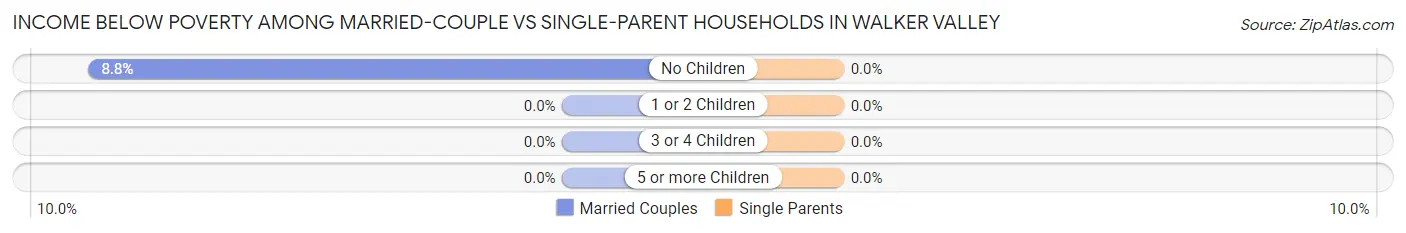
| Children | Married-Couple Families | Single-Parent Households |
| No Children | 17 (8.8%) | 0 (0.0%) |
| 1 or 2 Children | 0 (0.0%) | 0 (0.0%) |
| 3 or 4 Children | 0 (0.0%) | 0 (0.0%) |
| 5 or more Children | 0 (0.0%) | 0 (0.0%) |
| Total | 17 (4.5%) | 0 (0.0%) |
Race in Walker Valley
The most populous races in Walker Valley are White / Caucasian (1,305 | 90.6%), Hispanic or Latino (80 | 5.6%), and Some other Race (67 | 4.6%).
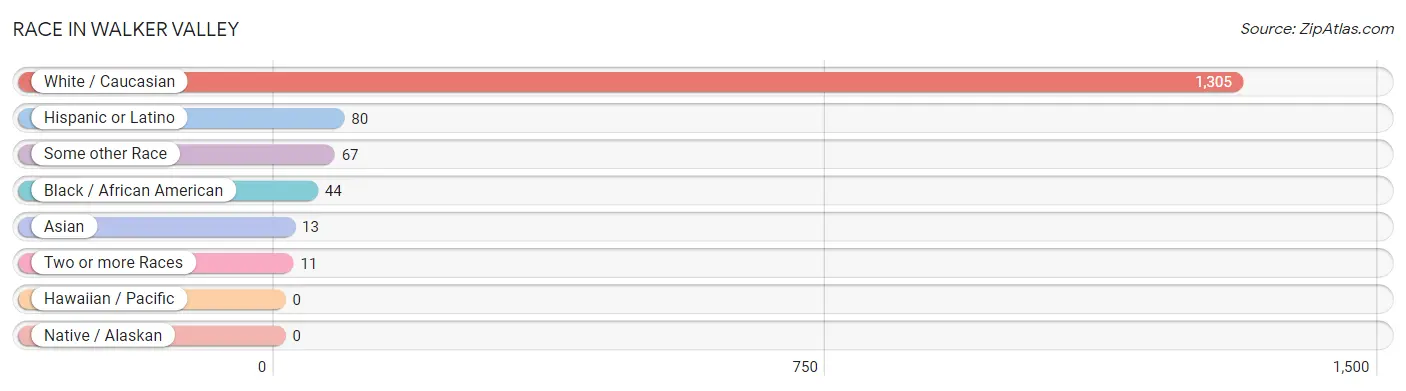
| Race | # Population | % Population |
| Asian | 13 | 0.9% |
| Black / African American | 44 | 3.1% |
| Hawaiian / Pacific | 0 | 0.0% |
| Hispanic or Latino | 80 | 5.6% |
| Native / Alaskan | 0 | 0.0% |
| White / Caucasian | 1,305 | 90.6% |
| Two or more Races | 11 | 0.8% |
| Some other Race | 67 | 4.6% |
| Total | 1,440 | 100.0% |
Ancestry in Walker Valley
The most populous ancestries reported in Walker Valley are English (258 | 17.9%), Italian (184 | 12.8%), Irish (161 | 11.2%), German (151 | 10.5%), and Scotch-Irish (91 | 6.3%), together accounting for 58.7% of all Walker Valley residents.
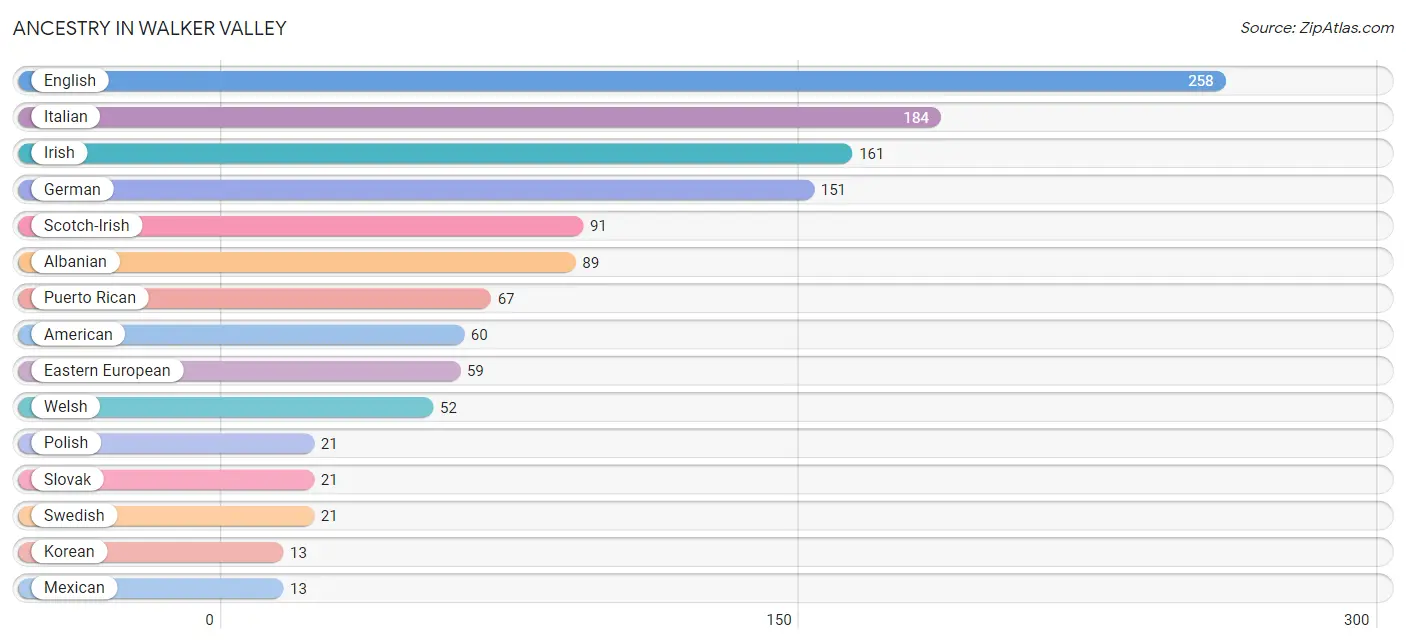
| Ancestry | # Population | % Population |
| Albanian | 89 | 6.2% |
| American | 60 | 4.2% |
| Danish | 6 | 0.4% |
| Eastern European | 59 | 4.1% |
| English | 258 | 17.9% |
| French Canadian | 12 | 0.8% |
| German | 151 | 10.5% |
| Greek | 12 | 0.8% |
| Irish | 161 | 11.2% |
| Italian | 184 | 12.8% |
| Korean | 13 | 0.9% |
| Mexican | 13 | 0.9% |
| Polish | 21 | 1.5% |
| Puerto Rican | 67 | 4.6% |
| Scotch-Irish | 91 | 6.3% |
| Slovak | 21 | 1.5% |
| Swedish | 21 | 1.5% |
| Welsh | 52 | 3.6% | View All 18 Rows |
Immigrants in Walker Valley
The most numerous immigrant groups reported in Walker Valley came from Eastern Europe (89 | 6.2%), Europe (89 | 6.2%), Central America (12 | 0.8%), Honduras (12 | 0.8%), and Latin America (12 | 0.8%), together accounting for 14.8% of all Walker Valley residents.
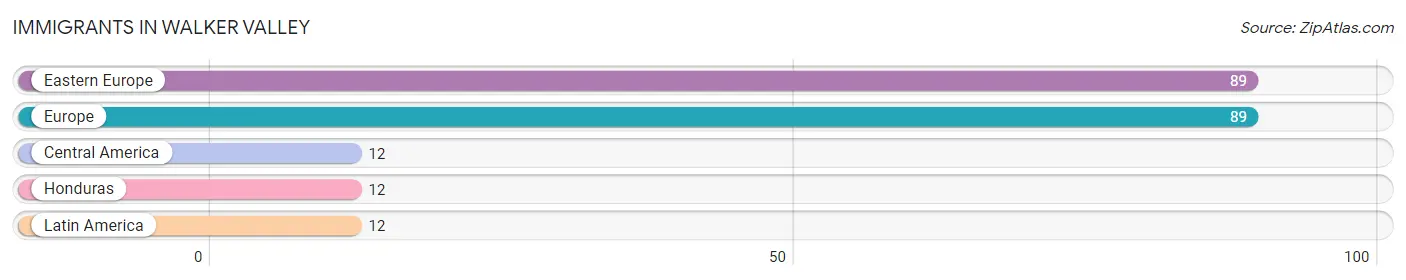
| Immigration Origin | # Population | % Population |
| Central America | 12 | 0.8% |
| Eastern Europe | 89 | 6.2% |
| Europe | 89 | 6.2% |
| Honduras | 12 | 0.8% |
| Latin America | 12 | 0.8% | View All 5 Rows |
Sex and Age in Walker Valley
Sex and Age in Walker Valley
The most populous age groups in Walker Valley are 15 to 19 Years (103 | 14.3%) for men and 60 to 64 Years (128 | 17.8%) for women.
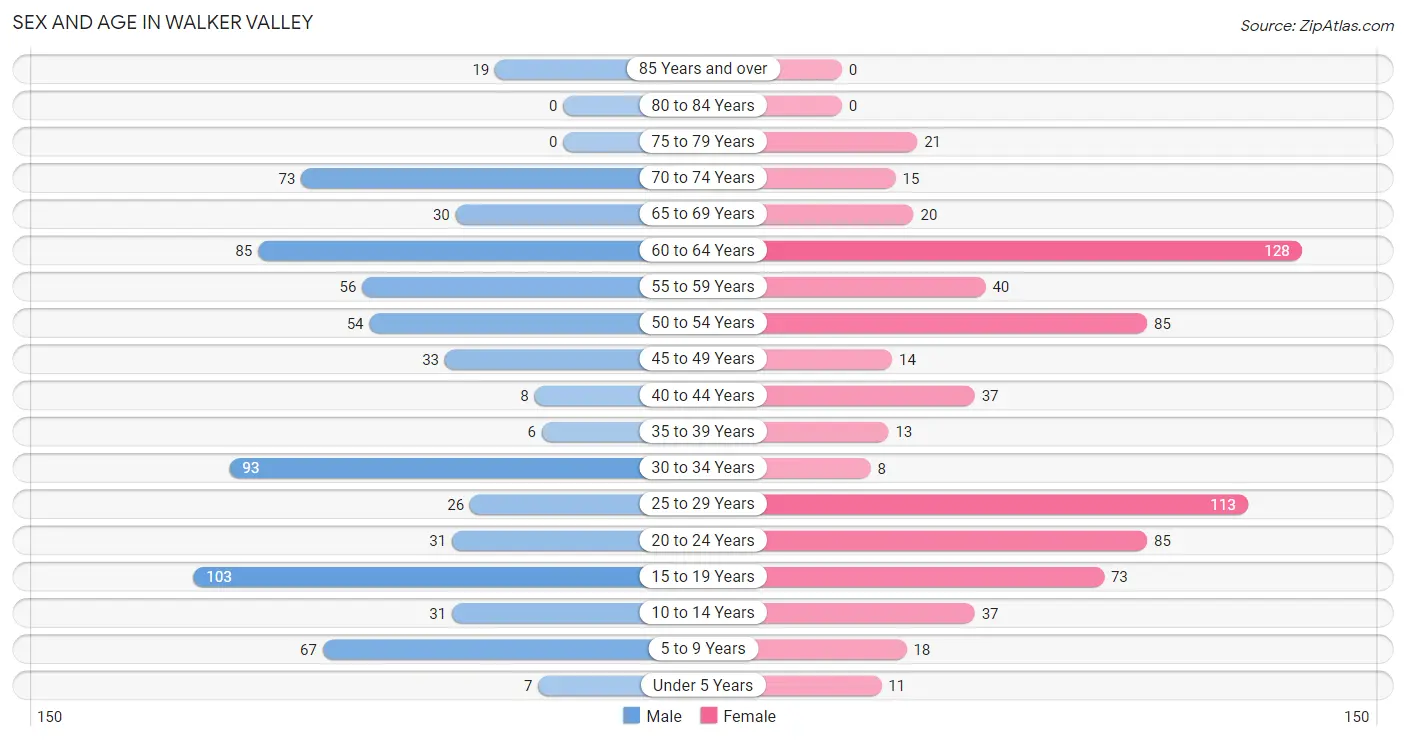
| Age Bracket | Male | Female |
| Under 5 Years | 7 (1.0%) | 11 (1.5%) |
| 5 to 9 Years | 67 (9.3%) | 18 (2.5%) |
| 10 to 14 Years | 31 (4.3%) | 37 (5.1%) |
| 15 to 19 Years | 103 (14.3%) | 73 (10.2%) |
| 20 to 24 Years | 31 (4.3%) | 85 (11.8%) |
| 25 to 29 Years | 26 (3.6%) | 113 (15.7%) |
| 30 to 34 Years | 93 (12.9%) | 8 (1.1%) |
| 35 to 39 Years | 6 (0.8%) | 13 (1.8%) |
| 40 to 44 Years | 8 (1.1%) | 37 (5.1%) |
| 45 to 49 Years | 33 (4.6%) | 14 (1.9%) |
| 50 to 54 Years | 54 (7.5%) | 85 (11.8%) |
| 55 to 59 Years | 56 (7.8%) | 40 (5.6%) |
| 60 to 64 Years | 85 (11.8%) | 128 (17.8%) |
| 65 to 69 Years | 30 (4.2%) | 20 (2.8%) |
| 70 to 74 Years | 73 (10.1%) | 15 (2.1%) |
| 75 to 79 Years | 0 (0.0%) | 21 (2.9%) |
| 80 to 84 Years | 0 (0.0%) | 0 (0.0%) |
| 85 Years and over | 19 (2.6%) | 0 (0.0%) |
| Total | 722 (100.0%) | 718 (100.0%) |
Families and Households in Walker Valley
Median Family Size in Walker Valley
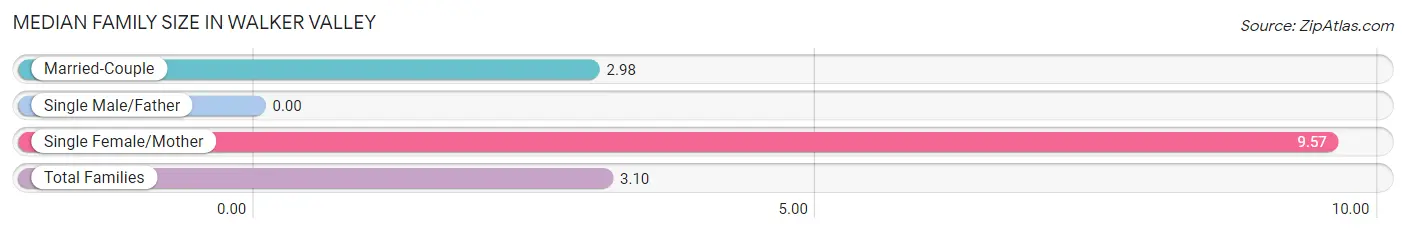
| Family Type | # Families | Family Size |
| Married-Couple | 379 (98.2%) | 2.98 |
| Single Male/Father | 0 (0.0%) | - |
| Single Female/Mother | 7 (1.8%) | 9.57 |
| Total Families | 386 (100.0%) | 3.10 |
Median Household Size in Walker Valley
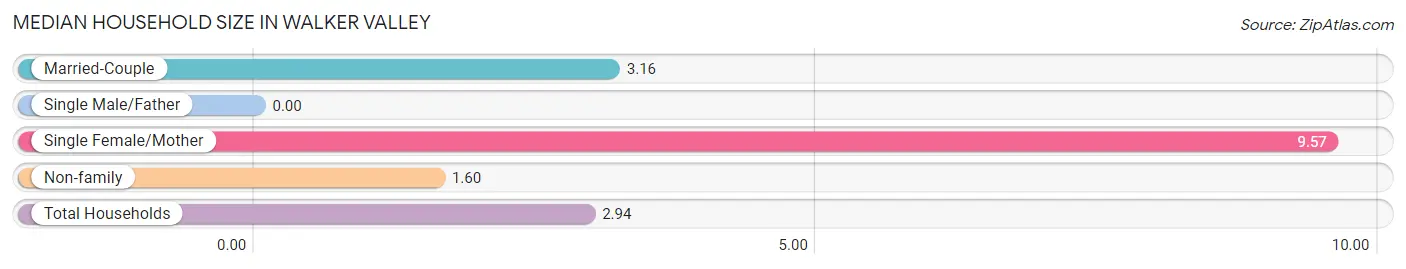
| Household Type | # Households | Household Size |
| Married-Couple | 379 (78.5%) | 3.16 |
| Single Male/Father | 0 (0.0%) | - |
| Single Female/Mother | 7 (1.5%) | 9.57 |
| Non-family | 97 (20.1%) | 1.60 |
| Total Households | 483 (100.0%) | 2.94 |
Household Size by Marriage Status in Walker Valley
Out of a total of 483 households in Walker Valley, 386 (79.9%) are family households, while 97 (20.1%) are nonfamily households. The most numerous type of family households are 2-person households, comprising 136, and the most common type of nonfamily households are 2-person households, comprising 55.
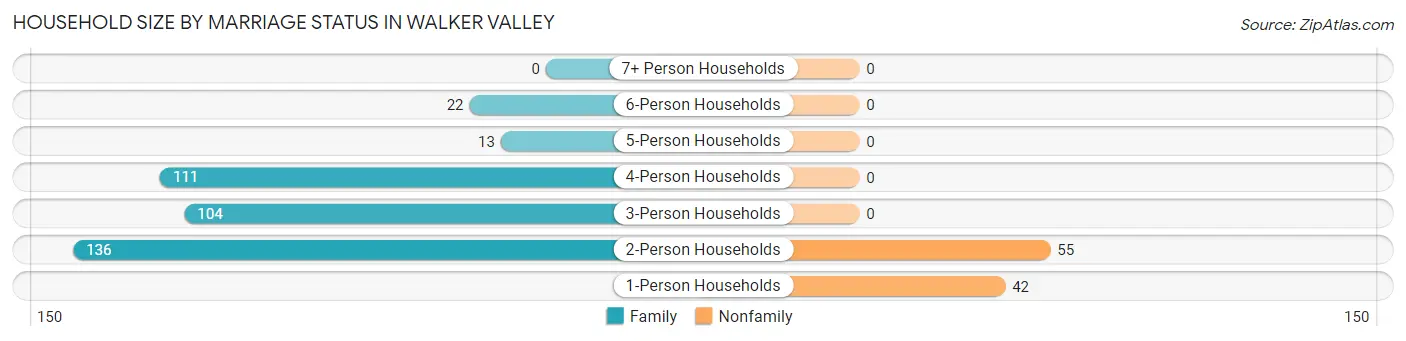
| Household Size | Family Households | Nonfamily Households |
| 1-Person Households | - | 42 (8.7%) |
| 2-Person Households | 136 (28.2%) | 55 (11.4%) |
| 3-Person Households | 104 (21.5%) | 0 (0.0%) |
| 4-Person Households | 111 (23.0%) | 0 (0.0%) |
| 5-Person Households | 13 (2.7%) | 0 (0.0%) |
| 6-Person Households | 22 (4.5%) | 0 (0.0%) |
| 7+ Person Households | 0 (0.0%) | 0 (0.0%) |
| Total | 386 (79.9%) | 97 (20.1%) |
Female Fertility in Walker Valley
Fertility by Age in Walker Valley
Average fertility rate in Walker Valley is 23.0 births per 1,000 women. Women in the age bracket of 20 to 34 years have the highest fertility rate with 39.0 births per 1,000 women. Women in the age bracket of 20 to 34 years acount for 100.0% of all women with births.

| Age Bracket | Women with Births | Births / 1,000 Women |
| 15 to 19 years | 0 (0.0%) | 0.0 |
| 20 to 34 years | 8 (100.0%) | 39.0 |
| 35 to 50 years | 0 (0.0%) | 0.0 |
| Total | 8 (100.0%) | 23.0 |
Fertility by Age by Marriage Status in Walker Valley
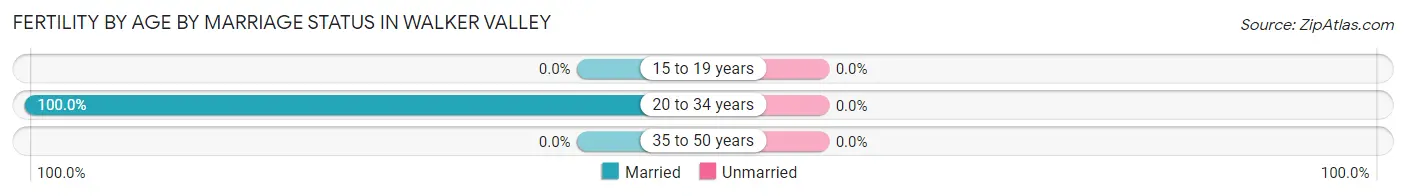
| Age Bracket | Married | Unmarried |
| 15 to 19 years | 0 (0.0%) | 0 (0.0%) |
| 20 to 34 years | 8 (100.0%) | 0 (0.0%) |
| 35 to 50 years | 0 (0.0%) | 0 (0.0%) |
| Total | 8 (100.0%) | 0 (0.0%) |
Fertility by Education in Walker Valley
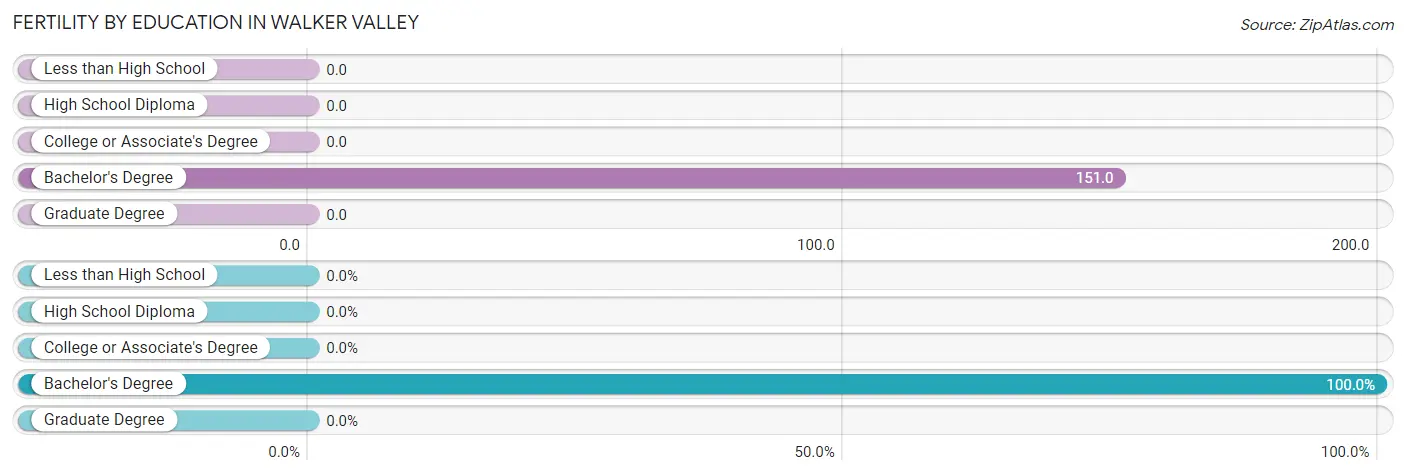
| Educational Attainment | Women with Births | Births / 1,000 Women |
| Less than High School | 0 (0.0%) | 0.0 |
| High School Diploma | 0 (0.0%) | 0.0 |
| College or Associate's Degree | 0 (0.0%) | 0.0 |
| Bachelor's Degree | 8 (100.0%) | 151.0 |
| Graduate Degree | 0 (0.0%) | 0.0 |
| Total | 8 (100.0%) | 23.0 |
Fertility by Education by Marriage Status in Walker Valley
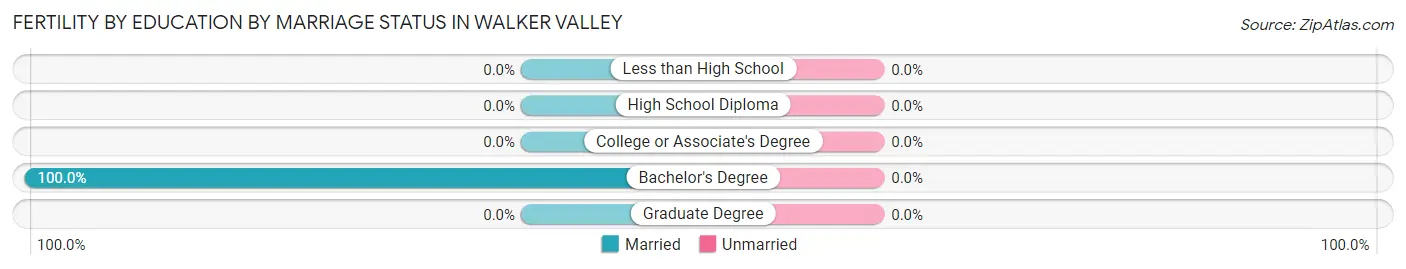
| Educational Attainment | Married | Unmarried |
| Less than High School | 0 (0.0%) | 0 (0.0%) |
| High School Diploma | 0 (0.0%) | 0 (0.0%) |
| College or Associate's Degree | 0 (0.0%) | 0 (0.0%) |
| Bachelor's Degree | 8 (100.0%) | 0 (0.0%) |
| Graduate Degree | 0 (0.0%) | 0 (0.0%) |
| Total | 8 (100.0%) | 0 (0.0%) |
Employment Characteristics in Walker Valley
Employment by Class of Employer in Walker Valley
Among the 822 employed individuals in Walker Valley, private company employees (636 | 77.4%), local government employees (86 | 10.5%), and federal government employees (52 | 6.3%) make up the most common classes of employment.
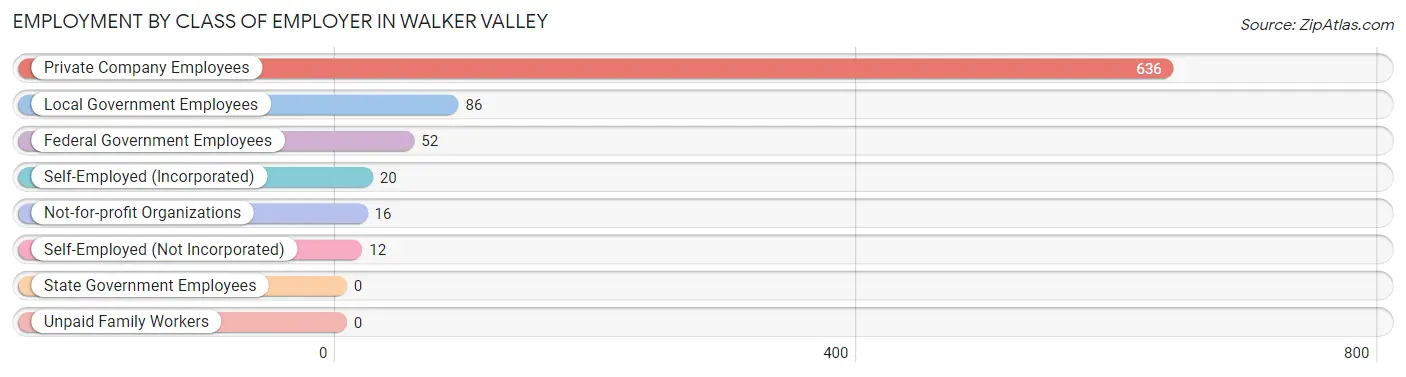
| Employer Class | # Employees | % Employees |
| Private Company Employees | 636 | 77.4% |
| Self-Employed (Incorporated) | 20 | 2.4% |
| Self-Employed (Not Incorporated) | 12 | 1.5% |
| Not-for-profit Organizations | 16 | 1.9% |
| Local Government Employees | 86 | 10.5% |
| State Government Employees | 0 | 0.0% |
| Federal Government Employees | 52 | 6.3% |
| Unpaid Family Workers | 0 | 0.0% |
| Total | 822 | 100.0% |
Employment Status by Age in Walker Valley
According to the labor force statistics for Walker Valley, out of the total population over 16 years of age (1,178), 70.3% or 828 individuals are in the labor force, with 0.7% or 6 of them unemployed. The age group with the highest labor force participation rate is 30 to 34 years, with 100.0% or 101 individuals in the labor force. Within the labor force, the 35 to 44 years age range has the highest percentage of unemployed individuals, with 13.6% or 6 of them being unemployed.
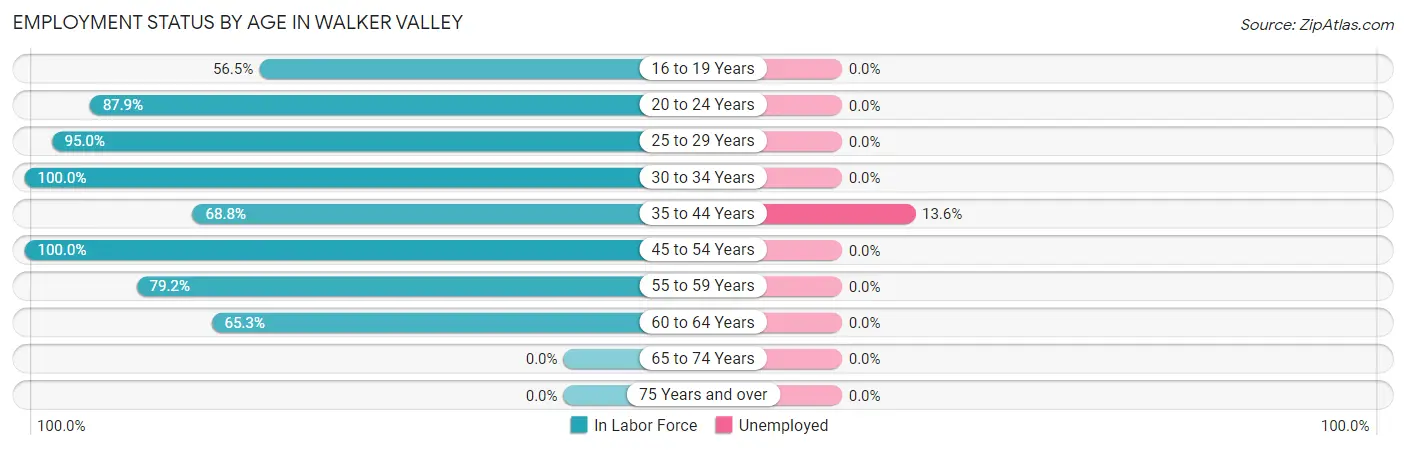
| Age Bracket | In Labor Force | Unemployed |
| 16 to 19 Years | 48 (56.5%) | 0 (0.0%) |
| 20 to 24 Years | 102 (87.9%) | 0 (0.0%) |
| 25 to 29 Years | 132 (95.0%) | 0 (0.0%) |
| 30 to 34 Years | 101 (100.0%) | 0 (0.0%) |
| 35 to 44 Years | 44 (68.8%) | 6 (13.6%) |
| 45 to 54 Years | 186 (100.0%) | 0 (0.0%) |
| 55 to 59 Years | 76 (79.2%) | 0 (0.0%) |
| 60 to 64 Years | 139 (65.3%) | 0 (0.0%) |
| 65 to 74 Years | 0 (0.0%) | 0 (0.0%) |
| 75 Years and over | 0 (0.0%) | 0 (0.0%) |
| Total | 828 (70.3%) | 6 (0.7%) |
Employment Status by Educational Attainment in Walker Valley
According to labor force statistics for Walker Valley, 84.9% of individuals (678) out of the total population between 25 and 64 years of age (799) are in the labor force, with 0.9% or 6 of them being unemployed. The group with the highest labor force participation rate are those with the educational attainment of less than high school, with 100.0% or 18 individuals in the labor force. Within the labor force, individuals with less than high school education have the highest percentage of unemployment, with 33.3% or 6 of them being unemployed.
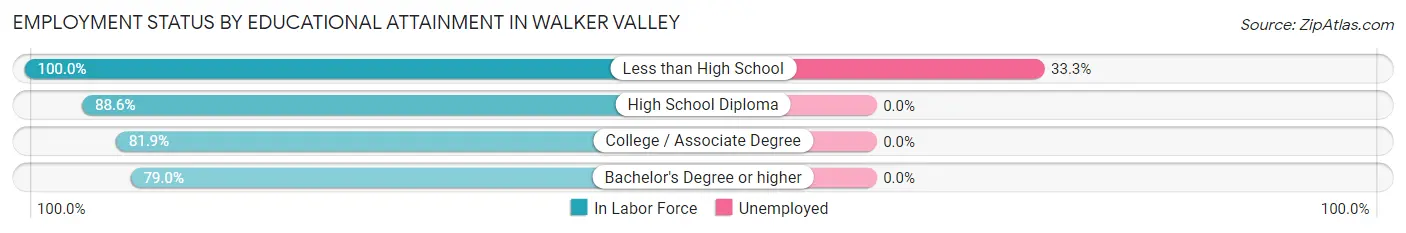
| Educational Attainment | In Labor Force | Unemployed |
| Less than High School | 18 (100.0%) | 6 (33.3%) |
| High School Diploma | 312 (88.6%) | 0 (0.0%) |
| College / Associate Degree | 254 (81.9%) | 0 (0.0%) |
| Bachelor's Degree or higher | 94 (79.0%) | 0 (0.0%) |
| Total | 678 (84.9%) | 7 (0.9%) |
Employment Occupations by Sex in Walker Valley
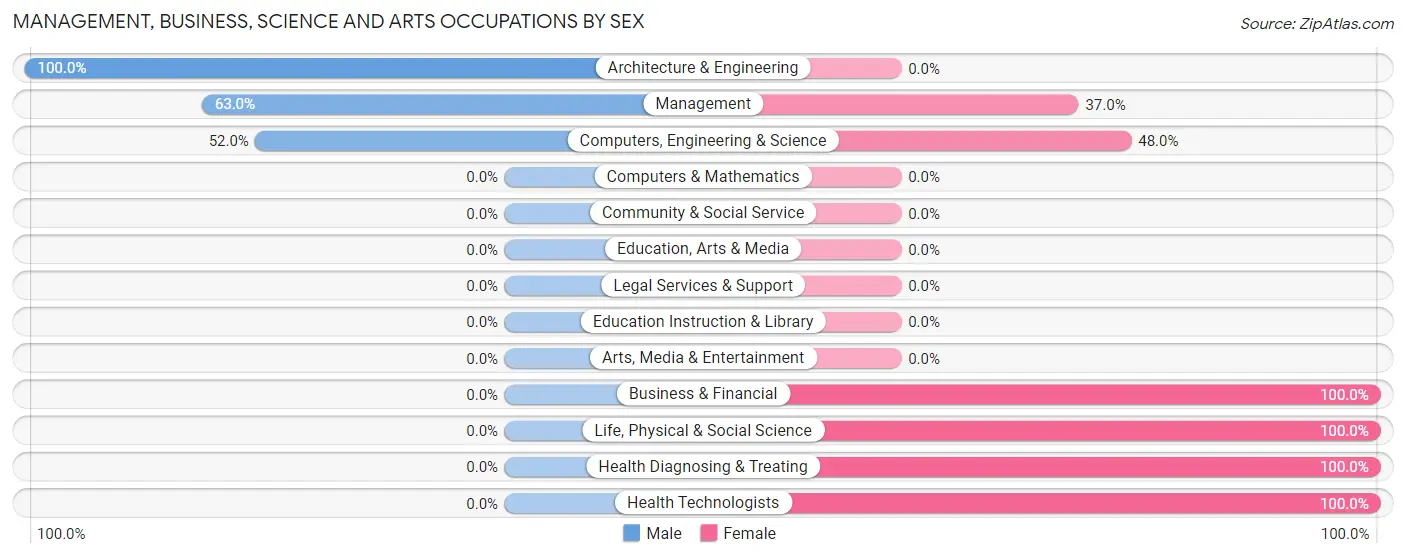
Management, Business, Science and Arts Occupations
The most common Management, Business, Science and Arts occupations in Walker Valley are Health Diagnosing & Treating (77 | 9.4%), Management (73 | 8.9%), Computers, Engineering & Science (25 | 3.0%), Health Technologists (16 | 1.9%), and Architecture & Engineering (13 | 1.6%).
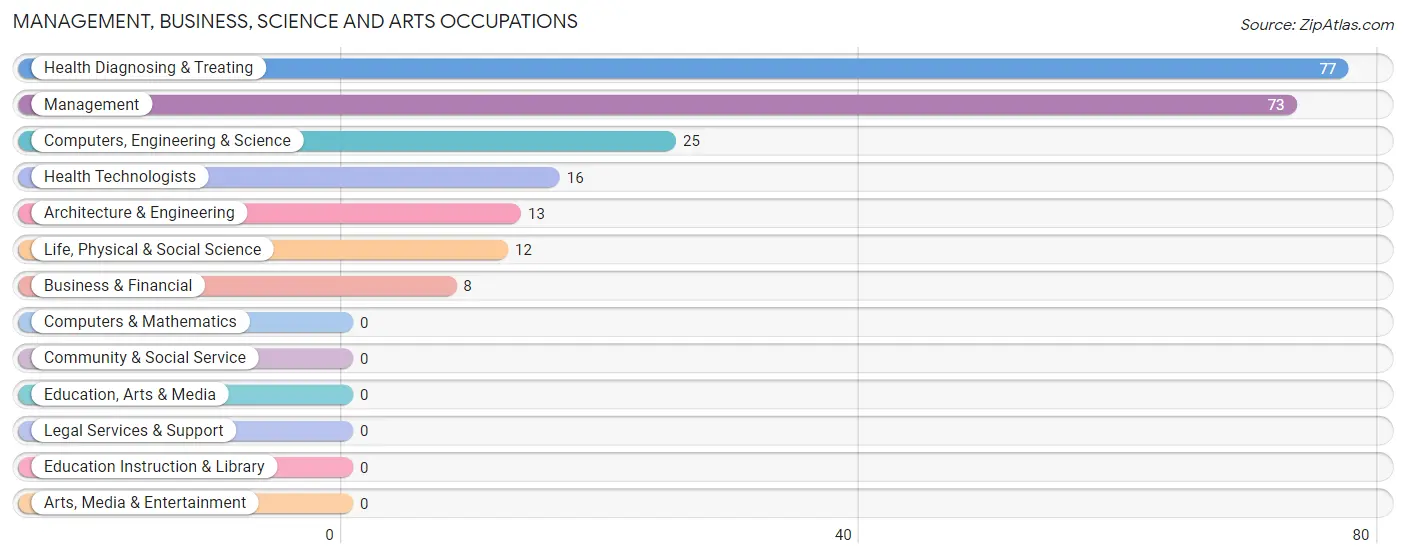
Management, Business, Science and Arts Occupations by Sex
Within the Management, Business, Science and Arts occupations in Walker Valley, the most male-oriented occupations are Architecture & Engineering (100.0%), Management (63.0%), and Computers, Engineering & Science (52.0%), while the most female-oriented occupations are Business & Financial (100.0%), Life, Physical & Social Science (100.0%), and Health Diagnosing & Treating (100.0%).
| Occupation | Male | Female |
| Management | 46 (63.0%) | 27 (37.0%) |
| Business & Financial | 0 (0.0%) | 8 (100.0%) |
| Computers, Engineering & Science | 13 (52.0%) | 12 (48.0%) |
| Computers & Mathematics | 0 (0.0%) | 0 (0.0%) |
| Architecture & Engineering | 13 (100.0%) | 0 (0.0%) |
| Life, Physical & Social Science | 0 (0.0%) | 12 (100.0%) |
| Community & Social Service | 0 (0.0%) | 0 (0.0%) |
| Education, Arts & Media | 0 (0.0%) | 0 (0.0%) |
| Legal Services & Support | 0 (0.0%) | 0 (0.0%) |
| Education Instruction & Library | 0 (0.0%) | 0 (0.0%) |
| Arts, Media & Entertainment | 0 (0.0%) | 0 (0.0%) |
| Health Diagnosing & Treating | 0 (0.0%) | 77 (100.0%) |
| Health Technologists | 0 (0.0%) | 16 (100.0%) |
| Total (Category) | 59 (32.2%) | 124 (67.8%) |
| Total (Overall) | 392 (47.7%) | 430 (52.3%) |
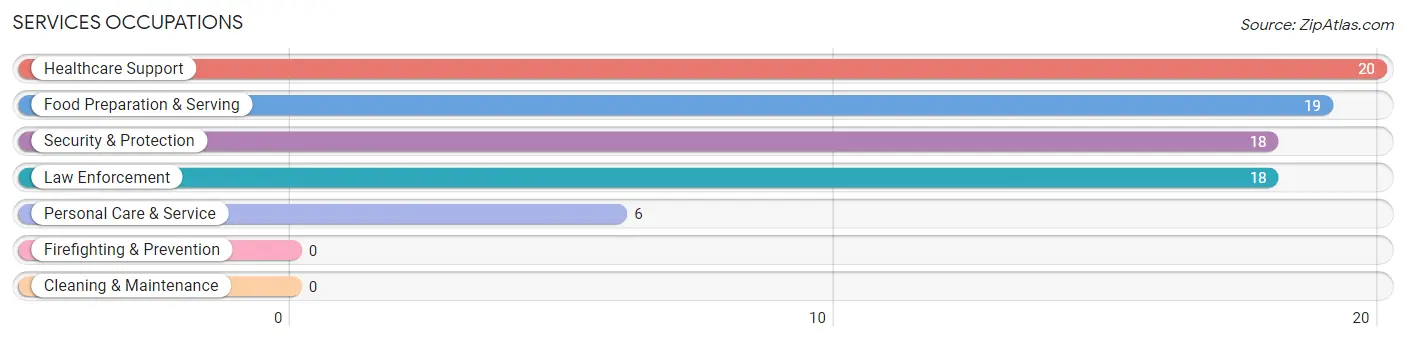
Services Occupations
The most common Services occupations in Walker Valley are Healthcare Support (20 | 2.4%), Food Preparation & Serving (19 | 2.3%), Security & Protection (18 | 2.2%), Law Enforcement (18 | 2.2%), and Personal Care & Service (6 | 0.7%).
Services Occupations by Sex
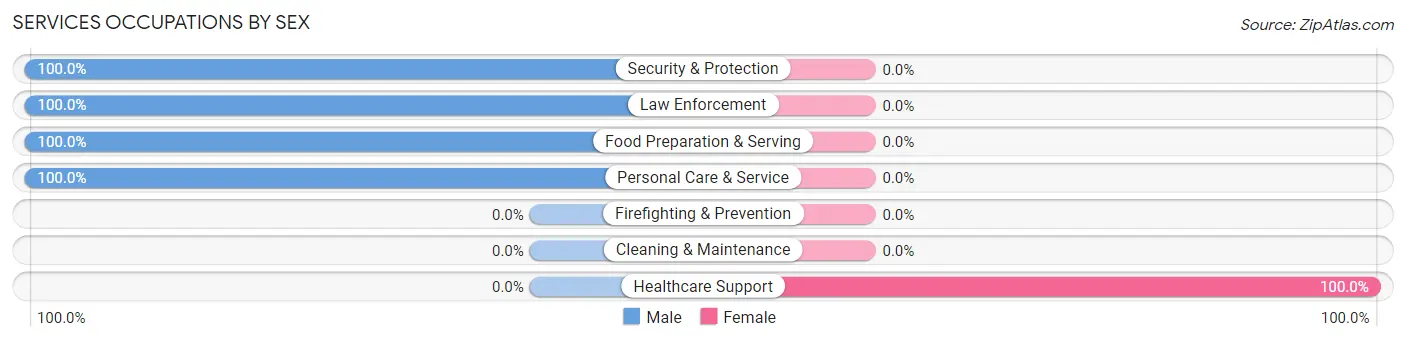
| Occupation | Male | Female |
| Healthcare Support | 0 (0.0%) | 20 (100.0%) |
| Security & Protection | 18 (100.0%) | 0 (0.0%) |
| Firefighting & Prevention | 0 (0.0%) | 0 (0.0%) |
| Law Enforcement | 18 (100.0%) | 0 (0.0%) |
| Food Preparation & Serving | 19 (100.0%) | 0 (0.0%) |
| Cleaning & Maintenance | 0 (0.0%) | 0 (0.0%) |
| Personal Care & Service | 6 (100.0%) | 0 (0.0%) |
| Total (Category) | 43 (68.2%) | 20 (31.8%) |
| Total (Overall) | 392 (47.7%) | 430 (52.3%) |
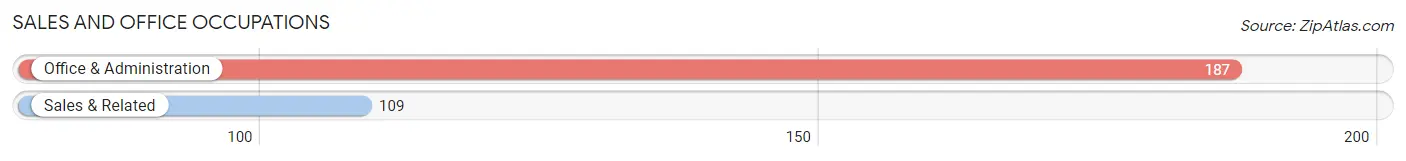
Sales and Office Occupations
The most common Sales and Office occupations in Walker Valley are Office & Administration (187 | 22.8%), and Sales & Related (109 | 13.3%).
Sales and Office Occupations by Sex
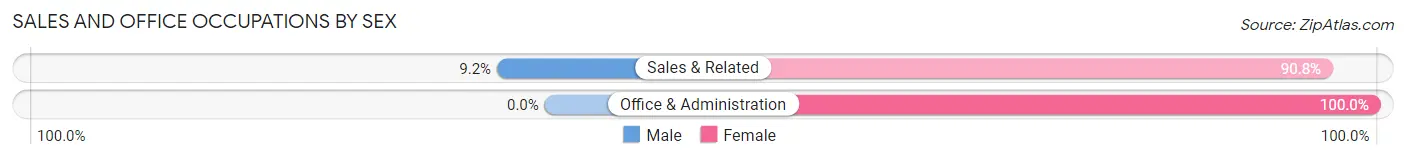
| Occupation | Male | Female |
| Sales & Related | 10 (9.2%) | 99 (90.8%) |
| Office & Administration | 0 (0.0%) | 187 (100.0%) |
| Total (Category) | 10 (3.4%) | 286 (96.6%) |
| Total (Overall) | 392 (47.7%) | 430 (52.3%) |
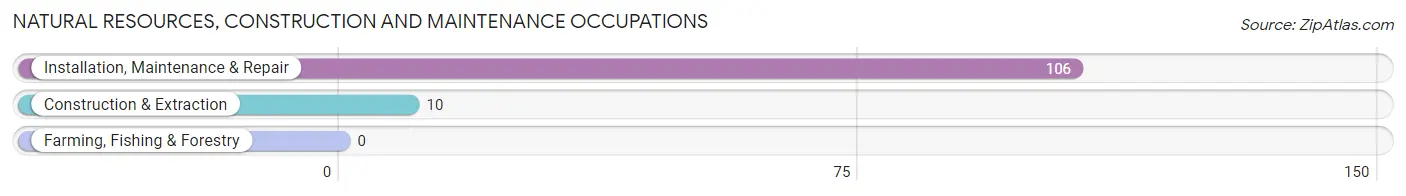
Natural Resources, Construction and Maintenance Occupations
The most common Natural Resources, Construction and Maintenance occupations in Walker Valley are Installation, Maintenance & Repair (106 | 12.9%), and Construction & Extraction (10 | 1.2%).
Natural Resources, Construction and Maintenance Occupations by Sex
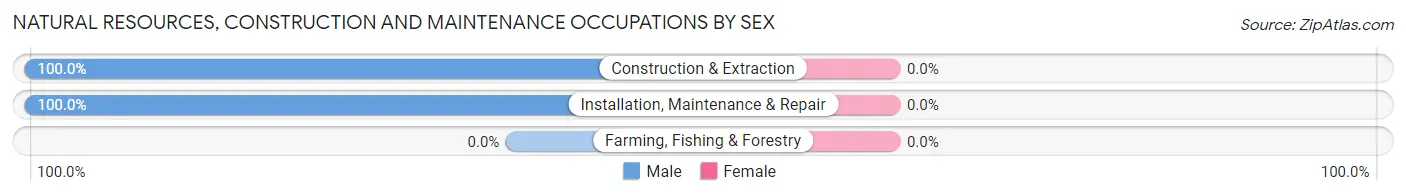
| Occupation | Male | Female |
| Farming, Fishing & Forestry | 0 (0.0%) | 0 (0.0%) |
| Construction & Extraction | 10 (100.0%) | 0 (0.0%) |
| Installation, Maintenance & Repair | 106 (100.0%) | 0 (0.0%) |
| Total (Category) | 116 (100.0%) | 0 (0.0%) |
| Total (Overall) | 392 (47.7%) | 430 (52.3%) |
Production, Transportation and Moving Occupations
The most common Production, Transportation and Moving occupations in Walker Valley are Production (95 | 11.6%), Material Moving (35 | 4.3%), and Transportation (34 | 4.1%).
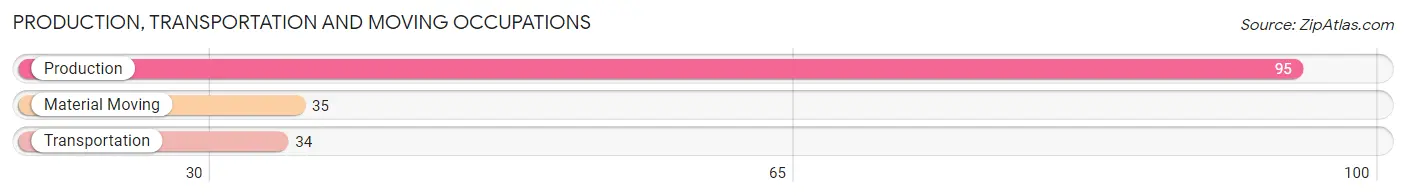
Production, Transportation and Moving Occupations by Sex
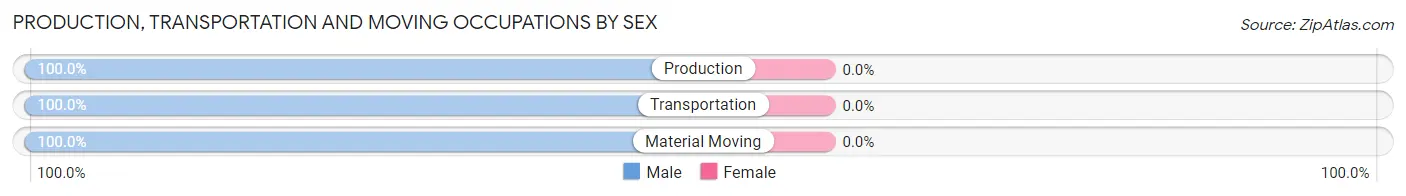
| Occupation | Male | Female |
| Production | 95 (100.0%) | 0 (0.0%) |
| Transportation | 34 (100.0%) | 0 (0.0%) |
| Material Moving | 35 (100.0%) | 0 (0.0%) |
| Total (Category) | 164 (100.0%) | 0 (0.0%) |
| Total (Overall) | 392 (47.7%) | 430 (52.3%) |
Employment Industries by Sex in Walker Valley
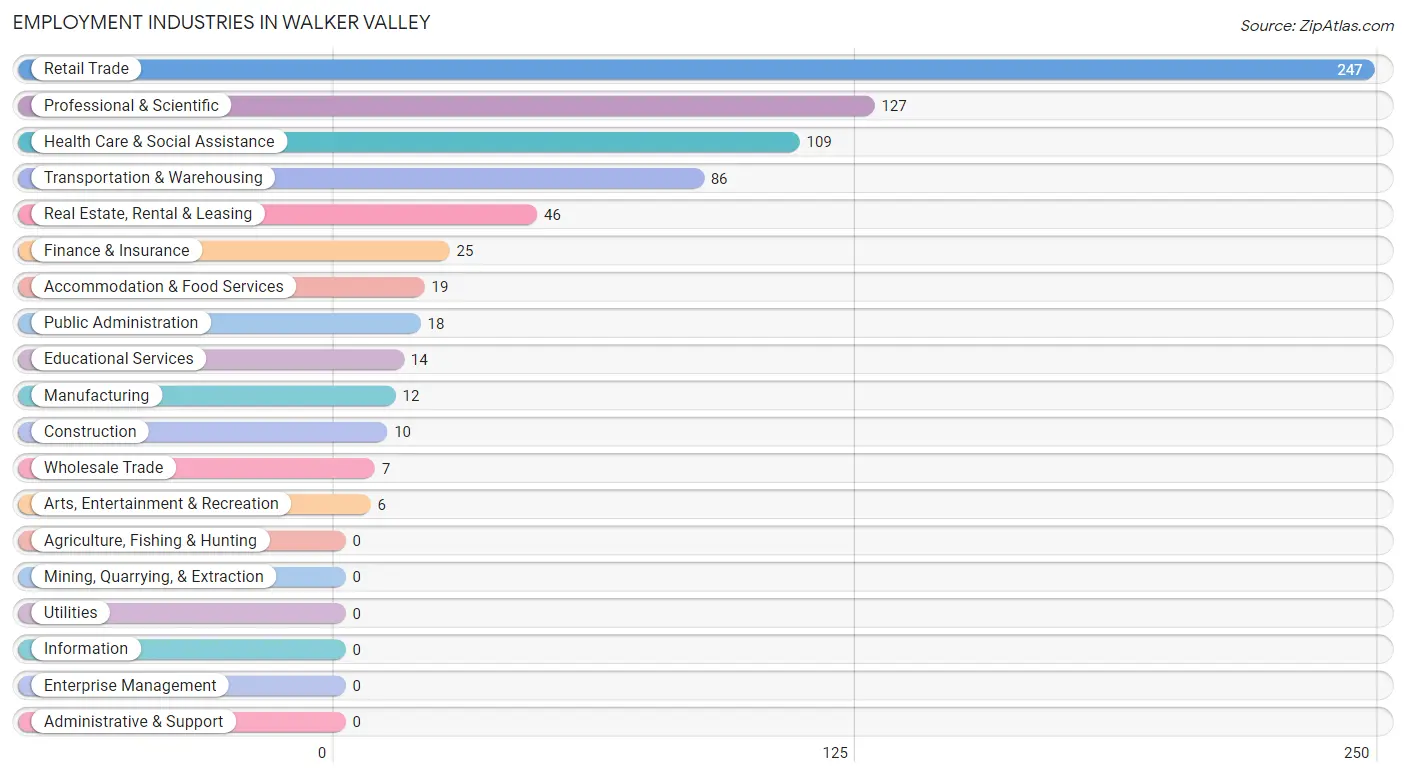
Employment Industries in Walker Valley
The major employment industries in Walker Valley include Retail Trade (247 | 30.0%), Professional & Scientific (127 | 15.4%), Health Care & Social Assistance (109 | 13.3%), Transportation & Warehousing (86 | 10.5%), and Real Estate, Rental & Leasing (46 | 5.6%).
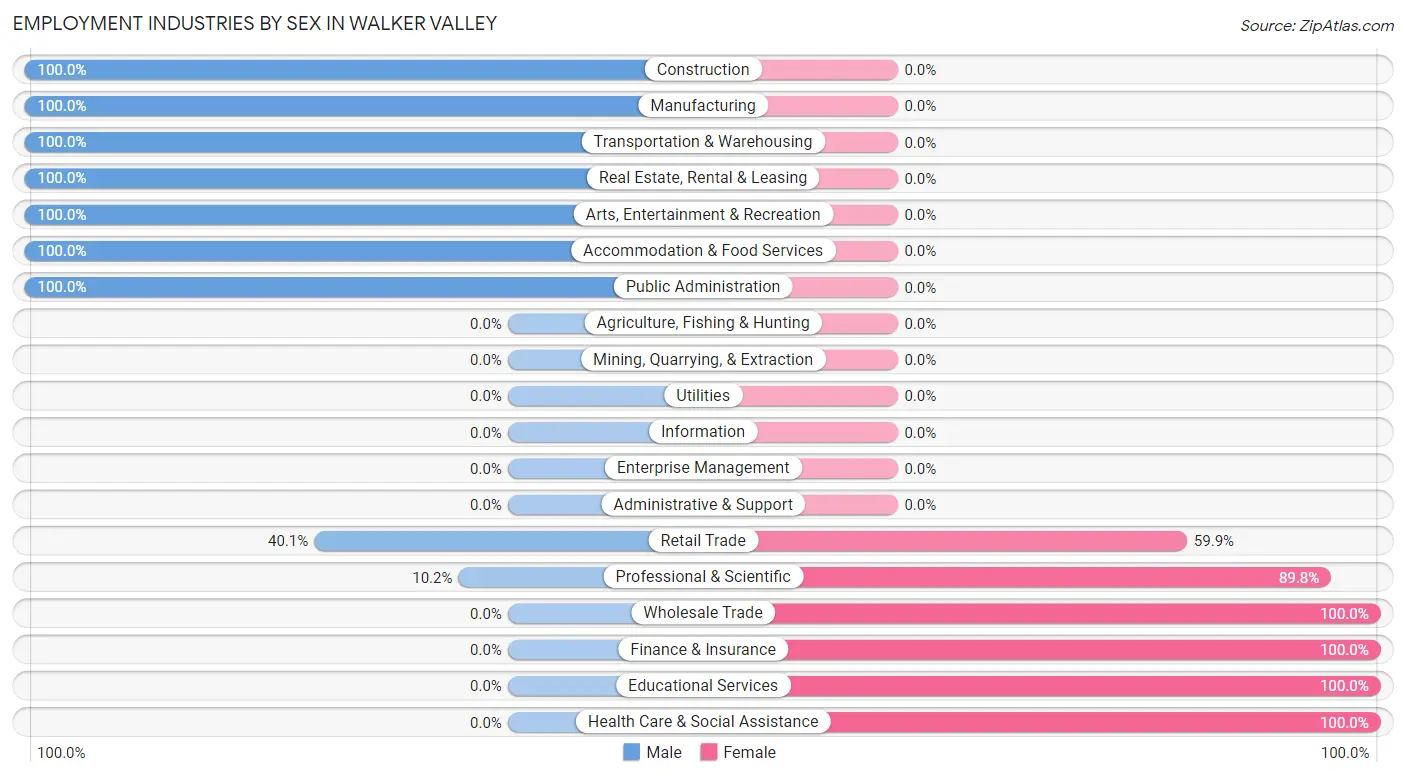
Employment Industries by Sex in Walker Valley
The Walker Valley industries that see more men than women are Construction (100.0%), Manufacturing (100.0%), and Transportation & Warehousing (100.0%), whereas the industries that tend to have a higher number of women are Wholesale Trade (100.0%), Finance & Insurance (100.0%), and Educational Services (100.0%).
| Industry | Male | Female |
| Agriculture, Fishing & Hunting | 0 (0.0%) | 0 (0.0%) |
| Mining, Quarrying, & Extraction | 0 (0.0%) | 0 (0.0%) |
| Construction | 10 (100.0%) | 0 (0.0%) |
| Manufacturing | 12 (100.0%) | 0 (0.0%) |
| Wholesale Trade | 0 (0.0%) | 7 (100.0%) |
| Retail Trade | 99 (40.1%) | 148 (59.9%) |
| Transportation & Warehousing | 86 (100.0%) | 0 (0.0%) |
| Utilities | 0 (0.0%) | 0 (0.0%) |
| Information | 0 (0.0%) | 0 (0.0%) |
| Finance & Insurance | 0 (0.0%) | 25 (100.0%) |
| Real Estate, Rental & Leasing | 46 (100.0%) | 0 (0.0%) |
| Professional & Scientific | 13 (10.2%) | 114 (89.8%) |
| Enterprise Management | 0 (0.0%) | 0 (0.0%) |
| Administrative & Support | 0 (0.0%) | 0 (0.0%) |
| Educational Services | 0 (0.0%) | 14 (100.0%) |
| Health Care & Social Assistance | 0 (0.0%) | 109 (100.0%) |
| Arts, Entertainment & Recreation | 6 (100.0%) | 0 (0.0%) |
| Accommodation & Food Services | 19 (100.0%) | 0 (0.0%) |
| Public Administration | 18 (100.0%) | 0 (0.0%) |
| Total | 392 (47.7%) | 430 (52.3%) |
Education in Walker Valley
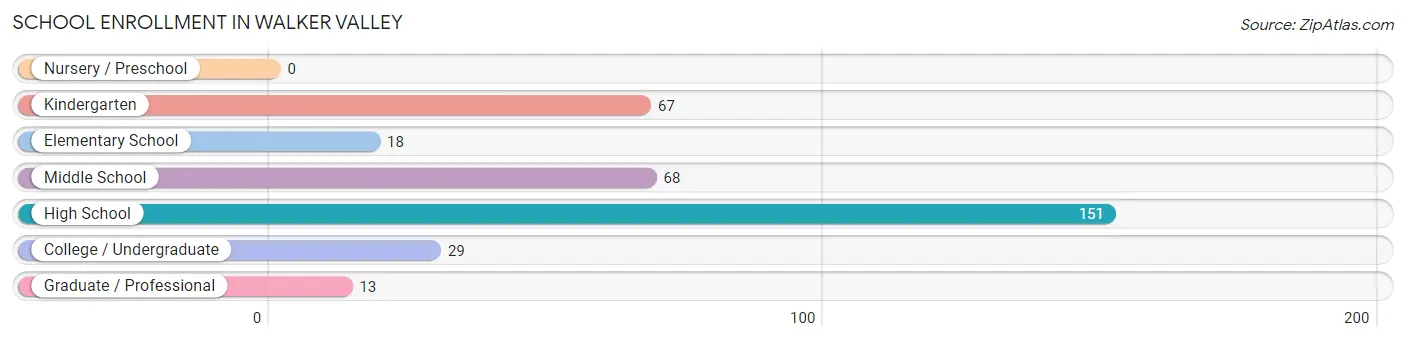
School Enrollment in Walker Valley
The most common levels of schooling among the 346 students in Walker Valley are high school (151 | 43.6%), middle school (68 | 19.7%), and kindergarten (67 | 19.4%).
| School Level | # Students | % Students |
| Nursery / Preschool | 0 | 0.0% |
| Kindergarten | 67 | 19.4% |
| Elementary School | 18 | 5.2% |
| Middle School | 68 | 19.7% |
| High School | 151 | 43.6% |
| College / Undergraduate | 29 | 8.4% |
| Graduate / Professional | 13 | 3.8% |
| Total | 346 | 100.0% |
School Enrollment by Age by Funding Source in Walker Valley
Out of a total of 346 students who are enrolled in schools in Walker Valley, 28 (8.1%) attend a private institution, while the remaining 318 (91.9%) are enrolled in public schools. The age group of 35 years and over has the highest likelihood of being enrolled in private schools, with 6 (100.0% in the age bracket) enrolled. Conversely, the age group of 5 to 9 year old has the lowest likelihood of being enrolled in a private school, with 85 (100.0% in the age bracket) attending a public institution.
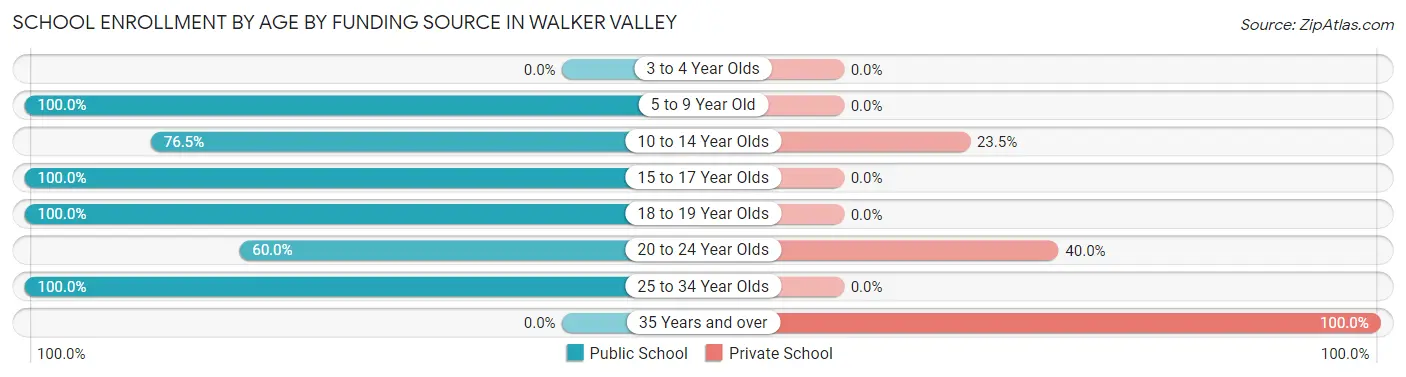
| Age Bracket | Public School | Private School |
| 3 to 4 Year Olds | 0 (0.0%) | 0 (0.0%) |
| 5 to 9 Year Old | 85 (100.0%) | 0 (0.0%) |
| 10 to 14 Year Olds | 52 (76.5%) | 16 (23.5%) |
| 15 to 17 Year Olds | 136 (100.0%) | 0 (0.0%) |
| 18 to 19 Year Olds | 29 (100.0%) | 0 (0.0%) |
| 20 to 24 Year Olds | 9 (60.0%) | 6 (40.0%) |
| 25 to 34 Year Olds | 7 (100.0%) | 0 (0.0%) |
| 35 Years and over | 0 (0.0%) | 6 (100.0%) |
| Total | 318 (91.9%) | 28 (8.1%) |
Educational Attainment by Field of Study in Walker Valley
Business (41 | 24.0%), social sciences (35 | 20.5%), psychology (28 | 16.4%), science & technology (23 | 13.5%), and education (15 | 8.8%) are the most common fields of study among 171 individuals in Walker Valley who have obtained a bachelor's degree or higher.
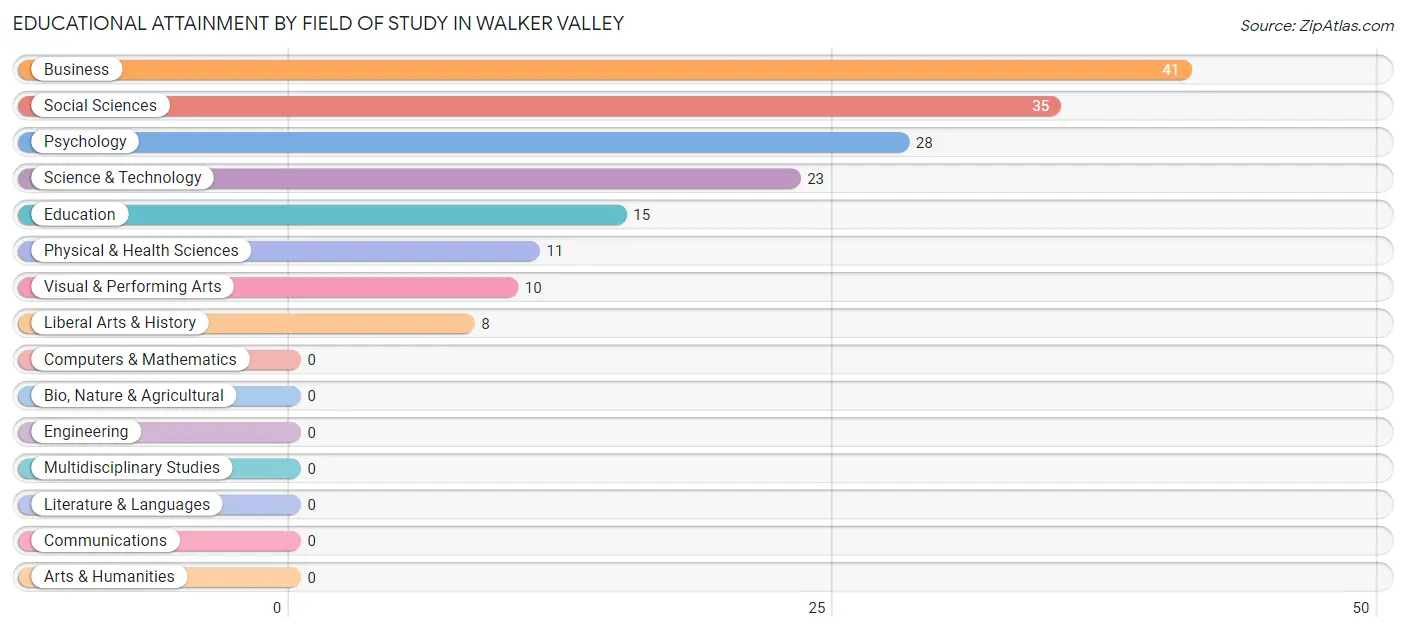
| Field of Study | # Graduates | % Graduates |
| Computers & Mathematics | 0 | 0.0% |
| Bio, Nature & Agricultural | 0 | 0.0% |
| Physical & Health Sciences | 11 | 6.4% |
| Psychology | 28 | 16.4% |
| Social Sciences | 35 | 20.5% |
| Engineering | 0 | 0.0% |
| Multidisciplinary Studies | 0 | 0.0% |
| Science & Technology | 23 | 13.5% |
| Business | 41 | 24.0% |
| Education | 15 | 8.8% |
| Literature & Languages | 0 | 0.0% |
| Liberal Arts & History | 8 | 4.7% |
| Visual & Performing Arts | 10 | 5.9% |
| Communications | 0 | 0.0% |
| Arts & Humanities | 0 | 0.0% |
| Total | 171 | 100.0% |
Transportation & Commute in Walker Valley
Vehicle Availability by Sex in Walker Valley
The most prevalent vehicle ownership categories in Walker Valley are males with 3 vehicles (170, accounting for 43.4%) and females with 3 vehicles (220, making up 39.5%).
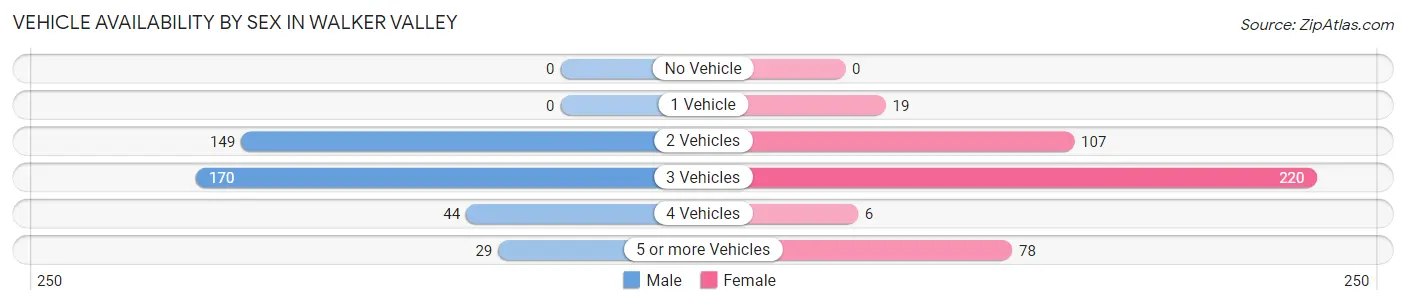
| Vehicles Available | Male | Female |
| No Vehicle | 0 (0.0%) | 0 (0.0%) |
| 1 Vehicle | 0 (0.0%) | 19 (4.4%) |
| 2 Vehicles | 149 (38.0%) | 107 (24.9%) |
| 3 Vehicles | 170 (43.4%) | 220 (51.2%) |
| 4 Vehicles | 44 (11.2%) | 6 (1.4%) |
| 5 or more Vehicles | 29 (7.4%) | 78 (18.1%) |
| Total | 392 (100.0%) | 430 (100.0%) |
Commute Time in Walker Valley
The most frequently occuring commute durations in Walker Valley are 60 to 89 minutes (231 commuters, 29.1%), 20 to 24 minutes (157 commuters, 19.8%), and 30 to 34 minutes (107 commuters, 13.5%).
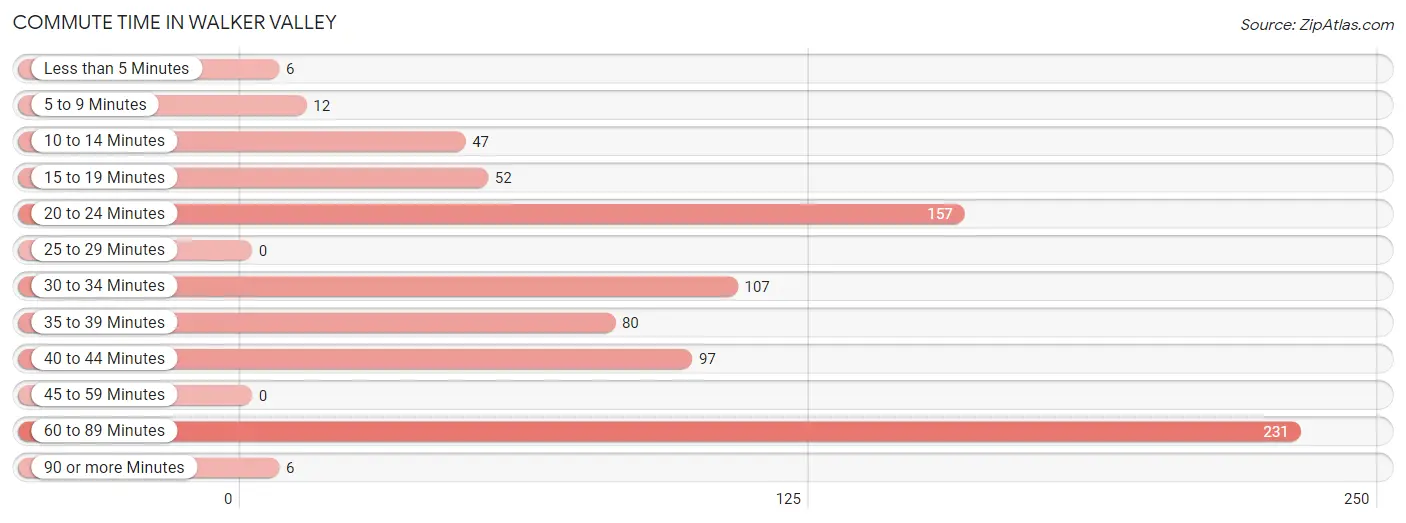
| Commute Time | # Commuters | % Commuters |
| Less than 5 Minutes | 6 | 0.7% |
| 5 to 9 Minutes | 12 | 1.5% |
| 10 to 14 Minutes | 47 | 5.9% |
| 15 to 19 Minutes | 52 | 6.5% |
| 20 to 24 Minutes | 157 | 19.8% |
| 25 to 29 Minutes | 0 | 0.0% |
| 30 to 34 Minutes | 107 | 13.5% |
| 35 to 39 Minutes | 80 | 10.1% |
| 40 to 44 Minutes | 97 | 12.2% |
| 45 to 59 Minutes | 0 | 0.0% |
| 60 to 89 Minutes | 231 | 29.1% |
| 90 or more Minutes | 6 | 0.7% |
Commute Time by Sex in Walker Valley
The most common commute times in Walker Valley are 40 to 44 minutes (97 commuters, 26.0%) for males and 60 to 89 minutes (173 commuters, 41.0%) for females.
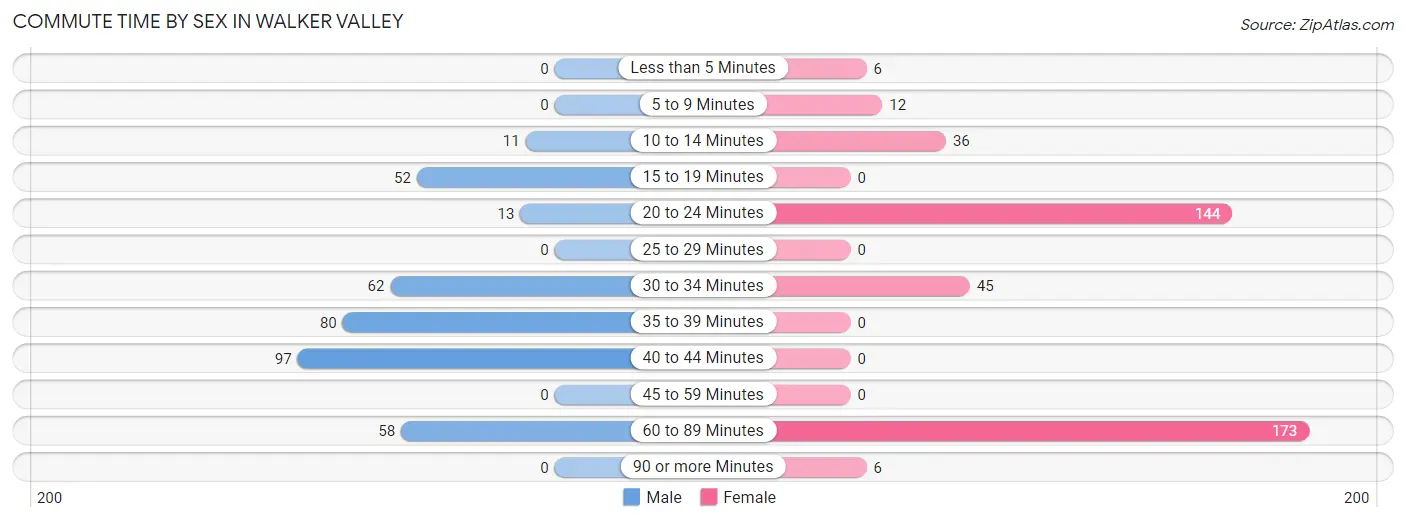
| Commute Time | Male | Female |
| Less than 5 Minutes | 0 (0.0%) | 6 (1.4%) |
| 5 to 9 Minutes | 0 (0.0%) | 12 (2.8%) |
| 10 to 14 Minutes | 11 (2.9%) | 36 (8.5%) |
| 15 to 19 Minutes | 52 (13.9%) | 0 (0.0%) |
| 20 to 24 Minutes | 13 (3.5%) | 144 (34.1%) |
| 25 to 29 Minutes | 0 (0.0%) | 0 (0.0%) |
| 30 to 34 Minutes | 62 (16.6%) | 45 (10.7%) |
| 35 to 39 Minutes | 80 (21.4%) | 0 (0.0%) |
| 40 to 44 Minutes | 97 (26.0%) | 0 (0.0%) |
| 45 to 59 Minutes | 0 (0.0%) | 0 (0.0%) |
| 60 to 89 Minutes | 58 (15.5%) | 173 (41.0%) |
| 90 or more Minutes | 0 (0.0%) | 6 (1.4%) |
Time of Departure to Work by Sex in Walker Valley
The most frequent times of departure to work in Walker Valley are 7:00 AM to 7:29 AM (137, 36.7%) for males and 5:30 AM to 5:59 AM (71, 16.8%) for females.
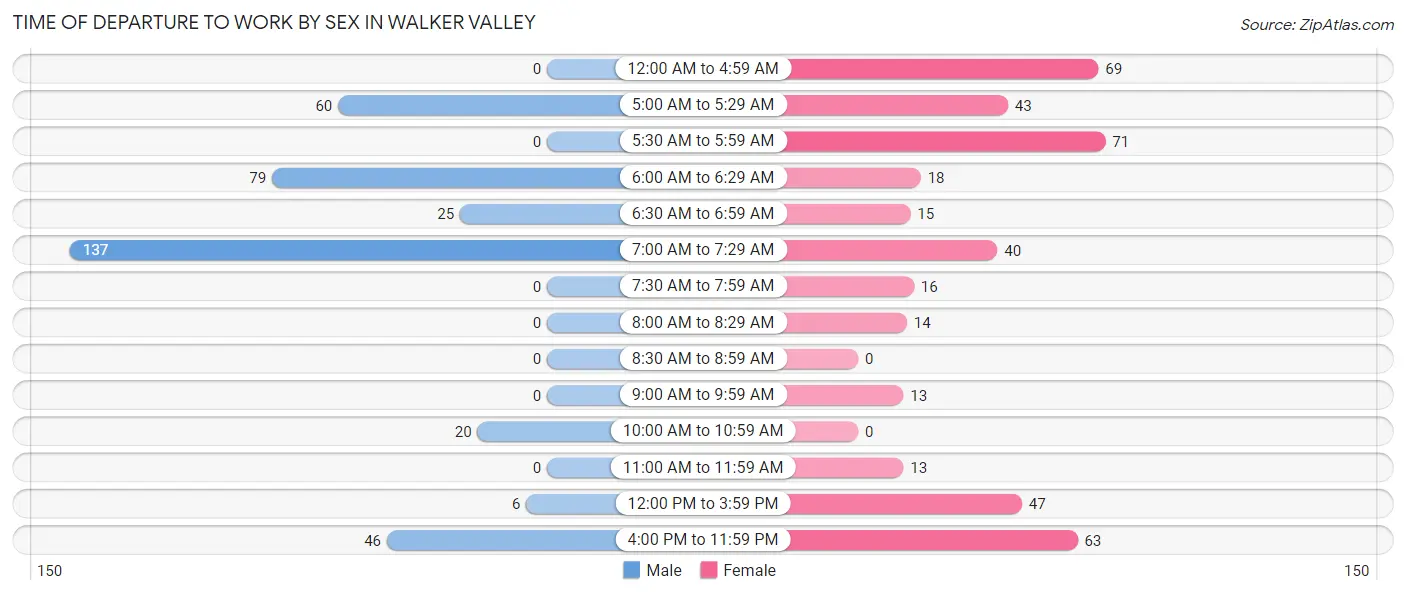
| Time of Departure | Male | Female |
| 12:00 AM to 4:59 AM | 0 (0.0%) | 69 (16.4%) |
| 5:00 AM to 5:29 AM | 60 (16.1%) | 43 (10.2%) |
| 5:30 AM to 5:59 AM | 0 (0.0%) | 71 (16.8%) |
| 6:00 AM to 6:29 AM | 79 (21.2%) | 18 (4.3%) |
| 6:30 AM to 6:59 AM | 25 (6.7%) | 15 (3.5%) |
| 7:00 AM to 7:29 AM | 137 (36.7%) | 40 (9.5%) |
| 7:30 AM to 7:59 AM | 0 (0.0%) | 16 (3.8%) |
| 8:00 AM to 8:29 AM | 0 (0.0%) | 14 (3.3%) |
| 8:30 AM to 8:59 AM | 0 (0.0%) | 0 (0.0%) |
| 9:00 AM to 9:59 AM | 0 (0.0%) | 13 (3.1%) |
| 10:00 AM to 10:59 AM | 20 (5.4%) | 0 (0.0%) |
| 11:00 AM to 11:59 AM | 0 (0.0%) | 13 (3.1%) |
| 12:00 PM to 3:59 PM | 6 (1.6%) | 47 (11.1%) |
| 4:00 PM to 11:59 PM | 46 (12.3%) | 63 (14.9%) |
| Total | 373 (100.0%) | 422 (100.0%) |
Housing Occupancy in Walker Valley
Occupancy by Ownership in Walker Valley
Of the total 483 dwellings in Walker Valley, owner-occupied units account for 395 (81.8%), while renter-occupied units make up 88 (18.2%).
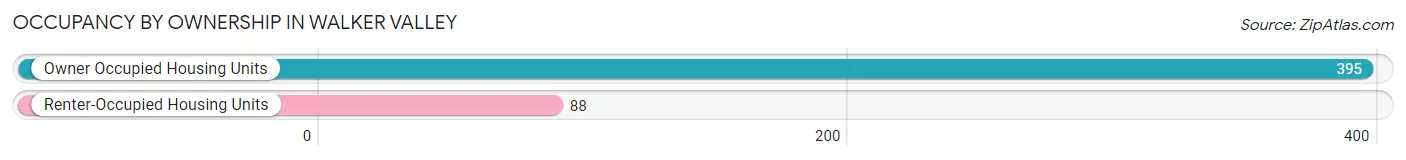
| Occupancy | # Housing Units | % Housing Units |
| Owner Occupied Housing Units | 395 | 81.8% |
| Renter-Occupied Housing Units | 88 | 18.2% |
| Total Occupied Housing Units | 483 | 100.0% |
Occupancy by Household Size in Walker Valley
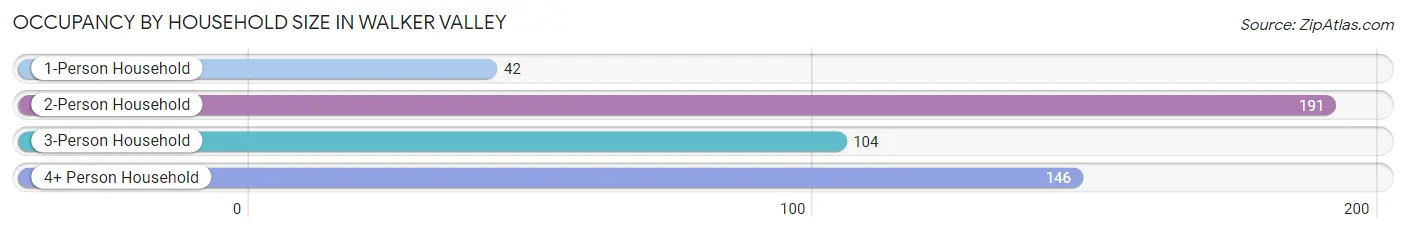
| Household Size | # Housing Units | % Housing Units |
| 1-Person Household | 42 | 8.7% |
| 2-Person Household | 191 | 39.5% |
| 3-Person Household | 104 | 21.5% |
| 4+ Person Household | 146 | 30.2% |
| Total Housing Units | 483 | 100.0% |
Occupancy by Ownership by Household Size in Walker Valley
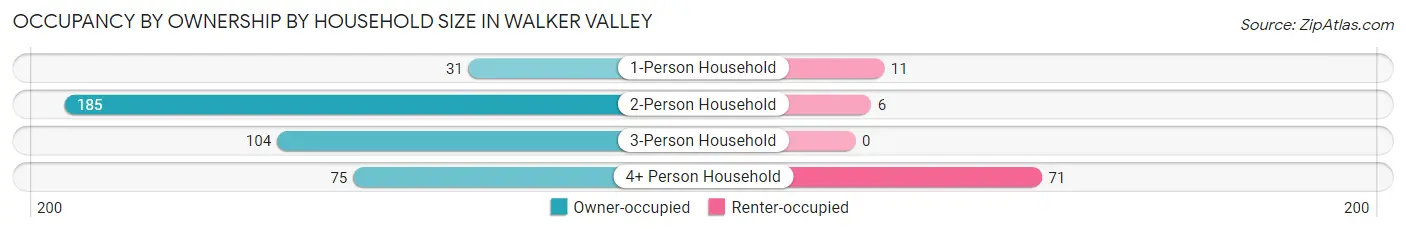
| Household Size | Owner-occupied | Renter-occupied |
| 1-Person Household | 31 (73.8%) | 11 (26.2%) |
| 2-Person Household | 185 (96.9%) | 6 (3.1%) |
| 3-Person Household | 104 (100.0%) | 0 (0.0%) |
| 4+ Person Household | 75 (51.4%) | 71 (48.6%) |
| Total Housing Units | 395 (81.8%) | 88 (18.2%) |
Occupancy by Educational Attainment in Walker Valley
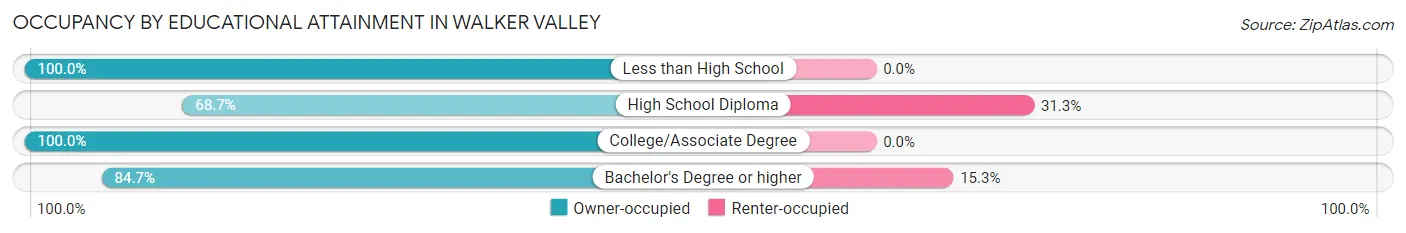
| Household Size | Owner-occupied | Renter-occupied |
| Less than High School | 17 (100.0%) | 0 (0.0%) |
| High School Diploma | 169 (68.7%) | 77 (31.3%) |
| College/Associate Degree | 148 (100.0%) | 0 (0.0%) |
| Bachelor's Degree or higher | 61 (84.7%) | 11 (15.3%) |
Occupancy by Age of Householder in Walker Valley
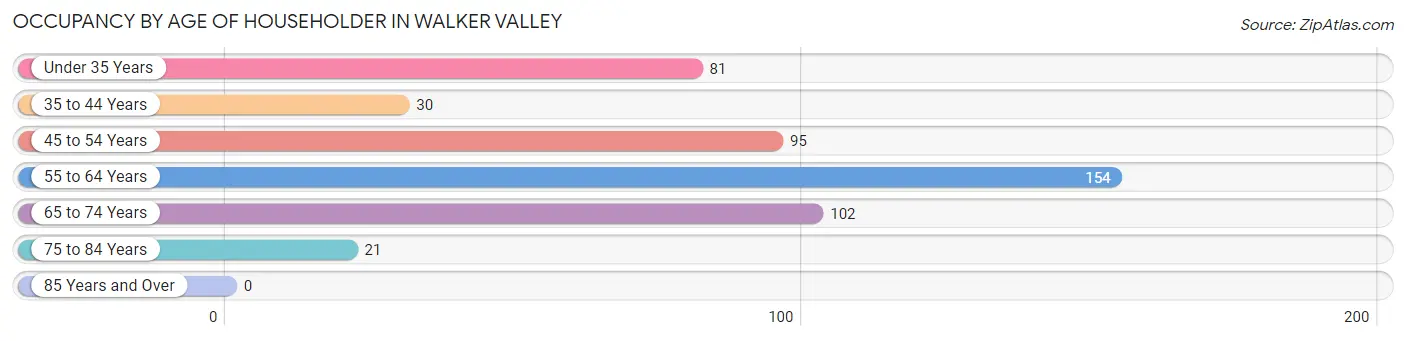
| Age Bracket | # Households | % Households |
| Under 35 Years | 81 | 16.8% |
| 35 to 44 Years | 30 | 6.2% |
| 45 to 54 Years | 95 | 19.7% |
| 55 to 64 Years | 154 | 31.9% |
| 65 to 74 Years | 102 | 21.1% |
| 75 to 84 Years | 21 | 4.3% |
| 85 Years and Over | 0 | 0.0% |
| Total | 483 | 100.0% |
Housing Finances in Walker Valley
Median Income by Occupancy in Walker Valley
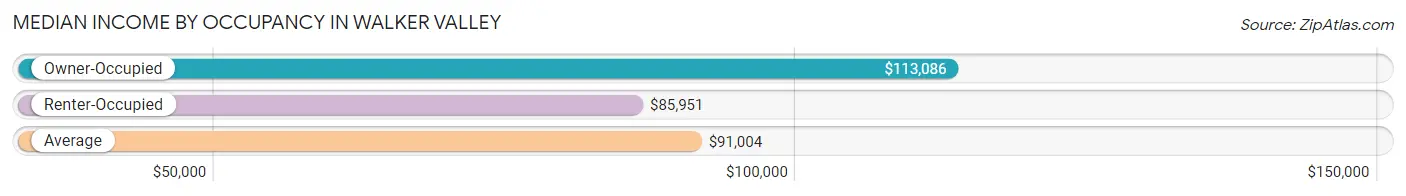
| Occupancy Type | # Households | Median Income |
| Owner-Occupied | 395 (81.8%) | $113,086 |
| Renter-Occupied | 88 (18.2%) | $85,951 |
| Average | 483 (100.0%) | $91,004 |
Occupancy by Householder Income Bracket in Walker Valley
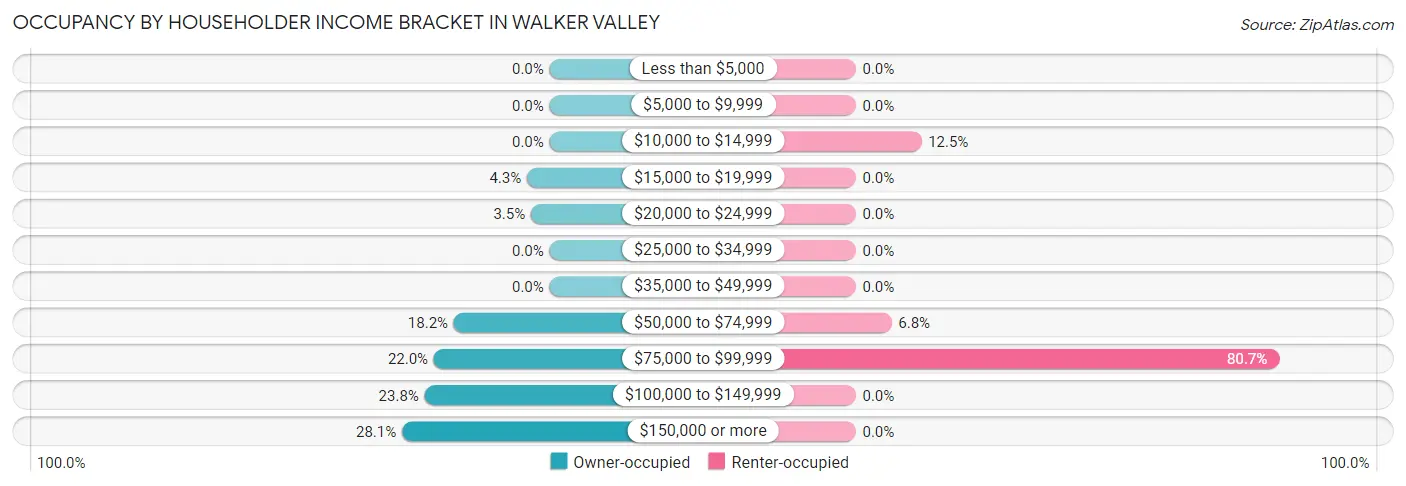
| Income Bracket | Owner-occupied | Renter-occupied |
| Less than $5,000 | 0 (0.0%) | 0 (0.0%) |
| $5,000 to $9,999 | 0 (0.0%) | 0 (0.0%) |
| $10,000 to $14,999 | 0 (0.0%) | 11 (12.5%) |
| $15,000 to $19,999 | 17 (4.3%) | 0 (0.0%) |
| $20,000 to $24,999 | 14 (3.5%) | 0 (0.0%) |
| $25,000 to $34,999 | 0 (0.0%) | 0 (0.0%) |
| $35,000 to $49,999 | 0 (0.0%) | 0 (0.0%) |
| $50,000 to $74,999 | 72 (18.2%) | 6 (6.8%) |
| $75,000 to $99,999 | 87 (22.0%) | 71 (80.7%) |
| $100,000 to $149,999 | 94 (23.8%) | 0 (0.0%) |
| $150,000 or more | 111 (28.1%) | 0 (0.0%) |
| Total | 395 (100.0%) | 88 (100.0%) |
Monthly Housing Cost Tiers in Walker Valley
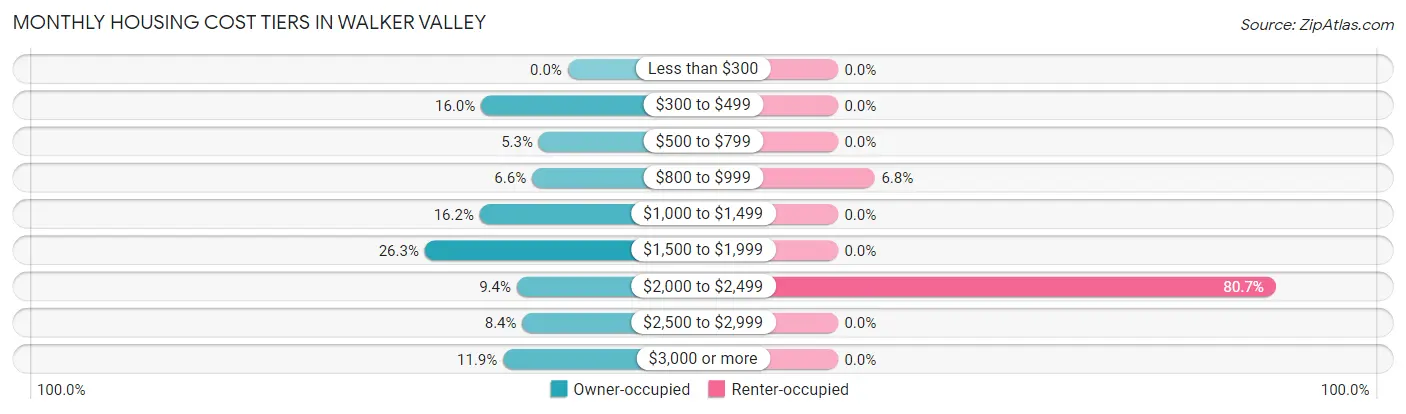
| Monthly Cost | Owner-occupied | Renter-occupied |
| Less than $300 | 0 (0.0%) | 0 (0.0%) |
| $300 to $499 | 63 (16.0%) | 0 (0.0%) |
| $500 to $799 | 21 (5.3%) | 0 (0.0%) |
| $800 to $999 | 26 (6.6%) | 6 (6.8%) |
| $1,000 to $1,499 | 64 (16.2%) | 0 (0.0%) |
| $1,500 to $1,999 | 104 (26.3%) | 0 (0.0%) |
| $2,000 to $2,499 | 37 (9.4%) | 71 (80.7%) |
| $2,500 to $2,999 | 33 (8.4%) | 0 (0.0%) |
| $3,000 or more | 47 (11.9%) | 0 (0.0%) |
| Total | 395 (100.0%) | 88 (100.0%) |
Physical Housing Characteristics in Walker Valley
Housing Structures in Walker Valley
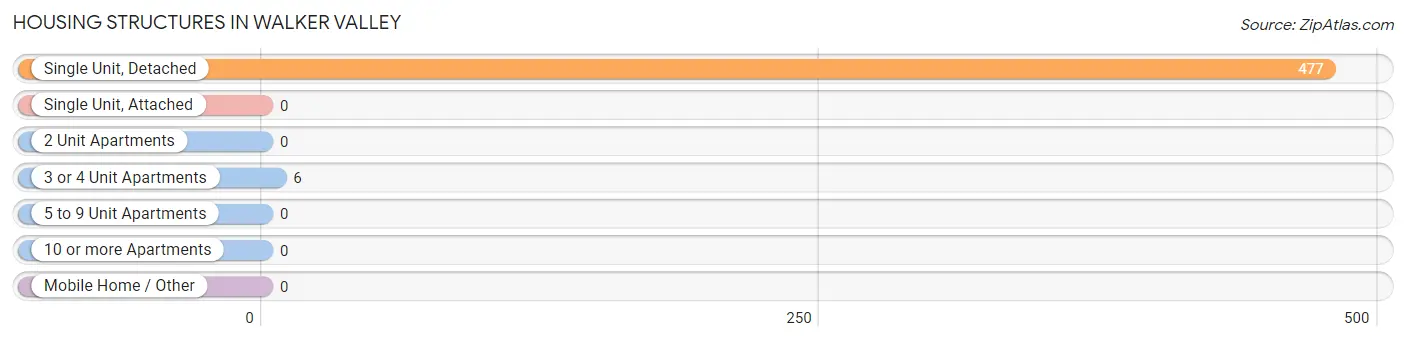
| Structure Type | # Housing Units | % Housing Units |
| Single Unit, Detached | 477 | 98.8% |
| Single Unit, Attached | 0 | 0.0% |
| 2 Unit Apartments | 0 | 0.0% |
| 3 or 4 Unit Apartments | 6 | 1.2% |
| 5 to 9 Unit Apartments | 0 | 0.0% |
| 10 or more Apartments | 0 | 0.0% |
| Mobile Home / Other | 0 | 0.0% |
| Total | 483 | 100.0% |
Housing Structures by Occupancy in Walker Valley
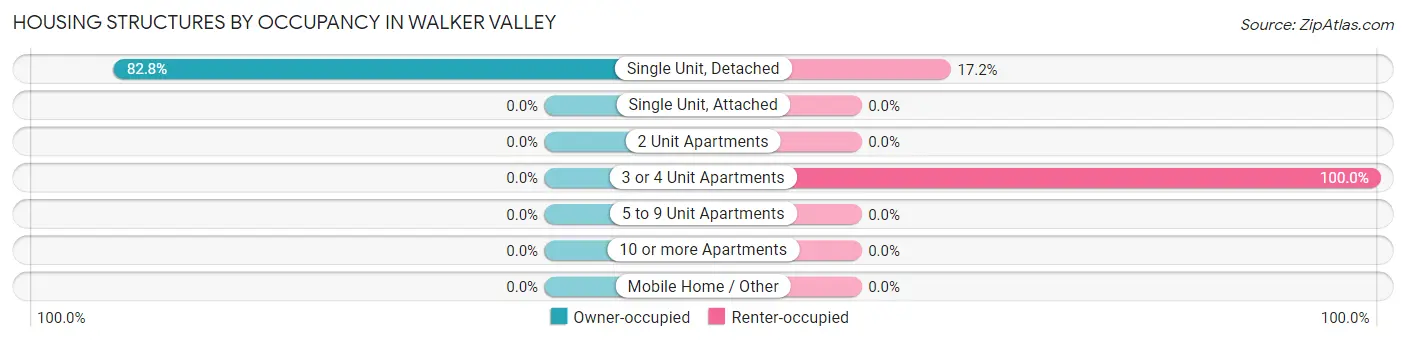
| Structure Type | Owner-occupied | Renter-occupied |
| Single Unit, Detached | 395 (82.8%) | 82 (17.2%) |
| Single Unit, Attached | 0 (0.0%) | 0 (0.0%) |
| 2 Unit Apartments | 0 (0.0%) | 0 (0.0%) |
| 3 or 4 Unit Apartments | 0 (0.0%) | 6 (100.0%) |
| 5 to 9 Unit Apartments | 0 (0.0%) | 0 (0.0%) |
| 10 or more Apartments | 0 (0.0%) | 0 (0.0%) |
| Mobile Home / Other | 0 (0.0%) | 0 (0.0%) |
| Total | 395 (81.8%) | 88 (18.2%) |
Housing Structures by Number of Rooms in Walker Valley
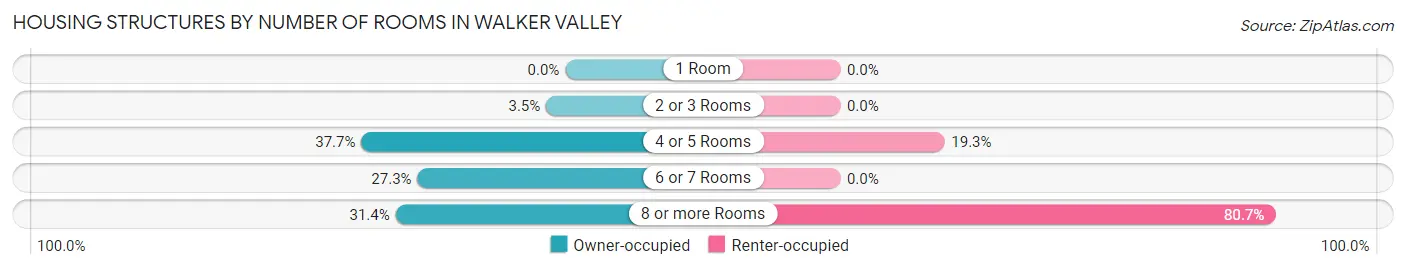
| Number of Rooms | Owner-occupied | Renter-occupied |
| 1 Room | 0 (0.0%) | 0 (0.0%) |
| 2 or 3 Rooms | 14 (3.5%) | 0 (0.0%) |
| 4 or 5 Rooms | 149 (37.7%) | 17 (19.3%) |
| 6 or 7 Rooms | 108 (27.3%) | 0 (0.0%) |
| 8 or more Rooms | 124 (31.4%) | 71 (80.7%) |
| Total | 395 (100.0%) | 88 (100.0%) |
Housing Structure by Heating Type in Walker Valley
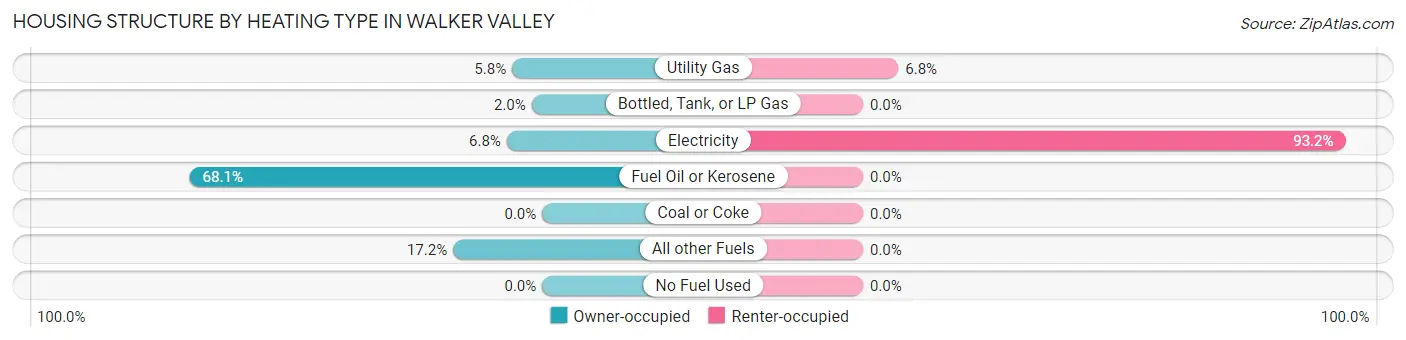
| Heating Type | Owner-occupied | Renter-occupied |
| Utility Gas | 23 (5.8%) | 6 (6.8%) |
| Bottled, Tank, or LP Gas | 8 (2.0%) | 0 (0.0%) |
| Electricity | 27 (6.8%) | 82 (93.2%) |
| Fuel Oil or Kerosene | 269 (68.1%) | 0 (0.0%) |
| Coal or Coke | 0 (0.0%) | 0 (0.0%) |
| All other Fuels | 68 (17.2%) | 0 (0.0%) |
| No Fuel Used | 0 (0.0%) | 0 (0.0%) |
| Total | 395 (100.0%) | 88 (100.0%) |
Household Vehicle Usage in Walker Valley
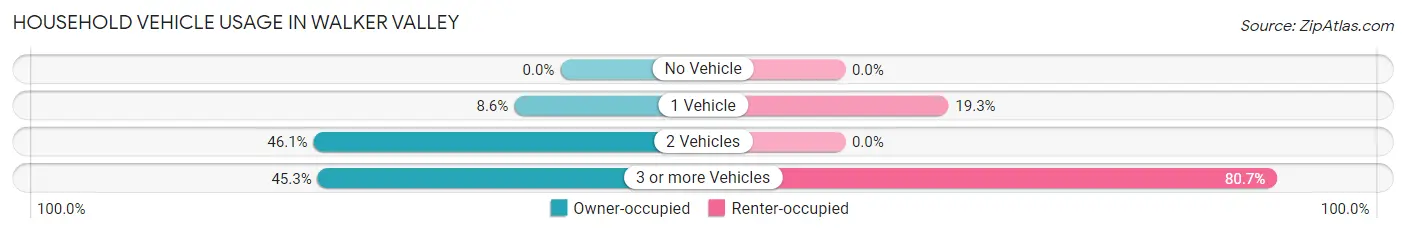
| Vehicles per Household | Owner-occupied | Renter-occupied |
| No Vehicle | 0 (0.0%) | 0 (0.0%) |
| 1 Vehicle | 34 (8.6%) | 17 (19.3%) |
| 2 Vehicles | 182 (46.1%) | 0 (0.0%) |
| 3 or more Vehicles | 179 (45.3%) | 71 (80.7%) |
| Total | 395 (100.0%) | 88 (100.0%) |
Real Estate & Mortgages in Walker Valley
Real Estate and Mortgage Overview in Walker Valley
| Characteristic | Without Mortgage | With Mortgage |
| Housing Units | 119 | 276 |
| Median Property Value | - | - |
| Median Household Income | - | - |
| Monthly Housing Costs | - | - |
| Real Estate Taxes | - | - |
Property Value by Mortgage Status in Walker Valley
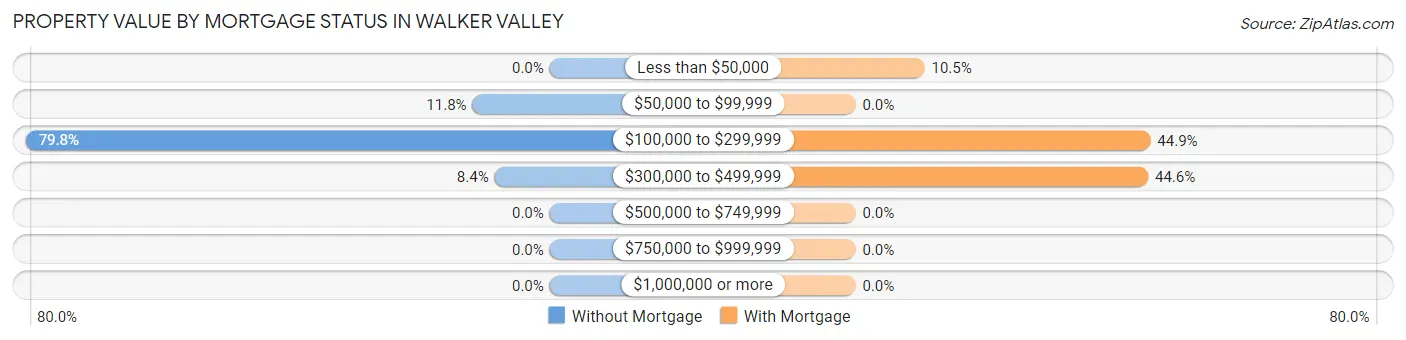
| Property Value | Without Mortgage | With Mortgage |
| Less than $50,000 | 0 (0.0%) | 29 (10.5%) |
| $50,000 to $99,999 | 14 (11.8%) | 0 (0.0%) |
| $100,000 to $299,999 | 95 (79.8%) | 124 (44.9%) |
| $300,000 to $499,999 | 10 (8.4%) | 123 (44.6%) |
| $500,000 to $749,999 | 0 (0.0%) | 0 (0.0%) |
| $750,000 to $999,999 | 0 (0.0%) | 0 (0.0%) |
| $1,000,000 or more | 0 (0.0%) | 0 (0.0%) |
| Total | 119 (100.0%) | 276 (100.0%) |
Household Income by Mortgage Status in Walker Valley
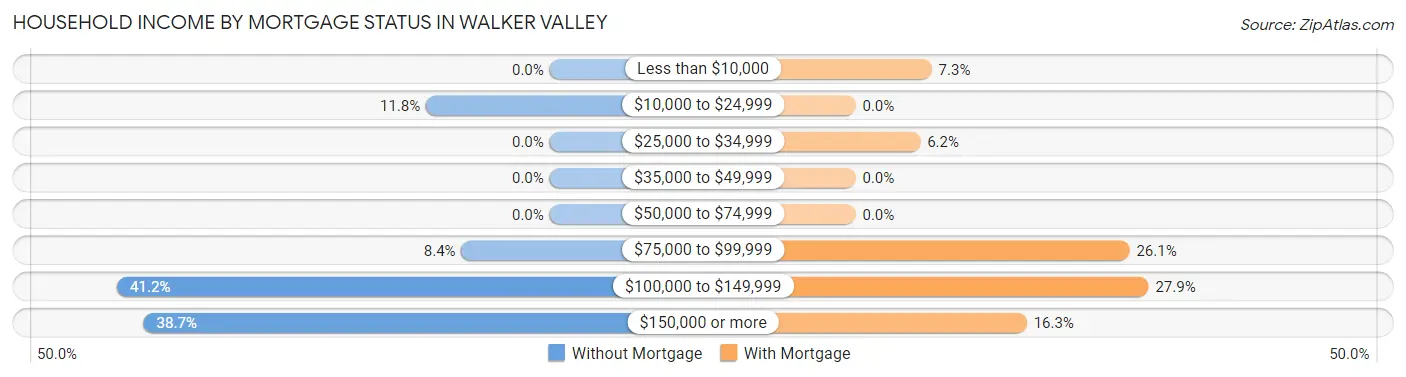
| Household Income | Without Mortgage | With Mortgage |
| Less than $10,000 | 0 (0.0%) | 20 (7.2%) |
| $10,000 to $24,999 | 14 (11.8%) | 0 (0.0%) |
| $25,000 to $34,999 | 0 (0.0%) | 17 (6.2%) |
| $35,000 to $49,999 | 0 (0.0%) | 0 (0.0%) |
| $50,000 to $74,999 | 0 (0.0%) | 0 (0.0%) |
| $75,000 to $99,999 | 10 (8.4%) | 72 (26.1%) |
| $100,000 to $149,999 | 49 (41.2%) | 77 (27.9%) |
| $150,000 or more | 46 (38.7%) | 45 (16.3%) |
| Total | 119 (100.0%) | 276 (100.0%) |
Property Value to Household Income Ratio in Walker Valley
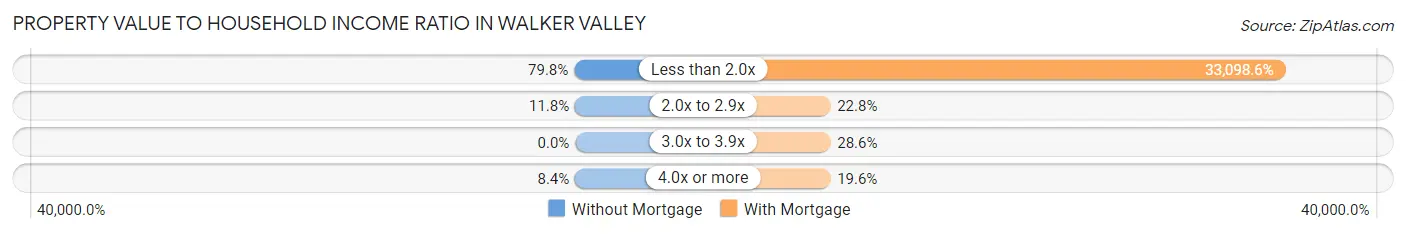
| Value-to-Income Ratio | Without Mortgage | With Mortgage |
| Less than 2.0x | 95 (79.8%) | 91,352 (33,098.6%) |
| 2.0x to 2.9x | 14 (11.8%) | 63 (22.8%) |
| 3.0x to 3.9x | 0 (0.0%) | 79 (28.6%) |
| 4.0x or more | 10 (8.4%) | 54 (19.6%) |
| Total | 119 (100.0%) | 276 (100.0%) |
Real Estate Taxes by Mortgage Status in Walker Valley
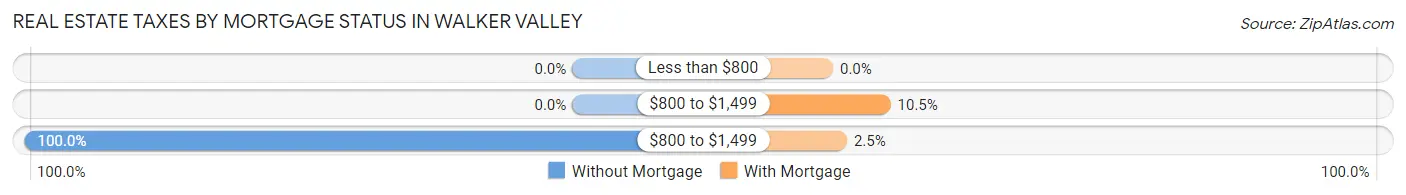
| Property Taxes | Without Mortgage | With Mortgage |
| Less than $800 | 0 (0.0%) | 0 (0.0%) |
| $800 to $1,499 | 0 (0.0%) | 29 (10.5%) |
| $800 to $1,499 | 119 (100.0%) | 7 (2.5%) |
| Total | 119 (100.0%) | 276 (100.0%) |
Health & Disability in Walker Valley
Health Insurance Coverage by Age in Walker Valley
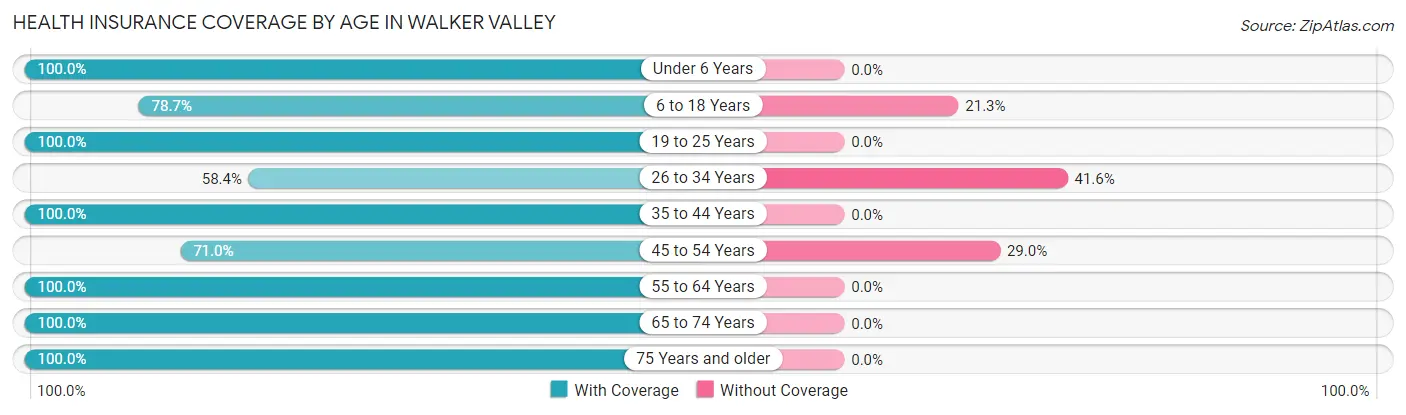
| Age Bracket | With Coverage | Without Coverage |
| Under 6 Years | 18 (100.0%) | 0 (0.0%) |
| 6 to 18 Years | 248 (78.7%) | 67 (21.3%) |
| 19 to 25 Years | 137 (100.0%) | 0 (0.0%) |
| 26 to 34 Years | 136 (58.4%) | 97 (41.6%) |
| 35 to 44 Years | 64 (100.0%) | 0 (0.0%) |
| 45 to 54 Years | 132 (71.0%) | 54 (29.0%) |
| 55 to 64 Years | 309 (100.0%) | 0 (0.0%) |
| 65 to 74 Years | 138 (100.0%) | 0 (0.0%) |
| 75 Years and older | 40 (100.0%) | 0 (0.0%) |
| Total | 1,222 (84.9%) | 218 (15.1%) |
Health Insurance Coverage by Citizenship Status in Walker Valley
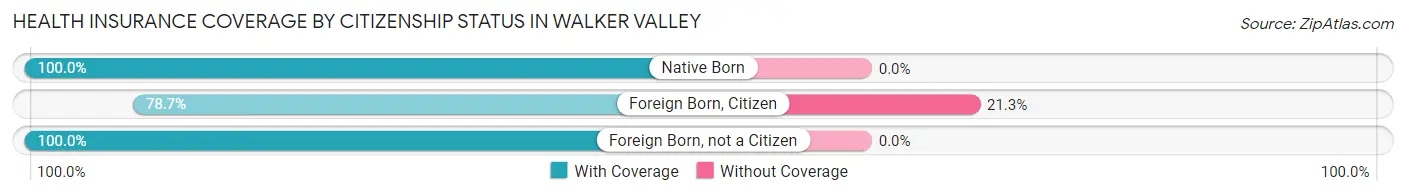
| Citizenship Status | With Coverage | Without Coverage |
| Native Born | 18 (100.0%) | 0 (0.0%) |
| Foreign Born, Citizen | 248 (78.7%) | 67 (21.3%) |
| Foreign Born, not a Citizen | 137 (100.0%) | 0 (0.0%) |
Health Insurance Coverage by Household Income in Walker Valley
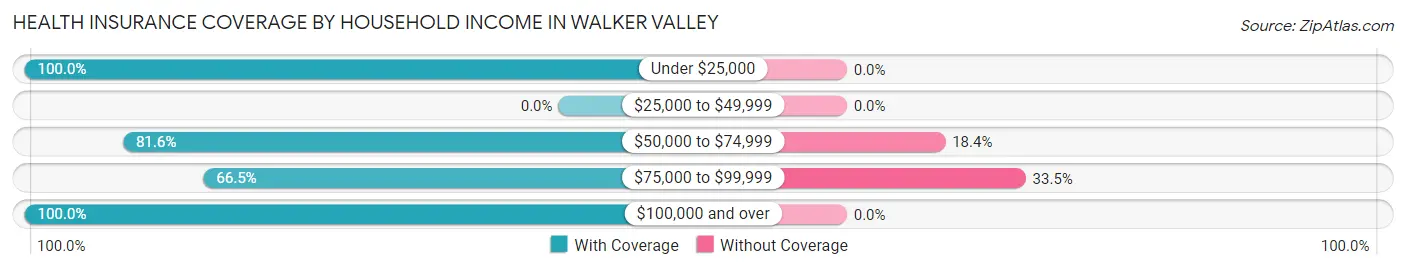
| Household Income | With Coverage | Without Coverage |
| Under $25,000 | 74 (100.0%) | 0 (0.0%) |
| $25,000 to $49,999 | 0 (0.0%) | 0 (0.0%) |
| $50,000 to $74,999 | 115 (81.6%) | 26 (18.4%) |
| $75,000 to $99,999 | 381 (66.5%) | 192 (33.5%) |
| $100,000 and over | 631 (100.0%) | 0 (0.0%) |
Public vs Private Health Insurance Coverage by Age in Walker Valley
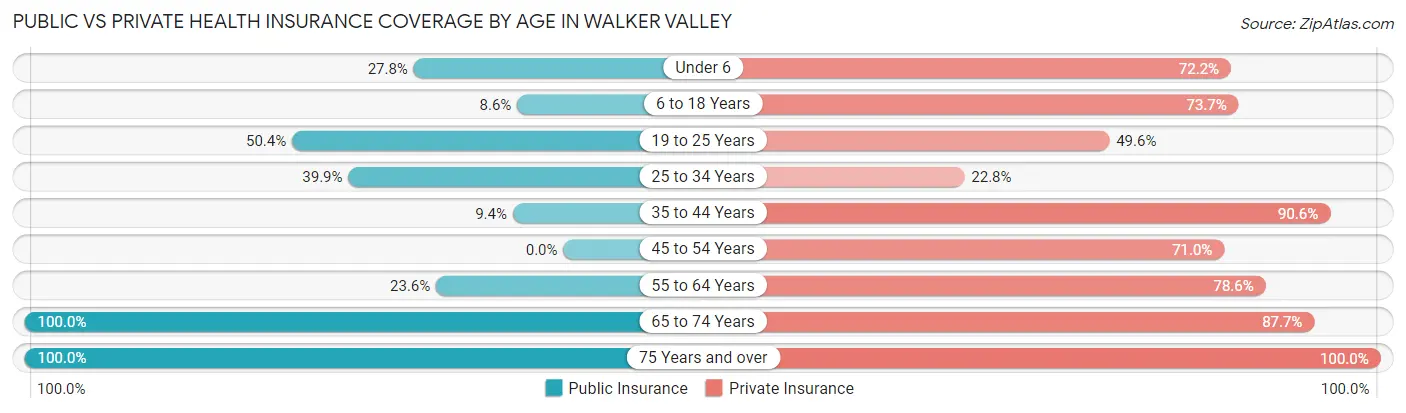
| Age Bracket | Public Insurance | Private Insurance |
| Under 6 | 5 (27.8%) | 13 (72.2%) |
| 6 to 18 Years | 27 (8.6%) | 232 (73.7%) |
| 19 to 25 Years | 69 (50.4%) | 68 (49.6%) |
| 25 to 34 Years | 93 (39.9%) | 53 (22.8%) |
| 35 to 44 Years | 6 (9.4%) | 58 (90.6%) |
| 45 to 54 Years | 0 (0.0%) | 132 (71.0%) |
| 55 to 64 Years | 73 (23.6%) | 243 (78.6%) |
| 65 to 74 Years | 138 (100.0%) | 121 (87.7%) |
| 75 Years and over | 40 (100.0%) | 40 (100.0%) |
| Total | 451 (31.3%) | 960 (66.7%) |
Disability Status by Sex by Age in Walker Valley
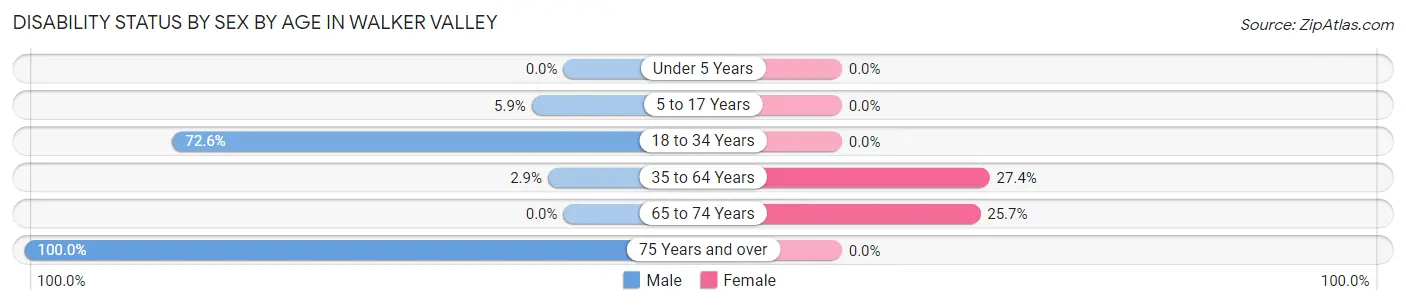
| Age Bracket | Male | Female |
| Under 5 Years | 0 (0.0%) | 0 (0.0%) |
| 5 to 17 Years | 11 (5.9%) | 0 (0.0%) |
| 18 to 34 Years | 119 (72.6%) | 0 (0.0%) |
| 35 to 64 Years | 7 (2.9%) | 87 (27.4%) |
| 65 to 74 Years | 0 (0.0%) | 9 (25.7%) |
| 75 Years and over | 19 (100.0%) | 0 (0.0%) |
Disability Class by Sex by Age in Walker Valley
Disability Class: Hearing Difficulty
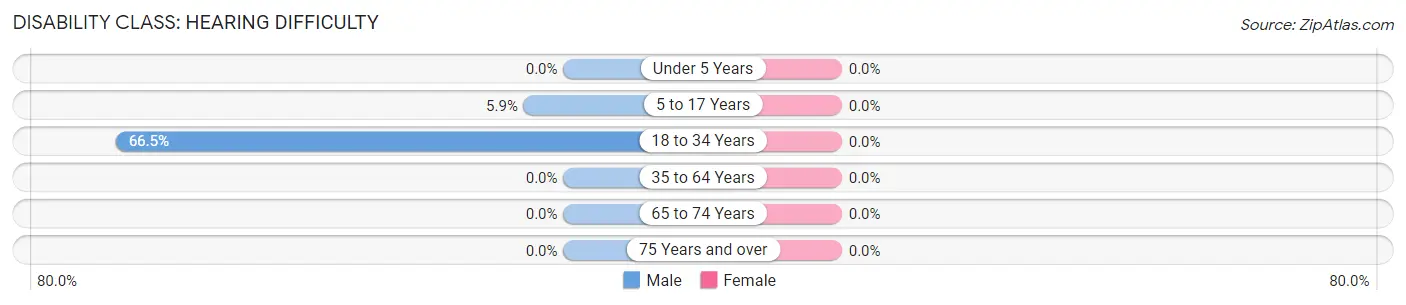
| Age Bracket | Male | Female |
| Under 5 Years | 0 (0.0%) | 0 (0.0%) |
| 5 to 17 Years | 11 (5.9%) | 0 (0.0%) |
| 18 to 34 Years | 109 (66.5%) | 0 (0.0%) |
| 35 to 64 Years | 0 (0.0%) | 0 (0.0%) |
| 65 to 74 Years | 0 (0.0%) | 0 (0.0%) |
| 75 Years and over | 0 (0.0%) | 0 (0.0%) |
Disability Class: Vision Difficulty
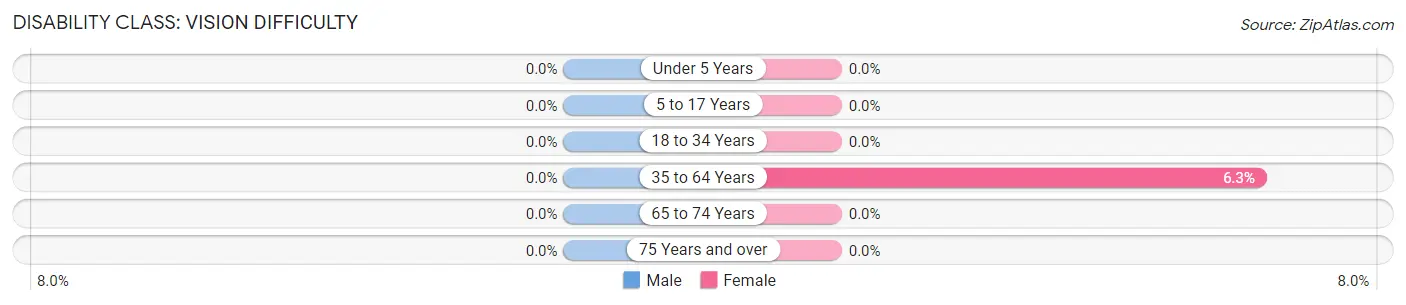
| Age Bracket | Male | Female |
| Under 5 Years | 0 (0.0%) | 0 (0.0%) |
| 5 to 17 Years | 0 (0.0%) | 0 (0.0%) |
| 18 to 34 Years | 0 (0.0%) | 0 (0.0%) |
| 35 to 64 Years | 0 (0.0%) | 20 (6.3%) |
| 65 to 74 Years | 0 (0.0%) | 0 (0.0%) |
| 75 Years and over | 0 (0.0%) | 0 (0.0%) |
Disability Class: Cognitive Difficulty
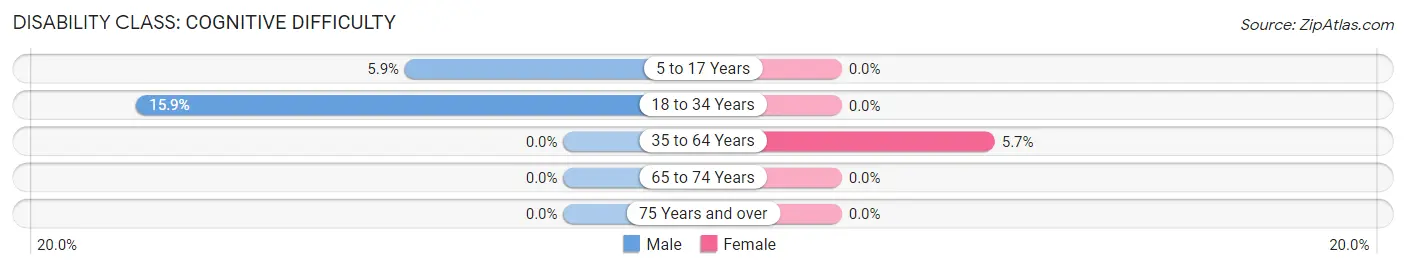
| Age Bracket | Male | Female |
| 5 to 17 Years | 11 (5.9%) | 0 (0.0%) |
| 18 to 34 Years | 26 (15.9%) | 0 (0.0%) |
| 35 to 64 Years | 0 (0.0%) | 18 (5.7%) |
| 65 to 74 Years | 0 (0.0%) | 0 (0.0%) |
| 75 Years and over | 0 (0.0%) | 0 (0.0%) |
Disability Class: Ambulatory Difficulty
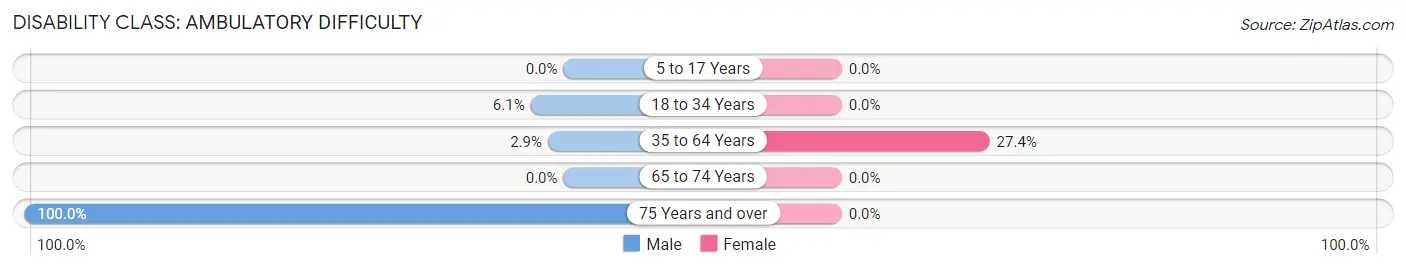
| Age Bracket | Male | Female |
| 5 to 17 Years | 0 (0.0%) | 0 (0.0%) |
| 18 to 34 Years | 10 (6.1%) | 0 (0.0%) |
| 35 to 64 Years | 7 (2.9%) | 87 (27.4%) |
| 65 to 74 Years | 0 (0.0%) | 0 (0.0%) |
| 75 Years and over | 19 (100.0%) | 0 (0.0%) |
Disability Class: Self-Care Difficulty
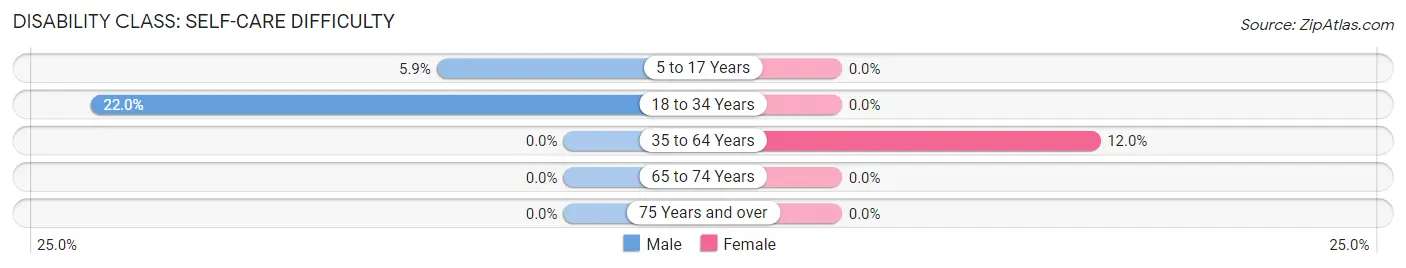
| Age Bracket | Male | Female |
| 5 to 17 Years | 11 (5.9%) | 0 (0.0%) |
| 18 to 34 Years | 36 (22.0%) | 0 (0.0%) |
| 35 to 64 Years | 0 (0.0%) | 38 (12.0%) |
| 65 to 74 Years | 0 (0.0%) | 0 (0.0%) |
| 75 Years and over | 0 (0.0%) | 0 (0.0%) |
Technology Access in Walker Valley
Computing Device Access in Walker Valley
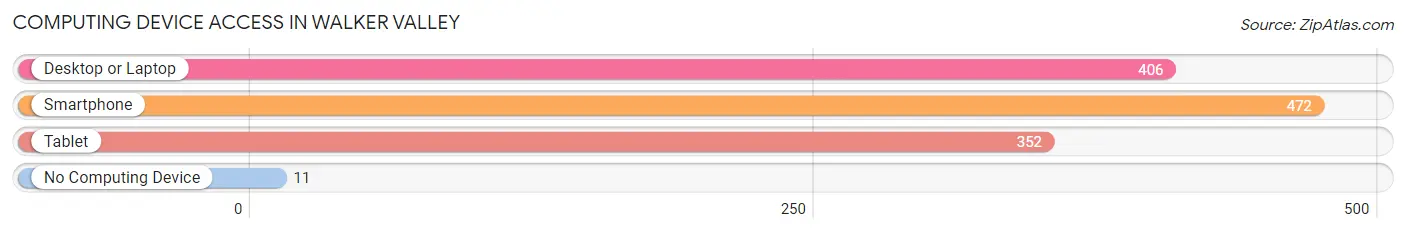
| Device Type | # Households | % Households |
| Desktop or Laptop | 406 | 84.1% |
| Smartphone | 472 | 97.7% |
| Tablet | 352 | 72.9% |
| No Computing Device | 11 | 2.3% |
| Total | 483 | 100.0% |
Internet Access in Walker Valley
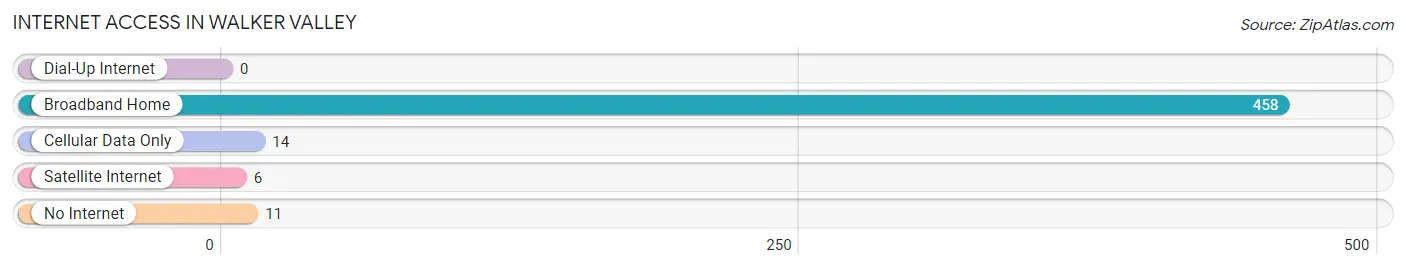
| Internet Type | # Households | % Households |
| Dial-Up Internet | 0 | 0.0% |
| Broadband Home | 458 | 94.8% |
| Cellular Data Only | 14 | 2.9% |
| Satellite Internet | 6 | 1.2% |
| No Internet | 11 | 2.3% |
| Total | 483 | 100.0% |
Walker Valley Summary
Walker Valley is a small hamlet located in the town of Shawangunk in Ulster County, New York. It is situated in the foothills of the Shawangunk Mountains, approximately 70 miles north of New York City. The hamlet is home to a population of approximately 1,000 people and is known for its rural charm and scenic beauty.
History
Walker Valley was first settled in the late 1700s by the Walker family, who were among the first settlers in the area. The family established a farm and a sawmill, which provided the community with lumber for building homes and other structures. The hamlet was named after the Walker family and was officially incorporated in 1845.
In the late 1800s, Walker Valley became a popular destination for tourists and vacationers. The hamlet was home to several resorts, including the Walker Valley House, which was built in 1887 and served as a popular destination for visitors from New York City.
In the early 1900s, the hamlet experienced a period of growth and development. The Walker Valley House was expanded and several new businesses were established, including a general store, a post office, and a blacksmith shop. The hamlet also became home to a number of churches, including the Walker Valley Methodist Church, which was established in 1891.
Geography
Walker Valley is located in the foothills of the Shawangunk Mountains in Ulster County, New York. The hamlet is situated at an elevation of 1,000 feet and is surrounded by rolling hills and forests. The hamlet is located approximately 70 miles north of New York City and is accessible via Route 209.
Economy
Walker Valley is a small, rural community with a limited economy. The hamlet is home to a few small businesses, including a general store, a post office, and a blacksmith shop. The hamlet is also home to several farms, which produce a variety of crops, including apples, peaches, and strawberries.
Demographics
As of the 2010 census, Walker Valley had a population of 1,000 people. The population is predominantly white (97.2%) and the median age is 44. The median household income is $50,000 and the median home value is $200,000. The hamlet is home to a number of churches, including the Walker Valley Methodist Church, which was established in 1891.
Common Questions
What is Per Capita Income in Walker Valley?
Per Capita income in Walker Valley is $38,123.
What is the Median Family Income in Walker Valley?
Median Family Income in Walker Valley is $90,984.
What is the Median Household income in Walker Valley?
Median Household Income in Walker Valley is $91,004.
What is Inequality or Gini Index in Walker Valley?
Inequality or Gini Index in Walker Valley is 0.31.
What is the Total Population of Walker Valley?
Total Population of Walker Valley is 1,440.
What is the Total Male Population of Walker Valley?
Total Male Population of Walker Valley is 722.
What is the Total Female Population of Walker Valley?
Total Female Population of Walker Valley is 718.
What is the Ratio of Males per 100 Females in Walker Valley?
There are 100.56 Males per 100 Females in Walker Valley.
What is the Ratio of Females per 100 Males in Walker Valley?
There are 99.45 Females per 100 Males in Walker Valley.
What is the Median Population Age in Walker Valley?
Median Population Age in Walker Valley is 36.8 Years.
What is the Average Family Size in Walker Valley
Average Family Size in Walker Valley is 3.1 People.
What is the Average Household Size in Walker Valley
Average Household Size in Walker Valley is 2.9 People.
How Large is the Labor Force in Walker Valley?
There are 828 People in the Labor Forcein in Walker Valley.
What is the Percentage of People in the Labor Force in Walker Valley?
70.3% of People are in the Labor Force in Walker Valley.
What is the Unemployment Rate in Walker Valley?
Unemployment Rate in Walker Valley is 0.7%.