Cortland West, NY Map & Demographics
Cortland West Map
Cortland West Overview
$44,112
PER CAPITA INCOME
$136,136
AVG FAMILY INCOME
$105,417
AVG HOUSEHOLD INCOME
25.4%
WAGE / INCOME GAP [ % ]
74.6¢/ $1
WAGE / INCOME GAP [ $ ]
0.27
INEQUALITY / GINI INDEX
1,168
TOTAL POPULATION
667
MALE POPULATION
501
FEMALE POPULATION
133.13
MALES / 100 FEMALES
75.11
FEMALES / 100 MALES
46.2
MEDIAN AGE
2.8
AVG FAMILY SIZE
2.6
AVG HOUSEHOLD SIZE
674
LABOR FORCE [ PEOPLE ]
68.4%
PERCENT IN LABOR FORCE
5.3%
UNEMPLOYMENT RATE
Income in Cortland West
Income Overview in Cortland West
Per Capita Income in Cortland West is $44,112, while median incomes of families and households are $136,136 and $105,417 respectively.
| Characteristic | Number | Measure |
| Per Capita Income | 1,168 | $44,112 |
| Median Family Income | 348 | $136,136 |
| Mean Family Income | 348 | $126,149 |
| Median Household Income | 434 | $105,417 |
| Mean Household Income | 434 | $116,763 |
| Income Deficit | 348 | $0 |
| Wage / Income Gap (%) | 1,168 | 25.38% |
| Wage / Income Gap ($) | 1,168 | 74.62¢ per $1 |
| Gini / Inequality Index | 1,168 | 0.27 |
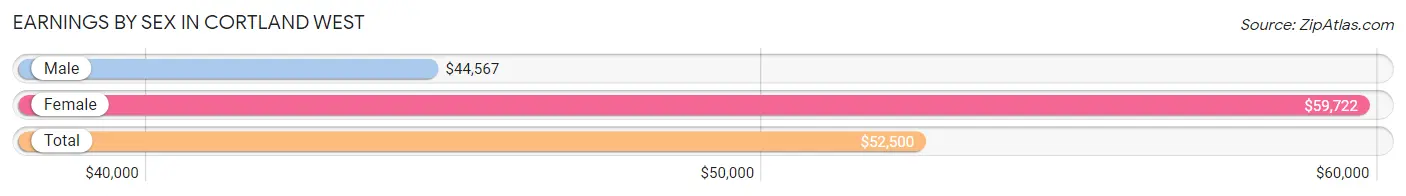
Earnings by Sex in Cortland West
Average Earnings in Cortland West are $52,500, $44,567 for men and $59,722 for women, a difference of 25.4%.
| Sex | Number | Average Earnings |
| Male | 468 (64.8%) | $44,567 |
| Female | 254 (35.2%) | $59,722 |
| Total | 722 (100.0%) | $52,500 |
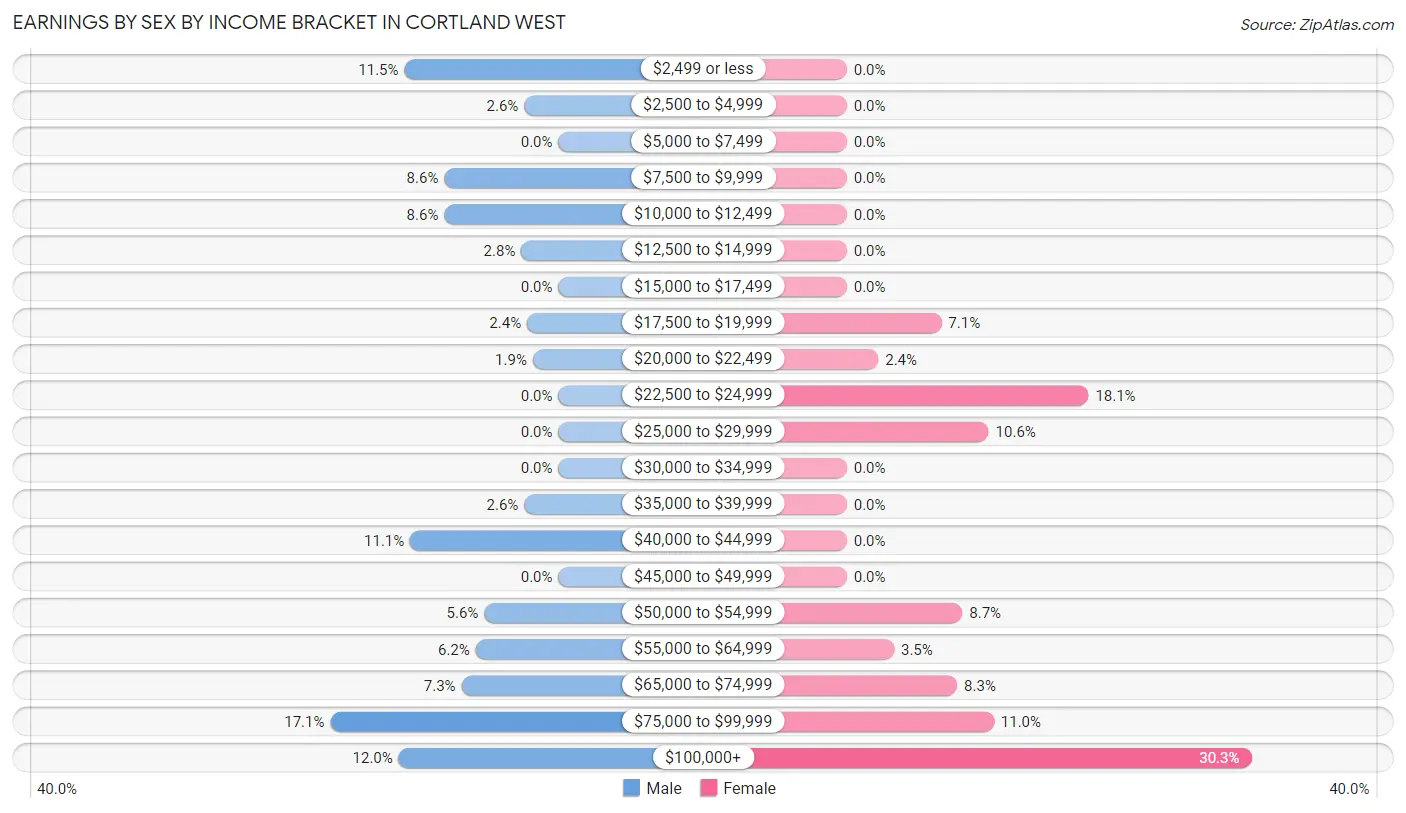
Earnings by Sex by Income Bracket in Cortland West
The most common earnings brackets in Cortland West are $75,000 to $99,999 for men (80 | 17.1%) and $100,000+ for women (77 | 30.3%).
| Income | Male | Female |
| $2,499 or less | 54 (11.5%) | 0 (0.0%) |
| $2,500 to $4,999 | 12 (2.6%) | 0 (0.0%) |
| $5,000 to $7,499 | 0 (0.0%) | 0 (0.0%) |
| $7,500 to $9,999 | 40 (8.6%) | 0 (0.0%) |
| $10,000 to $12,499 | 40 (8.6%) | 0 (0.0%) |
| $12,500 to $14,999 | 13 (2.8%) | 0 (0.0%) |
| $15,000 to $17,499 | 0 (0.0%) | 0 (0.0%) |
| $17,500 to $19,999 | 11 (2.4%) | 18 (7.1%) |
| $20,000 to $22,499 | 9 (1.9%) | 6 (2.4%) |
| $22,500 to $24,999 | 0 (0.0%) | 46 (18.1%) |
| $25,000 to $29,999 | 0 (0.0%) | 27 (10.6%) |
| $30,000 to $34,999 | 0 (0.0%) | 0 (0.0%) |
| $35,000 to $39,999 | 12 (2.6%) | 0 (0.0%) |
| $40,000 to $44,999 | 52 (11.1%) | 0 (0.0%) |
| $45,000 to $49,999 | 0 (0.0%) | 0 (0.0%) |
| $50,000 to $54,999 | 26 (5.6%) | 22 (8.7%) |
| $55,000 to $64,999 | 29 (6.2%) | 9 (3.5%) |
| $65,000 to $74,999 | 34 (7.3%) | 21 (8.3%) |
| $75,000 to $99,999 | 80 (17.1%) | 28 (11.0%) |
| $100,000+ | 56 (12.0%) | 77 (30.3%) |
| Total | 468 (100.0%) | 254 (100.0%) |
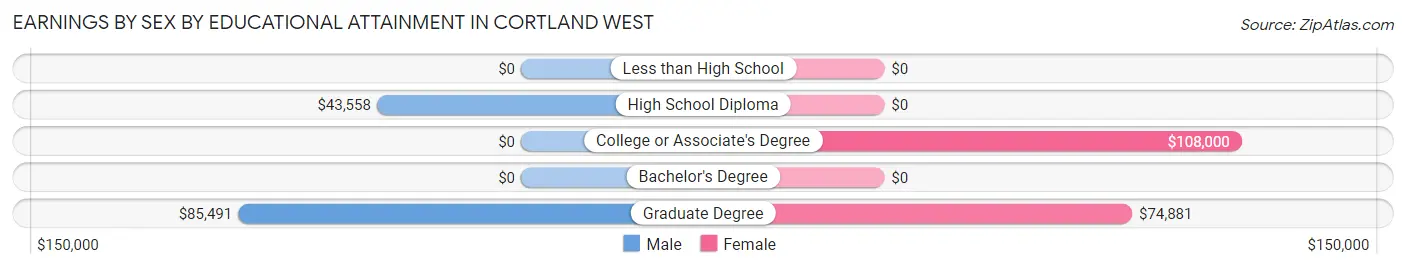
Earnings by Sex by Educational Attainment in Cortland West
Average earnings in Cortland West are $51,726 for men and $82,014 for women, a difference of 36.9%. Men with an educational attainment of graduate degree enjoy the highest average annual earnings of $85,491, while those with high school diploma education earn the least with $43,558. Women with an educational attainment of college or associate's degree earn the most with the average annual earnings of $108,000, while those with graduate degree education have the smallest earnings of $74,881.
| Educational Attainment | Male Income | Female Income |
| Less than High School | - | - |
| High School Diploma | $43,558 | $0 |
| College or Associate's Degree | - | - |
| Bachelor's Degree | - | - |
| Graduate Degree | $85,491 | $74,881 |
| Total | $51,726 | $82,014 |
Family Income in Cortland West
Family Income Brackets in Cortland West
According to the Cortland West family income data, there are 151 families falling into the $150,000 to $199,999 income range, which is the most common income bracket and makes up 43.4% of all families.
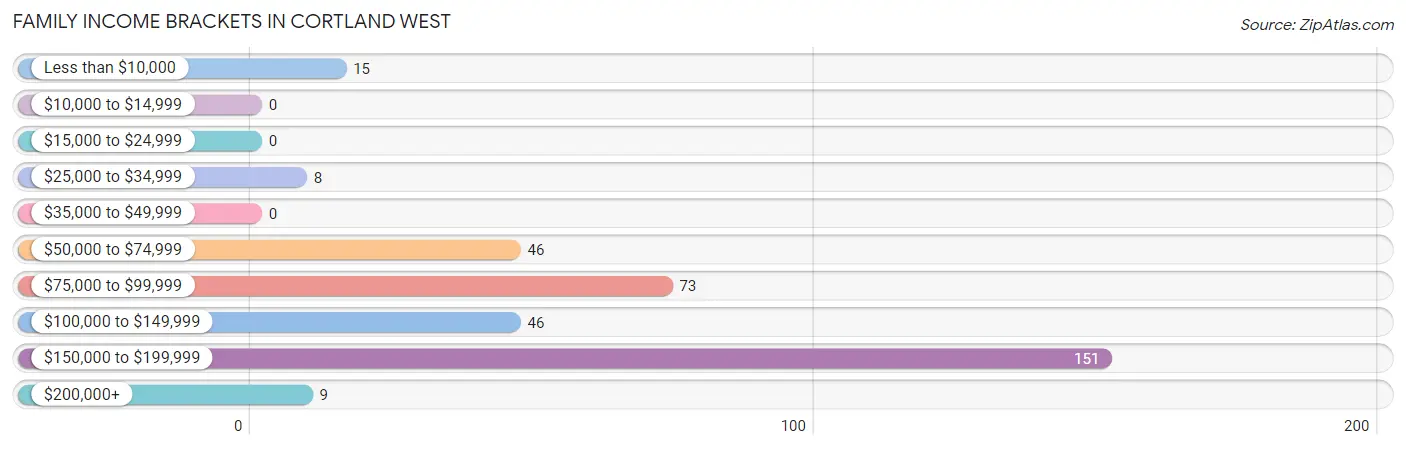
| Income Bracket | # Families | % Families |
| Less than $10,000 | 15 | 4.3% |
| $10,000 to $14,999 | 0 | 0.0% |
| $15,000 to $24,999 | 0 | 0.0% |
| $25,000 to $34,999 | 8 | 2.3% |
| $35,000 to $49,999 | 0 | 0.0% |
| $50,000 to $74,999 | 46 | 13.2% |
| $75,000 to $99,999 | 73 | 21.0% |
| $100,000 to $149,999 | 46 | 13.2% |
| $150,000 to $199,999 | 151 | 43.4% |
| $200,000+ | 9 | 2.6% |
Family Income by Famaliy Size in Cortland West
3-person families (137 | 39.4%) account for the highest median family income in Cortland West with $158,159 per family, while 3-person families (137 | 39.4%) have the highest median income of $52,720 per family member.
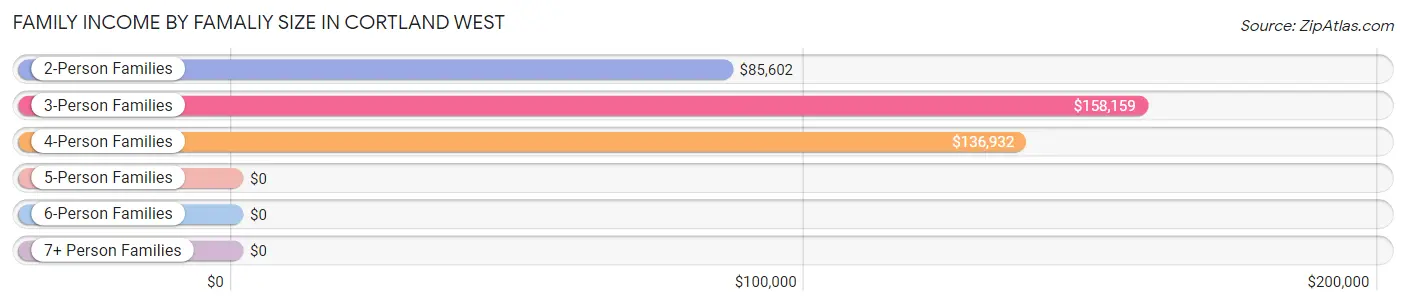
| Income Bracket | # Families | Median Income |
| 2-Person Families | 153 (44.0%) | $85,602 |
| 3-Person Families | 137 (39.4%) | $158,159 |
| 4-Person Families | 41 (11.8%) | $136,932 |
| 5-Person Families | 17 (4.9%) | $0 |
| 6-Person Families | 0 (0.0%) | $0 |
| 7+ Person Families | 0 (0.0%) | $0 |
| Total | 348 (100.0%) | $136,136 |
Family Income by Number of Earners in Cortland West
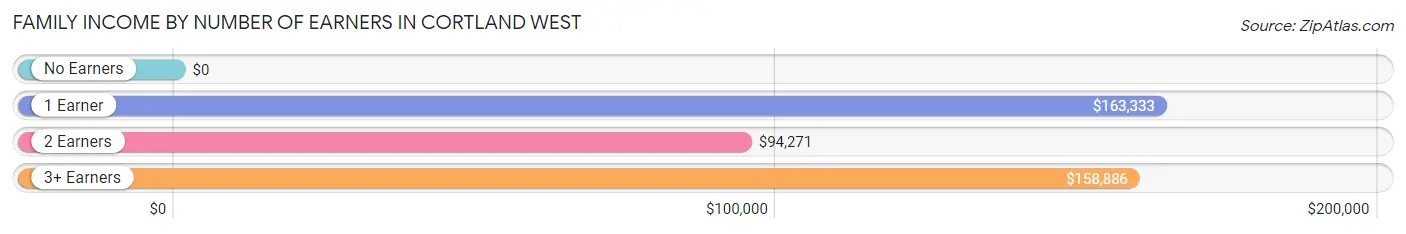
| Number of Earners | # Families | Median Income |
| No Earners | 46 (13.2%) | $0 |
| 1 Earner | 44 (12.6%) | $163,333 |
| 2 Earners | 175 (50.3%) | $94,271 |
| 3+ Earners | 83 (23.8%) | $158,886 |
| Total | 348 (100.0%) | $136,136 |
Household Income in Cortland West
Household Income Brackets in Cortland West
With 163 households falling in the category, the $150,000 to $199,999 income range is the most frequent in Cortland West, accounting for 37.6% of all households.
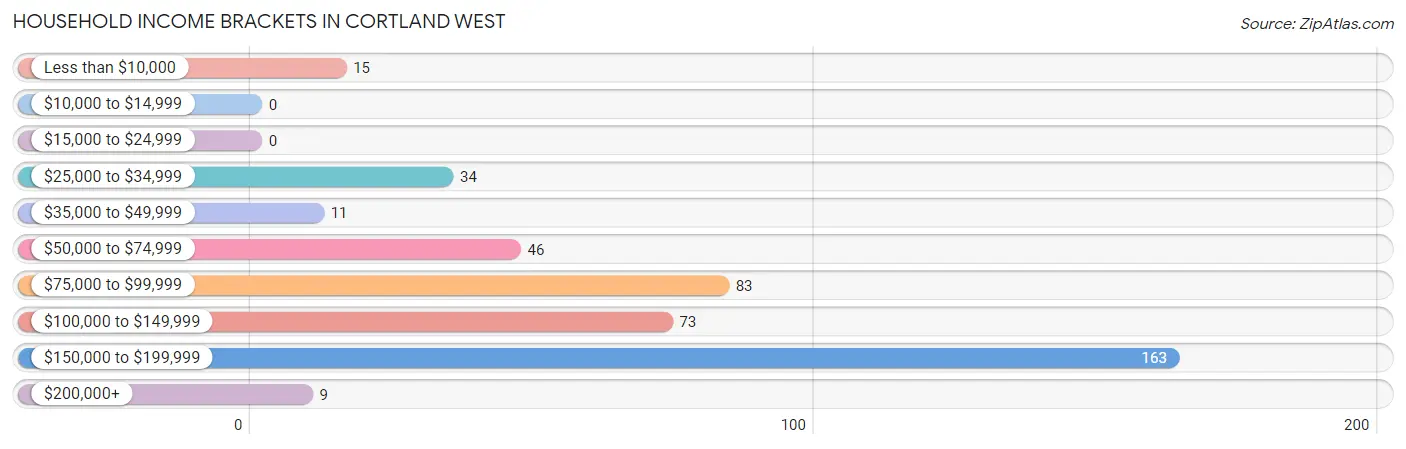
| Income Bracket | # Households | % Households |
| Less than $10,000 | 15 | 3.5% |
| $10,000 to $14,999 | 0 | 0.0% |
| $15,000 to $24,999 | 0 | 0.0% |
| $25,000 to $34,999 | 34 | 7.8% |
| $35,000 to $49,999 | 11 | 2.5% |
| $50,000 to $74,999 | 46 | 10.6% |
| $75,000 to $99,999 | 83 | 19.1% |
| $100,000 to $149,999 | 73 | 16.8% |
| $150,000 to $199,999 | 163 | 37.6% |
| $200,000+ | 9 | 2.1% |
Household Income by Householder Age in Cortland West
The median household income in Cortland West is $105,417, with the highest median household income of $158,091 found in the 45 to 64 years age bracket for the primary householder. A total of 118 households (27.2%) fall into this category. Meanwhile, the 15 to 24 years age bracket for the primary householder has the lowest median household income of $0, with 27 households (6.2%) in this group.
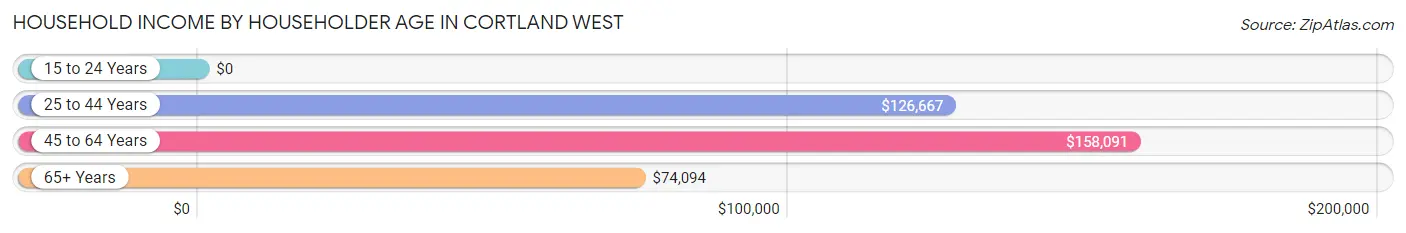
| Income Bracket | # Households | Median Income |
| 15 to 24 Years | 27 (6.2%) | $0 |
| 25 to 44 Years | 106 (24.4%) | $126,667 |
| 45 to 64 Years | 118 (27.2%) | $158,091 |
| 65+ Years | 183 (42.2%) | $74,094 |
| Total | 434 (100.0%) | $105,417 |
Poverty in Cortland West
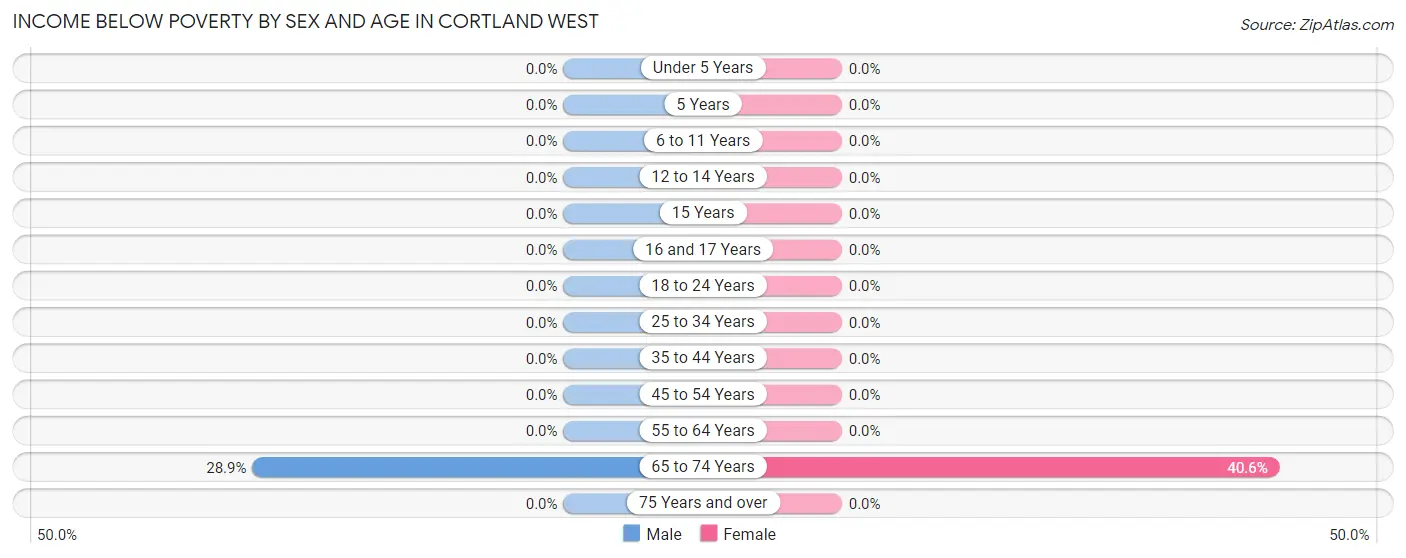
Income Below Poverty by Sex and Age in Cortland West
With 6.1% poverty level for males and 2.6% for females among the residents of Cortland West, 65 to 74 year old males and 65 to 74 year old females are the most vulnerable to poverty, with 41 males (28.9%) and 13 females (40.6%) in their respective age groups living below the poverty level.
| Age Bracket | Male | Female |
| Under 5 Years | 0 (0.0%) | 0 (0.0%) |
| 5 Years | 0 (0.0%) | 0 (0.0%) |
| 6 to 11 Years | 0 (0.0%) | 0 (0.0%) |
| 12 to 14 Years | 0 (0.0%) | 0 (0.0%) |
| 15 Years | 0 (0.0%) | 0 (0.0%) |
| 16 and 17 Years | 0 (0.0%) | 0 (0.0%) |
| 18 to 24 Years | 0 (0.0%) | 0 (0.0%) |
| 25 to 34 Years | 0 (0.0%) | 0 (0.0%) |
| 35 to 44 Years | 0 (0.0%) | 0 (0.0%) |
| 45 to 54 Years | 0 (0.0%) | 0 (0.0%) |
| 55 to 64 Years | 0 (0.0%) | 0 (0.0%) |
| 65 to 74 Years | 41 (28.9%) | 13 (40.6%) |
| 75 Years and over | 0 (0.0%) | 0 (0.0%) |
| Total | 41 (6.1%) | 13 (2.6%) |
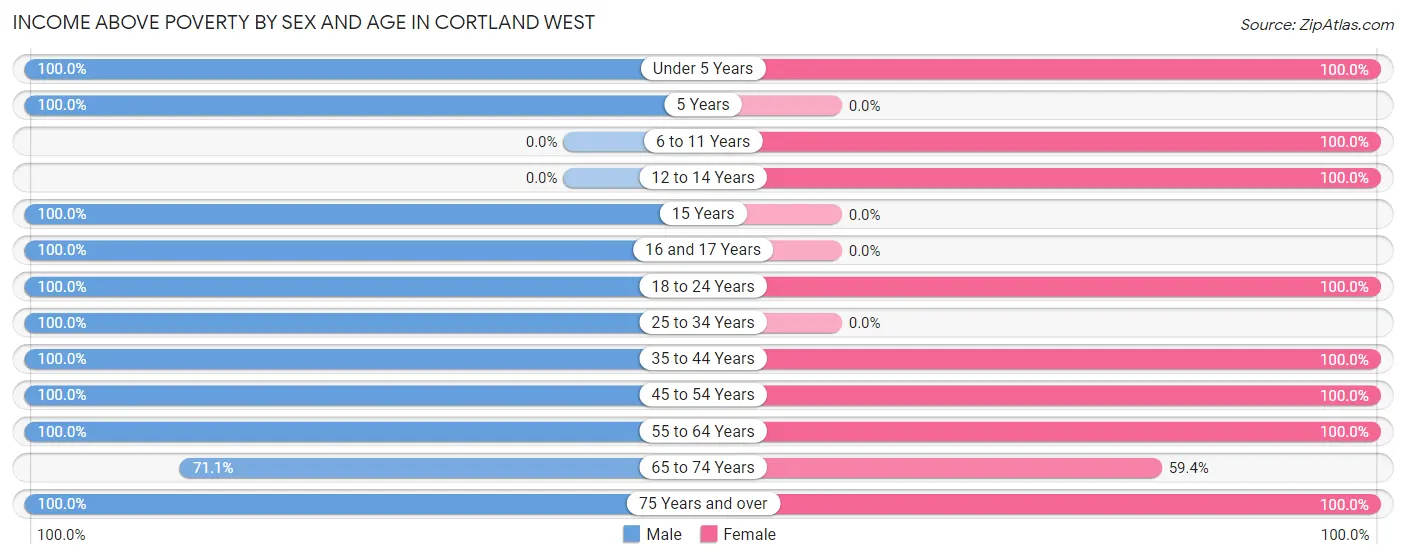
Income Above Poverty by Sex and Age in Cortland West
According to the poverty statistics in Cortland West, males aged under 5 years and females aged under 5 years are the age groups that are most secure financially, with 100.0% of males and 100.0% of females in these age groups living above the poverty line.
| Age Bracket | Male | Female |
| Under 5 Years | 18 (100.0%) | 52 (100.0%) |
| 5 Years | 22 (100.0%) | 0 (0.0%) |
| 6 to 11 Years | 0 (0.0%) | 33 (100.0%) |
| 12 to 14 Years | 0 (0.0%) | 32 (100.0%) |
| 15 Years | 26 (100.0%) | 0 (0.0%) |
| 16 and 17 Years | 12 (100.0%) | 0 (0.0%) |
| 18 to 24 Years | 73 (100.0%) | 73 (100.0%) |
| 25 to 34 Years | 101 (100.0%) | 0 (0.0%) |
| 35 to 44 Years | 62 (100.0%) | 77 (100.0%) |
| 45 to 54 Years | 73 (100.0%) | 43 (100.0%) |
| 55 to 64 Years | 115 (100.0%) | 119 (100.0%) |
| 65 to 74 Years | 101 (71.1%) | 19 (59.4%) |
| 75 Years and over | 23 (100.0%) | 40 (100.0%) |
| Total | 626 (93.9%) | 488 (97.4%) |
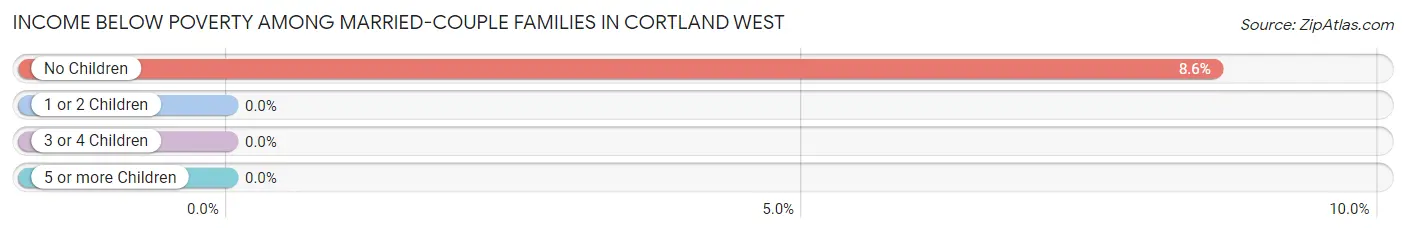
Income Below Poverty Among Married-Couple Families in Cortland West
The poverty statistics for married-couple families in Cortland West show that 5.0% or 15 of the total 302 families live below the poverty line. Families with no children have the highest poverty rate of 8.6%, comprising of 15 families. On the other hand, families with 1 or 2 children have the lowest poverty rate of 0.0%, which includes 0 families.
| Children | Above Poverty | Below Poverty |
| No Children | 160 (91.4%) | 15 (8.6%) |
| 1 or 2 Children | 127 (100.0%) | 0 (0.0%) |
| 3 or 4 Children | 0 (0.0%) | 0 (0.0%) |
| 5 or more Children | 0 (0.0%) | 0 (0.0%) |
| Total | 287 (95.0%) | 15 (5.0%) |
Income Below Poverty Among Single-Parent Households in Cortland West
| Children | Single Father | Single Mother |
| No Children | 0 (0.0%) | 0 (0.0%) |
| 1 or 2 Children | 0 (0.0%) | 0 (0.0%) |
| 3 or 4 Children | 0 (0.0%) | 0 (0.0%) |
| 5 or more Children | 0 (0.0%) | 0 (0.0%) |
| Total | 0 (0.0%) | 0 (0.0%) |
Income Below Poverty Among Married-Couple vs Single-Parent Households in Cortland West
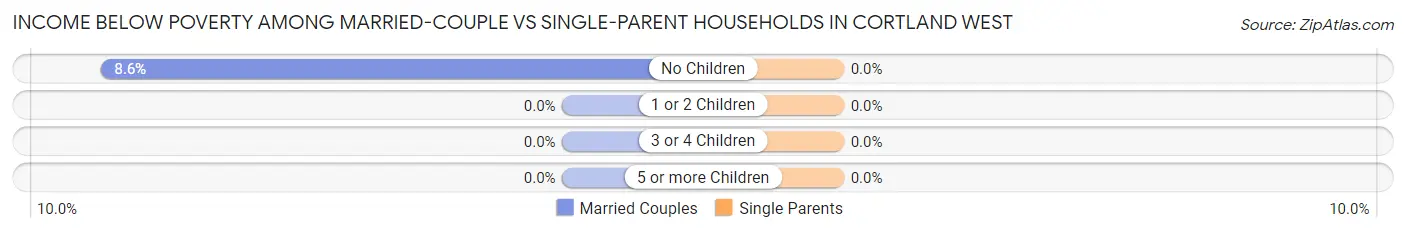
| Children | Married-Couple Families | Single-Parent Households |
| No Children | 15 (8.6%) | 0 (0.0%) |
| 1 or 2 Children | 0 (0.0%) | 0 (0.0%) |
| 3 or 4 Children | 0 (0.0%) | 0 (0.0%) |
| 5 or more Children | 0 (0.0%) | 0 (0.0%) |
| Total | 15 (5.0%) | 0 (0.0%) |
Race in Cortland West
The most populous races in Cortland West are White / Caucasian (1,058 | 90.6%), Black / African American (56 | 4.8%), and Asian (29 | 2.5%).
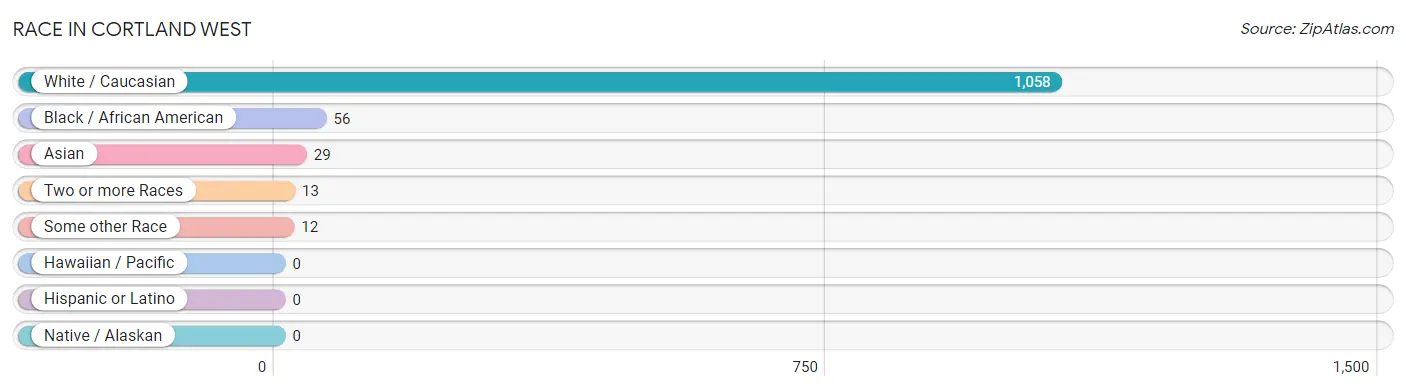
| Race | # Population | % Population |
| Asian | 29 | 2.5% |
| Black / African American | 56 | 4.8% |
| Hawaiian / Pacific | 0 | 0.0% |
| Hispanic or Latino | 0 | 0.0% |
| Native / Alaskan | 0 | 0.0% |
| White / Caucasian | 1,058 | 90.6% |
| Two or more Races | 13 | 1.1% |
| Some other Race | 12 | 1.0% |
| Total | 1,168 | 100.0% |
Ancestry in Cortland West
The most populous ancestries reported in Cortland West are Irish (292 | 25.0%), Italian (230 | 19.7%), American (178 | 15.2%), English (148 | 12.7%), and Polish (88 | 7.5%), together accounting for 80.1% of all Cortland West residents.
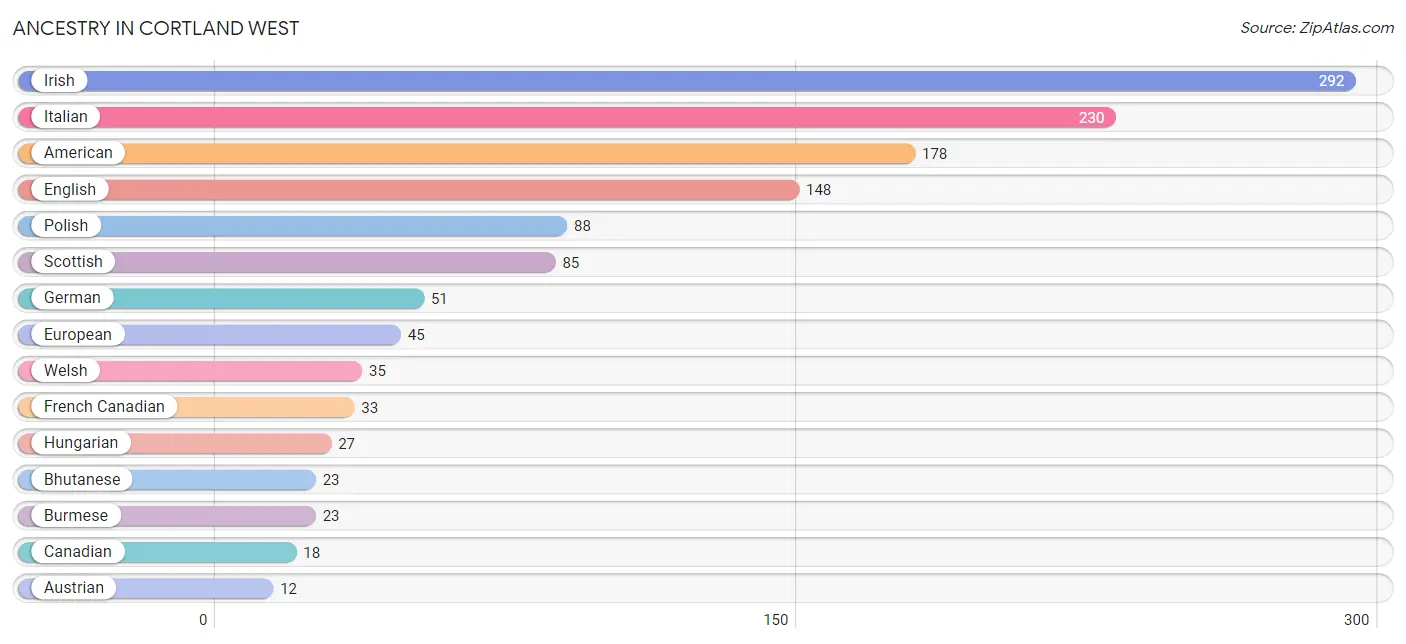
| Ancestry | # Population | % Population |
| American | 178 | 15.2% |
| Arab | 11 | 0.9% |
| Austrian | 12 | 1.0% |
| Bhutanese | 23 | 2.0% |
| Burmese | 23 | 2.0% |
| Canadian | 18 | 1.5% |
| English | 148 | 12.7% |
| European | 45 | 3.8% |
| French | 6 | 0.5% |
| French Canadian | 33 | 2.8% |
| German | 51 | 4.4% |
| Hungarian | 27 | 2.3% |
| Indian (Asian) | 10 | 0.9% |
| Irish | 292 | 25.0% |
| Italian | 230 | 19.7% |
| Lebanese | 11 | 0.9% |
| Lithuanian | 12 | 1.0% |
| Polish | 88 | 7.5% |
| Romanian | 6 | 0.5% |
| Scottish | 85 | 7.3% |
| Sri Lankan | 9 | 0.8% |
| Swedish | 11 | 0.9% |
| Welsh | 35 | 3.0% | View All 23 Rows |
Immigrants in Cortland West
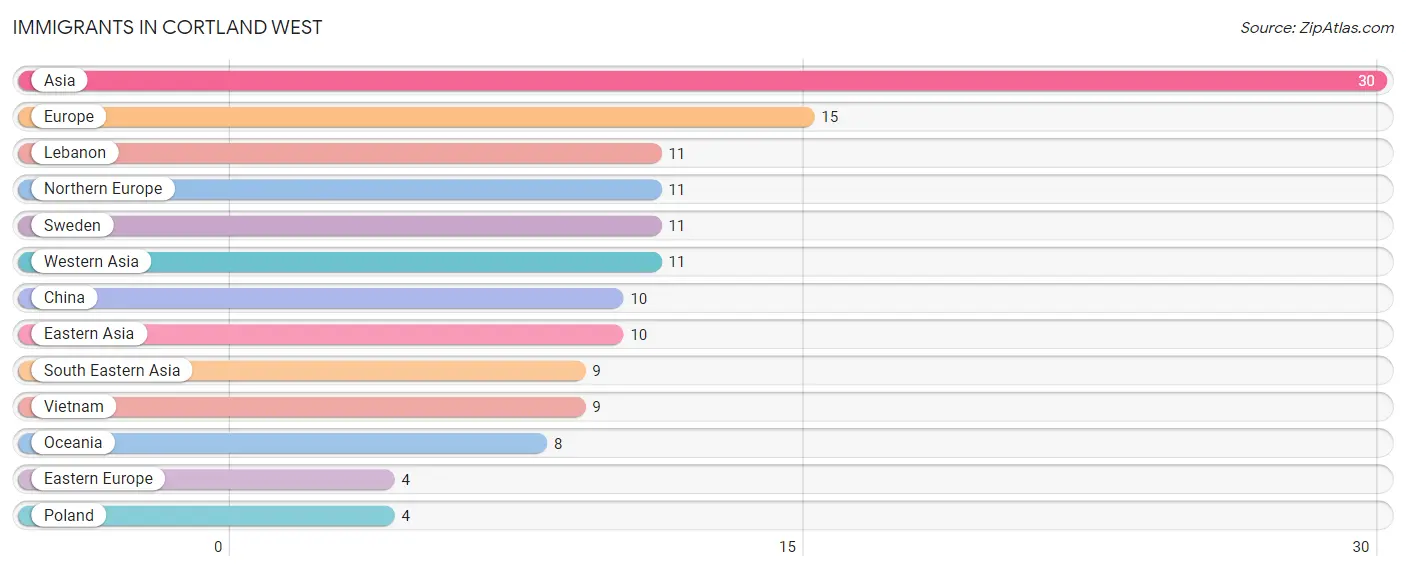
The most numerous immigrant groups reported in Cortland West came from Asia (30 | 2.6%), Europe (15 | 1.3%), Lebanon (11 | 0.9%), Northern Europe (11 | 0.9%), and Sweden (11 | 0.9%), together accounting for 6.7% of all Cortland West residents.
| Immigration Origin | # Population | % Population |
| Asia | 30 | 2.6% |
| China | 10 | 0.9% |
| Eastern Asia | 10 | 0.9% |
| Eastern Europe | 4 | 0.3% |
| Europe | 15 | 1.3% |
| Lebanon | 11 | 0.9% |
| Northern Europe | 11 | 0.9% |
| Oceania | 8 | 0.7% |
| Poland | 4 | 0.3% |
| South Eastern Asia | 9 | 0.8% |
| Sweden | 11 | 0.9% |
| Vietnam | 9 | 0.8% |
| Western Asia | 11 | 0.9% | View All 13 Rows |
Sex and Age in Cortland West
Sex and Age in Cortland West
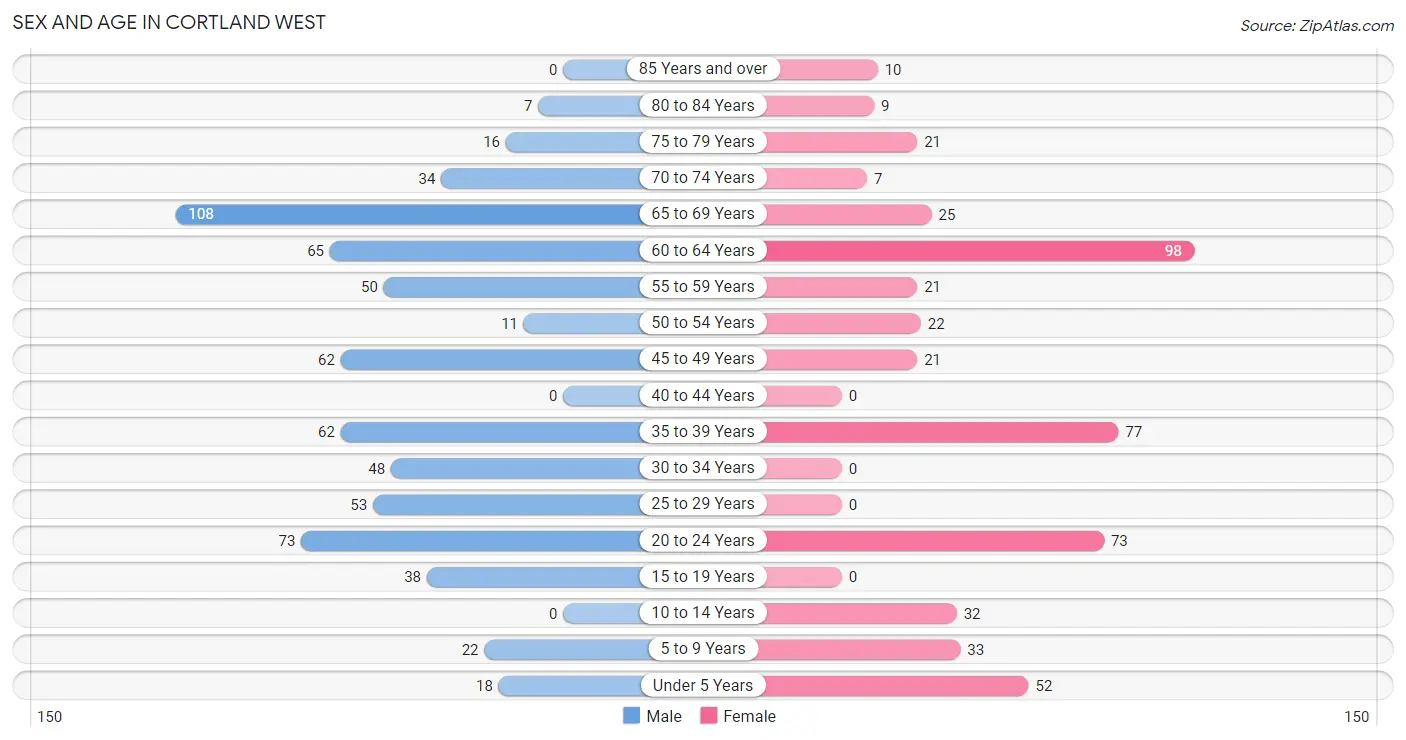
The most populous age groups in Cortland West are 65 to 69 Years (108 | 16.2%) for men and 60 to 64 Years (98 | 19.6%) for women.
| Age Bracket | Male | Female |
| Under 5 Years | 18 (2.7%) | 52 (10.4%) |
| 5 to 9 Years | 22 (3.3%) | 33 (6.6%) |
| 10 to 14 Years | 0 (0.0%) | 32 (6.4%) |
| 15 to 19 Years | 38 (5.7%) | 0 (0.0%) |
| 20 to 24 Years | 73 (10.9%) | 73 (14.6%) |
| 25 to 29 Years | 53 (8.0%) | 0 (0.0%) |
| 30 to 34 Years | 48 (7.2%) | 0 (0.0%) |
| 35 to 39 Years | 62 (9.3%) | 77 (15.4%) |
| 40 to 44 Years | 0 (0.0%) | 0 (0.0%) |
| 45 to 49 Years | 62 (9.3%) | 21 (4.2%) |
| 50 to 54 Years | 11 (1.7%) | 22 (4.4%) |
| 55 to 59 Years | 50 (7.5%) | 21 (4.2%) |
| 60 to 64 Years | 65 (9.8%) | 98 (19.6%) |
| 65 to 69 Years | 108 (16.2%) | 25 (5.0%) |
| 70 to 74 Years | 34 (5.1%) | 7 (1.4%) |
| 75 to 79 Years | 16 (2.4%) | 21 (4.2%) |
| 80 to 84 Years | 7 (1.1%) | 9 (1.8%) |
| 85 Years and over | 0 (0.0%) | 10 (2.0%) |
| Total | 667 (100.0%) | 501 (100.0%) |
Families and Households in Cortland West
Median Family Size in Cortland West
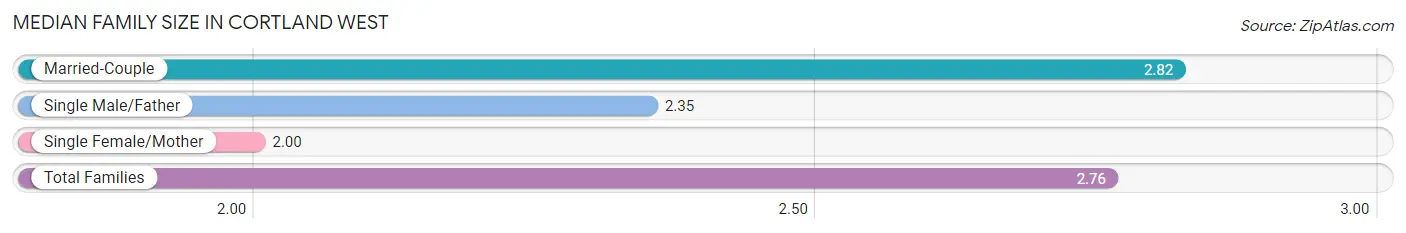
The median family size in Cortland West is 2.76 persons per family, with married-couple families (302 | 86.8%) accounting for the largest median family size of 2.82 persons per family. On the other hand, single female/mother families (6 | 1.7%) represent the smallest median family size with 2.00 persons per family.
| Family Type | # Families | Family Size |
| Married-Couple | 302 (86.8%) | 2.82 |
| Single Male/Father | 40 (11.5%) | 2.35 |
| Single Female/Mother | 6 (1.7%) | 2.00 |
| Total Families | 348 (100.0%) | 2.76 |
Median Household Size in Cortland West
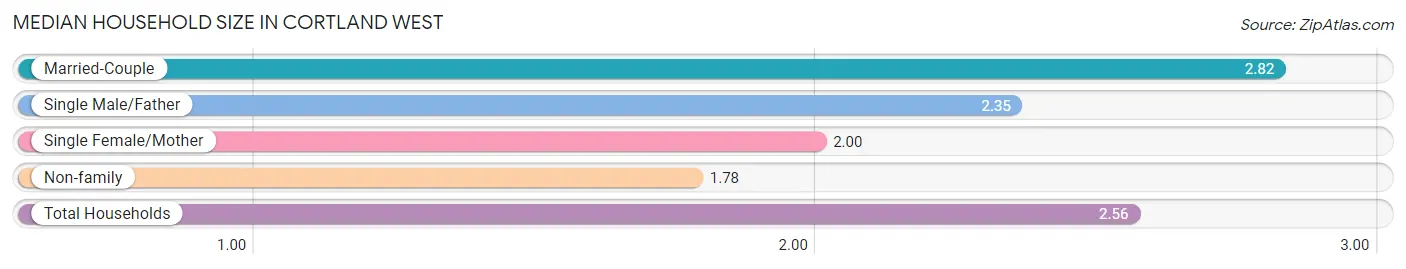
The median household size in Cortland West is 2.56 persons per household, with married-couple households (302 | 69.6%) accounting for the largest median household size of 2.82 persons per household. non-family households (86 | 19.8%) represent the smallest median household size with 1.78 persons per household.
| Household Type | # Households | Household Size |
| Married-Couple | 302 (69.6%) | 2.82 |
| Single Male/Father | 40 (9.2%) | 2.35 |
| Single Female/Mother | 6 (1.4%) | 2.00 |
| Non-family | 86 (19.8%) | 1.78 |
| Total Households | 434 (100.0%) | 2.56 |
Household Size by Marriage Status in Cortland West
Out of a total of 434 households in Cortland West, 348 (80.2%) are family households, while 86 (19.8%) are nonfamily households. The most numerous type of family households are 2-person households, comprising 153, and the most common type of nonfamily households are 2-person households, comprising 53.
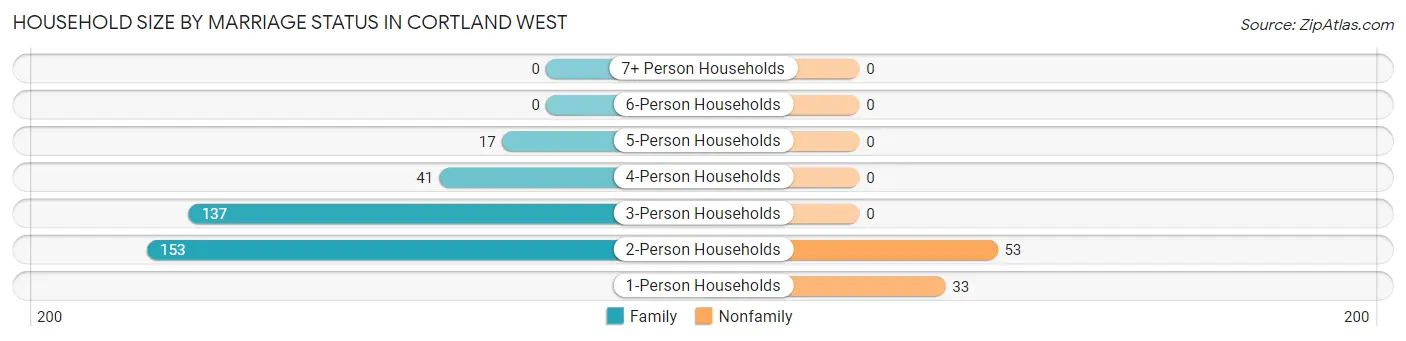
| Household Size | Family Households | Nonfamily Households |
| 1-Person Households | - | 33 (7.6%) |
| 2-Person Households | 153 (35.2%) | 53 (12.2%) |
| 3-Person Households | 137 (31.6%) | 0 (0.0%) |
| 4-Person Households | 41 (9.5%) | 0 (0.0%) |
| 5-Person Households | 17 (3.9%) | 0 (0.0%) |
| 6-Person Households | 0 (0.0%) | 0 (0.0%) |
| 7+ Person Households | 0 (0.0%) | 0 (0.0%) |
| Total | 348 (80.2%) | 86 (19.8%) |
Female Fertility in Cortland West
Fertility by Age in Cortland West
| Age Bracket | Women with Births | Births / 1,000 Women |
| 15 to 19 years | 0 (0.0%) | 0.0 |
| 20 to 34 years | 0 (0.0%) | 0.0 |
| 35 to 50 years | 0 (0.0%) | 0.0 |
| Total | 0 (0.0%) | 0.0 |
Fertility by Age by Marriage Status in Cortland West
| Age Bracket | Married | Unmarried |
| 15 to 19 years | 0 (0.0%) | 0 (0.0%) |
| 20 to 34 years | 0 (0.0%) | 0 (0.0%) |
| 35 to 50 years | 0 (0.0%) | 0 (0.0%) |
| Total | 0 (0.0%) | 0 (0.0%) |
Fertility by Education in Cortland West
| Educational Attainment | Women with Births | Births / 1,000 Women |
| Less than High School | 0 (0.0%) | 0.0 |
| High School Diploma | 0 (0.0%) | 0.0 |
| College or Associate's Degree | 0 (0.0%) | 0.0 |
| Bachelor's Degree | 0 (0.0%) | 0.0 |
| Graduate Degree | 0 (0.0%) | 0.0 |
| Total | 0 (0.0%) | 0.0 |
Fertility by Education by Marriage Status in Cortland West
| Educational Attainment | Married | Unmarried |
| Less than High School | 0 (0.0%) | 0 (0.0%) |
| High School Diploma | 0 (0.0%) | 0 (0.0%) |
| College or Associate's Degree | 0 (0.0%) | 0 (0.0%) |
| Bachelor's Degree | 0 (0.0%) | 0 (0.0%) |
| Graduate Degree | 0 (0.0%) | 0 (0.0%) |
| Total | 0 (0.0%) | 0 (0.0%) |
Employment Characteristics in Cortland West
Employment by Class of Employer in Cortland West
Among the 622 employed individuals in Cortland West, private company employees (358 | 57.6%), self-employed (not incorporated) (107 | 17.2%), and not-for-profit organizations (65 | 10.4%) make up the most common classes of employment.
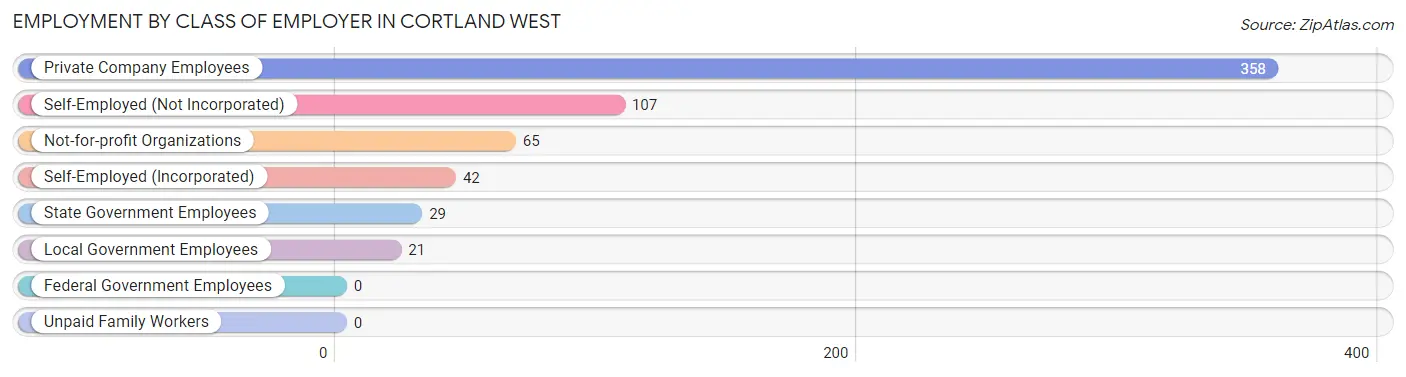
| Employer Class | # Employees | % Employees |
| Private Company Employees | 358 | 57.6% |
| Self-Employed (Incorporated) | 42 | 6.8% |
| Self-Employed (Not Incorporated) | 107 | 17.2% |
| Not-for-profit Organizations | 65 | 10.4% |
| Local Government Employees | 21 | 3.4% |
| State Government Employees | 29 | 4.7% |
| Federal Government Employees | 0 | 0.0% |
| Unpaid Family Workers | 0 | 0.0% |
| Total | 622 | 100.0% |
Employment Status by Age in Cortland West
According to the labor force statistics for Cortland West, out of the total population over 16 years of age (985), 68.4% or 674 individuals are in the labor force, with 5.3% or 36 of them unemployed. The age group with the highest labor force participation rate is 16 to 19 years, with 100.0% or 12 individuals in the labor force. Within the labor force, the 55 to 59 years age range has the highest percentage of unemployed individuals, with 34.0% or 17 of them being unemployed.
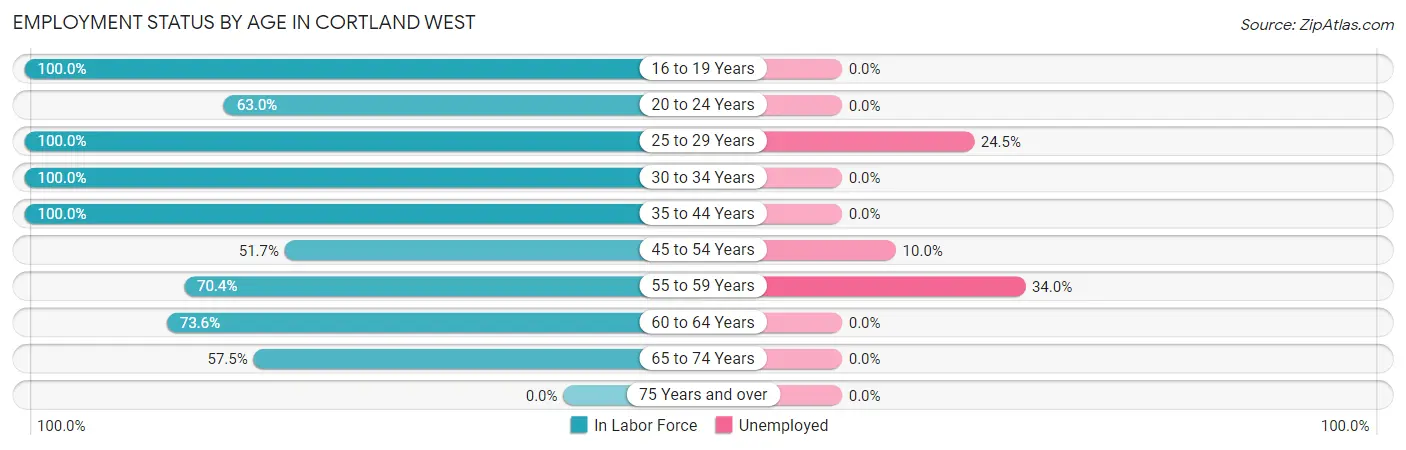
| Age Bracket | In Labor Force | Unemployed |
| 16 to 19 Years | 12 (100.0%) | 0 (0.0%) |
| 20 to 24 Years | 92 (63.0%) | 0 (0.0%) |
| 25 to 29 Years | 53 (100.0%) | 13 (24.5%) |
| 30 to 34 Years | 48 (100.0%) | 0 (0.0%) |
| 35 to 44 Years | 139 (100.0%) | 0 (0.0%) |
| 45 to 54 Years | 60 (51.7%) | 6 (10.0%) |
| 55 to 59 Years | 50 (70.4%) | 17 (34.0%) |
| 60 to 64 Years | 120 (73.6%) | 0 (0.0%) |
| 65 to 74 Years | 100 (57.5%) | 0 (0.0%) |
| 75 Years and over | 0 (0.0%) | 0 (0.0%) |
| Total | 674 (68.4%) | 36 (5.3%) |
Employment Status by Educational Attainment in Cortland West
According to labor force statistics for Cortland West, 79.7% of individuals (470) out of the total population between 25 and 64 years of age (590) are in the labor force, with 7.7% or 36 of them being unemployed. The group with the highest labor force participation rate are those with the educational attainment of high school diploma, with 100.0% or 76 individuals in the labor force. Within the labor force, individuals with high school diploma education have the highest percentage of unemployment, with 25.0% or 19 of them being unemployed.
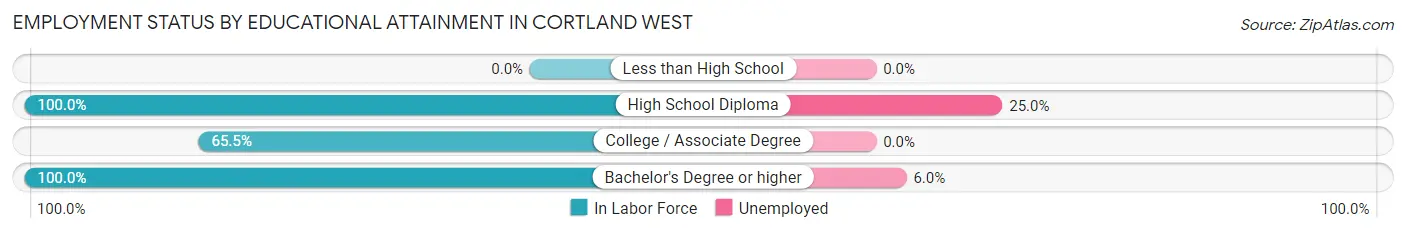
| Educational Attainment | In Labor Force | Unemployed |
| Less than High School | 0 (0.0%) | 0 (0.0%) |
| High School Diploma | 76 (100.0%) | 19 (25.0%) |
| College / Associate Degree | 110 (65.5%) | 0 (0.0%) |
| Bachelor's Degree or higher | 284 (100.0%) | 17 (6.0%) |
| Total | 470 (79.7%) | 45 (7.7%) |
Employment Occupations by Sex in Cortland West
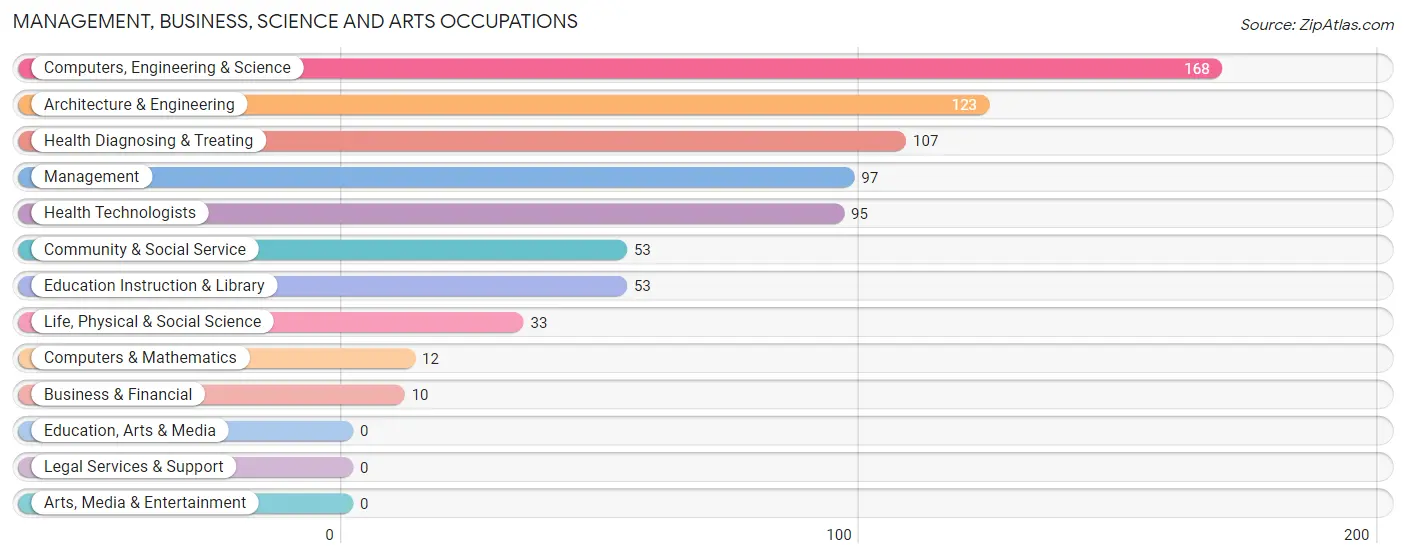
Management, Business, Science and Arts Occupations
The most common Management, Business, Science and Arts occupations in Cortland West are Computers, Engineering & Science (168 | 26.3%), Architecture & Engineering (123 | 19.3%), Health Diagnosing & Treating (107 | 16.8%), Management (97 | 15.2%), and Health Technologists (95 | 14.9%).
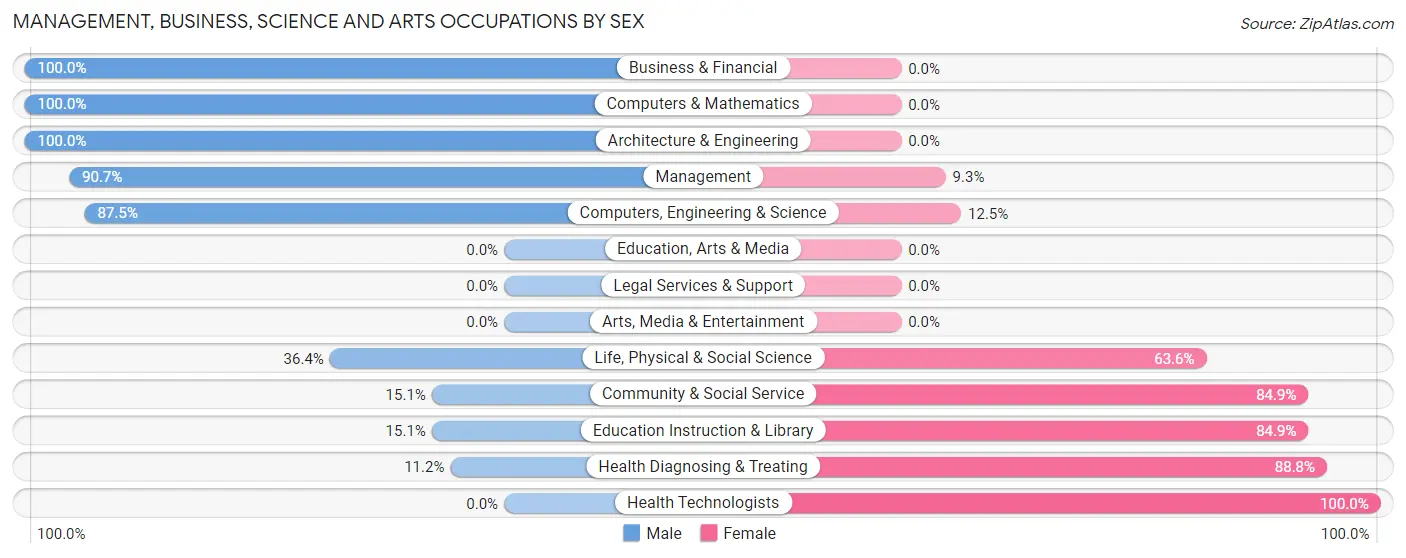
Management, Business, Science and Arts Occupations by Sex
Within the Management, Business, Science and Arts occupations in Cortland West, the most male-oriented occupations are Business & Financial (100.0%), Computers & Mathematics (100.0%), and Architecture & Engineering (100.0%), while the most female-oriented occupations are Health Technologists (100.0%), Health Diagnosing & Treating (88.8%), and Community & Social Service (84.9%).
| Occupation | Male | Female |
| Management | 88 (90.7%) | 9 (9.3%) |
| Business & Financial | 10 (100.0%) | 0 (0.0%) |
| Computers, Engineering & Science | 147 (87.5%) | 21 (12.5%) |
| Computers & Mathematics | 12 (100.0%) | 0 (0.0%) |
| Architecture & Engineering | 123 (100.0%) | 0 (0.0%) |
| Life, Physical & Social Science | 12 (36.4%) | 21 (63.6%) |
| Community & Social Service | 8 (15.1%) | 45 (84.9%) |
| Education, Arts & Media | 0 (0.0%) | 0 (0.0%) |
| Legal Services & Support | 0 (0.0%) | 0 (0.0%) |
| Education Instruction & Library | 8 (15.1%) | 45 (84.9%) |
| Arts, Media & Entertainment | 0 (0.0%) | 0 (0.0%) |
| Health Diagnosing & Treating | 12 (11.2%) | 95 (88.8%) |
| Health Technologists | 0 (0.0%) | 95 (100.0%) |
| Total (Category) | 265 (60.9%) | 170 (39.1%) |
| Total (Overall) | 384 (60.2%) | 254 (39.8%) |
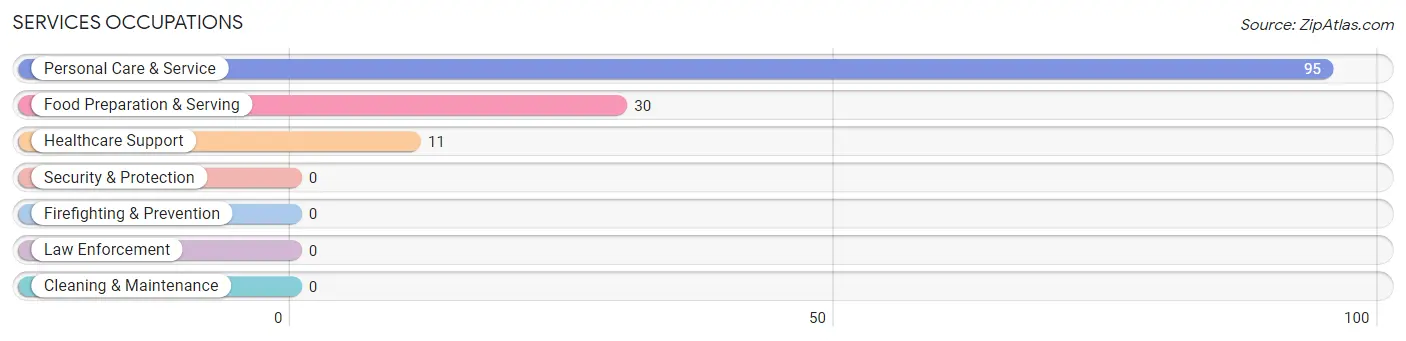
Services Occupations
The most common Services occupations in Cortland West are Personal Care & Service (95 | 14.9%), Food Preparation & Serving (30 | 4.7%), and Healthcare Support (11 | 1.7%).
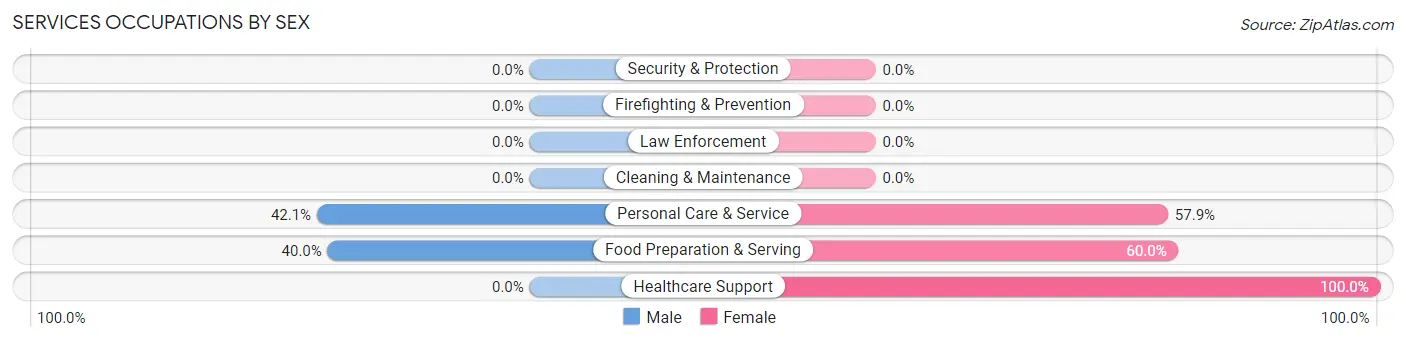
Services Occupations by Sex
Within the Services occupations in Cortland West, the most male-oriented occupations are Personal Care & Service (42.1%), and Food Preparation & Serving (40.0%), while the most female-oriented occupations are Healthcare Support (100.0%), Food Preparation & Serving (60.0%), and Personal Care & Service (57.9%).
| Occupation | Male | Female |
| Healthcare Support | 0 (0.0%) | 11 (100.0%) |
| Security & Protection | 0 (0.0%) | 0 (0.0%) |
| Firefighting & Prevention | 0 (0.0%) | 0 (0.0%) |
| Law Enforcement | 0 (0.0%) | 0 (0.0%) |
| Food Preparation & Serving | 12 (40.0%) | 18 (60.0%) |
| Cleaning & Maintenance | 0 (0.0%) | 0 (0.0%) |
| Personal Care & Service | 40 (42.1%) | 55 (57.9%) |
| Total (Category) | 52 (38.2%) | 84 (61.8%) |
| Total (Overall) | 384 (60.2%) | 254 (39.8%) |
Sales and Office Occupations
The most common Sales and Office occupations in Cortland West are , and Sales & Related (48 | 7.5%).
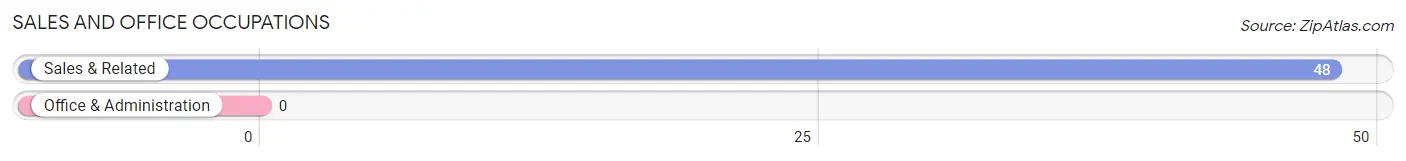
Sales and Office Occupations by Sex
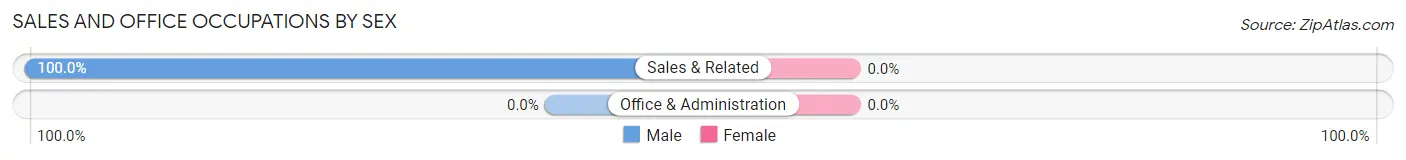
| Occupation | Male | Female |
| Sales & Related | 48 (100.0%) | 0 (0.0%) |
| Office & Administration | 0 (0.0%) | 0 (0.0%) |
| Total (Category) | 48 (100.0%) | 0 (0.0%) |
| Total (Overall) | 384 (60.2%) | 254 (39.8%) |
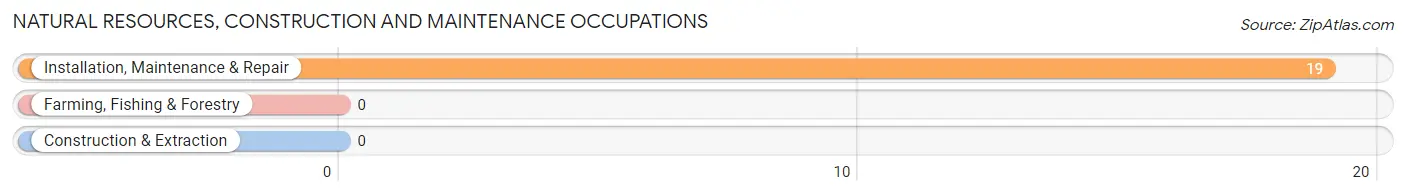
Natural Resources, Construction and Maintenance Occupations
The most common Natural Resources, Construction and Maintenance occupations in Cortland West are , and Installation, Maintenance & Repair (19 | 3.0%).
Natural Resources, Construction and Maintenance Occupations by Sex
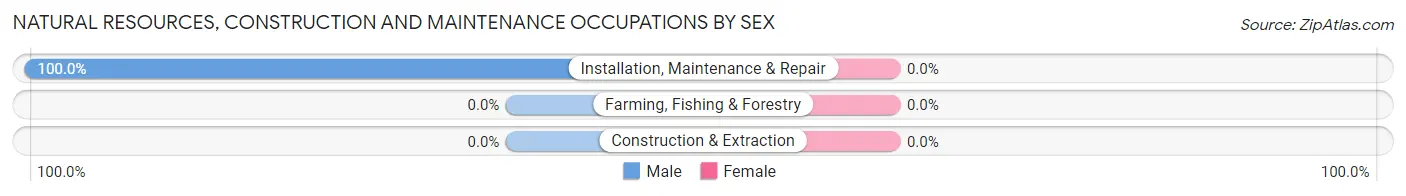
| Occupation | Male | Female |
| Farming, Fishing & Forestry | 0 (0.0%) | 0 (0.0%) |
| Construction & Extraction | 0 (0.0%) | 0 (0.0%) |
| Installation, Maintenance & Repair | 19 (100.0%) | 0 (0.0%) |
| Total (Category) | 19 (100.0%) | 0 (0.0%) |
| Total (Overall) | 384 (60.2%) | 254 (39.8%) |
Production, Transportation and Moving Occupations
Production, Transportation and Moving Occupations by Sex
| Occupation | Male | Female |
| Production | 0 (0.0%) | 0 (0.0%) |
| Transportation | 0 (0.0%) | 0 (0.0%) |
| Material Moving | 0 (0.0%) | 0 (0.0%) |
| Total (Category) | 0 (0.0%) | 0 (0.0%) |
| Total (Overall) | 384 (60.2%) | 254 (39.8%) |
Employment Industries by Sex in Cortland West
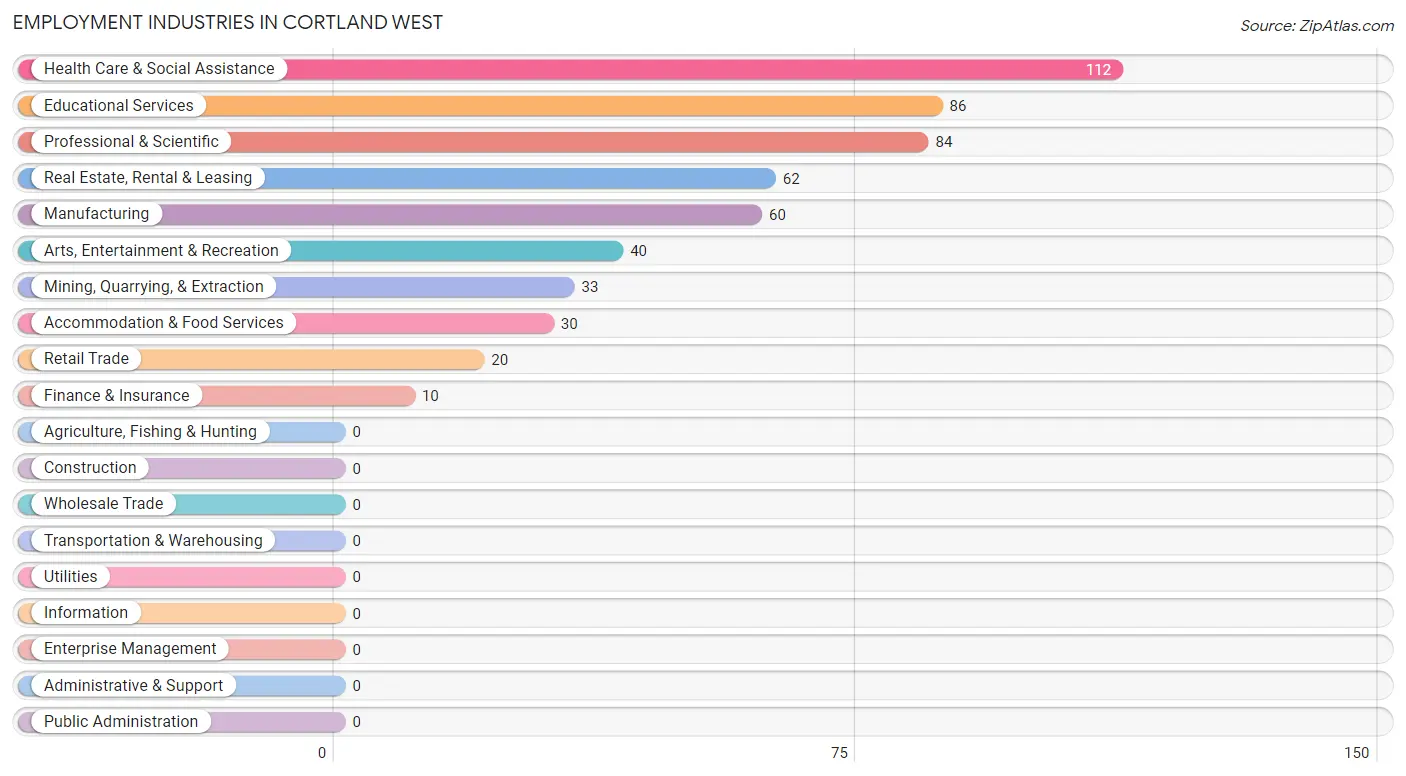
Employment Industries in Cortland West
The major employment industries in Cortland West include Health Care & Social Assistance (112 | 17.5%), Educational Services (86 | 13.5%), Professional & Scientific (84 | 13.2%), Real Estate, Rental & Leasing (62 | 9.7%), and Manufacturing (60 | 9.4%).
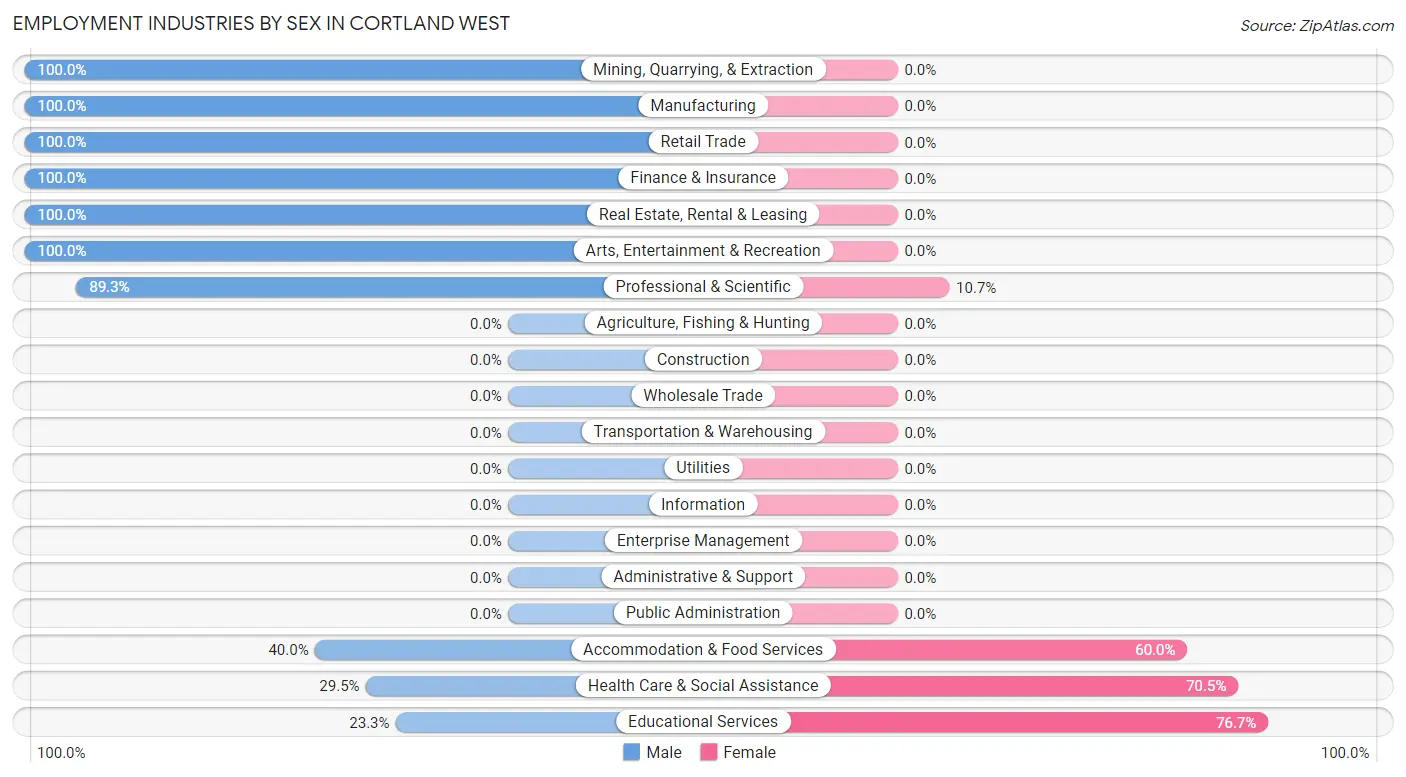
Employment Industries by Sex in Cortland West
The Cortland West industries that see more men than women are Mining, Quarrying, & Extraction (100.0%), Manufacturing (100.0%), and Retail Trade (100.0%), whereas the industries that tend to have a higher number of women are Educational Services (76.7%), Health Care & Social Assistance (70.5%), and Accommodation & Food Services (60.0%).
| Industry | Male | Female |
| Agriculture, Fishing & Hunting | 0 (0.0%) | 0 (0.0%) |
| Mining, Quarrying, & Extraction | 33 (100.0%) | 0 (0.0%) |
| Construction | 0 (0.0%) | 0 (0.0%) |
| Manufacturing | 60 (100.0%) | 0 (0.0%) |
| Wholesale Trade | 0 (0.0%) | 0 (0.0%) |
| Retail Trade | 20 (100.0%) | 0 (0.0%) |
| Transportation & Warehousing | 0 (0.0%) | 0 (0.0%) |
| Utilities | 0 (0.0%) | 0 (0.0%) |
| Information | 0 (0.0%) | 0 (0.0%) |
| Finance & Insurance | 10 (100.0%) | 0 (0.0%) |
| Real Estate, Rental & Leasing | 62 (100.0%) | 0 (0.0%) |
| Professional & Scientific | 75 (89.3%) | 9 (10.7%) |
| Enterprise Management | 0 (0.0%) | 0 (0.0%) |
| Administrative & Support | 0 (0.0%) | 0 (0.0%) |
| Educational Services | 20 (23.3%) | 66 (76.7%) |
| Health Care & Social Assistance | 33 (29.5%) | 79 (70.5%) |
| Arts, Entertainment & Recreation | 40 (100.0%) | 0 (0.0%) |
| Accommodation & Food Services | 12 (40.0%) | 18 (60.0%) |
| Public Administration | 0 (0.0%) | 0 (0.0%) |
| Total | 384 (60.2%) | 254 (39.8%) |
Education in Cortland West
School Enrollment in Cortland West
The most common levels of schooling among the 203 students in Cortland West are college / undergraduate (54 | 26.6%), elementary school (33 | 16.3%), and middle school (32 | 15.8%).
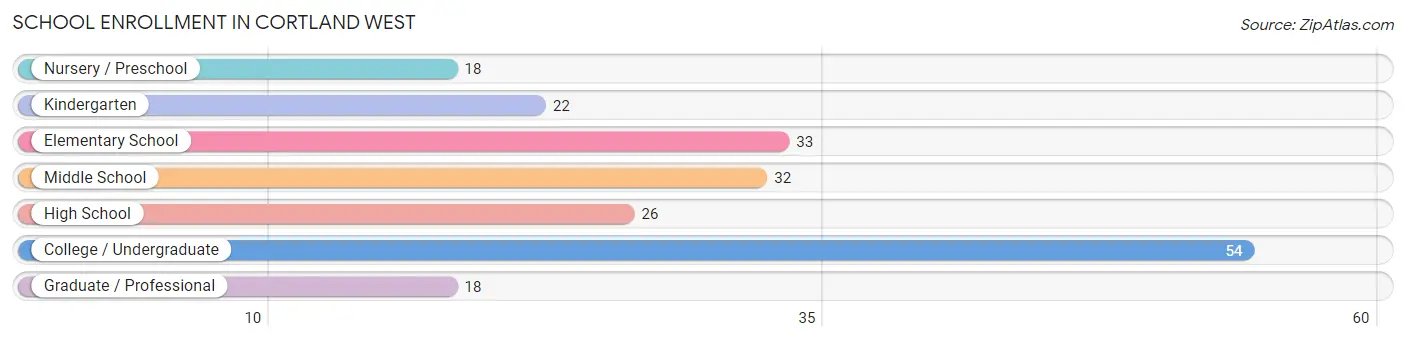
| School Level | # Students | % Students |
| Nursery / Preschool | 18 | 8.9% |
| Kindergarten | 22 | 10.8% |
| Elementary School | 33 | 16.3% |
| Middle School | 32 | 15.8% |
| High School | 26 | 12.8% |
| College / Undergraduate | 54 | 26.6% |
| Graduate / Professional | 18 | 8.9% |
| Total | 203 | 100.0% |
School Enrollment by Age by Funding Source in Cortland West
Out of a total of 203 students who are enrolled in schools in Cortland West, 103 (50.7%) attend a private institution, while the remaining 100 (49.3%) are enrolled in public schools. The age group of 3 to 4 year olds has the highest likelihood of being enrolled in private schools, with 18 (100.0% in the age bracket) enrolled. Conversely, the age group of 10 to 14 year olds has the lowest likelihood of being enrolled in a private school, with 32 (100.0% in the age bracket) attending a public institution.
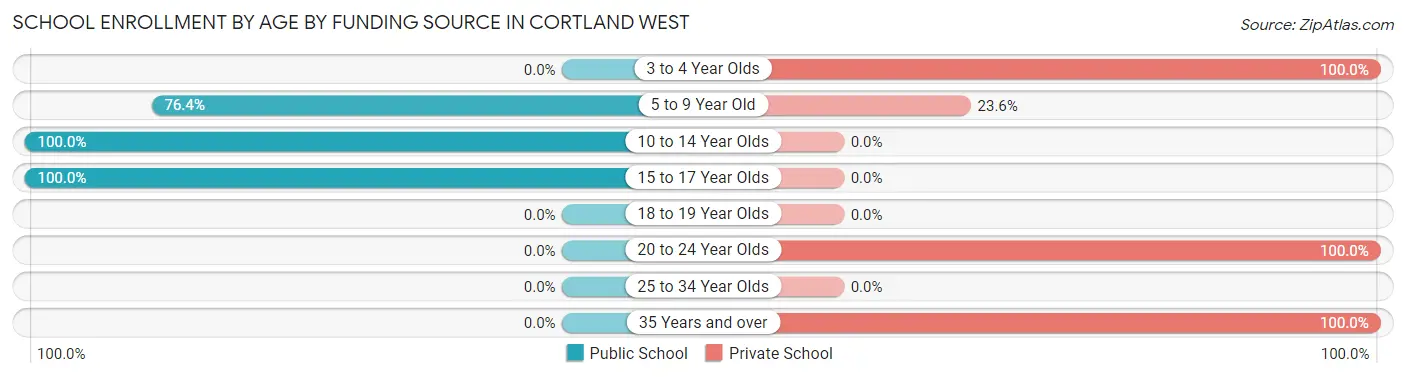
| Age Bracket | Public School | Private School |
| 3 to 4 Year Olds | 0 (0.0%) | 18 (100.0%) |
| 5 to 9 Year Old | 42 (76.4%) | 13 (23.6%) |
| 10 to 14 Year Olds | 32 (100.0%) | 0 (0.0%) |
| 15 to 17 Year Olds | 26 (100.0%) | 0 (0.0%) |
| 18 to 19 Year Olds | 0 (0.0%) | 0 (0.0%) |
| 20 to 24 Year Olds | 0 (0.0%) | 54 (100.0%) |
| 25 to 34 Year Olds | 0 (0.0%) | 0 (0.0%) |
| 35 Years and over | 0 (0.0%) | 18 (100.0%) |
| Total | 100 (49.3%) | 103 (50.7%) |
Educational Attainment by Field of Study in Cortland West
Arts & humanities (84 | 19.3%), business (65 | 14.9%), science & technology (56 | 12.8%), psychology (54 | 12.4%), and education (46 | 10.5%) are the most common fields of study among 436 individuals in Cortland West who have obtained a bachelor's degree or higher.
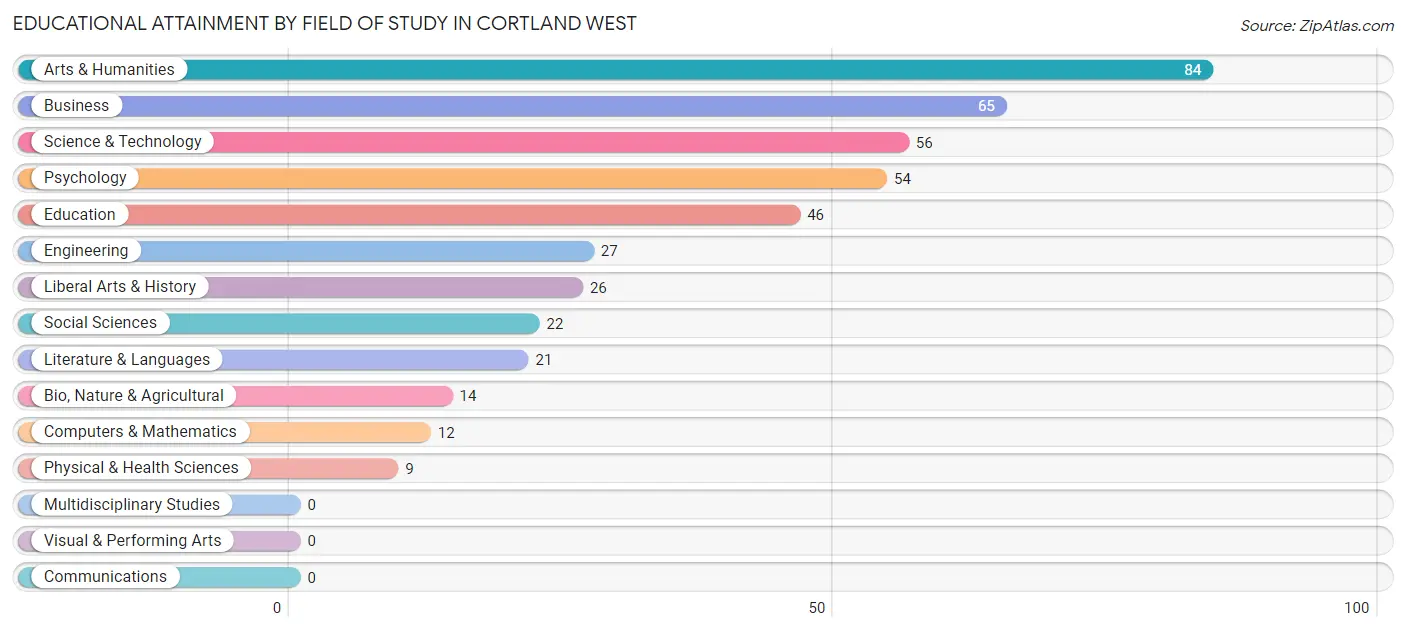
| Field of Study | # Graduates | % Graduates |
| Computers & Mathematics | 12 | 2.8% |
| Bio, Nature & Agricultural | 14 | 3.2% |
| Physical & Health Sciences | 9 | 2.1% |
| Psychology | 54 | 12.4% |
| Social Sciences | 22 | 5.1% |
| Engineering | 27 | 6.2% |
| Multidisciplinary Studies | 0 | 0.0% |
| Science & Technology | 56 | 12.8% |
| Business | 65 | 14.9% |
| Education | 46 | 10.5% |
| Literature & Languages | 21 | 4.8% |
| Liberal Arts & History | 26 | 6.0% |
| Visual & Performing Arts | 0 | 0.0% |
| Communications | 0 | 0.0% |
| Arts & Humanities | 84 | 19.3% |
| Total | 436 | 100.0% |
Transportation & Commute in Cortland West
Vehicle Availability by Sex in Cortland West
The most prevalent vehicle ownership categories in Cortland West are males with 2 vehicles (212, accounting for 55.2%) and females with 2 vehicles (154, making up 89.1%).
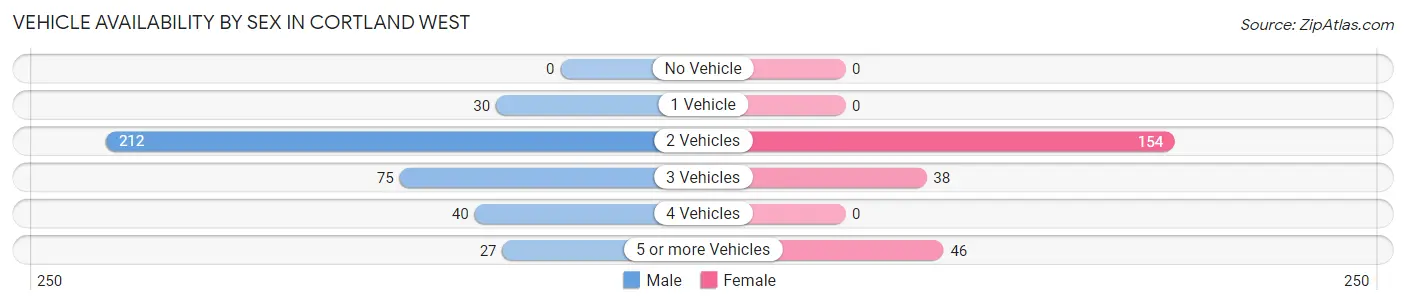
| Vehicles Available | Male | Female |
| No Vehicle | 0 (0.0%) | 0 (0.0%) |
| 1 Vehicle | 30 (7.8%) | 0 (0.0%) |
| 2 Vehicles | 212 (55.2%) | 154 (64.7%) |
| 3 Vehicles | 75 (19.5%) | 38 (16.0%) |
| 4 Vehicles | 40 (10.4%) | 0 (0.0%) |
| 5 or more Vehicles | 27 (7.0%) | 46 (19.3%) |
| Total | 384 (100.0%) | 238 (100.0%) |
Commute Time in Cortland West
The most frequently occuring commute durations in Cortland West are 15 to 19 minutes (118 commuters, 23.5%), 45 to 59 minutes (110 commuters, 22.0%), and 40 to 44 minutes (79 commuters, 15.8%).
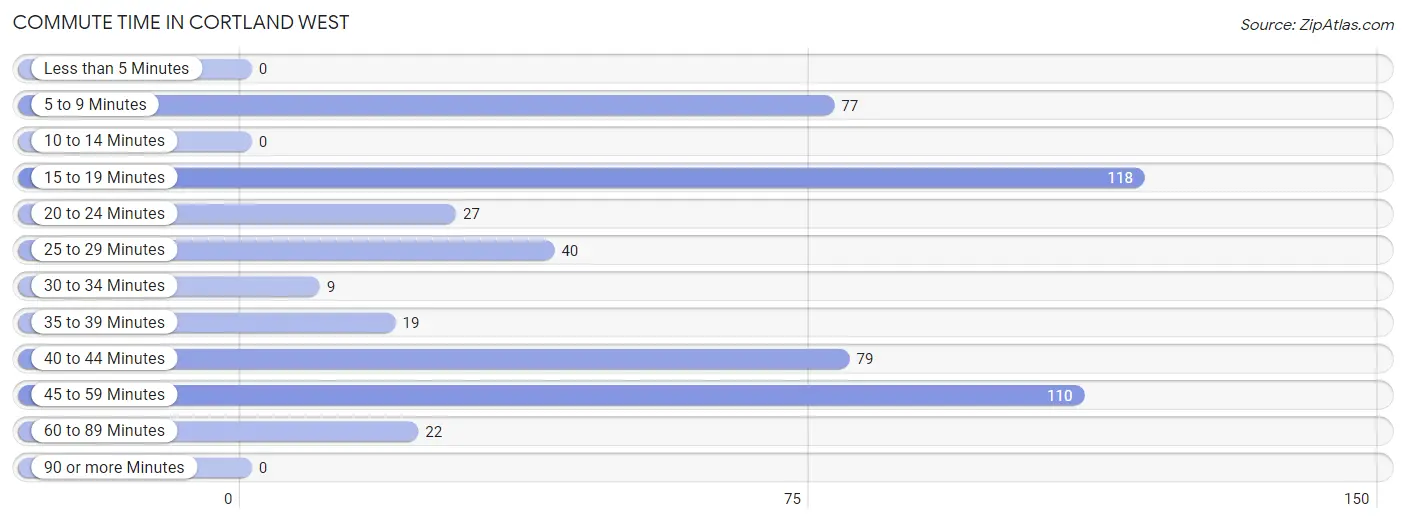
| Commute Time | # Commuters | % Commuters |
| Less than 5 Minutes | 0 | 0.0% |
| 5 to 9 Minutes | 77 | 15.4% |
| 10 to 14 Minutes | 0 | 0.0% |
| 15 to 19 Minutes | 118 | 23.5% |
| 20 to 24 Minutes | 27 | 5.4% |
| 25 to 29 Minutes | 40 | 8.0% |
| 30 to 34 Minutes | 9 | 1.8% |
| 35 to 39 Minutes | 19 | 3.8% |
| 40 to 44 Minutes | 79 | 15.8% |
| 45 to 59 Minutes | 110 | 22.0% |
| 60 to 89 Minutes | 22 | 4.4% |
| 90 or more Minutes | 0 | 0.0% |
Commute Time by Sex in Cortland West
The most common commute times in Cortland West are 15 to 19 minutes (97 commuters, 29.8%) for males and 45 to 59 minutes (62 commuters, 35.2%) for females.
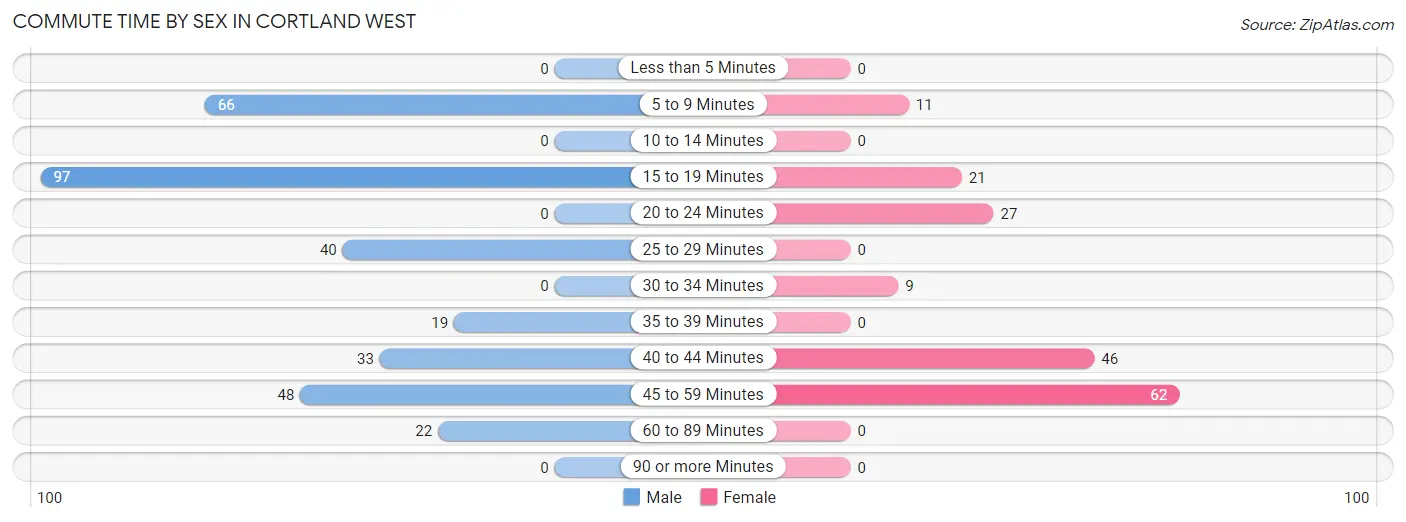
| Commute Time | Male | Female |
| Less than 5 Minutes | 0 (0.0%) | 0 (0.0%) |
| 5 to 9 Minutes | 66 (20.3%) | 11 (6.2%) |
| 10 to 14 Minutes | 0 (0.0%) | 0 (0.0%) |
| 15 to 19 Minutes | 97 (29.8%) | 21 (11.9%) |
| 20 to 24 Minutes | 0 (0.0%) | 27 (15.3%) |
| 25 to 29 Minutes | 40 (12.3%) | 0 (0.0%) |
| 30 to 34 Minutes | 0 (0.0%) | 9 (5.1%) |
| 35 to 39 Minutes | 19 (5.9%) | 0 (0.0%) |
| 40 to 44 Minutes | 33 (10.2%) | 46 (26.1%) |
| 45 to 59 Minutes | 48 (14.8%) | 62 (35.2%) |
| 60 to 89 Minutes | 22 (6.8%) | 0 (0.0%) |
| 90 or more Minutes | 0 (0.0%) | 0 (0.0%) |
Time of Departure to Work by Sex in Cortland West
The most frequent times of departure to work in Cortland West are 7:00 AM to 7:29 AM (124, 38.2%) for males and 7:30 AM to 7:59 AM (70, 39.8%) for females.
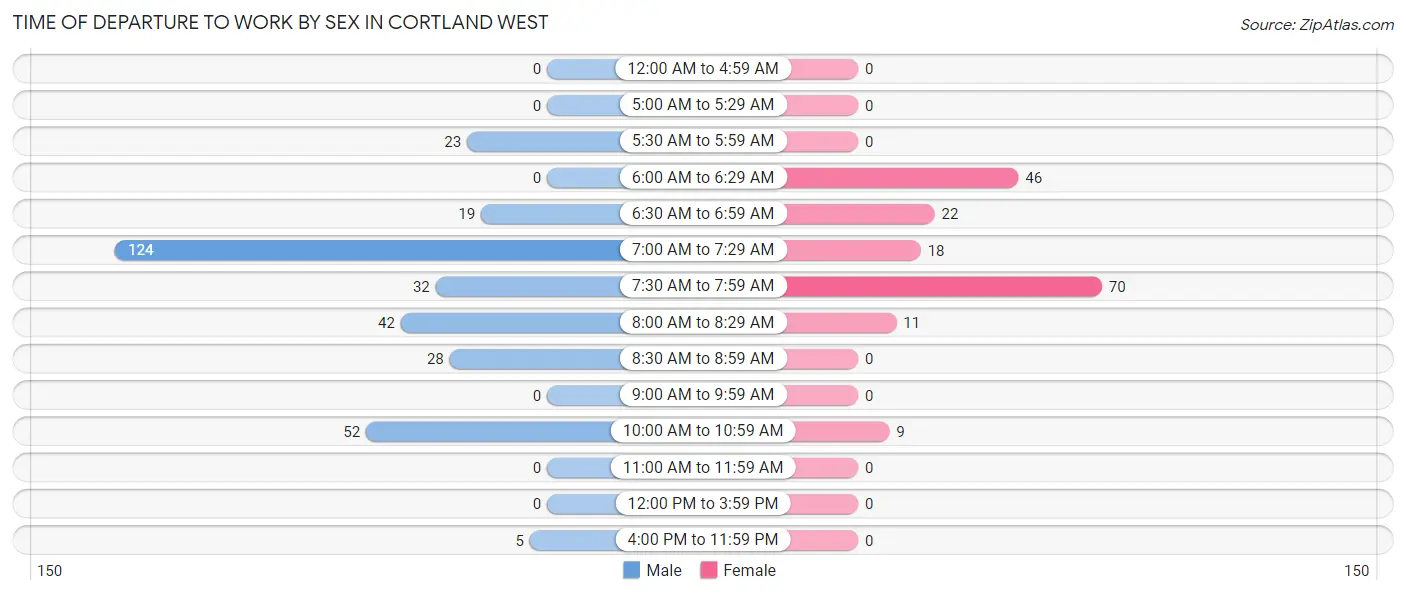
| Time of Departure | Male | Female |
| 12:00 AM to 4:59 AM | 0 (0.0%) | 0 (0.0%) |
| 5:00 AM to 5:29 AM | 0 (0.0%) | 0 (0.0%) |
| 5:30 AM to 5:59 AM | 23 (7.1%) | 0 (0.0%) |
| 6:00 AM to 6:29 AM | 0 (0.0%) | 46 (26.1%) |
| 6:30 AM to 6:59 AM | 19 (5.9%) | 22 (12.5%) |
| 7:00 AM to 7:29 AM | 124 (38.2%) | 18 (10.2%) |
| 7:30 AM to 7:59 AM | 32 (9.9%) | 70 (39.8%) |
| 8:00 AM to 8:29 AM | 42 (12.9%) | 11 (6.2%) |
| 8:30 AM to 8:59 AM | 28 (8.6%) | 0 (0.0%) |
| 9:00 AM to 9:59 AM | 0 (0.0%) | 0 (0.0%) |
| 10:00 AM to 10:59 AM | 52 (16.0%) | 9 (5.1%) |
| 11:00 AM to 11:59 AM | 0 (0.0%) | 0 (0.0%) |
| 12:00 PM to 3:59 PM | 0 (0.0%) | 0 (0.0%) |
| 4:00 PM to 11:59 PM | 5 (1.5%) | 0 (0.0%) |
| Total | 325 (100.0%) | 176 (100.0%) |
Housing Occupancy in Cortland West
Occupancy by Ownership in Cortland West
Of the total 434 dwellings in Cortland West, owner-occupied units account for 399 (91.9%), while renter-occupied units make up 35 (8.1%).
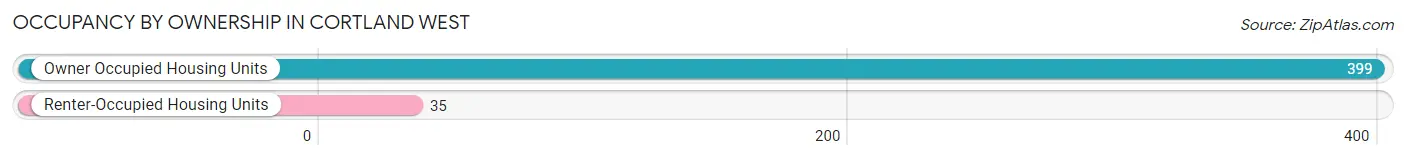
| Occupancy | # Housing Units | % Housing Units |
| Owner Occupied Housing Units | 399 | 91.9% |
| Renter-Occupied Housing Units | 35 | 8.1% |
| Total Occupied Housing Units | 434 | 100.0% |
Occupancy by Household Size in Cortland West
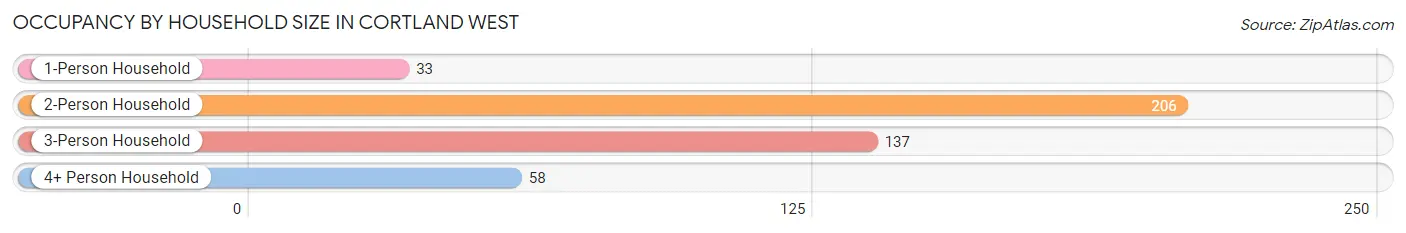
| Household Size | # Housing Units | % Housing Units |
| 1-Person Household | 33 | 7.6% |
| 2-Person Household | 206 | 47.5% |
| 3-Person Household | 137 | 31.6% |
| 4+ Person Household | 58 | 13.4% |
| Total Housing Units | 434 | 100.0% |
Occupancy by Ownership by Household Size in Cortland West
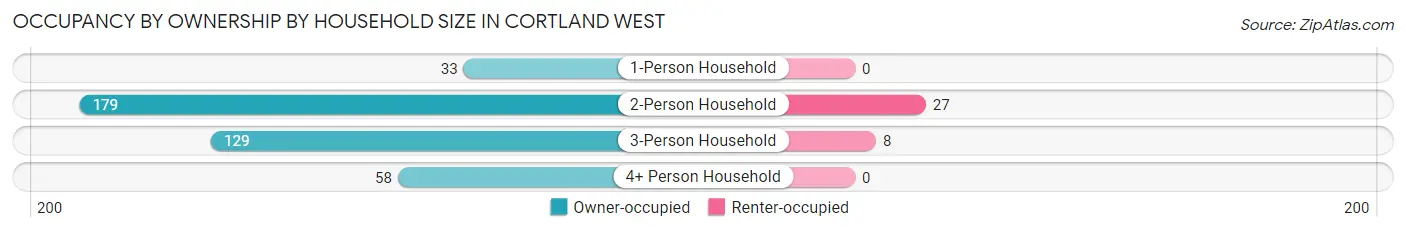
| Household Size | Owner-occupied | Renter-occupied |
| 1-Person Household | 33 (100.0%) | 0 (0.0%) |
| 2-Person Household | 179 (86.9%) | 27 (13.1%) |
| 3-Person Household | 129 (94.2%) | 8 (5.8%) |
| 4+ Person Household | 58 (100.0%) | 0 (0.0%) |
| Total Housing Units | 399 (91.9%) | 35 (8.1%) |
Occupancy by Educational Attainment in Cortland West
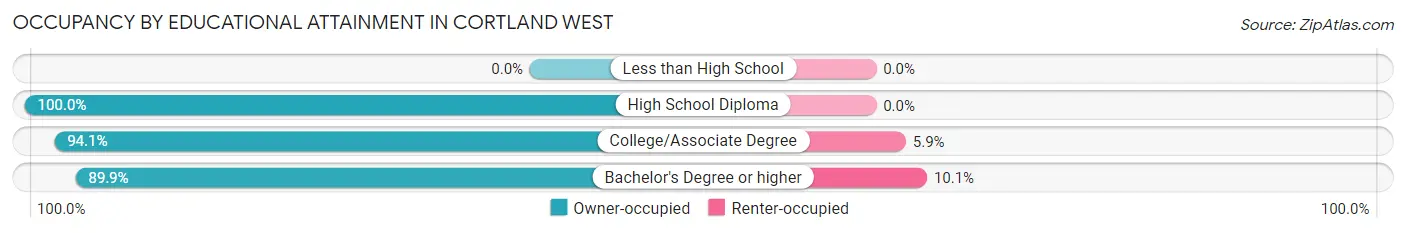
| Household Size | Owner-occupied | Renter-occupied |
| Less than High School | 0 (0.0%) | 0 (0.0%) |
| High School Diploma | 30 (100.0%) | 0 (0.0%) |
| College/Associate Degree | 128 (94.1%) | 8 (5.9%) |
| Bachelor's Degree or higher | 241 (89.9%) | 27 (10.1%) |
Occupancy by Age of Householder in Cortland West
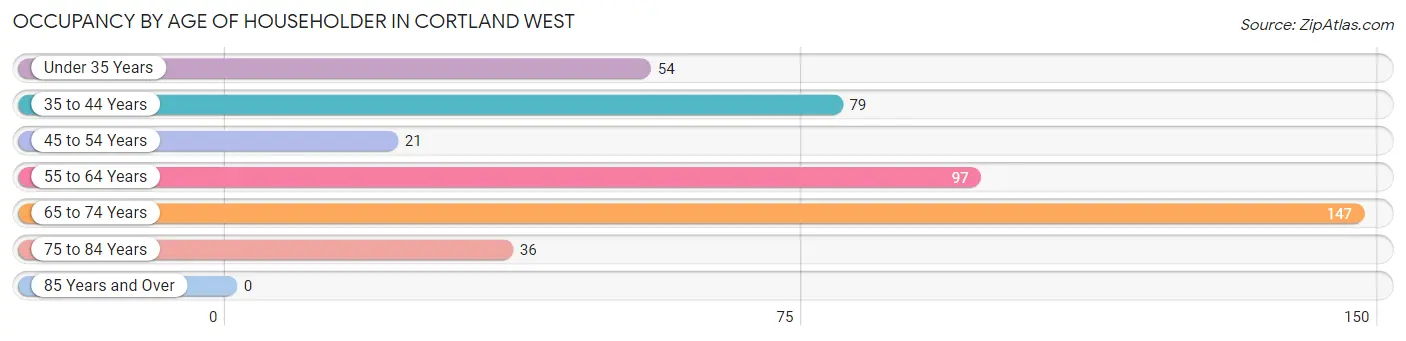
| Age Bracket | # Households | % Households |
| Under 35 Years | 54 | 12.4% |
| 35 to 44 Years | 79 | 18.2% |
| 45 to 54 Years | 21 | 4.8% |
| 55 to 64 Years | 97 | 22.4% |
| 65 to 74 Years | 147 | 33.9% |
| 75 to 84 Years | 36 | 8.3% |
| 85 Years and Over | 0 | 0.0% |
| Total | 434 | 100.0% |
Housing Finances in Cortland West
Median Income by Occupancy in Cortland West
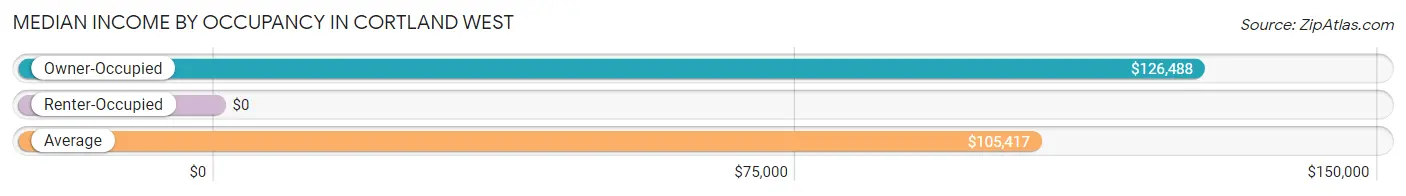
| Occupancy Type | # Households | Median Income |
| Owner-Occupied | 399 (91.9%) | $126,488 |
| Renter-Occupied | 35 (8.1%) | $0 |
| Average | 434 (100.0%) | $105,417 |
Occupancy by Householder Income Bracket in Cortland West
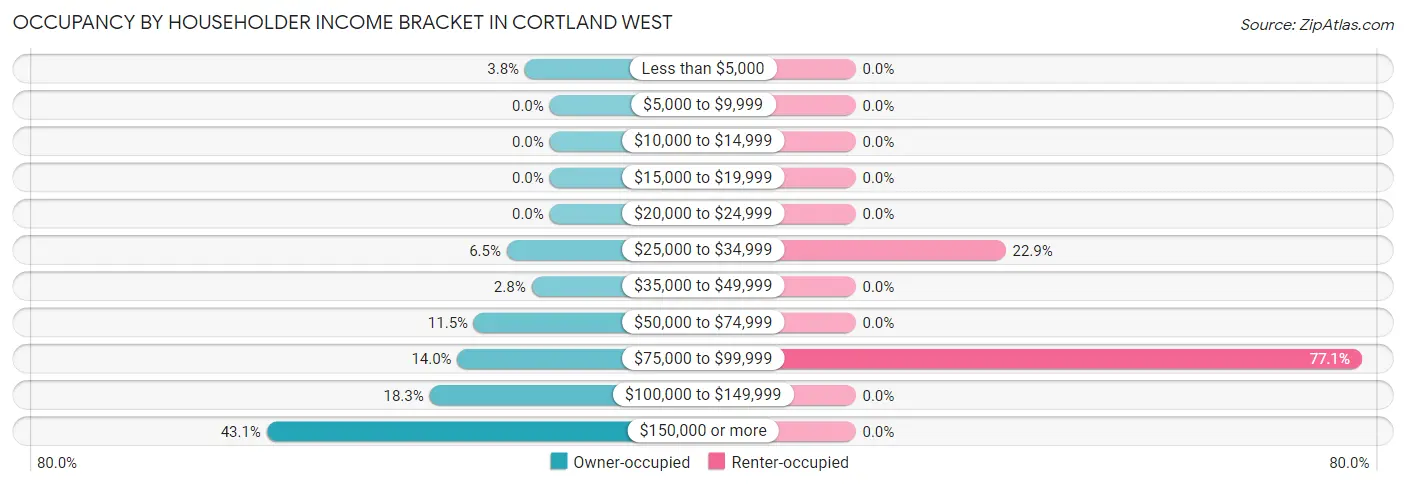
| Income Bracket | Owner-occupied | Renter-occupied |
| Less than $5,000 | 15 (3.8%) | 0 (0.0%) |
| $5,000 to $9,999 | 0 (0.0%) | 0 (0.0%) |
| $10,000 to $14,999 | 0 (0.0%) | 0 (0.0%) |
| $15,000 to $19,999 | 0 (0.0%) | 0 (0.0%) |
| $20,000 to $24,999 | 0 (0.0%) | 0 (0.0%) |
| $25,000 to $34,999 | 26 (6.5%) | 8 (22.9%) |
| $35,000 to $49,999 | 11 (2.8%) | 0 (0.0%) |
| $50,000 to $74,999 | 46 (11.5%) | 0 (0.0%) |
| $75,000 to $99,999 | 56 (14.0%) | 27 (77.1%) |
| $100,000 to $149,999 | 73 (18.3%) | 0 (0.0%) |
| $150,000 or more | 172 (43.1%) | 0 (0.0%) |
| Total | 399 (100.0%) | 35 (100.0%) |
Monthly Housing Cost Tiers in Cortland West
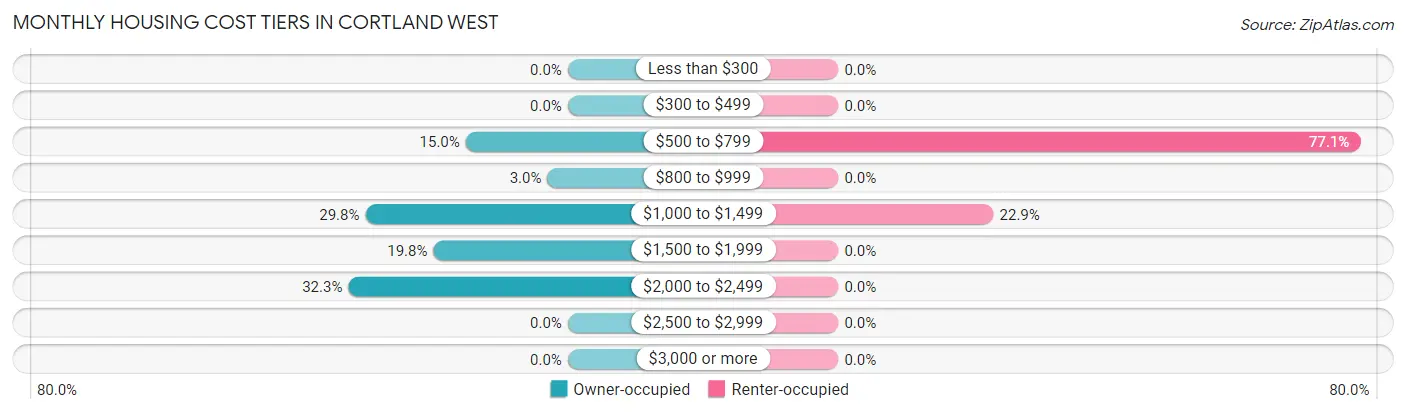
| Monthly Cost | Owner-occupied | Renter-occupied |
| Less than $300 | 0 (0.0%) | 0 (0.0%) |
| $300 to $499 | 0 (0.0%) | 0 (0.0%) |
| $500 to $799 | 60 (15.0%) | 27 (77.1%) |
| $800 to $999 | 12 (3.0%) | 0 (0.0%) |
| $1,000 to $1,499 | 119 (29.8%) | 8 (22.9%) |
| $1,500 to $1,999 | 79 (19.8%) | 0 (0.0%) |
| $2,000 to $2,499 | 129 (32.3%) | 0 (0.0%) |
| $2,500 to $2,999 | 0 (0.0%) | 0 (0.0%) |
| $3,000 or more | 0 (0.0%) | 0 (0.0%) |
| Total | 399 (100.0%) | 35 (100.0%) |
Physical Housing Characteristics in Cortland West
Housing Structures in Cortland West
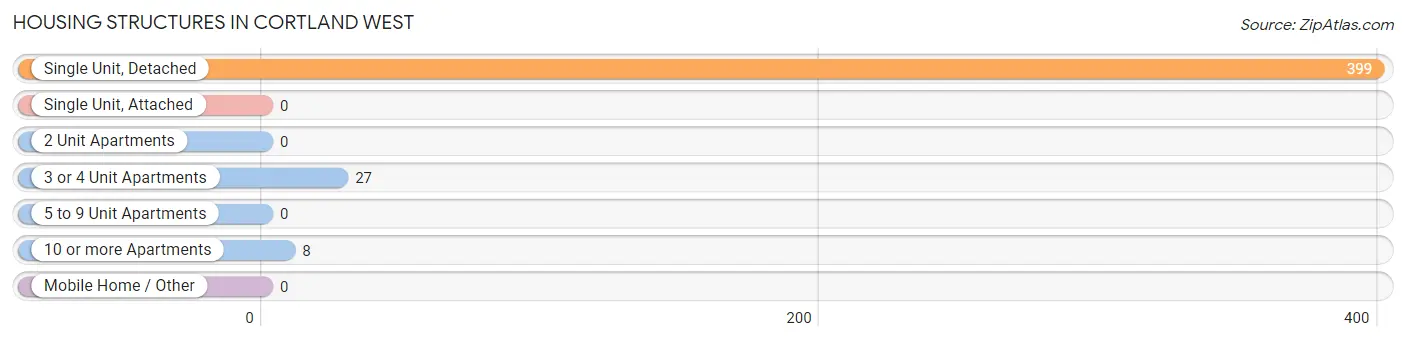
| Structure Type | # Housing Units | % Housing Units |
| Single Unit, Detached | 399 | 91.9% |
| Single Unit, Attached | 0 | 0.0% |
| 2 Unit Apartments | 0 | 0.0% |
| 3 or 4 Unit Apartments | 27 | 6.2% |
| 5 to 9 Unit Apartments | 0 | 0.0% |
| 10 or more Apartments | 8 | 1.8% |
| Mobile Home / Other | 0 | 0.0% |
| Total | 434 | 100.0% |
Housing Structures by Occupancy in Cortland West
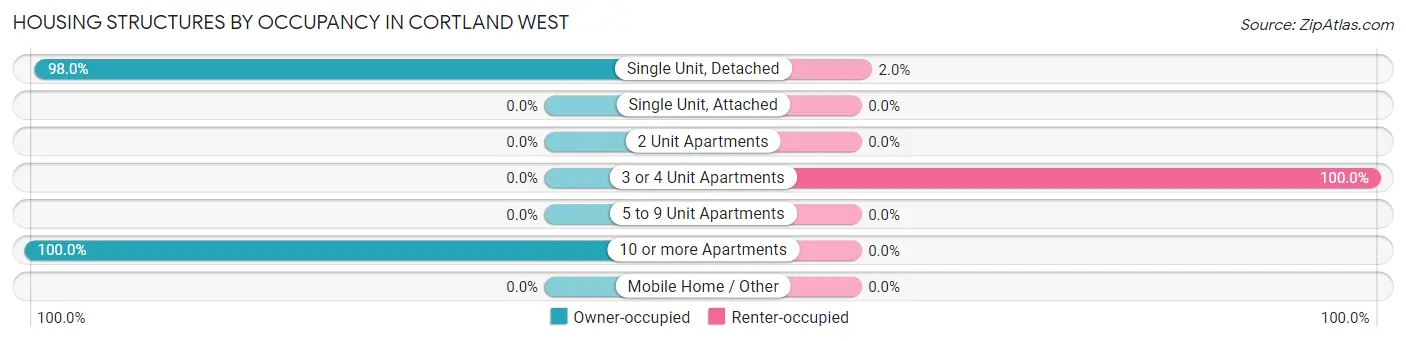
| Structure Type | Owner-occupied | Renter-occupied |
| Single Unit, Detached | 391 (98.0%) | 8 (2.0%) |
| Single Unit, Attached | 0 (0.0%) | 0 (0.0%) |
| 2 Unit Apartments | 0 (0.0%) | 0 (0.0%) |
| 3 or 4 Unit Apartments | 0 (0.0%) | 27 (100.0%) |
| 5 to 9 Unit Apartments | 0 (0.0%) | 0 (0.0%) |
| 10 or more Apartments | 8 (100.0%) | 0 (0.0%) |
| Mobile Home / Other | 0 (0.0%) | 0 (0.0%) |
| Total | 399 (91.9%) | 35 (8.1%) |
Housing Structures by Number of Rooms in Cortland West
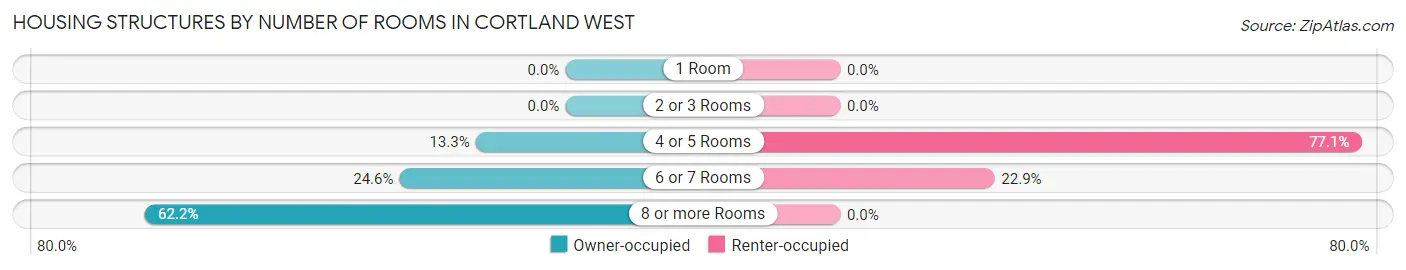
| Number of Rooms | Owner-occupied | Renter-occupied |
| 1 Room | 0 (0.0%) | 0 (0.0%) |
| 2 or 3 Rooms | 0 (0.0%) | 0 (0.0%) |
| 4 or 5 Rooms | 53 (13.3%) | 27 (77.1%) |
| 6 or 7 Rooms | 98 (24.6%) | 8 (22.9%) |
| 8 or more Rooms | 248 (62.2%) | 0 (0.0%) |
| Total | 399 (100.0%) | 35 (100.0%) |
Housing Structure by Heating Type in Cortland West
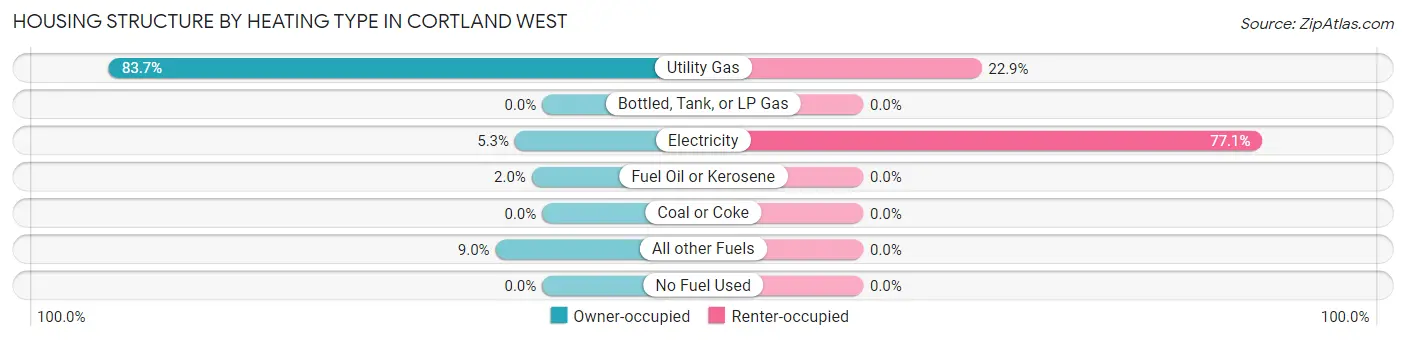
| Heating Type | Owner-occupied | Renter-occupied |
| Utility Gas | 334 (83.7%) | 8 (22.9%) |
| Bottled, Tank, or LP Gas | 0 (0.0%) | 0 (0.0%) |
| Electricity | 21 (5.3%) | 27 (77.1%) |
| Fuel Oil or Kerosene | 8 (2.0%) | 0 (0.0%) |
| Coal or Coke | 0 (0.0%) | 0 (0.0%) |
| All other Fuels | 36 (9.0%) | 0 (0.0%) |
| No Fuel Used | 0 (0.0%) | 0 (0.0%) |
| Total | 399 (100.0%) | 35 (100.0%) |
Household Vehicle Usage in Cortland West
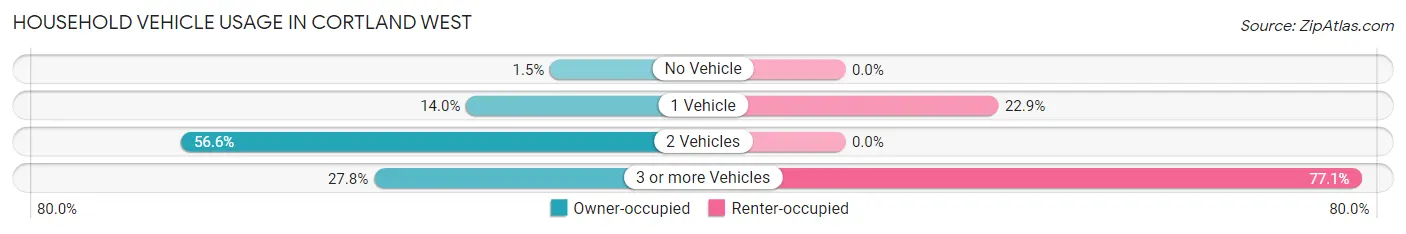
| Vehicles per Household | Owner-occupied | Renter-occupied |
| No Vehicle | 6 (1.5%) | 0 (0.0%) |
| 1 Vehicle | 56 (14.0%) | 8 (22.9%) |
| 2 Vehicles | 226 (56.6%) | 0 (0.0%) |
| 3 or more Vehicles | 111 (27.8%) | 27 (77.1%) |
| Total | 399 (100.0%) | 35 (100.0%) |
Real Estate & Mortgages in Cortland West
Real Estate and Mortgage Overview in Cortland West
| Characteristic | Without Mortgage | With Mortgage |
| Housing Units | 144 | 255 |
| Median Property Value | $286,500 | $193,300 |
| Median Household Income | $91,563 | $127 |
| Monthly Housing Costs | $1,000 | $0 |
| Real Estate Taxes | $7,965 | $21 |
Property Value by Mortgage Status in Cortland West
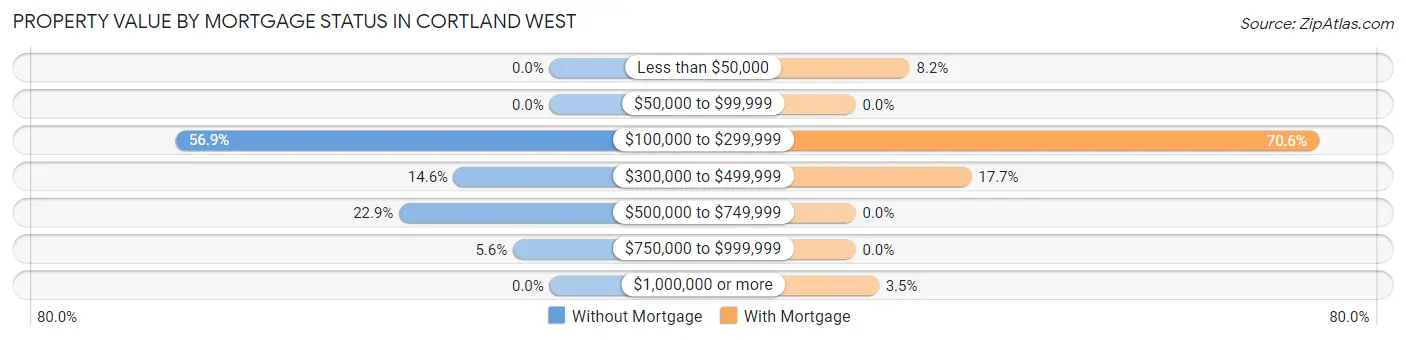
| Property Value | Without Mortgage | With Mortgage |
| Less than $50,000 | 0 (0.0%) | 21 (8.2%) |
| $50,000 to $99,999 | 0 (0.0%) | 0 (0.0%) |
| $100,000 to $299,999 | 82 (56.9%) | 180 (70.6%) |
| $300,000 to $499,999 | 21 (14.6%) | 45 (17.6%) |
| $500,000 to $749,999 | 33 (22.9%) | 0 (0.0%) |
| $750,000 to $999,999 | 8 (5.6%) | 0 (0.0%) |
| $1,000,000 or more | 0 (0.0%) | 9 (3.5%) |
| Total | 144 (100.0%) | 255 (100.0%) |
Household Income by Mortgage Status in Cortland West
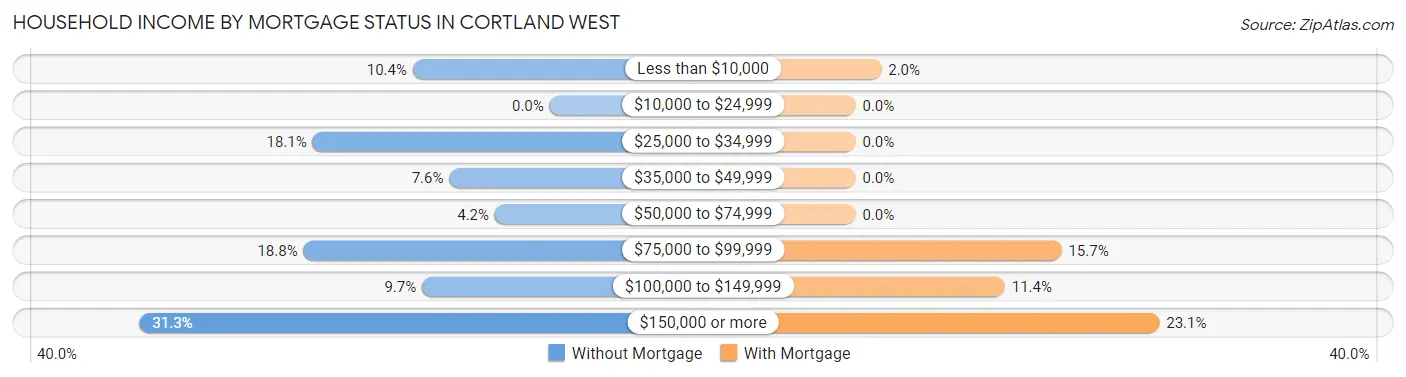
| Household Income | Without Mortgage | With Mortgage |
| Less than $10,000 | 15 (10.4%) | 5 (2.0%) |
| $10,000 to $24,999 | 0 (0.0%) | 0 (0.0%) |
| $25,000 to $34,999 | 26 (18.1%) | 0 (0.0%) |
| $35,000 to $49,999 | 11 (7.6%) | 0 (0.0%) |
| $50,000 to $74,999 | 6 (4.2%) | 0 (0.0%) |
| $75,000 to $99,999 | 27 (18.8%) | 40 (15.7%) |
| $100,000 to $149,999 | 14 (9.7%) | 29 (11.4%) |
| $150,000 or more | 45 (31.2%) | 59 (23.1%) |
| Total | 144 (100.0%) | 255 (100.0%) |
Property Value to Household Income Ratio in Cortland West
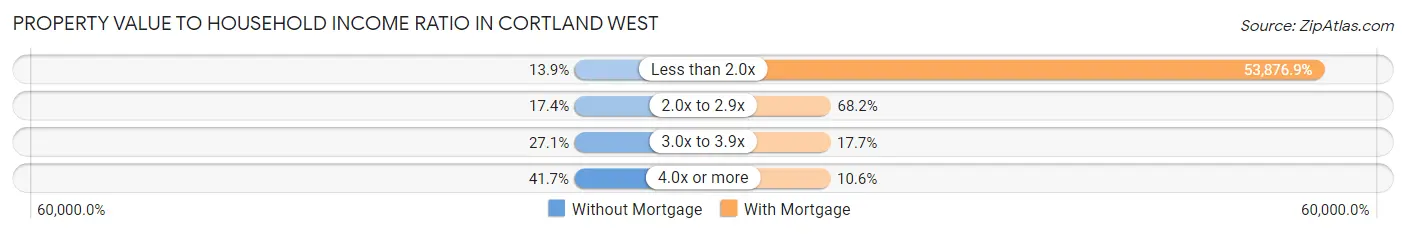
| Value-to-Income Ratio | Without Mortgage | With Mortgage |
| Less than 2.0x | 20 (13.9%) | 137,386 (53,876.9%) |
| 2.0x to 2.9x | 25 (17.4%) | 174 (68.2%) |
| 3.0x to 3.9x | 39 (27.1%) | 45 (17.6%) |
| 4.0x or more | 60 (41.7%) | 27 (10.6%) |
| Total | 144 (100.0%) | 255 (100.0%) |
Real Estate Taxes by Mortgage Status in Cortland West
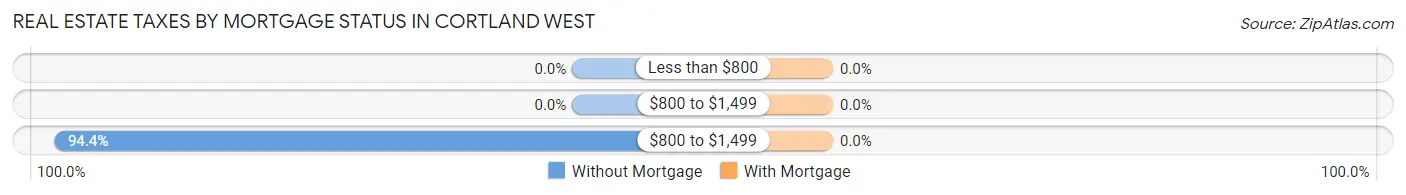
| Property Taxes | Without Mortgage | With Mortgage |
| Less than $800 | 0 (0.0%) | 0 (0.0%) |
| $800 to $1,499 | 0 (0.0%) | 0 (0.0%) |
| $800 to $1,499 | 136 (94.4%) | 0 (0.0%) |
| Total | 144 (100.0%) | 255 (100.0%) |
Health & Disability in Cortland West
Health Insurance Coverage by Age in Cortland West
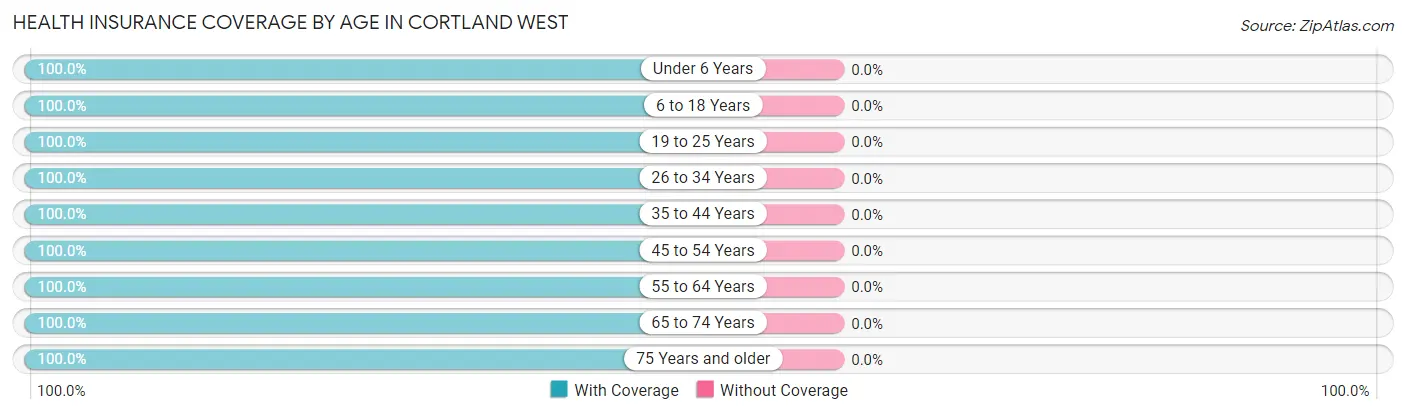
| Age Bracket | With Coverage | Without Coverage |
| Under 6 Years | 92 (100.0%) | 0 (0.0%) |
| 6 to 18 Years | 103 (100.0%) | 0 (0.0%) |
| 19 to 25 Years | 186 (100.0%) | 0 (0.0%) |
| 26 to 34 Years | 61 (100.0%) | 0 (0.0%) |
| 35 to 44 Years | 139 (100.0%) | 0 (0.0%) |
| 45 to 54 Years | 116 (100.0%) | 0 (0.0%) |
| 55 to 64 Years | 234 (100.0%) | 0 (0.0%) |
| 65 to 74 Years | 174 (100.0%) | 0 (0.0%) |
| 75 Years and older | 63 (100.0%) | 0 (0.0%) |
| Total | 1,168 (100.0%) | 0 (0.0%) |
Health Insurance Coverage by Citizenship Status in Cortland West
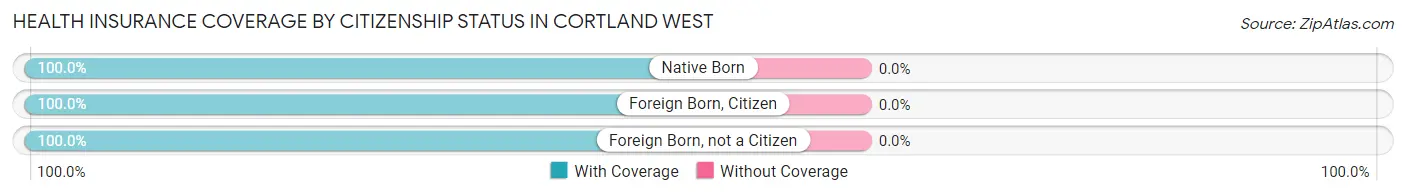
| Citizenship Status | With Coverage | Without Coverage |
| Native Born | 92 (100.0%) | 0 (0.0%) |
| Foreign Born, Citizen | 103 (100.0%) | 0 (0.0%) |
| Foreign Born, not a Citizen | 186 (100.0%) | 0 (0.0%) |
Health Insurance Coverage by Household Income in Cortland West
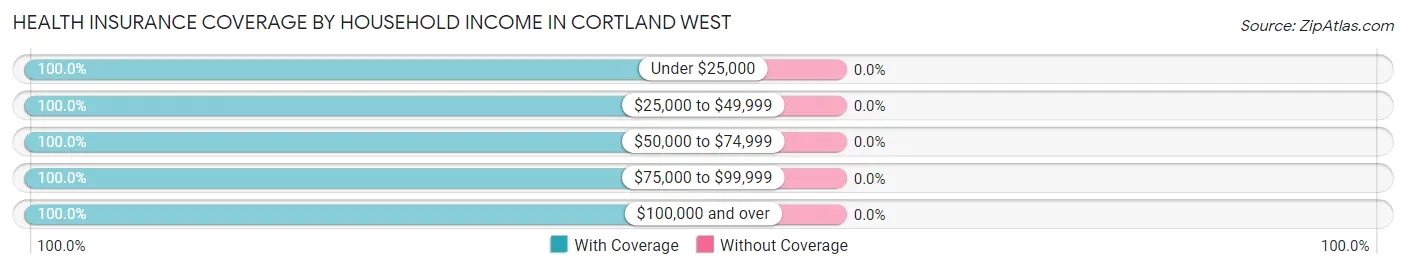
| Household Income | With Coverage | Without Coverage |
| Under $25,000 | 28 (100.0%) | 0 (0.0%) |
| $25,000 to $49,999 | 79 (100.0%) | 0 (0.0%) |
| $50,000 to $74,999 | 107 (100.0%) | 0 (0.0%) |
| $75,000 to $99,999 | 190 (100.0%) | 0 (0.0%) |
| $100,000 and over | 708 (100.0%) | 0 (0.0%) |
Public vs Private Health Insurance Coverage by Age in Cortland West
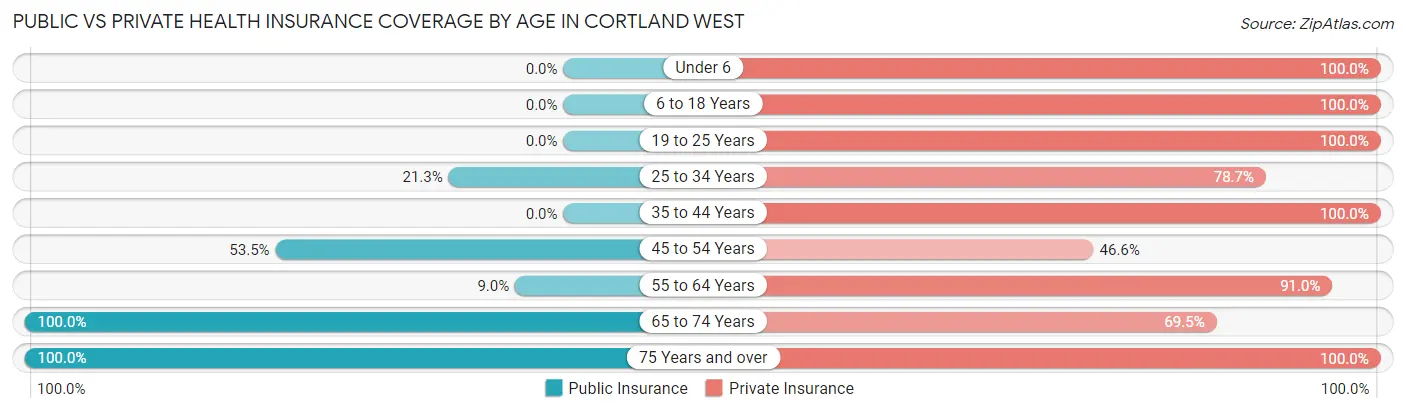
| Age Bracket | Public Insurance | Private Insurance |
| Under 6 | 0 (0.0%) | 92 (100.0%) |
| 6 to 18 Years | 0 (0.0%) | 103 (100.0%) |
| 19 to 25 Years | 0 (0.0%) | 186 (100.0%) |
| 25 to 34 Years | 13 (21.3%) | 48 (78.7%) |
| 35 to 44 Years | 0 (0.0%) | 139 (100.0%) |
| 45 to 54 Years | 62 (53.4%) | 54 (46.6%) |
| 55 to 64 Years | 21 (9.0%) | 213 (91.0%) |
| 65 to 74 Years | 174 (100.0%) | 121 (69.5%) |
| 75 Years and over | 63 (100.0%) | 63 (100.0%) |
| Total | 333 (28.5%) | 1,019 (87.2%) |
Disability Status by Sex by Age in Cortland West
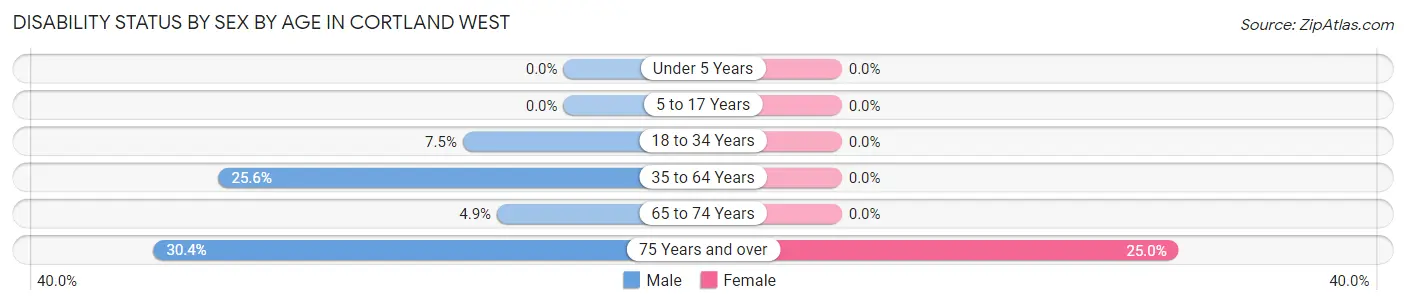
| Age Bracket | Male | Female |
| Under 5 Years | 0 (0.0%) | 0 (0.0%) |
| 5 to 17 Years | 0 (0.0%) | 0 (0.0%) |
| 18 to 34 Years | 13 (7.5%) | 0 (0.0%) |
| 35 to 64 Years | 64 (25.6%) | 0 (0.0%) |
| 65 to 74 Years | 7 (4.9%) | 0 (0.0%) |
| 75 Years and over | 7 (30.4%) | 10 (25.0%) |
Disability Class by Sex by Age in Cortland West
Disability Class: Hearing Difficulty
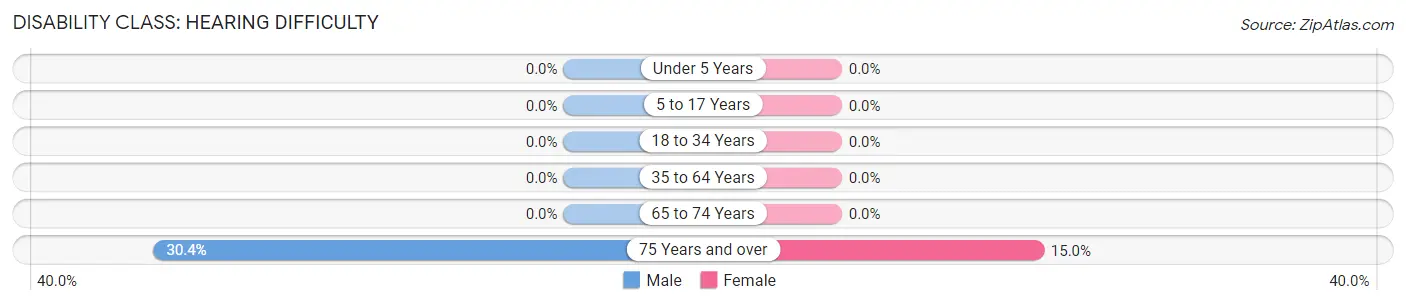
| Age Bracket | Male | Female |
| Under 5 Years | 0 (0.0%) | 0 (0.0%) |
| 5 to 17 Years | 0 (0.0%) | 0 (0.0%) |
| 18 to 34 Years | 0 (0.0%) | 0 (0.0%) |
| 35 to 64 Years | 0 (0.0%) | 0 (0.0%) |
| 65 to 74 Years | 0 (0.0%) | 0 (0.0%) |
| 75 Years and over | 7 (30.4%) | 6 (15.0%) |
Disability Class: Vision Difficulty
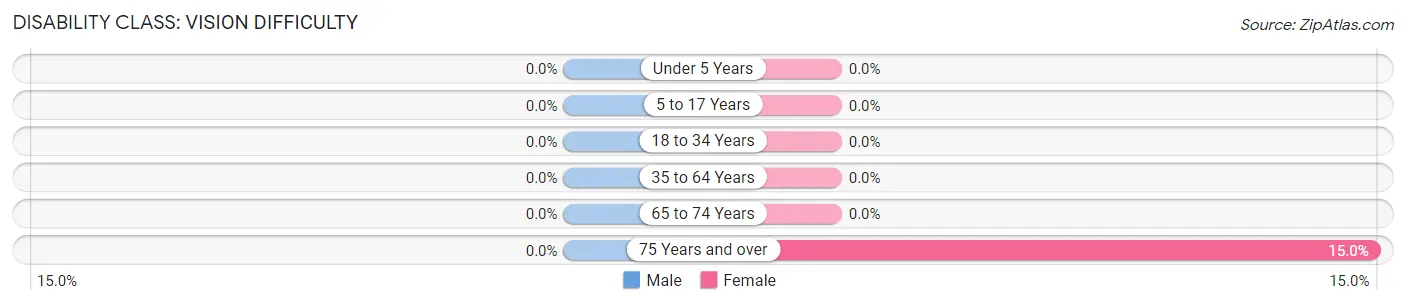
| Age Bracket | Male | Female |
| Under 5 Years | 0 (0.0%) | 0 (0.0%) |
| 5 to 17 Years | 0 (0.0%) | 0 (0.0%) |
| 18 to 34 Years | 0 (0.0%) | 0 (0.0%) |
| 35 to 64 Years | 0 (0.0%) | 0 (0.0%) |
| 65 to 74 Years | 0 (0.0%) | 0 (0.0%) |
| 75 Years and over | 0 (0.0%) | 6 (15.0%) |
Disability Class: Cognitive Difficulty
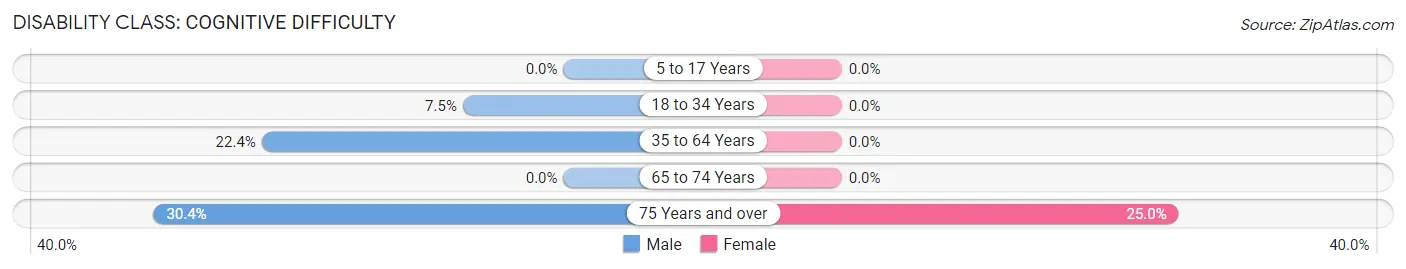
| Age Bracket | Male | Female |
| 5 to 17 Years | 0 (0.0%) | 0 (0.0%) |
| 18 to 34 Years | 13 (7.5%) | 0 (0.0%) |
| 35 to 64 Years | 56 (22.4%) | 0 (0.0%) |
| 65 to 74 Years | 0 (0.0%) | 0 (0.0%) |
| 75 Years and over | 7 (30.4%) | 10 (25.0%) |
Disability Class: Ambulatory Difficulty

| Age Bracket | Male | Female |
| 5 to 17 Years | 0 (0.0%) | 0 (0.0%) |
| 18 to 34 Years | 0 (0.0%) | 0 (0.0%) |
| 35 to 64 Years | 8 (3.2%) | 0 (0.0%) |
| 65 to 74 Years | 7 (4.9%) | 0 (0.0%) |
| 75 Years and over | 0 (0.0%) | 10 (25.0%) |
Disability Class: Self-Care Difficulty
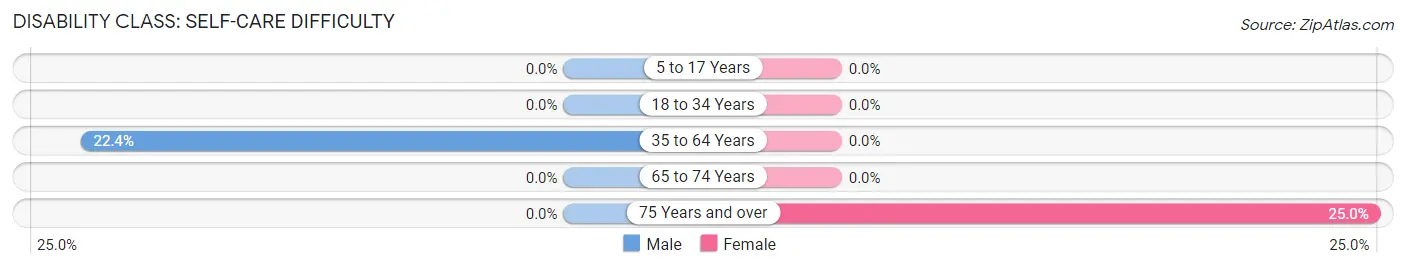
| Age Bracket | Male | Female |
| 5 to 17 Years | 0 (0.0%) | 0 (0.0%) |
| 18 to 34 Years | 0 (0.0%) | 0 (0.0%) |
| 35 to 64 Years | 56 (22.4%) | 0 (0.0%) |
| 65 to 74 Years | 0 (0.0%) | 0 (0.0%) |
| 75 Years and over | 0 (0.0%) | 10 (25.0%) |
Technology Access in Cortland West
Computing Device Access in Cortland West
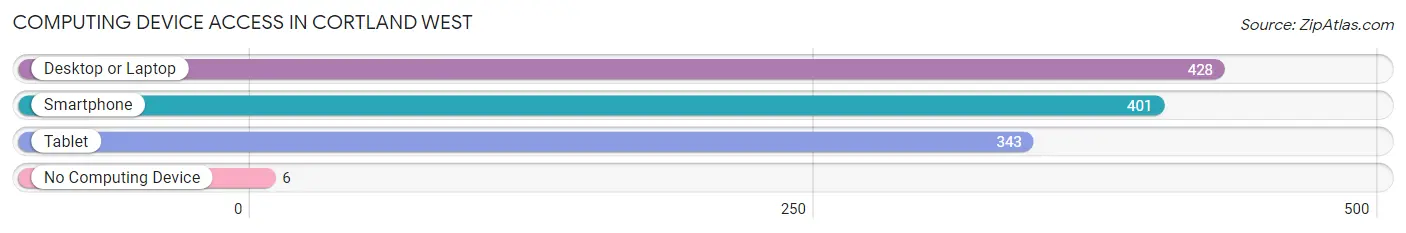
| Device Type | # Households | % Households |
| Desktop or Laptop | 428 | 98.6% |
| Smartphone | 401 | 92.4% |
| Tablet | 343 | 79.0% |
| No Computing Device | 6 | 1.4% |
| Total | 434 | 100.0% |
Internet Access in Cortland West
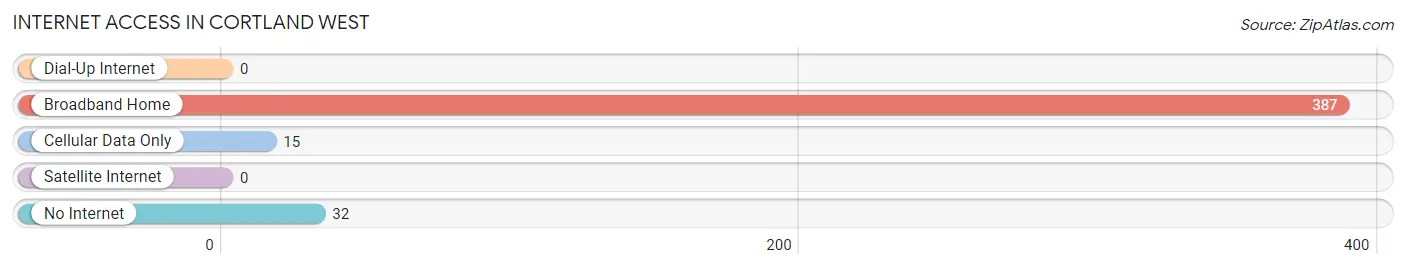
| Internet Type | # Households | % Households |
| Dial-Up Internet | 0 | 0.0% |
| Broadband Home | 387 | 89.2% |
| Cellular Data Only | 15 | 3.5% |
| Satellite Internet | 0 | 0.0% |
| No Internet | 32 | 7.4% |
| Total | 434 | 100.0% |
Cortland West Summary
Cortland West is a hamlet located in the Town of Cortlandt in Westchester County, New York. It is situated on the eastern shore of the Hudson River, approximately 25 miles north of New York City. The hamlet is bordered by the towns of Peekskill to the north, Yorktown to the east, and Cortlandt to the south.
History
The area that is now Cortland West was originally inhabited by the Wappinger Native American tribe. The first European settlers arrived in the area in the late 17th century, and the hamlet was officially established in 1788. The hamlet was named after the nearby town of Cortlandt, which was named after the Van Cortlandt family, who were prominent landowners in the area.
In the 19th century, Cortland West was a popular summer destination for wealthy New Yorkers, who built large estates in the area. The hamlet was also home to several factories, including a paper mill, a brickyard, and a tannery.
Geography
Cortland West is located in the Hudson Valley region of New York. The hamlet is situated on the eastern shore of the Hudson River, approximately 25 miles north of New York City. The hamlet is bordered by the towns of Peekskill to the north, Yorktown to the east, and Cortlandt to the south.
The terrain of Cortland West is mostly flat, with some rolling hills. The hamlet is located in a temperate climate, with hot summers and cold winters. The average annual temperature is around 50 degrees Fahrenheit.
Economy
Cortland West is primarily a residential community, with a small commercial district. The hamlet is home to several small businesses, including restaurants, shops, and professional services. The hamlet is also home to a few light industrial businesses.
The hamlet is served by the Metro-North Railroad, which provides commuter rail service to New York City. The hamlet is also served by several bus lines, which provide transportation to nearby towns and cities.
Demographics
As of the 2010 census, the population of Cortland West was 4,845. The racial makeup of the hamlet was 87.3% White, 5.3% African American, 0.3% Native American, 2.2% Asian, and 4.9% from other races. The median household income was $76,944, and the median family income was $90,944.
The majority of the population (90.3%) is of European descent. The largest ethnic groups are Italian (25.2%), Irish (17.2%), and German (14.2%). The hamlet is also home to a small Hispanic population (4.2%).
Conclusion
Cortland West is a small hamlet located in Westchester County, New York. It is situated on the eastern shore of the Hudson River, approximately 25 miles north of New York City. The hamlet was originally inhabited by the Wappinger Native American tribe, and was later settled by European settlers in the late 17th century. The hamlet is primarily a residential community, with a small commercial district. The population of Cortland West is mostly of European descent, with the largest ethnic groups being Italian, Irish, and German. The hamlet is served by the Metro-North Railroad, which provides commuter rail service to New York City.
Common Questions
What is Per Capita Income in Cortland West?
Per Capita income in Cortland West is $44,112.
What is the Median Family Income in Cortland West?
Median Family Income in Cortland West is $136,136.
What is the Median Household income in Cortland West?
Median Household Income in Cortland West is $105,417.
What is Income or Wage Gap in Cortland West?
Income or Wage Gap in Cortland West is 25.4%.
Women in Cortland West earn 74.6 cents for every dollar earned by a man.
What is Inequality or Gini Index in Cortland West?
Inequality or Gini Index in Cortland West is 0.27.
What is the Total Population of Cortland West?
Total Population of Cortland West is 1,168.
What is the Total Male Population of Cortland West?
Total Male Population of Cortland West is 667.
What is the Total Female Population of Cortland West?
Total Female Population of Cortland West is 501.
What is the Ratio of Males per 100 Females in Cortland West?
There are 133.13 Males per 100 Females in Cortland West.
What is the Ratio of Females per 100 Males in Cortland West?
There are 75.11 Females per 100 Males in Cortland West.
What is the Median Population Age in Cortland West?
Median Population Age in Cortland West is 46.2 Years.
What is the Average Family Size in Cortland West
Average Family Size in Cortland West is 2.8 People.
What is the Average Household Size in Cortland West
Average Household Size in Cortland West is 2.6 People.
How Large is the Labor Force in Cortland West?
There are 674 People in the Labor Forcein in Cortland West.
What is the Percentage of People in the Labor Force in Cortland West?
68.4% of People are in the Labor Force in Cortland West.
What is the Unemployment Rate in Cortland West?
Unemployment Rate in Cortland West is 5.3%.