Nissequogue, NY Map & Demographics
Nissequogue Map
Nissequogue Overview
$100,910
PER CAPITA INCOME
$177,188
AVG FAMILY INCOME
$154,250
AVG HOUSEHOLD INCOME
44.6%
WAGE / INCOME GAP [ % ]
55.4¢/ $1
WAGE / INCOME GAP [ $ ]
$11,225
FAMILY INCOME DEFICIT
0.52
INEQUALITY / GINI INDEX
1,523
TOTAL POPULATION
798
MALE POPULATION
725
FEMALE POPULATION
110.07
MALES / 100 FEMALES
90.85
FEMALES / 100 MALES
46.6
MEDIAN AGE
3.0
AVG FAMILY SIZE
2.7
AVG HOUSEHOLD SIZE
777
LABOR FORCE [ PEOPLE ]
60.6%
PERCENT IN LABOR FORCE
4.1%
UNEMPLOYMENT RATE
Income in Nissequogue
Income Overview in Nissequogue
Per Capita Income in Nissequogue is $100,910, while median incomes of families and households are $177,188 and $154,250 respectively.
| Characteristic | Number | Measure |
| Per Capita Income | 1,523 | $100,910 |
| Median Family Income | 453 | $177,188 |
| Mean Family Income | 453 | $294,023 |
| Median Household Income | 545 | $154,250 |
| Mean Household Income | 545 | $274,150 |
| Income Deficit | 453 | $11,225 |
| Wage / Income Gap (%) | 1,523 | 44.64% |
| Wage / Income Gap ($) | 1,523 | 55.36¢ per $1 |
| Gini / Inequality Index | 1,523 | 0.52 |
Earnings by Sex in Nissequogue
Average Earnings in Nissequogue are $81,635, $104,000 for men and $57,574 for women, a difference of 44.6%.
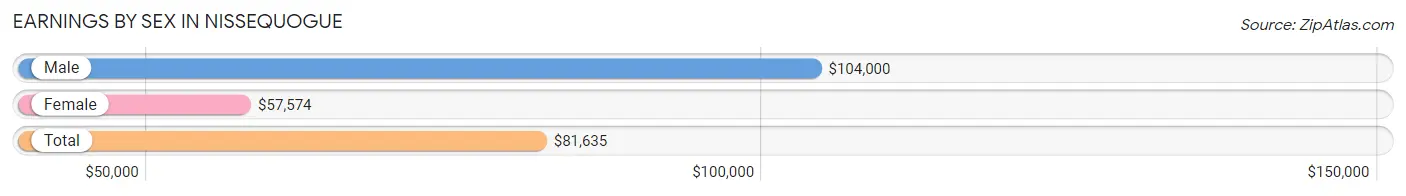
| Sex | Number | Average Earnings |
| Male | 492 (62.0%) | $104,000 |
| Female | 301 (38.0%) | $57,574 |
| Total | 793 (100.0%) | $81,635 |
Earnings by Sex by Income Bracket in Nissequogue
The most common earnings brackets in Nissequogue are $100,000+ for men (284 | 57.7%) and $100,000+ for women (84 | 27.9%).
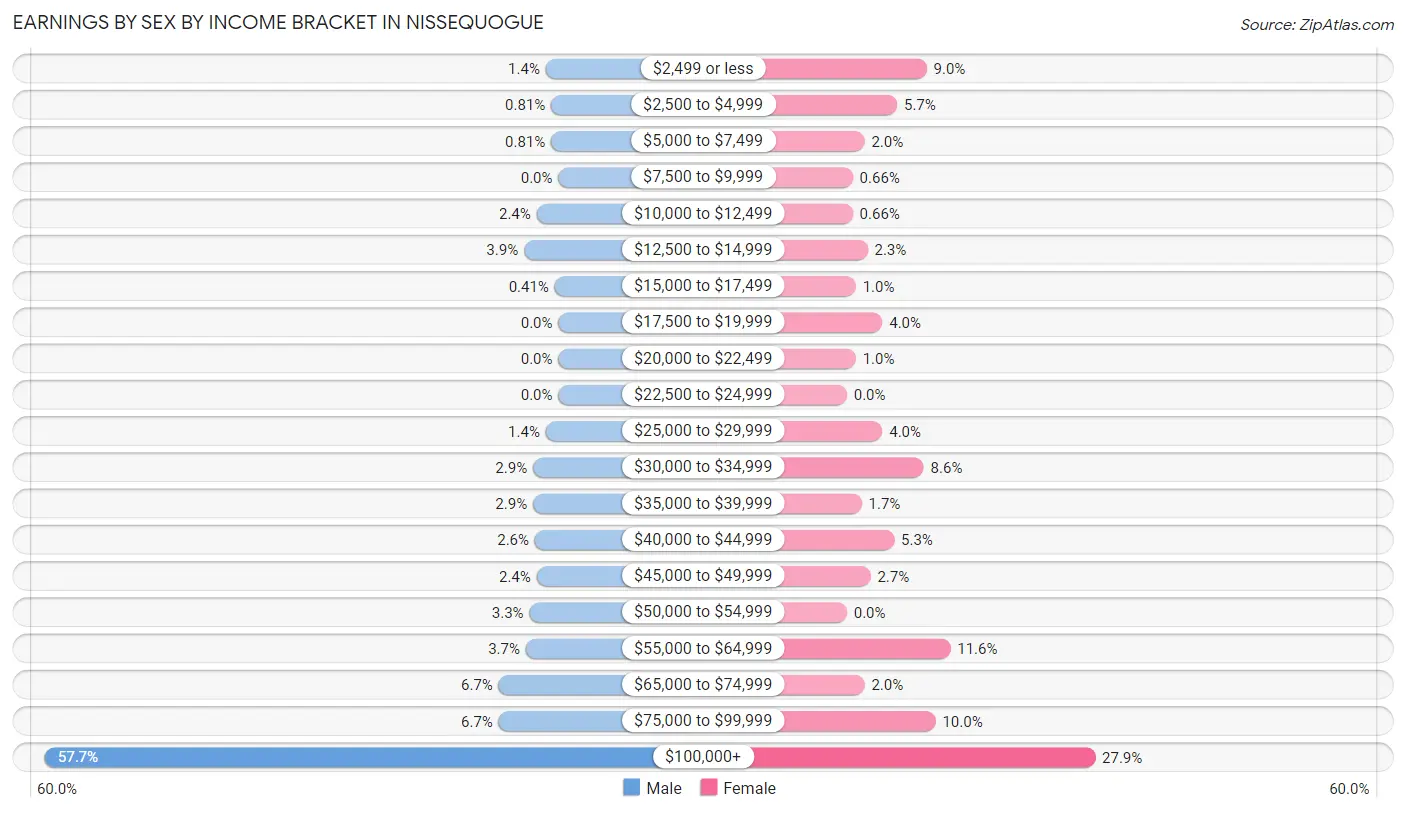
| Income | Male | Female |
| $2,499 or less | 7 (1.4%) | 27 (9.0%) |
| $2,500 to $4,999 | 4 (0.8%) | 17 (5.7%) |
| $5,000 to $7,499 | 4 (0.8%) | 6 (2.0%) |
| $7,500 to $9,999 | 0 (0.0%) | 2 (0.7%) |
| $10,000 to $12,499 | 12 (2.4%) | 2 (0.7%) |
| $12,500 to $14,999 | 19 (3.9%) | 7 (2.3%) |
| $15,000 to $17,499 | 2 (0.4%) | 3 (1.0%) |
| $17,500 to $19,999 | 0 (0.0%) | 12 (4.0%) |
| $20,000 to $22,499 | 0 (0.0%) | 3 (1.0%) |
| $22,500 to $24,999 | 0 (0.0%) | 0 (0.0%) |
| $25,000 to $29,999 | 7 (1.4%) | 12 (4.0%) |
| $30,000 to $34,999 | 14 (2.9%) | 26 (8.6%) |
| $35,000 to $39,999 | 14 (2.9%) | 5 (1.7%) |
| $40,000 to $44,999 | 13 (2.6%) | 16 (5.3%) |
| $45,000 to $49,999 | 12 (2.4%) | 8 (2.7%) |
| $50,000 to $54,999 | 16 (3.3%) | 0 (0.0%) |
| $55,000 to $64,999 | 18 (3.7%) | 35 (11.6%) |
| $65,000 to $74,999 | 33 (6.7%) | 6 (2.0%) |
| $75,000 to $99,999 | 33 (6.7%) | 30 (10.0%) |
| $100,000+ | 284 (57.7%) | 84 (27.9%) |
| Total | 492 (100.0%) | 301 (100.0%) |
Earnings by Sex by Educational Attainment in Nissequogue
Average earnings in Nissequogue are $109,500 for men and $63,000 for women, a difference of 42.5%. Men with an educational attainment of graduate degree enjoy the highest average annual earnings of $172,679, while those with high school diploma education earn the least with $45,625. Women with an educational attainment of graduate degree earn the most with the average annual earnings of $90,833, while those with high school diploma education have the smallest earnings of $33,661.
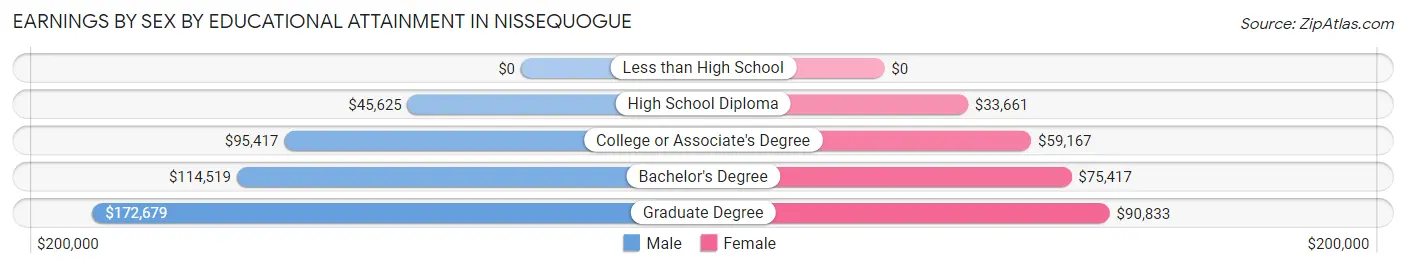
| Educational Attainment | Male Income | Female Income |
| Less than High School | - | - |
| High School Diploma | $45,625 | $33,661 |
| College or Associate's Degree | $95,417 | $59,167 |
| Bachelor's Degree | $114,519 | $75,417 |
| Graduate Degree | $172,679 | $90,833 |
| Total | $109,500 | $63,000 |
Family Income in Nissequogue
Family Income Brackets in Nissequogue
According to the Nissequogue family income data, there are 204 families falling into the $200,000+ income range, which is the most common income bracket and makes up 45.0% of all families.
| Income Bracket | # Families | % Families |
| Less than $10,000 | 3 | 0.7% |
| $10,000 to $14,999 | 9 | 2.0% |
| $15,000 to $24,999 | 0 | 0.0% |
| $25,000 to $34,999 | 11 | 2.4% |
| $35,000 to $49,999 | 3 | 0.7% |
| $50,000 to $74,999 | 15 | 3.3% |
| $75,000 to $99,999 | 63 | 13.9% |
| $100,000 to $149,999 | 108 | 23.8% |
| $150,000 to $199,999 | 37 | 8.2% |
| $200,000+ | 204 | 45.0% |
Family Income by Famaliy Size in Nissequogue
4-person families (57 | 12.6%) account for the highest median family income in Nissequogue with $250,001 per family, while 3-person families (123 | 27.2%) have the highest median income of $72,560 per family member.
| Income Bracket | # Families | Median Income |
| 2-Person Families | 230 (50.8%) | $117,813 |
| 3-Person Families | 123 (27.2%) | $217,679 |
| 4-Person Families | 57 (12.6%) | $250,001 |
| 5-Person Families | 43 (9.5%) | $192,917 |
| 6-Person Families | 0 (0.0%) | $0 |
| 7+ Person Families | 0 (0.0%) | $0 |
| Total | 453 (100.0%) | $177,188 |
Family Income by Number of Earners in Nissequogue
The median family income in Nissequogue is $177,188, with families comprising 2 earners (129) having the highest median family income of $225,156, while families with no earners (58) have the lowest median family income of $115,192, accounting for 28.5% and 12.8% of families, respectively.
| Number of Earners | # Families | Median Income |
| No Earners | 58 (12.8%) | $115,192 |
| 1 Earner | 211 (46.6%) | $118,281 |
| 2 Earners | 129 (28.5%) | $225,156 |
| 3+ Earners | 55 (12.1%) | $204,583 |
| Total | 453 (100.0%) | $177,188 |
Household Income in Nissequogue
Household Income Brackets in Nissequogue
With 227 households falling in the category, the $200,000+ income range is the most frequent in Nissequogue, accounting for 41.6% of all households. In contrast, only 3 households (0.5%) fall into the $15,000 to $24,999 income bracket, making it the least populous group.
| Income Bracket | # Households | % Households |
| Less than $10,000 | 6 | 1.1% |
| $10,000 to $14,999 | 9 | 1.7% |
| $15,000 to $24,999 | 3 | 0.6% |
| $25,000 to $34,999 | 13 | 2.4% |
| $35,000 to $49,999 | 8 | 1.5% |
| $50,000 to $74,999 | 41 | 7.5% |
| $75,000 to $99,999 | 65 | 11.9% |
| $100,000 to $149,999 | 124 | 22.8% |
| $150,000 to $199,999 | 49 | 9.0% |
| $200,000+ | 227 | 41.7% |
Household Income by Householder Age in Nissequogue
The median household income in Nissequogue is $154,250, with the highest median household income of $250,001 found in the 25 to 44 years age bracket for the primary householder. A total of 74 households (13.6%) fall into this category. Meanwhile, the 15 to 24 years age bracket for the primary householder has the lowest median household income of $60,694, with 25 households (4.6%) in this group.
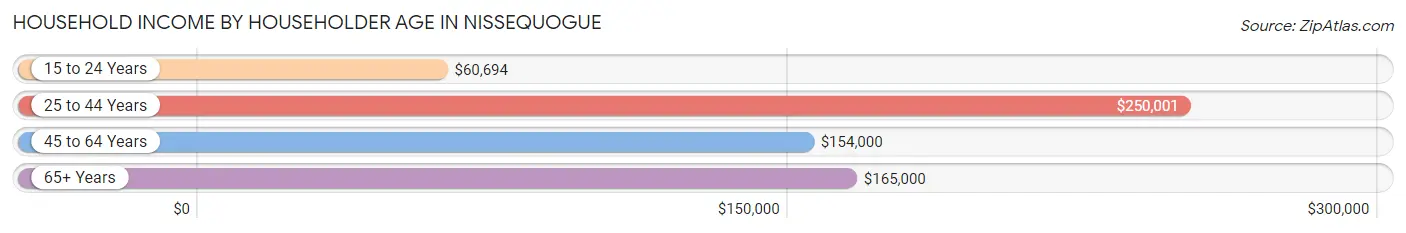
| Income Bracket | # Households | Median Income |
| 15 to 24 Years | 25 (4.6%) | $60,694 |
| 25 to 44 Years | 74 (13.6%) | $250,001 |
| 45 to 64 Years | 290 (53.2%) | $154,000 |
| 65+ Years | 156 (28.6%) | $165,000 |
| Total | 545 (100.0%) | $154,250 |
Poverty in Nissequogue
Income Below Poverty by Sex and Age in Nissequogue
With 2.4% poverty level for males and 6.8% for females among the residents of Nissequogue, 75 year old and over males and 35 to 44 year old females are the most vulnerable to poverty, with 6 males (11.1%) and 17 females (19.3%) in their respective age groups living below the poverty level.
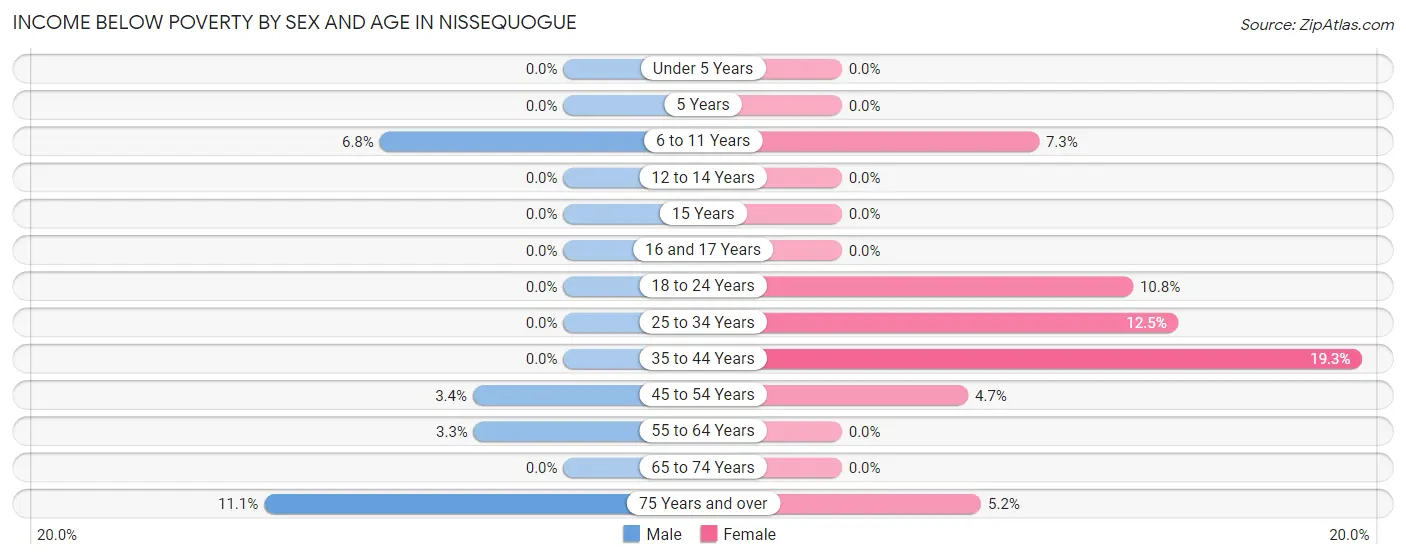
| Age Bracket | Male | Female |
| Under 5 Years | 0 (0.0%) | 0 (0.0%) |
| 5 Years | 0 (0.0%) | 0 (0.0%) |
| 6 to 11 Years | 3 (6.8%) | 3 (7.3%) |
| 12 to 14 Years | 0 (0.0%) | 0 (0.0%) |
| 15 Years | 0 (0.0%) | 0 (0.0%) |
| 16 and 17 Years | 0 (0.0%) | 0 (0.0%) |
| 18 to 24 Years | 0 (0.0%) | 12 (10.8%) |
| 25 to 34 Years | 0 (0.0%) | 8 (12.5%) |
| 35 to 44 Years | 0 (0.0%) | 17 (19.3%) |
| 45 to 54 Years | 4 (3.4%) | 6 (4.7%) |
| 55 to 64 Years | 6 (3.3%) | 0 (0.0%) |
| 65 to 74 Years | 0 (0.0%) | 0 (0.0%) |
| 75 Years and over | 6 (11.1%) | 3 (5.2%) |
| Total | 19 (2.4%) | 49 (6.8%) |
Income Above Poverty by Sex and Age in Nissequogue
According to the poverty statistics in Nissequogue, males aged under 5 years and females aged under 5 years are the age groups that are most secure financially, with 100.0% of males and 100.0% of females in these age groups living above the poverty line.
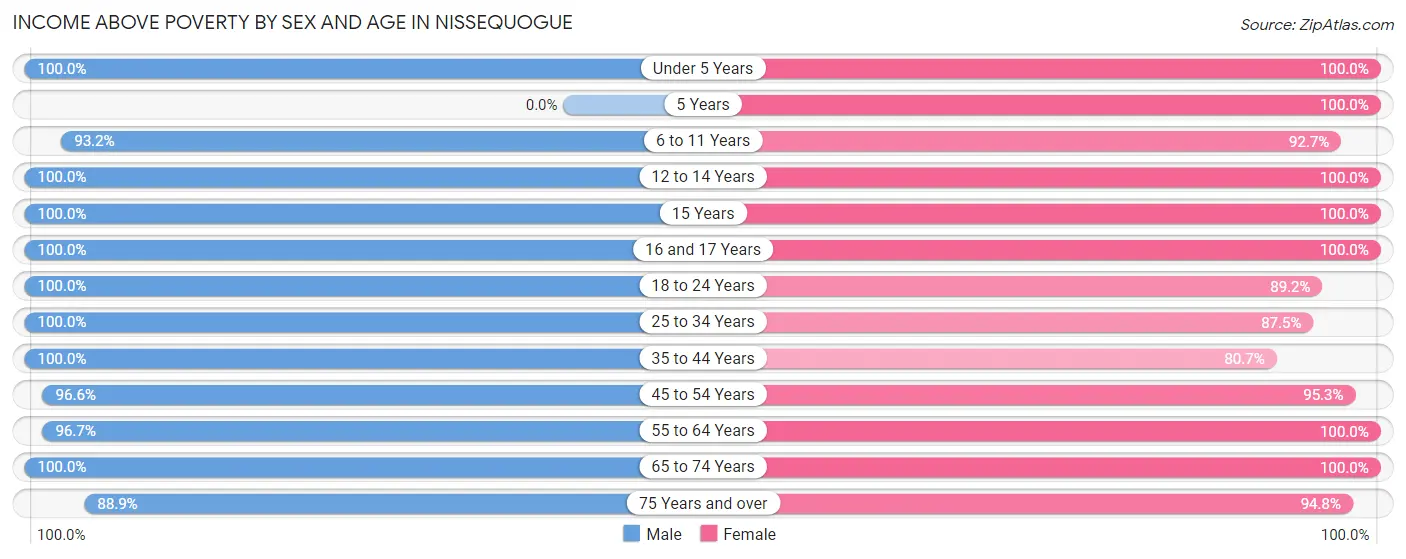
| Age Bracket | Male | Female |
| Under 5 Years | 38 (100.0%) | 6 (100.0%) |
| 5 Years | 0 (0.0%) | 21 (100.0%) |
| 6 to 11 Years | 41 (93.2%) | 38 (92.7%) |
| 12 to 14 Years | 45 (100.0%) | 20 (100.0%) |
| 15 Years | 18 (100.0%) | 7 (100.0%) |
| 16 and 17 Years | 20 (100.0%) | 12 (100.0%) |
| 18 to 24 Years | 74 (100.0%) | 99 (89.2%) |
| 25 to 34 Years | 63 (100.0%) | 56 (87.5%) |
| 35 to 44 Years | 54 (100.0%) | 71 (80.7%) |
| 45 to 54 Years | 115 (96.6%) | 122 (95.3%) |
| 55 to 64 Years | 174 (96.7%) | 104 (100.0%) |
| 65 to 74 Years | 89 (100.0%) | 65 (100.0%) |
| 75 Years and over | 48 (88.9%) | 55 (94.8%) |
| Total | 779 (97.6%) | 676 (93.2%) |
Income Below Poverty Among Married-Couple Families in Nissequogue
The poverty statistics for married-couple families in Nissequogue show that 3.3% or 12 of the total 362 families live below the poverty line. Families with no children have the highest poverty rate of 3.6%, comprising of 9 families. On the other hand, families with 3 or 4 children have the lowest poverty rate of 0.0%, which includes 0 families.
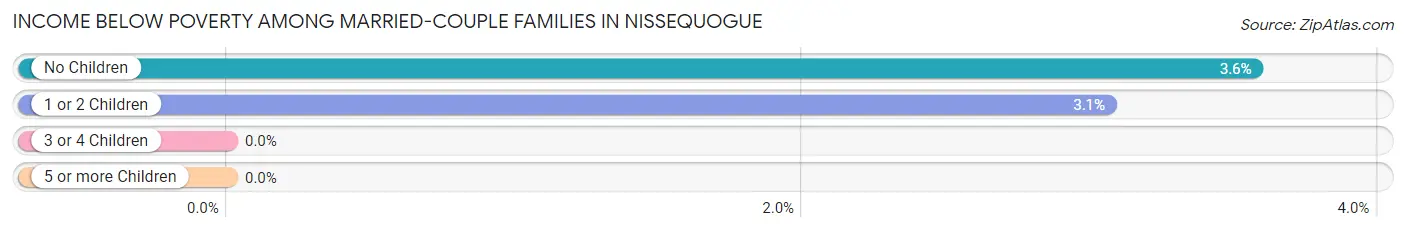
| Children | Above Poverty | Below Poverty |
| No Children | 243 (96.4%) | 9 (3.6%) |
| 1 or 2 Children | 95 (96.9%) | 3 (3.1%) |
| 3 or 4 Children | 12 (100.0%) | 0 (0.0%) |
| 5 or more Children | 0 (0.0%) | 0 (0.0%) |
| Total | 350 (96.7%) | 12 (3.3%) |
Income Below Poverty Among Single-Parent Households in Nissequogue
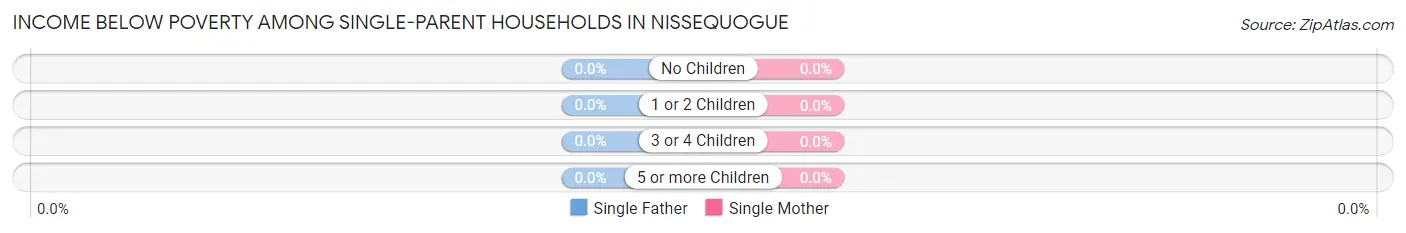
| Children | Single Father | Single Mother |
| No Children | 0 (0.0%) | 0 (0.0%) |
| 1 or 2 Children | 0 (0.0%) | 0 (0.0%) |
| 3 or 4 Children | 0 (0.0%) | 0 (0.0%) |
| 5 or more Children | 0 (0.0%) | 0 (0.0%) |
| Total | 0 (0.0%) | 0 (0.0%) |
Income Below Poverty Among Married-Couple vs Single-Parent Households in Nissequogue
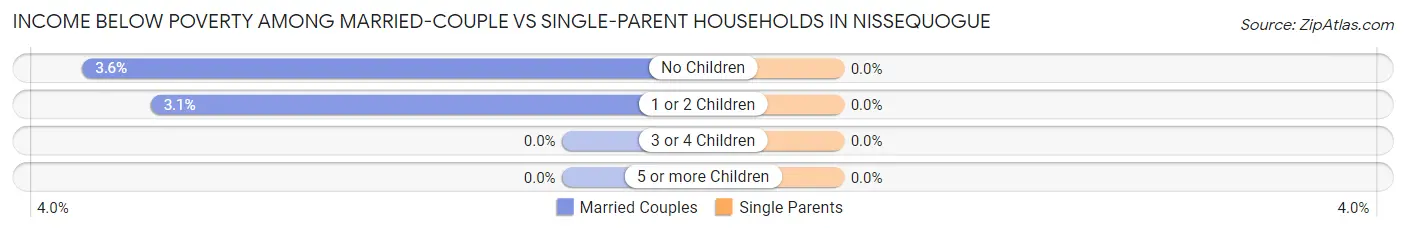
| Children | Married-Couple Families | Single-Parent Households |
| No Children | 9 (3.6%) | 0 (0.0%) |
| 1 or 2 Children | 3 (3.1%) | 0 (0.0%) |
| 3 or 4 Children | 0 (0.0%) | 0 (0.0%) |
| 5 or more Children | 0 (0.0%) | 0 (0.0%) |
| Total | 12 (3.3%) | 0 (0.0%) |
Race in Nissequogue
The most populous races in Nissequogue are White / Caucasian (1,188 | 78.0%), Hispanic or Latino (147 | 9.7%), and Two or more Races (128 | 8.4%).
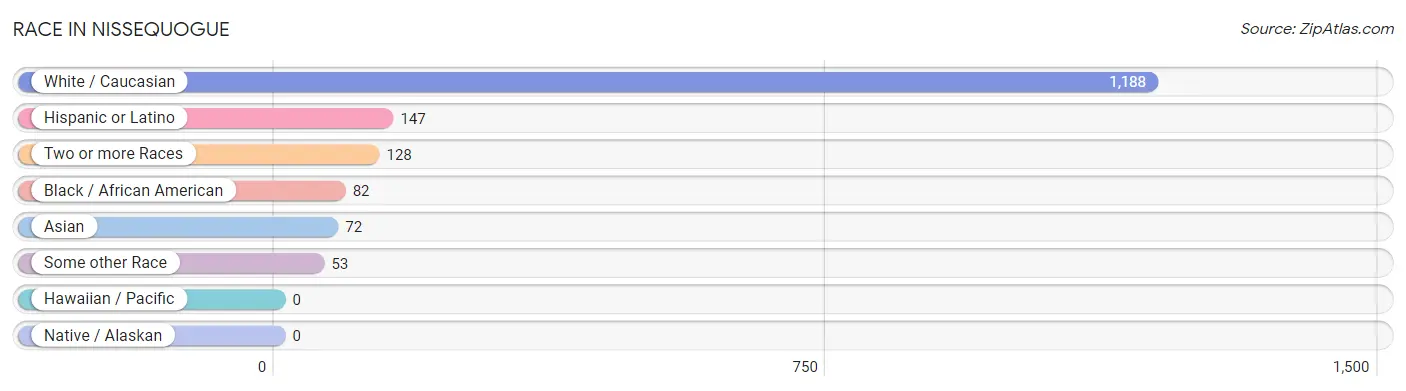
| Race | # Population | % Population |
| Asian | 72 | 4.7% |
| Black / African American | 82 | 5.4% |
| Hawaiian / Pacific | 0 | 0.0% |
| Hispanic or Latino | 147 | 9.7% |
| Native / Alaskan | 0 | 0.0% |
| White / Caucasian | 1,188 | 78.0% |
| Two or more Races | 128 | 8.4% |
| Some other Race | 53 | 3.5% |
| Total | 1,523 | 100.0% |
Ancestry in Nissequogue
The most populous ancestries reported in Nissequogue are Italian (411 | 27.0%), Irish (256 | 16.8%), German (187 | 12.3%), Polish (90 | 5.9%), and American (75 | 4.9%), together accounting for 66.9% of all Nissequogue residents.

| Ancestry | # Population | % Population |
| African | 10 | 0.7% |
| American | 75 | 4.9% |
| Arab | 4 | 0.3% |
| Armenian | 3 | 0.2% |
| Austrian | 13 | 0.9% |
| Bolivian | 7 | 0.5% |
| Brazilian | 5 | 0.3% |
| British | 3 | 0.2% |
| Canadian | 18 | 1.2% |
| Central American | 35 | 2.3% |
| Chippewa | 10 | 0.7% |
| Colombian | 5 | 0.3% |
| Costa Rican | 12 | 0.8% |
| Cuban | 25 | 1.6% |
| Dominican | 15 | 1.0% |
| Dutch | 44 | 2.9% |
| Eastern European | 13 | 0.9% |
| English | 62 | 4.1% |
| European | 20 | 1.3% |
| Finnish | 9 | 0.6% |
| French | 42 | 2.8% |
| French Canadian | 2 | 0.1% |
| German | 187 | 12.3% |
| Greek | 62 | 4.1% |
| Guatemalan | 13 | 0.9% |
| Honduran | 5 | 0.3% |
| Hungarian | 12 | 0.8% |
| Indian (Asian) | 52 | 3.4% |
| Iranian | 3 | 0.2% |
| Iraqi | 4 | 0.3% |
| Irish | 256 | 16.8% |
| Italian | 411 | 27.0% |
| Korean | 20 | 1.3% |
| Lithuanian | 6 | 0.4% |
| Mexican | 6 | 0.4% |
| Mongolian | 5 | 0.3% |
| Northern European | 12 | 0.8% |
| Norwegian | 13 | 0.9% |
| Panamanian | 5 | 0.3% |
| Peruvian | 3 | 0.2% |
| Polish | 90 | 5.9% |
| Portuguese | 23 | 1.5% |
| Puerto Rican | 37 | 2.4% |
| Romanian | 5 | 0.3% |
| Russian | 57 | 3.7% |
| Scandinavian | 3 | 0.2% |
| Scottish | 5 | 0.3% |
| South American | 15 | 1.0% |
| Spanish | 3 | 0.2% |
| Subsaharan African | 10 | 0.7% |
| Swiss | 2 | 0.1% |
| Thai | 40 | 2.6% |
| Turkish | 6 | 0.4% |
| Ukrainian | 17 | 1.1% | View All 54 Rows |
Immigrants in Nissequogue
The most numerous immigrant groups reported in Nissequogue came from Asia (55 | 3.6%), Europe (46 | 3.0%), Africa (34 | 2.2%), Latin America (24 | 1.6%), and South Central Asia (24 | 1.6%), together accounting for 12.0% of all Nissequogue residents.
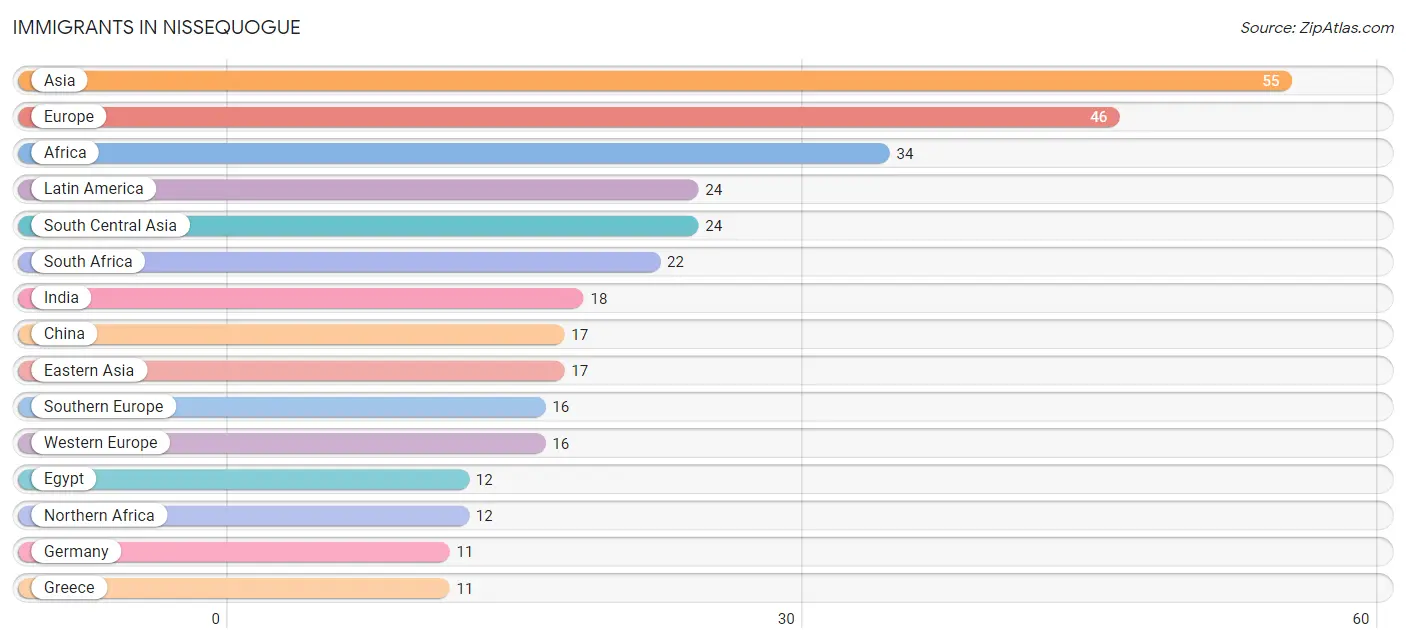
| Immigration Origin | # Population | % Population |
| Africa | 34 | 2.2% |
| Asia | 55 | 3.6% |
| Austria | 3 | 0.2% |
| Bolivia | 2 | 0.1% |
| Brazil | 3 | 0.2% |
| Caribbean | 7 | 0.5% |
| Central America | 7 | 0.5% |
| China | 17 | 1.1% |
| Colombia | 5 | 0.3% |
| Eastern Asia | 17 | 1.1% |
| Eastern Europe | 8 | 0.5% |
| Egypt | 12 | 0.8% |
| England | 5 | 0.3% |
| Europe | 46 | 3.0% |
| Germany | 11 | 0.7% |
| Greece | 11 | 0.7% |
| Honduras | 5 | 0.3% |
| India | 18 | 1.2% |
| Iran | 3 | 0.2% |
| Iraq | 4 | 0.3% |
| Italy | 2 | 0.1% |
| Latin America | 24 | 1.6% |
| Malaysia | 2 | 0.1% |
| Mexico | 2 | 0.1% |
| Northern Africa | 12 | 0.8% |
| Northern Europe | 6 | 0.4% |
| Pakistan | 3 | 0.2% |
| Poland | 3 | 0.2% |
| Portugal | 3 | 0.2% |
| Singapore | 3 | 0.2% |
| South Africa | 22 | 1.4% |
| South America | 10 | 0.7% |
| South Central Asia | 24 | 1.6% |
| South Eastern Asia | 5 | 0.3% |
| Southern Europe | 16 | 1.1% |
| Switzerland | 2 | 0.1% |
| Trinidad and Tobago | 7 | 0.5% |
| Turkey | 5 | 0.3% |
| Western Asia | 9 | 0.6% |
| Western Europe | 16 | 1.1% | View All 40 Rows |
Sex and Age in Nissequogue
Sex and Age in Nissequogue
The most populous age groups in Nissequogue are 55 to 59 Years (91 | 11.4%) for men and 50 to 54 Years (75 | 10.3%) for women.
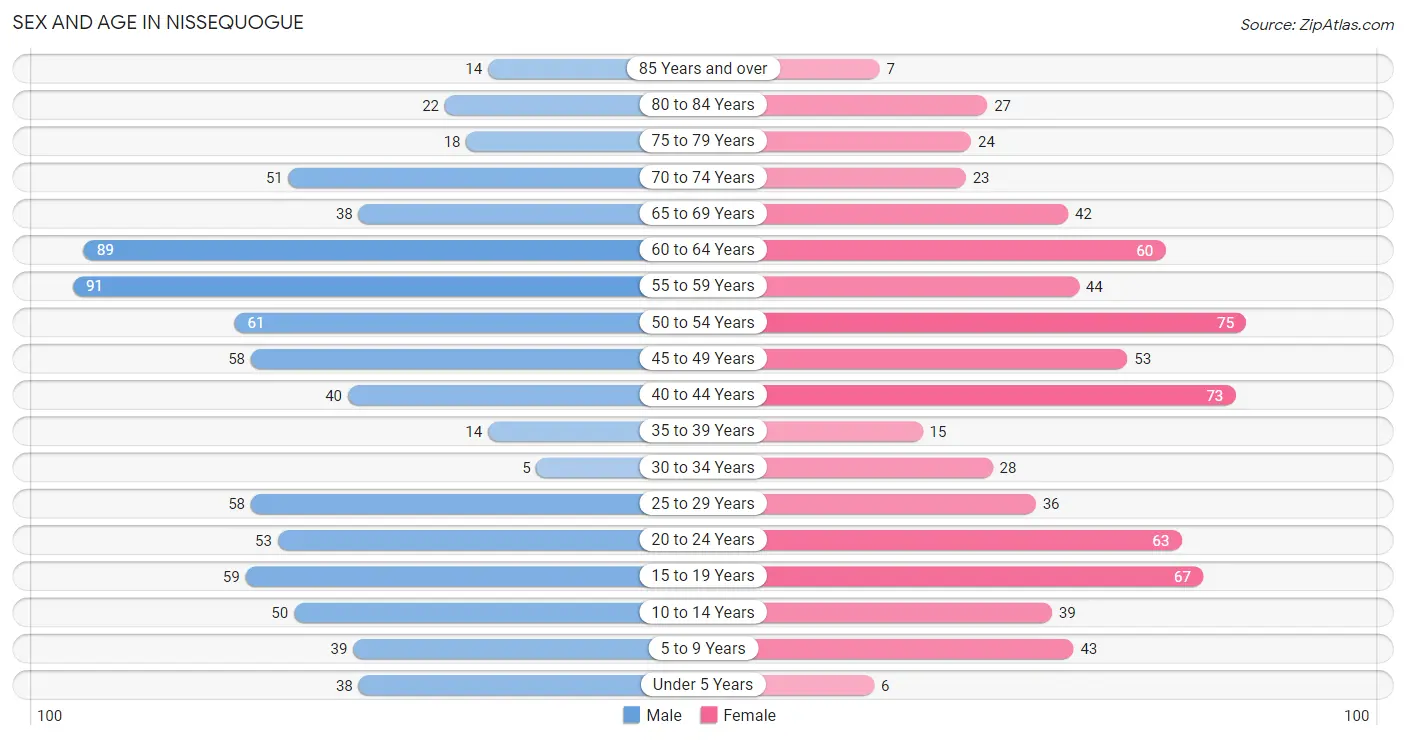
| Age Bracket | Male | Female |
| Under 5 Years | 38 (4.8%) | 6 (0.8%) |
| 5 to 9 Years | 39 (4.9%) | 43 (5.9%) |
| 10 to 14 Years | 50 (6.3%) | 39 (5.4%) |
| 15 to 19 Years | 59 (7.4%) | 67 (9.2%) |
| 20 to 24 Years | 53 (6.6%) | 63 (8.7%) |
| 25 to 29 Years | 58 (7.3%) | 36 (5.0%) |
| 30 to 34 Years | 5 (0.6%) | 28 (3.9%) |
| 35 to 39 Years | 14 (1.8%) | 15 (2.1%) |
| 40 to 44 Years | 40 (5.0%) | 73 (10.1%) |
| 45 to 49 Years | 58 (7.3%) | 53 (7.3%) |
| 50 to 54 Years | 61 (7.6%) | 75 (10.3%) |
| 55 to 59 Years | 91 (11.4%) | 44 (6.1%) |
| 60 to 64 Years | 89 (11.2%) | 60 (8.3%) |
| 65 to 69 Years | 38 (4.8%) | 42 (5.8%) |
| 70 to 74 Years | 51 (6.4%) | 23 (3.2%) |
| 75 to 79 Years | 18 (2.3%) | 24 (3.3%) |
| 80 to 84 Years | 22 (2.8%) | 27 (3.7%) |
| 85 Years and over | 14 (1.8%) | 7 (1.0%) |
| Total | 798 (100.0%) | 725 (100.0%) |
Families and Households in Nissequogue
Median Family Size in Nissequogue
The median family size in Nissequogue is 2.97 persons per family, with single female/mother families (29 | 6.4%) accounting for the largest median family size of 3.28 persons per family. On the other hand, single male/father families (62 | 13.7%) represent the smallest median family size with 2.11 persons per family.
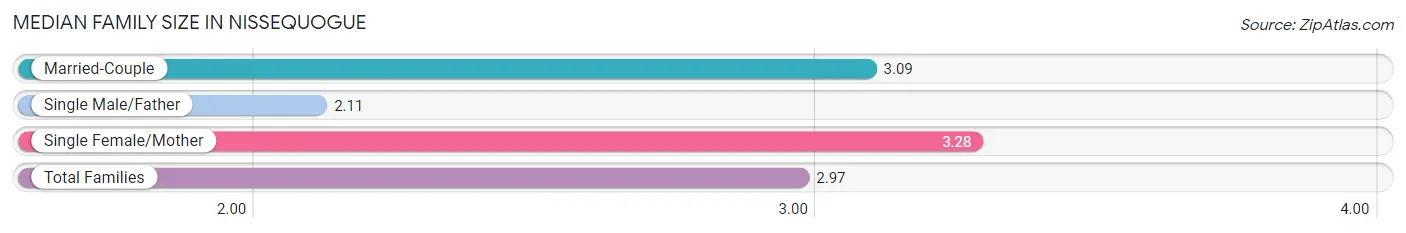
| Family Type | # Families | Family Size |
| Married-Couple | 362 (79.9%) | 3.09 |
| Single Male/Father | 62 (13.7%) | 2.11 |
| Single Female/Mother | 29 (6.4%) | 3.28 |
| Total Families | 453 (100.0%) | 2.97 |
Median Household Size in Nissequogue
The median household size in Nissequogue is 2.71 persons per household, with single female/mother households (29 | 5.3%) accounting for the largest median household size of 3.28 persons per household. non-family households (92 | 16.9%) represent the smallest median household size with 1.07 persons per household.
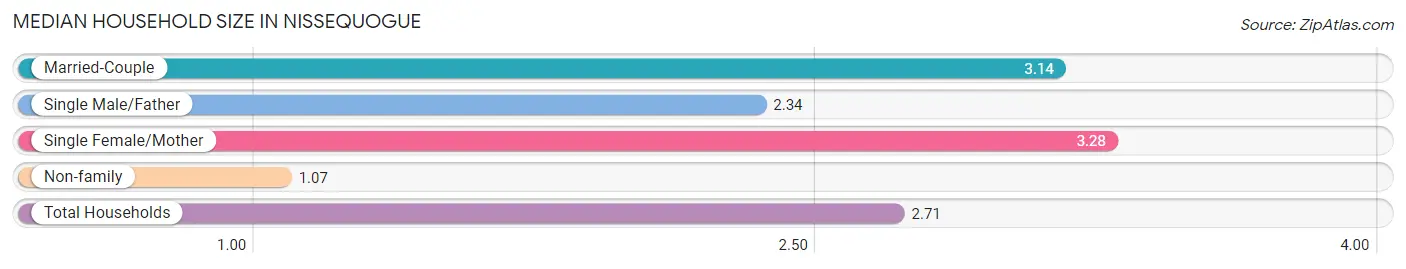
| Household Type | # Households | Household Size |
| Married-Couple | 362 (66.4%) | 3.14 |
| Single Male/Father | 62 (11.4%) | 2.34 |
| Single Female/Mother | 29 (5.3%) | 3.28 |
| Non-family | 92 (16.9%) | 1.07 |
| Total Households | 545 (100.0%) | 2.71 |
Household Size by Marriage Status in Nissequogue
Out of a total of 545 households in Nissequogue, 453 (83.1%) are family households, while 92 (16.9%) are nonfamily households. The most numerous type of family households are 2-person households, comprising 222, and the most common type of nonfamily households are 1-person households, comprising 83.
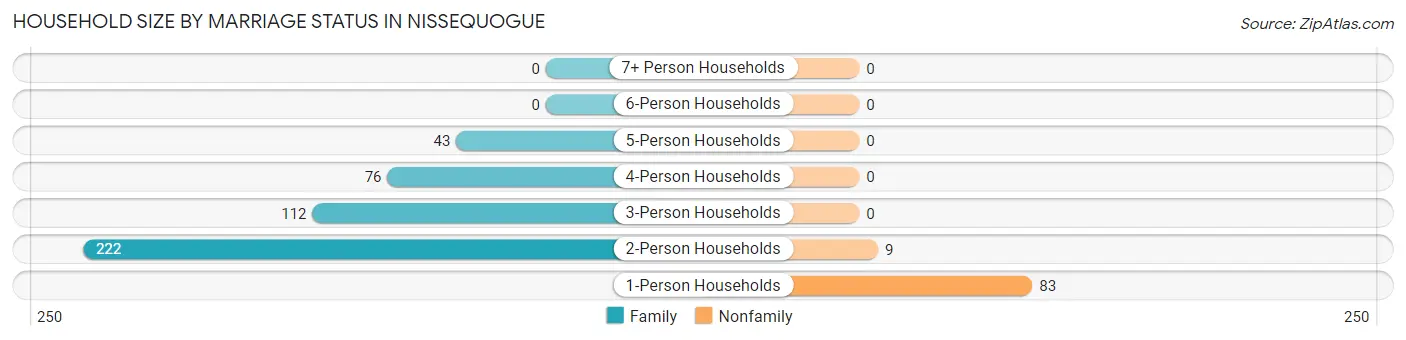
| Household Size | Family Households | Nonfamily Households |
| 1-Person Households | - | 83 (15.2%) |
| 2-Person Households | 222 (40.7%) | 9 (1.7%) |
| 3-Person Households | 112 (20.5%) | 0 (0.0%) |
| 4-Person Households | 76 (13.9%) | 0 (0.0%) |
| 5-Person Households | 43 (7.9%) | 0 (0.0%) |
| 6-Person Households | 0 (0.0%) | 0 (0.0%) |
| 7+ Person Households | 0 (0.0%) | 0 (0.0%) |
| Total | 453 (83.1%) | 92 (16.9%) |
Female Fertility in Nissequogue
Fertility by Age in Nissequogue
| Age Bracket | Women with Births | Births / 1,000 Women |
| 15 to 19 years | 0 (0.0%) | 0.0 |
| 20 to 34 years | 0 (0.0%) | 0.0 |
| 35 to 50 years | 0 (0.0%) | 0.0 |
| Total | 0 (0.0%) | 0.0 |
Fertility by Age by Marriage Status in Nissequogue
| Age Bracket | Married | Unmarried |
| 15 to 19 years | 0 (0.0%) | 0 (0.0%) |
| 20 to 34 years | 0 (0.0%) | 0 (0.0%) |
| 35 to 50 years | 0 (0.0%) | 0 (0.0%) |
| Total | 0 (0.0%) | 0 (0.0%) |
Fertility by Education in Nissequogue
| Educational Attainment | Women with Births | Births / 1,000 Women |
| Less than High School | 0 (0.0%) | 0.0 |
| High School Diploma | 0 (0.0%) | 0.0 |
| College or Associate's Degree | 0 (0.0%) | 0.0 |
| Bachelor's Degree | 0 (0.0%) | 0.0 |
| Graduate Degree | 0 (0.0%) | 0.0 |
| Total | 0 (0.0%) | 0.0 |
Fertility by Education by Marriage Status in Nissequogue
| Educational Attainment | Married | Unmarried |
| Less than High School | 0 (0.0%) | 0 (0.0%) |
| High School Diploma | 0 (0.0%) | 0 (0.0%) |
| College or Associate's Degree | 0 (0.0%) | 0 (0.0%) |
| Bachelor's Degree | 0 (0.0%) | 0 (0.0%) |
| Graduate Degree | 0 (0.0%) | 0 (0.0%) |
| Total | 0 (0.0%) | 0 (0.0%) |
Employment Characteristics in Nissequogue
Employment by Class of Employer in Nissequogue
Among the 734 employed individuals in Nissequogue, private company employees (426 | 58.0%), self-employed (incorporated) (140 | 19.1%), and self-employed (not incorporated) (43 | 5.9%) make up the most common classes of employment.
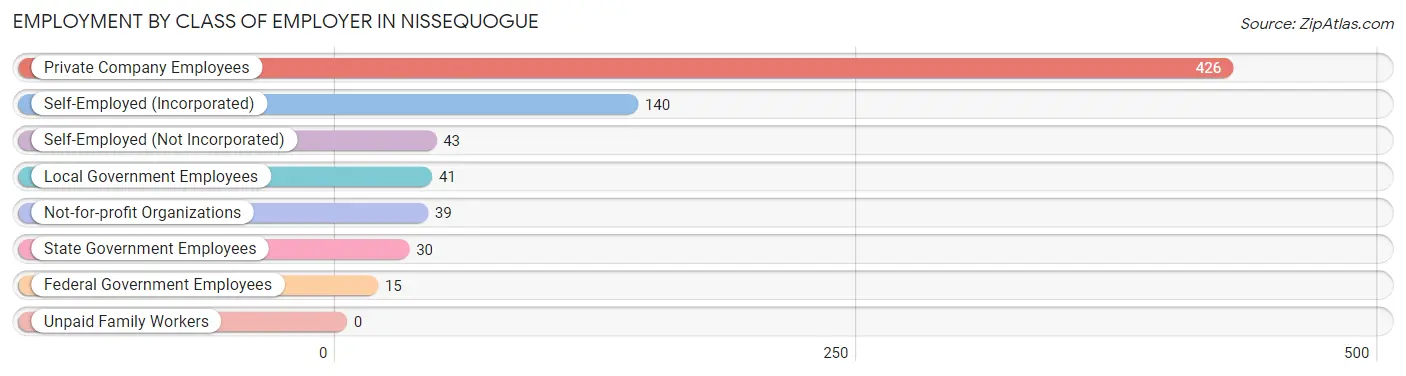
| Employer Class | # Employees | % Employees |
| Private Company Employees | 426 | 58.0% |
| Self-Employed (Incorporated) | 140 | 19.1% |
| Self-Employed (Not Incorporated) | 43 | 5.9% |
| Not-for-profit Organizations | 39 | 5.3% |
| Local Government Employees | 41 | 5.6% |
| State Government Employees | 30 | 4.1% |
| Federal Government Employees | 15 | 2.0% |
| Unpaid Family Workers | 0 | 0.0% |
| Total | 734 | 100.0% |
Employment Status by Age in Nissequogue
According to the labor force statistics for Nissequogue, out of the total population over 16 years of age (1,283), 60.6% or 777 individuals are in the labor force, with 4.1% or 32 of them unemployed. The age group with the highest labor force participation rate is 25 to 29 years, with 91.5% or 86 individuals in the labor force. Within the labor force, the 35 to 44 years age range has the highest percentage of unemployed individuals, with 14.6% or 14 of them being unemployed.
| Age Bracket | In Labor Force | Unemployed |
| 16 to 19 Years | 13 (12.9%) | 0 (0.0%) |
| 20 to 24 Years | 74 (63.8%) | 7 (9.5%) |
| 25 to 29 Years | 86 (91.5%) | 11 (12.8%) |
| 30 to 34 Years | 29 (87.9%) | 0 (0.0%) |
| 35 to 44 Years | 96 (67.6%) | 14 (14.6%) |
| 45 to 54 Years | 183 (74.1%) | 0 (0.0%) |
| 55 to 59 Years | 118 (87.4%) | 0 (0.0%) |
| 60 to 64 Years | 98 (65.8%) | 0 (0.0%) |
| 65 to 74 Years | 63 (40.9%) | 0 (0.0%) |
| 75 Years and over | 17 (15.2%) | 0 (0.0%) |
| Total | 777 (60.6%) | 32 (4.1%) |
Employment Status by Educational Attainment in Nissequogue
According to labor force statistics for Nissequogue, 76.3% of individuals (610) out of the total population between 25 and 64 years of age (800) are in the labor force, with 4.1% or 25 of them being unemployed. The group with the highest labor force participation rate are those with the educational attainment of bachelor's degree or higher, with 81.3% or 416 individuals in the labor force. Within the labor force, individuals with college / associate degree education have the highest percentage of unemployment, with 10.1% or 14 of them being unemployed.
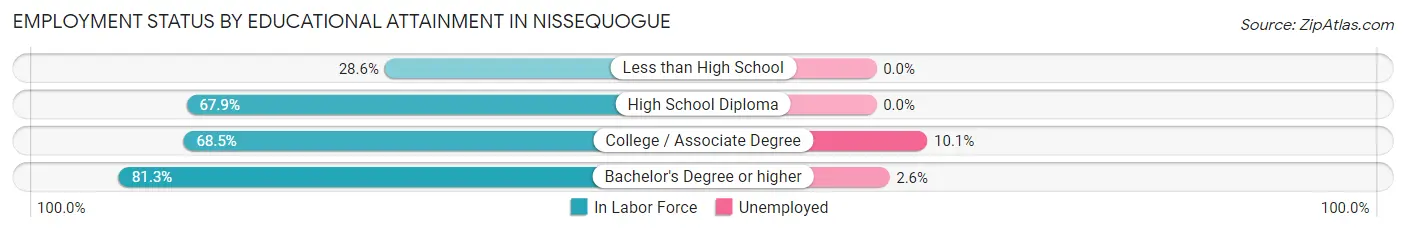
| Educational Attainment | In Labor Force | Unemployed |
| Less than High School | 2 (28.6%) | 0 (0.0%) |
| High School Diploma | 53 (67.9%) | 0 (0.0%) |
| College / Associate Degree | 139 (68.5%) | 21 (10.1%) |
| Bachelor's Degree or higher | 416 (81.3%) | 13 (2.6%) |
| Total | 610 (76.3%) | 33 (4.1%) |
Employment Occupations by Sex in Nissequogue
Management, Business, Science and Arts Occupations
The most common Management, Business, Science and Arts occupations in Nissequogue are Management (118 | 15.8%), Business & Financial (106 | 14.2%), Community & Social Service (97 | 13.0%), Health Diagnosing & Treating (70 | 9.4%), and Health Technologists (67 | 9.0%).
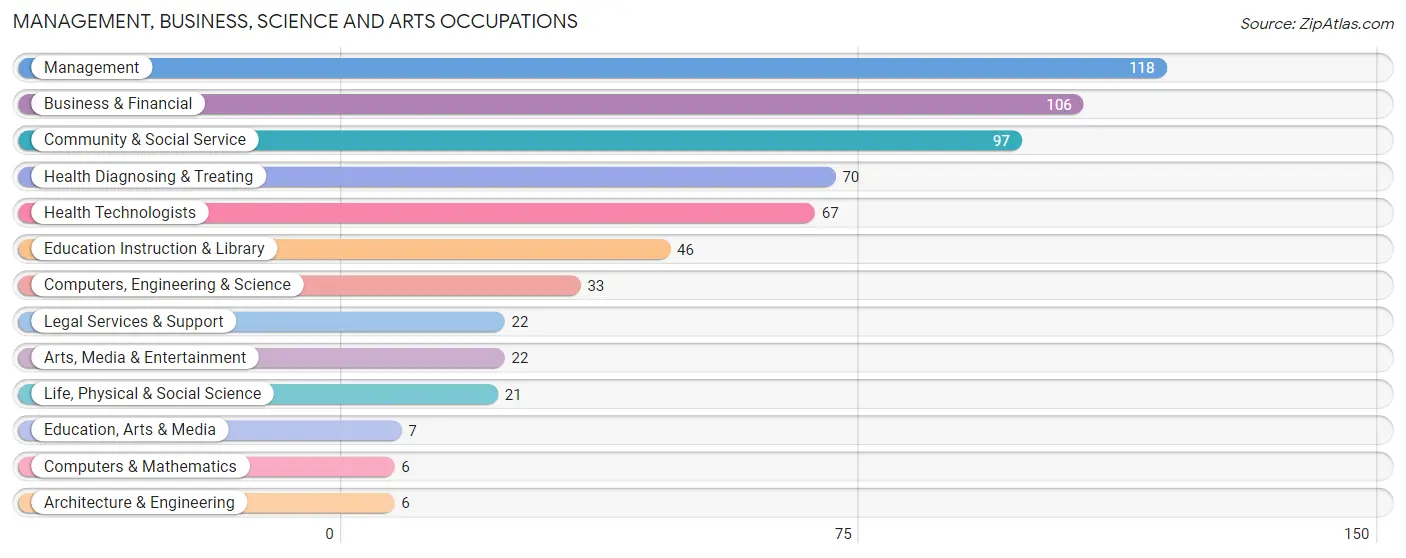
Management, Business, Science and Arts Occupations by Sex
Within the Management, Business, Science and Arts occupations in Nissequogue, the most male-oriented occupations are Architecture & Engineering (100.0%), Legal Services & Support (86.4%), and Business & Financial (80.2%), while the most female-oriented occupations are Education, Arts & Media (85.7%), Life, Physical & Social Science (71.4%), and Health Diagnosing & Treating (64.3%).
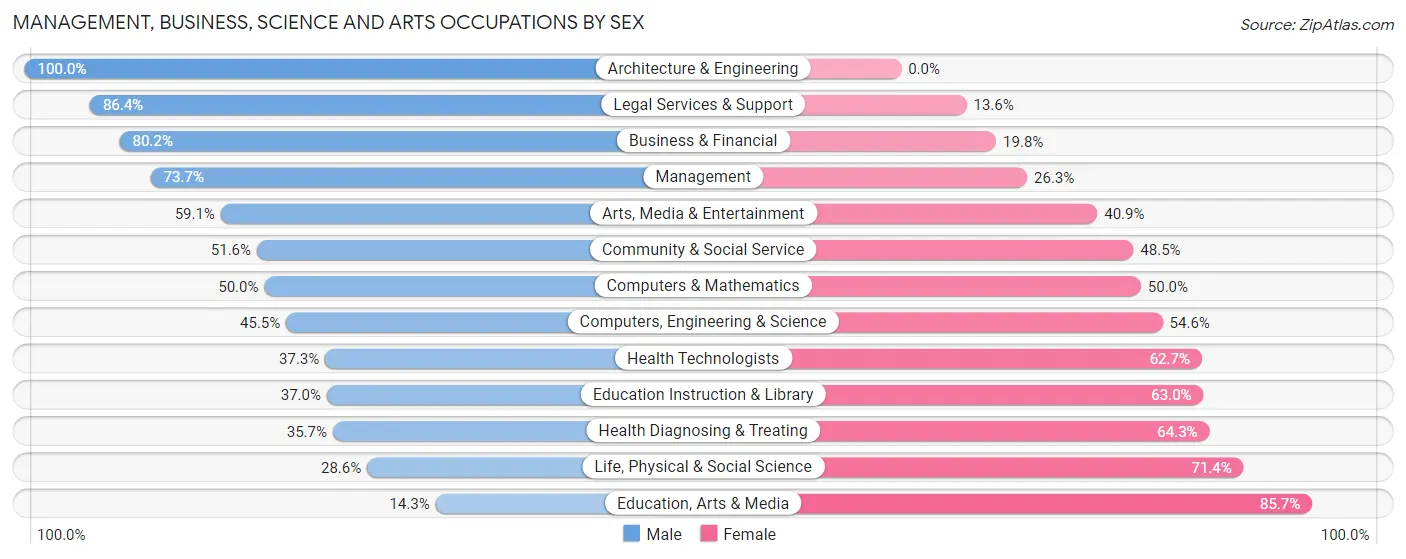
| Occupation | Male | Female |
| Management | 87 (73.7%) | 31 (26.3%) |
| Business & Financial | 85 (80.2%) | 21 (19.8%) |
| Computers, Engineering & Science | 15 (45.5%) | 18 (54.5%) |
| Computers & Mathematics | 3 (50.0%) | 3 (50.0%) |
| Architecture & Engineering | 6 (100.0%) | 0 (0.0%) |
| Life, Physical & Social Science | 6 (28.6%) | 15 (71.4%) |
| Community & Social Service | 50 (51.5%) | 47 (48.4%) |
| Education, Arts & Media | 1 (14.3%) | 6 (85.7%) |
| Legal Services & Support | 19 (86.4%) | 3 (13.6%) |
| Education Instruction & Library | 17 (37.0%) | 29 (63.0%) |
| Arts, Media & Entertainment | 13 (59.1%) | 9 (40.9%) |
| Health Diagnosing & Treating | 25 (35.7%) | 45 (64.3%) |
| Health Technologists | 25 (37.3%) | 42 (62.7%) |
| Total (Category) | 262 (61.8%) | 162 (38.2%) |
| Total (Overall) | 467 (62.7%) | 278 (37.3%) |
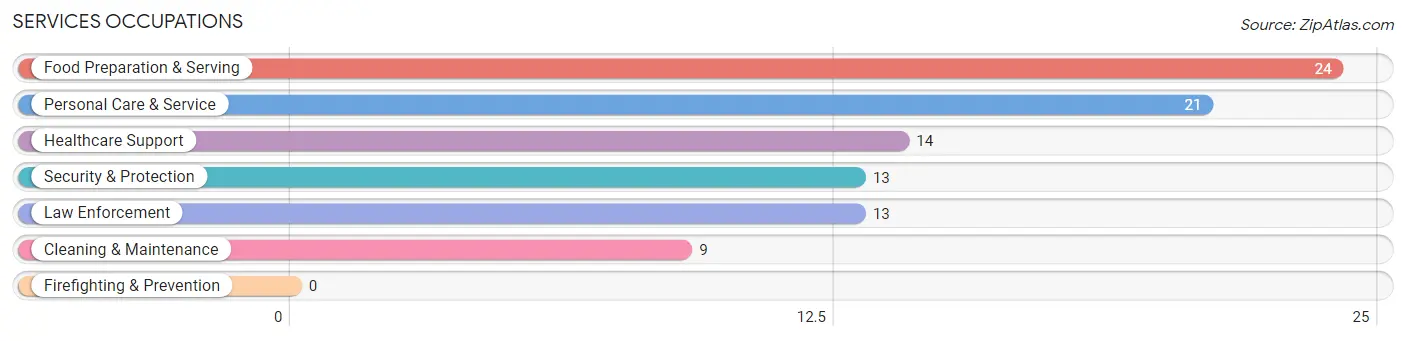
Services Occupations
The most common Services occupations in Nissequogue are Food Preparation & Serving (24 | 3.2%), Personal Care & Service (21 | 2.8%), Healthcare Support (14 | 1.9%), Security & Protection (13 | 1.7%), and Law Enforcement (13 | 1.7%).
Services Occupations by Sex
Within the Services occupations in Nissequogue, the most male-oriented occupations are Security & Protection (100.0%), Law Enforcement (100.0%), and Food Preparation & Serving (100.0%), while the most female-oriented occupations are Healthcare Support (100.0%), and Personal Care & Service (61.9%).
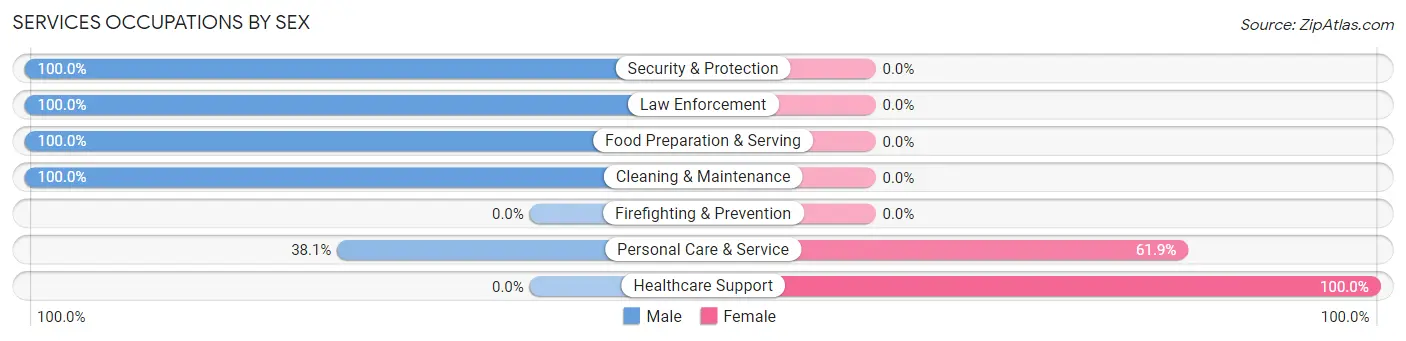
| Occupation | Male | Female |
| Healthcare Support | 0 (0.0%) | 14 (100.0%) |
| Security & Protection | 13 (100.0%) | 0 (0.0%) |
| Firefighting & Prevention | 0 (0.0%) | 0 (0.0%) |
| Law Enforcement | 13 (100.0%) | 0 (0.0%) |
| Food Preparation & Serving | 24 (100.0%) | 0 (0.0%) |
| Cleaning & Maintenance | 9 (100.0%) | 0 (0.0%) |
| Personal Care & Service | 8 (38.1%) | 13 (61.9%) |
| Total (Category) | 54 (66.7%) | 27 (33.3%) |
| Total (Overall) | 467 (62.7%) | 278 (37.3%) |
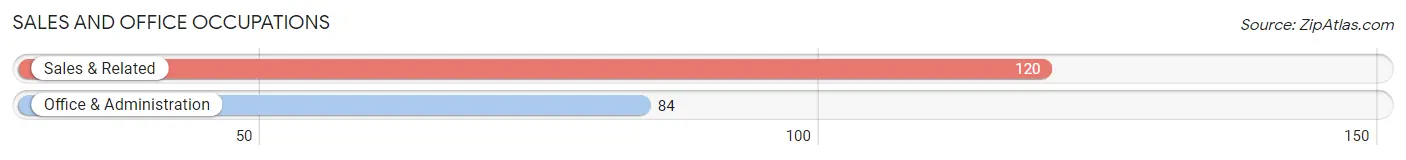
Sales and Office Occupations
The most common Sales and Office occupations in Nissequogue are Sales & Related (120 | 16.1%), and Office & Administration (84 | 11.3%).
Sales and Office Occupations by Sex
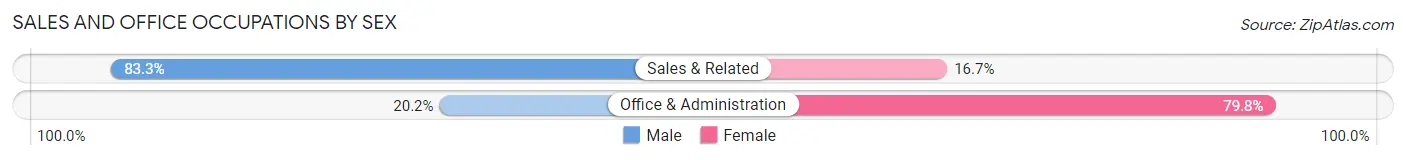
| Occupation | Male | Female |
| Sales & Related | 100 (83.3%) | 20 (16.7%) |
| Office & Administration | 17 (20.2%) | 67 (79.8%) |
| Total (Category) | 117 (57.4%) | 87 (42.6%) |
| Total (Overall) | 467 (62.7%) | 278 (37.3%) |
Natural Resources, Construction and Maintenance Occupations
The most common Natural Resources, Construction and Maintenance occupations in Nissequogue are , and Construction & Extraction (13 | 1.7%).
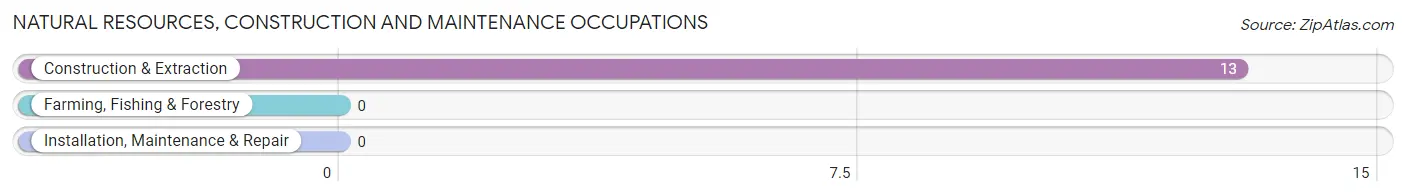
Natural Resources, Construction and Maintenance Occupations by Sex
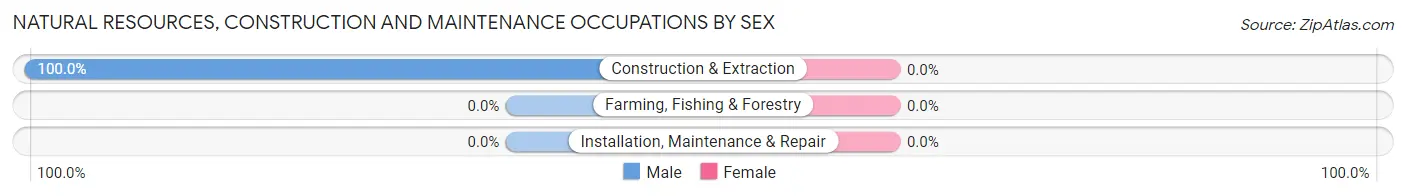
| Occupation | Male | Female |
| Farming, Fishing & Forestry | 0 (0.0%) | 0 (0.0%) |
| Construction & Extraction | 13 (100.0%) | 0 (0.0%) |
| Installation, Maintenance & Repair | 0 (0.0%) | 0 (0.0%) |
| Total (Category) | 13 (100.0%) | 0 (0.0%) |
| Total (Overall) | 467 (62.7%) | 278 (37.3%) |
Production, Transportation and Moving Occupations
The most common Production, Transportation and Moving occupations in Nissequogue are Production (13 | 1.7%), and Transportation (10 | 1.3%).
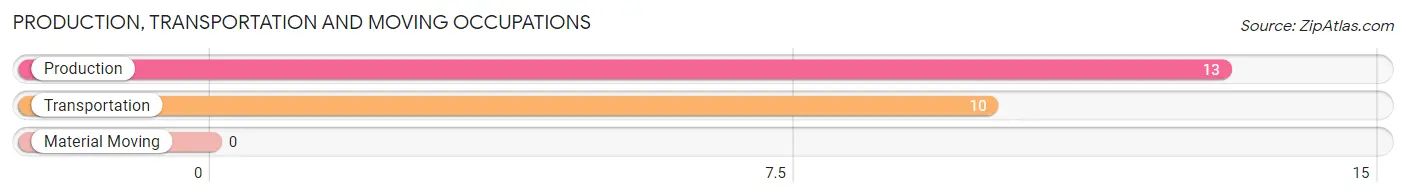
Production, Transportation and Moving Occupations by Sex
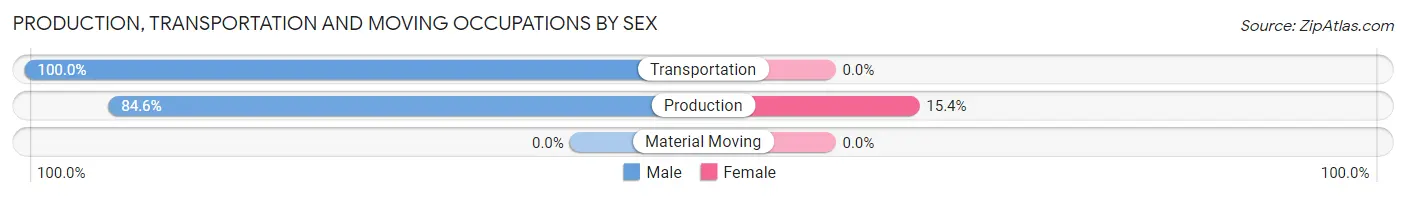
| Occupation | Male | Female |
| Production | 11 (84.6%) | 2 (15.4%) |
| Transportation | 10 (100.0%) | 0 (0.0%) |
| Material Moving | 0 (0.0%) | 0 (0.0%) |
| Total (Category) | 21 (91.3%) | 2 (8.7%) |
| Total (Overall) | 467 (62.7%) | 278 (37.3%) |
Employment Industries by Sex in Nissequogue
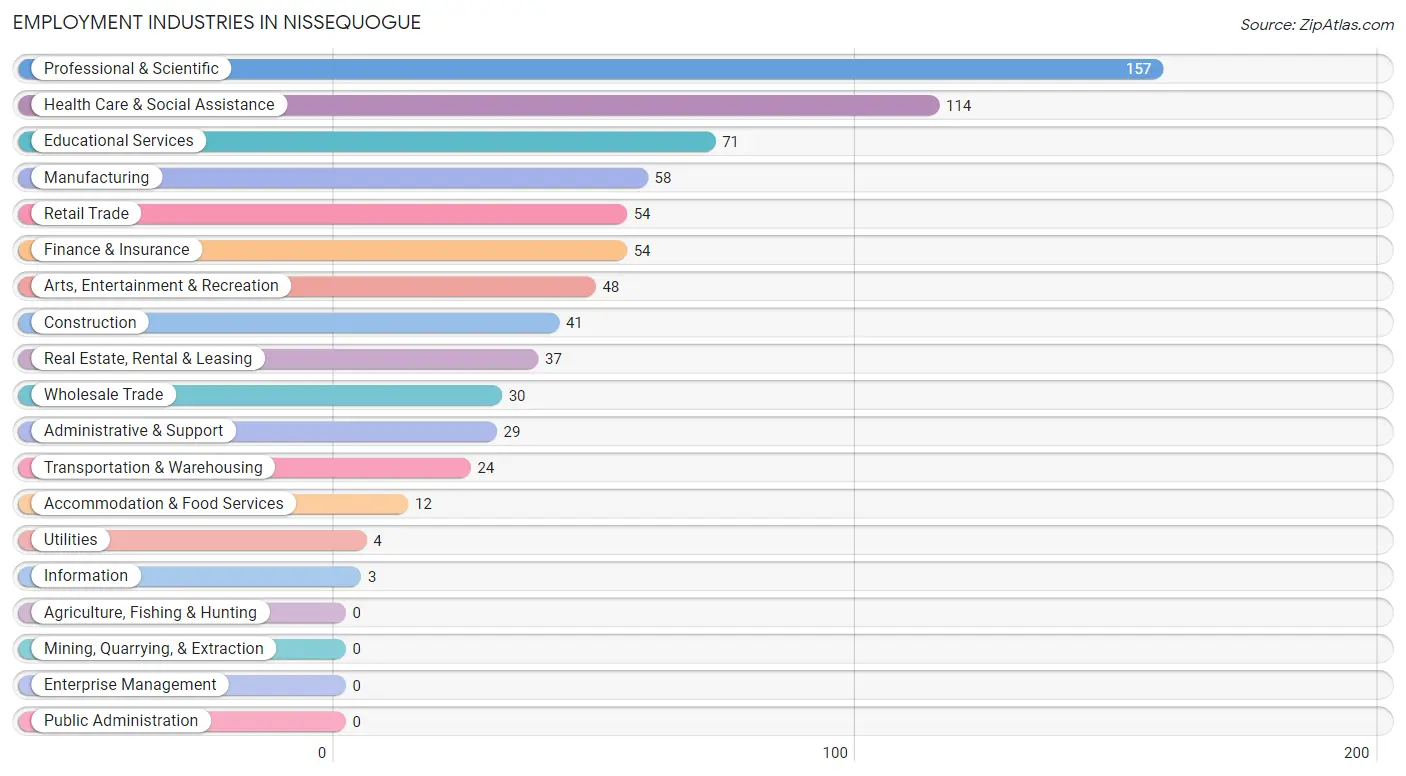
Employment Industries in Nissequogue
The major employment industries in Nissequogue include Professional & Scientific (157 | 21.1%), Health Care & Social Assistance (114 | 15.3%), Educational Services (71 | 9.5%), Manufacturing (58 | 7.8%), and Retail Trade (54 | 7.2%).
Employment Industries by Sex in Nissequogue
The Nissequogue industries that see more men than women are Transportation & Warehousing (100.0%), Real Estate, Rental & Leasing (97.3%), and Arts, Entertainment & Recreation (95.8%), whereas the industries that tend to have a higher number of women are Utilities (100.0%), Information (100.0%), and Educational Services (77.5%).
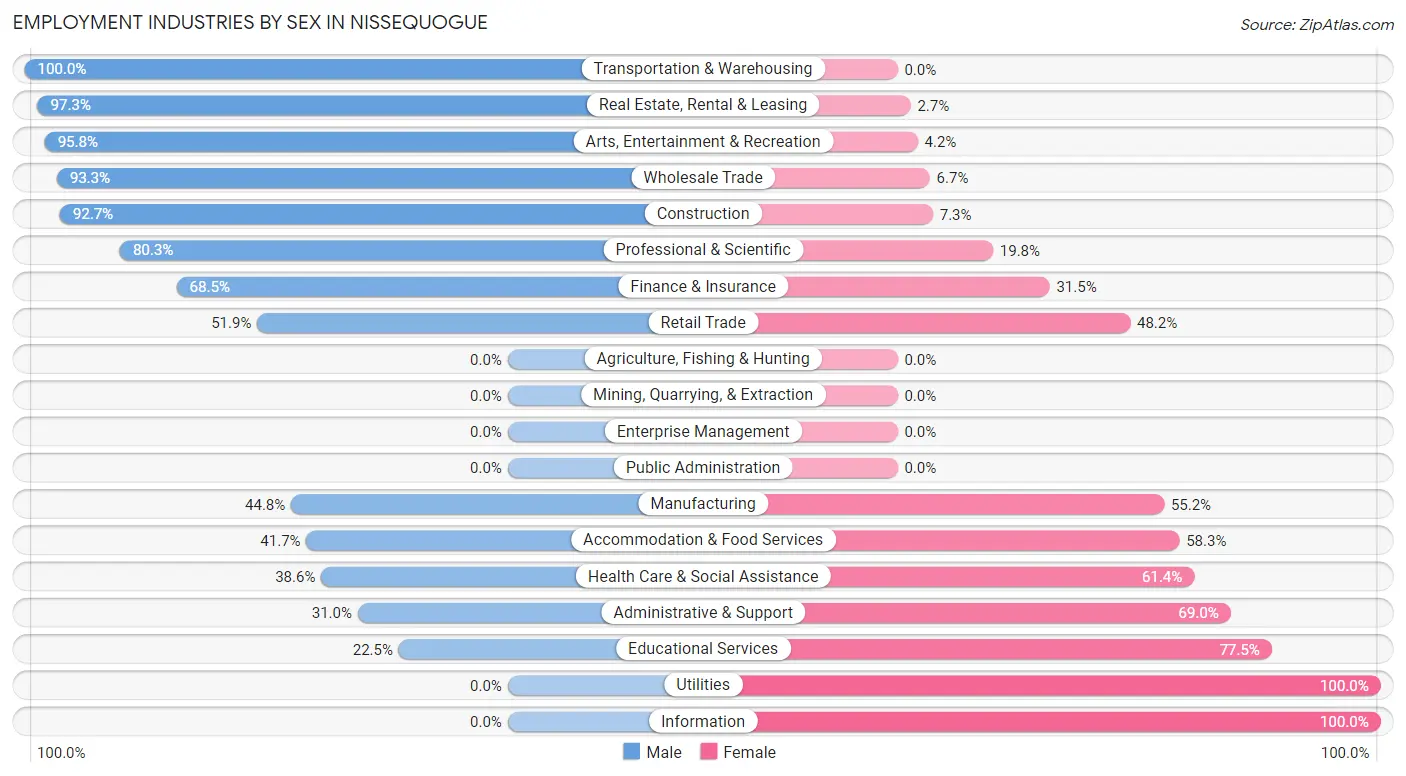
| Industry | Male | Female |
| Agriculture, Fishing & Hunting | 0 (0.0%) | 0 (0.0%) |
| Mining, Quarrying, & Extraction | 0 (0.0%) | 0 (0.0%) |
| Construction | 38 (92.7%) | 3 (7.3%) |
| Manufacturing | 26 (44.8%) | 32 (55.2%) |
| Wholesale Trade | 28 (93.3%) | 2 (6.7%) |
| Retail Trade | 28 (51.8%) | 26 (48.1%) |
| Transportation & Warehousing | 24 (100.0%) | 0 (0.0%) |
| Utilities | 0 (0.0%) | 4 (100.0%) |
| Information | 0 (0.0%) | 3 (100.0%) |
| Finance & Insurance | 37 (68.5%) | 17 (31.5%) |
| Real Estate, Rental & Leasing | 36 (97.3%) | 1 (2.7%) |
| Professional & Scientific | 126 (80.2%) | 31 (19.8%) |
| Enterprise Management | 0 (0.0%) | 0 (0.0%) |
| Administrative & Support | 9 (31.0%) | 20 (69.0%) |
| Educational Services | 16 (22.5%) | 55 (77.5%) |
| Health Care & Social Assistance | 44 (38.6%) | 70 (61.4%) |
| Arts, Entertainment & Recreation | 46 (95.8%) | 2 (4.2%) |
| Accommodation & Food Services | 5 (41.7%) | 7 (58.3%) |
| Public Administration | 0 (0.0%) | 0 (0.0%) |
| Total | 467 (62.7%) | 278 (37.3%) |
Education in Nissequogue
School Enrollment in Nissequogue
The most common levels of schooling among the 399 students in Nissequogue are high school (126 | 31.6%), college / undergraduate (85 | 21.3%), and elementary school (70 | 17.5%).
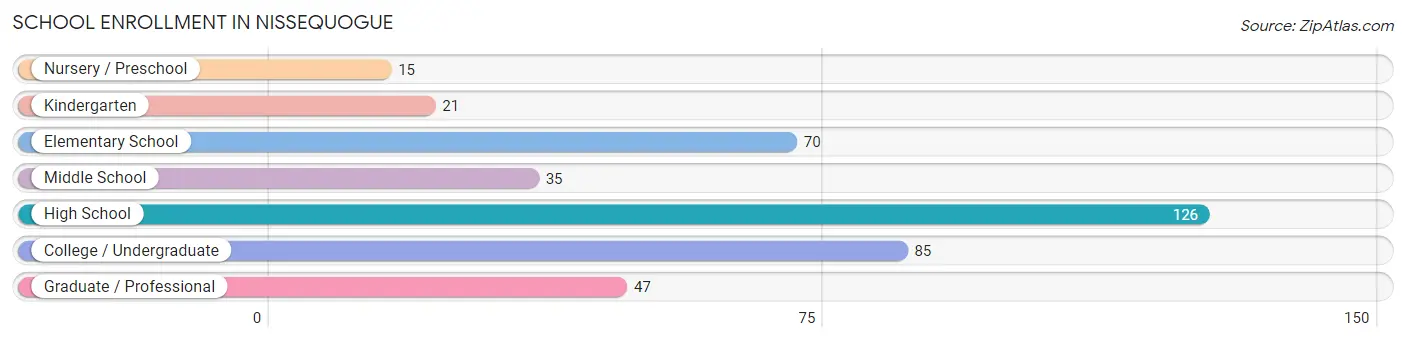
| School Level | # Students | % Students |
| Nursery / Preschool | 15 | 3.8% |
| Kindergarten | 21 | 5.3% |
| Elementary School | 70 | 17.5% |
| Middle School | 35 | 8.8% |
| High School | 126 | 31.6% |
| College / Undergraduate | 85 | 21.3% |
| Graduate / Professional | 47 | 11.8% |
| Total | 399 | 100.0% |
School Enrollment by Age by Funding Source in Nissequogue
Out of a total of 399 students who are enrolled in schools in Nissequogue, 77 (19.3%) attend a private institution, while the remaining 322 (80.7%) are enrolled in public schools. The age group of 3 to 4 year olds has the highest likelihood of being enrolled in private schools, with 15 (100.0% in the age bracket) enrolled. Conversely, the age group of 5 to 9 year old has the lowest likelihood of being enrolled in a private school, with 82 (100.0% in the age bracket) attending a public institution.
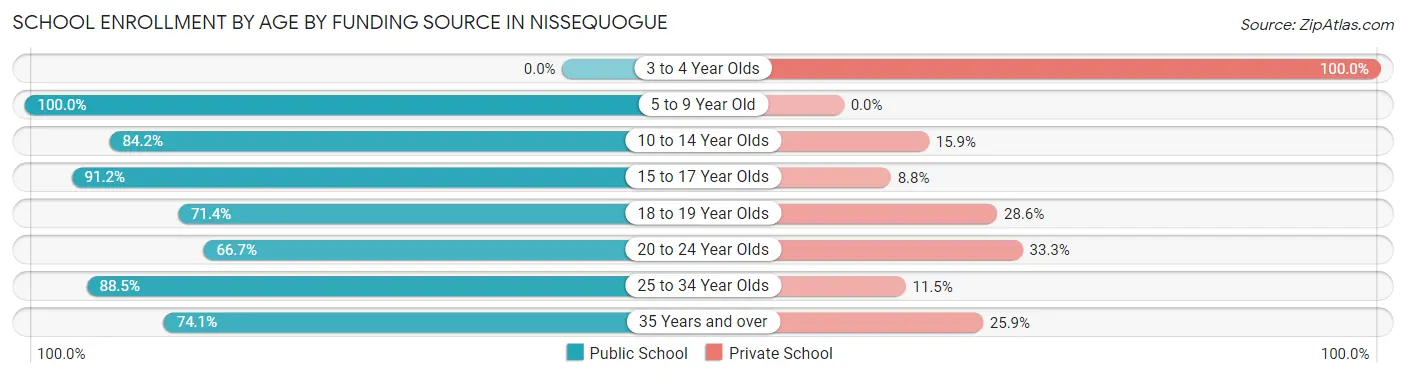
| Age Bracket | Public School | Private School |
| 3 to 4 Year Olds | 0 (0.0%) | 15 (100.0%) |
| 5 to 9 Year Old | 82 (100.0%) | 0 (0.0%) |
| 10 to 14 Year Olds | 69 (84.2%) | 13 (15.9%) |
| 15 to 17 Year Olds | 52 (91.2%) | 5 (8.8%) |
| 18 to 19 Year Olds | 40 (71.4%) | 16 (28.6%) |
| 20 to 24 Year Olds | 36 (66.7%) | 18 (33.3%) |
| 25 to 34 Year Olds | 23 (88.5%) | 3 (11.5%) |
| 35 Years and over | 20 (74.1%) | 7 (25.9%) |
| Total | 322 (80.7%) | 77 (19.3%) |
Educational Attainment by Field of Study in Nissequogue
Business (204 | 28.5%), science & technology (78 | 10.9%), bio, nature & agricultural (59 | 8.3%), social sciences (58 | 8.1%), and liberal arts & history (51 | 7.1%) are the most common fields of study among 715 individuals in Nissequogue who have obtained a bachelor's degree or higher.
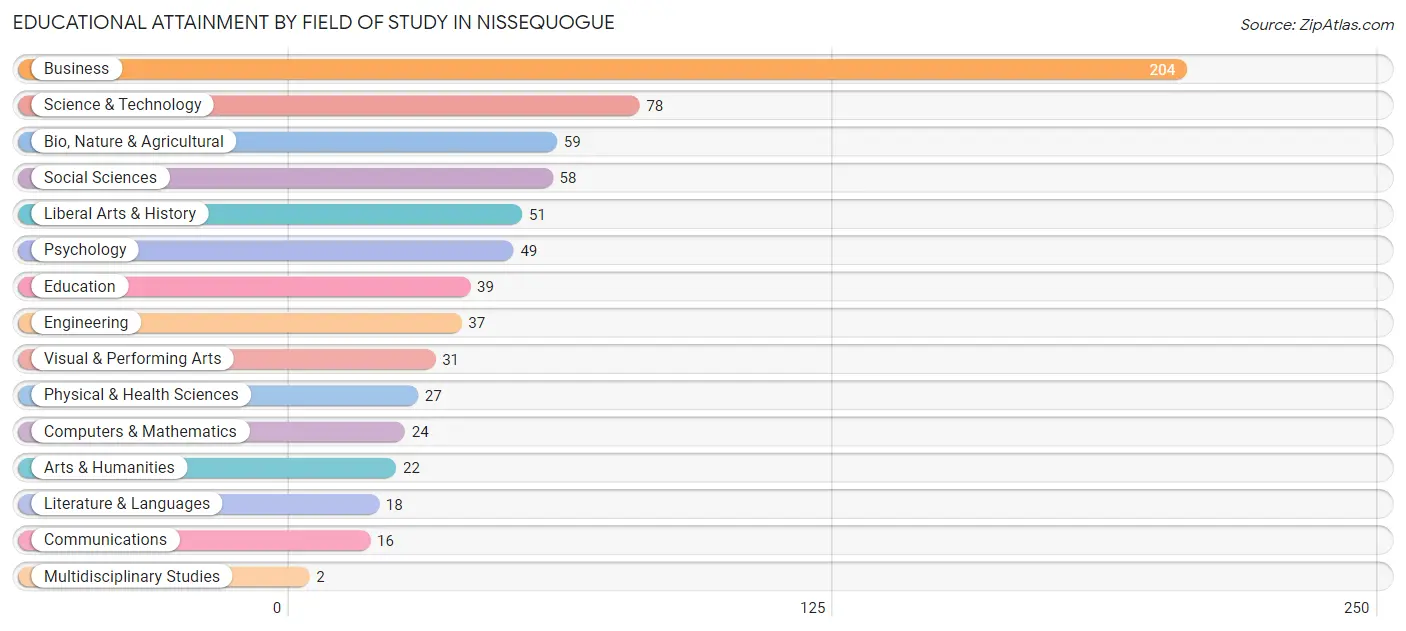
| Field of Study | # Graduates | % Graduates |
| Computers & Mathematics | 24 | 3.4% |
| Bio, Nature & Agricultural | 59 | 8.3% |
| Physical & Health Sciences | 27 | 3.8% |
| Psychology | 49 | 6.9% |
| Social Sciences | 58 | 8.1% |
| Engineering | 37 | 5.2% |
| Multidisciplinary Studies | 2 | 0.3% |
| Science & Technology | 78 | 10.9% |
| Business | 204 | 28.5% |
| Education | 39 | 5.4% |
| Literature & Languages | 18 | 2.5% |
| Liberal Arts & History | 51 | 7.1% |
| Visual & Performing Arts | 31 | 4.3% |
| Communications | 16 | 2.2% |
| Arts & Humanities | 22 | 3.1% |
| Total | 715 | 100.0% |
Transportation & Commute in Nissequogue
Vehicle Availability by Sex in Nissequogue
The most prevalent vehicle ownership categories in Nissequogue are males with 2 vehicles (185, accounting for 42.3%) and females with 2 vehicles (111, making up 70.9%).
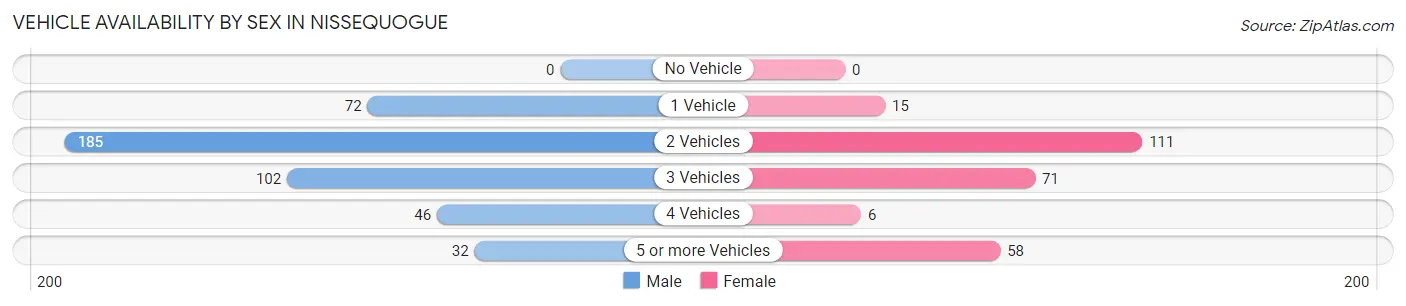
| Vehicles Available | Male | Female |
| No Vehicle | 0 (0.0%) | 0 (0.0%) |
| 1 Vehicle | 72 (16.5%) | 15 (5.8%) |
| 2 Vehicles | 185 (42.3%) | 111 (42.5%) |
| 3 Vehicles | 102 (23.3%) | 71 (27.2%) |
| 4 Vehicles | 46 (10.5%) | 6 (2.3%) |
| 5 or more Vehicles | 32 (7.3%) | 58 (22.2%) |
| Total | 437 (100.0%) | 261 (100.0%) |
Commute Time in Nissequogue
The most frequently occuring commute durations in Nissequogue are 20 to 24 minutes (109 commuters, 19.1%), 30 to 34 minutes (90 commuters, 15.8%), and 15 to 19 minutes (70 commuters, 12.3%).
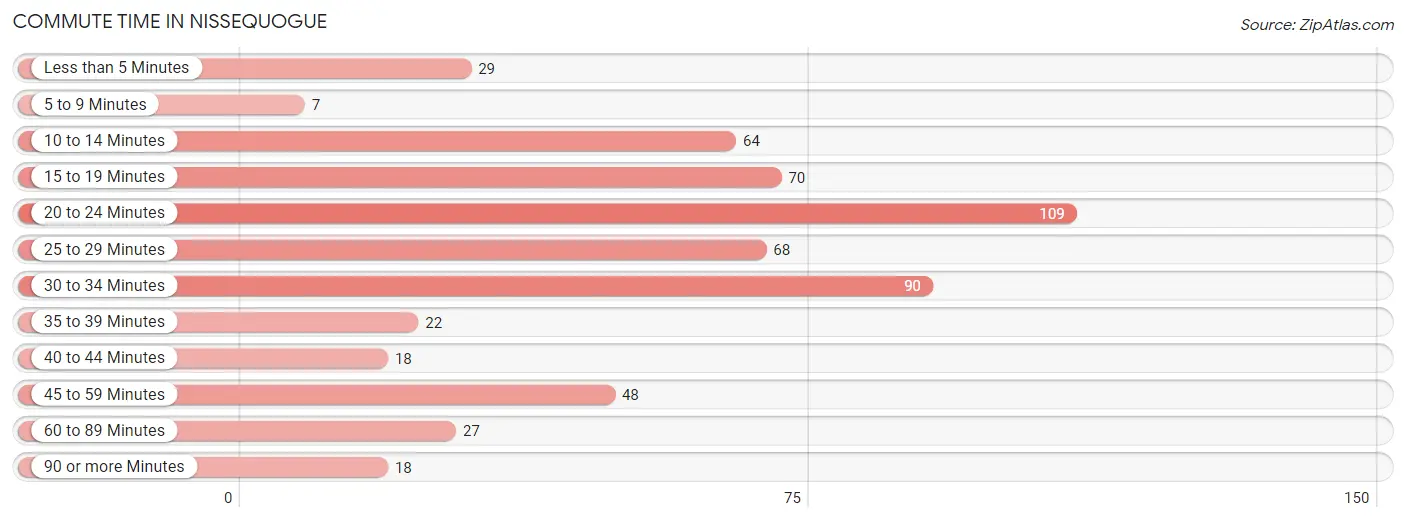
| Commute Time | # Commuters | % Commuters |
| Less than 5 Minutes | 29 | 5.1% |
| 5 to 9 Minutes | 7 | 1.2% |
| 10 to 14 Minutes | 64 | 11.2% |
| 15 to 19 Minutes | 70 | 12.3% |
| 20 to 24 Minutes | 109 | 19.1% |
| 25 to 29 Minutes | 68 | 11.9% |
| 30 to 34 Minutes | 90 | 15.8% |
| 35 to 39 Minutes | 22 | 3.9% |
| 40 to 44 Minutes | 18 | 3.2% |
| 45 to 59 Minutes | 48 | 8.4% |
| 60 to 89 Minutes | 27 | 4.7% |
| 90 or more Minutes | 18 | 3.2% |
Commute Time by Sex in Nissequogue
The most common commute times in Nissequogue are 30 to 34 minutes (71 commuters, 20.9%) for males and 20 to 24 minutes (68 commuters, 29.6%) for females.
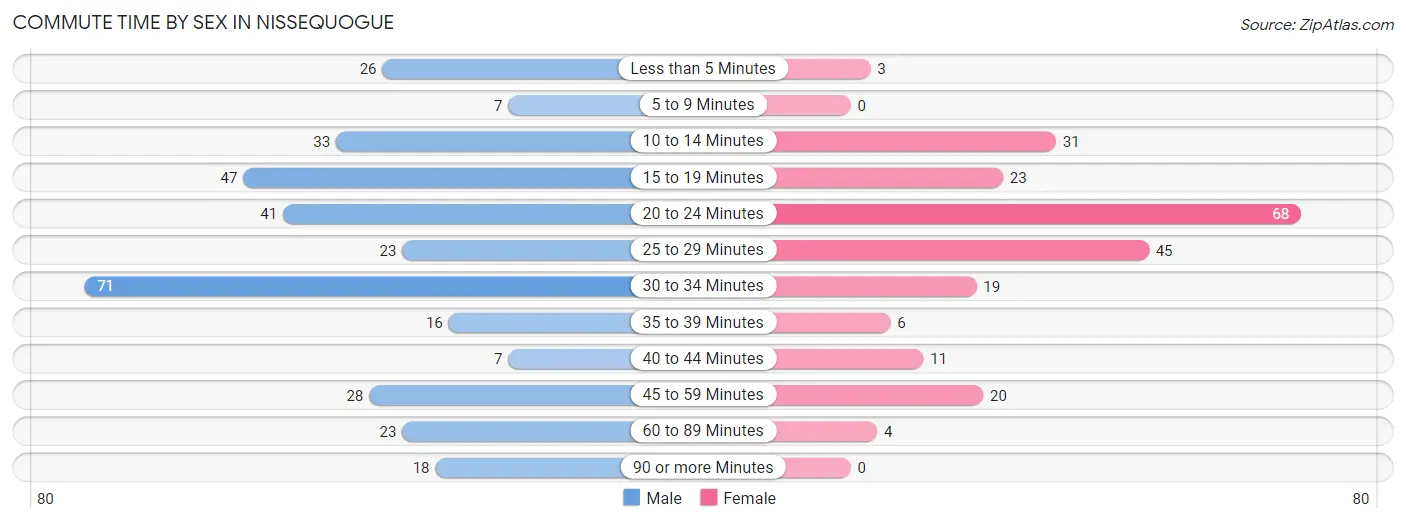
| Commute Time | Male | Female |
| Less than 5 Minutes | 26 (7.6%) | 3 (1.3%) |
| 5 to 9 Minutes | 7 (2.1%) | 0 (0.0%) |
| 10 to 14 Minutes | 33 (9.7%) | 31 (13.5%) |
| 15 to 19 Minutes | 47 (13.8%) | 23 (10.0%) |
| 20 to 24 Minutes | 41 (12.1%) | 68 (29.6%) |
| 25 to 29 Minutes | 23 (6.8%) | 45 (19.6%) |
| 30 to 34 Minutes | 71 (20.9%) | 19 (8.3%) |
| 35 to 39 Minutes | 16 (4.7%) | 6 (2.6%) |
| 40 to 44 Minutes | 7 (2.1%) | 11 (4.8%) |
| 45 to 59 Minutes | 28 (8.2%) | 20 (8.7%) |
| 60 to 89 Minutes | 23 (6.8%) | 4 (1.7%) |
| 90 or more Minutes | 18 (5.3%) | 0 (0.0%) |
Time of Departure to Work by Sex in Nissequogue
The most frequent times of departure to work in Nissequogue are 8:00 AM to 8:29 AM (51, 15.0%) for males and 9:00 AM to 9:59 AM (69, 30.0%) for females.
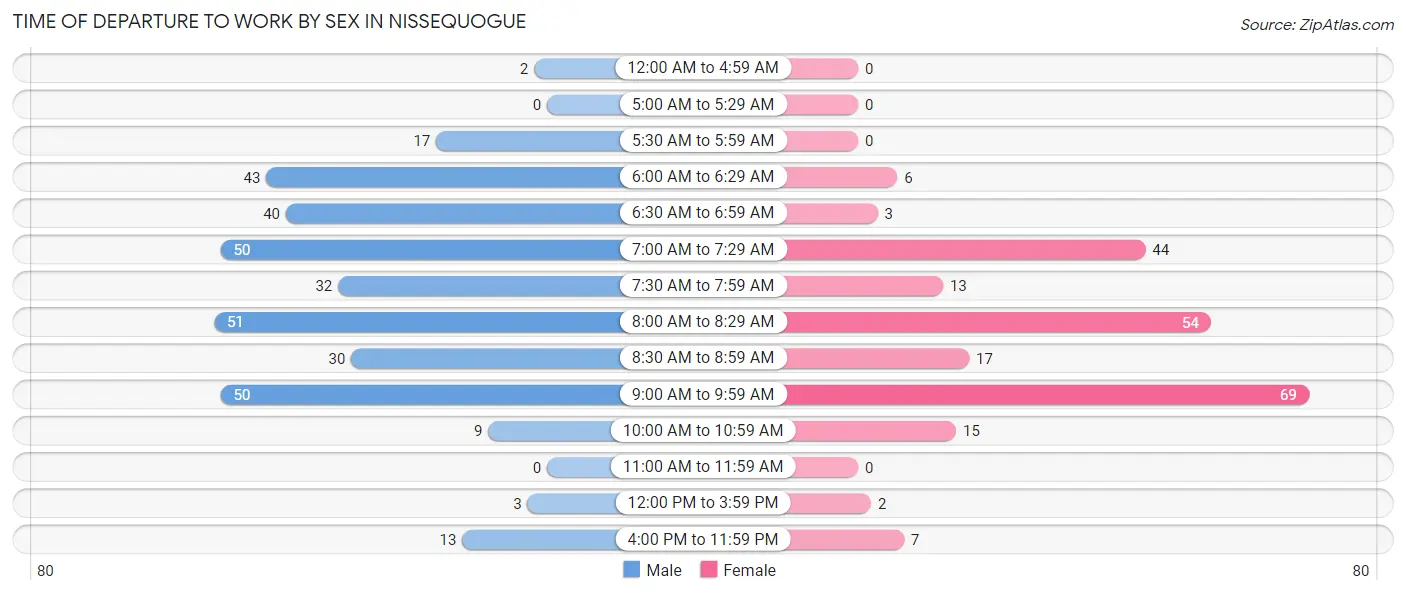
| Time of Departure | Male | Female |
| 12:00 AM to 4:59 AM | 2 (0.6%) | 0 (0.0%) |
| 5:00 AM to 5:29 AM | 0 (0.0%) | 0 (0.0%) |
| 5:30 AM to 5:59 AM | 17 (5.0%) | 0 (0.0%) |
| 6:00 AM to 6:29 AM | 43 (12.7%) | 6 (2.6%) |
| 6:30 AM to 6:59 AM | 40 (11.8%) | 3 (1.3%) |
| 7:00 AM to 7:29 AM | 50 (14.7%) | 44 (19.1%) |
| 7:30 AM to 7:59 AM | 32 (9.4%) | 13 (5.7%) |
| 8:00 AM to 8:29 AM | 51 (15.0%) | 54 (23.5%) |
| 8:30 AM to 8:59 AM | 30 (8.8%) | 17 (7.4%) |
| 9:00 AM to 9:59 AM | 50 (14.7%) | 69 (30.0%) |
| 10:00 AM to 10:59 AM | 9 (2.6%) | 15 (6.5%) |
| 11:00 AM to 11:59 AM | 0 (0.0%) | 0 (0.0%) |
| 12:00 PM to 3:59 PM | 3 (0.9%) | 2 (0.9%) |
| 4:00 PM to 11:59 PM | 13 (3.8%) | 7 (3.0%) |
| Total | 340 (100.0%) | 230 (100.0%) |
Housing Occupancy in Nissequogue
Occupancy by Ownership in Nissequogue
Of the total 545 dwellings in Nissequogue, owner-occupied units account for 458 (84.0%), while renter-occupied units make up 87 (16.0%).
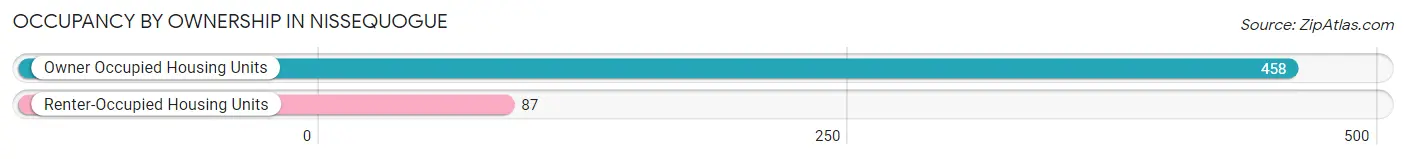
| Occupancy | # Housing Units | % Housing Units |
| Owner Occupied Housing Units | 458 | 84.0% |
| Renter-Occupied Housing Units | 87 | 16.0% |
| Total Occupied Housing Units | 545 | 100.0% |
Occupancy by Household Size in Nissequogue
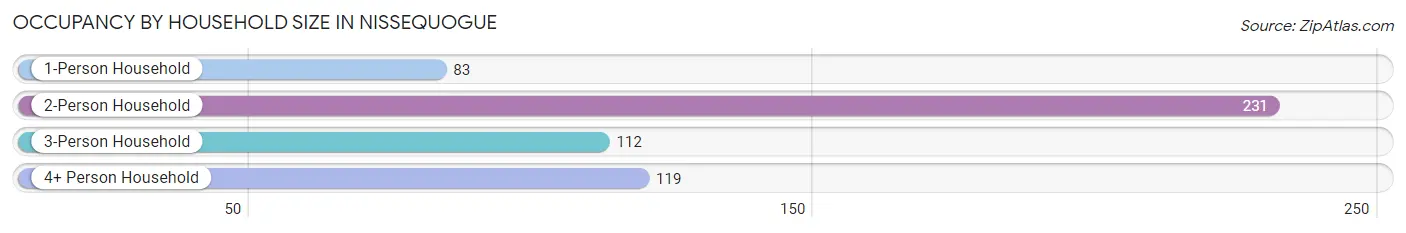
| Household Size | # Housing Units | % Housing Units |
| 1-Person Household | 83 | 15.2% |
| 2-Person Household | 231 | 42.4% |
| 3-Person Household | 112 | 20.5% |
| 4+ Person Household | 119 | 21.8% |
| Total Housing Units | 545 | 100.0% |
Occupancy by Ownership by Household Size in Nissequogue
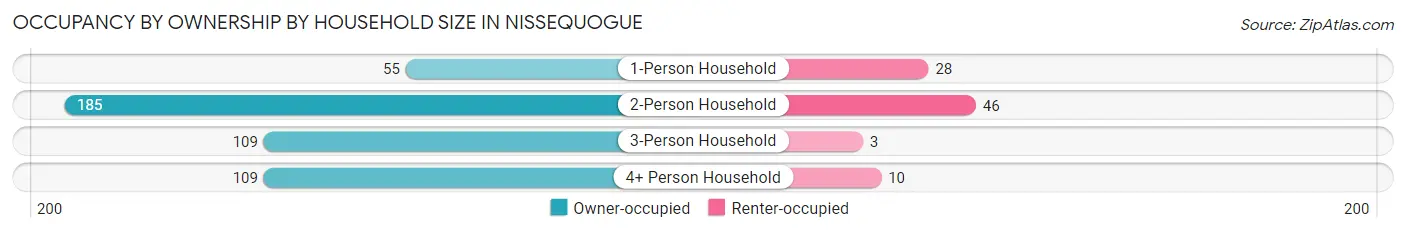
| Household Size | Owner-occupied | Renter-occupied |
| 1-Person Household | 55 (66.3%) | 28 (33.7%) |
| 2-Person Household | 185 (80.1%) | 46 (19.9%) |
| 3-Person Household | 109 (97.3%) | 3 (2.7%) |
| 4+ Person Household | 109 (91.6%) | 10 (8.4%) |
| Total Housing Units | 458 (84.0%) | 87 (16.0%) |
Occupancy by Educational Attainment in Nissequogue
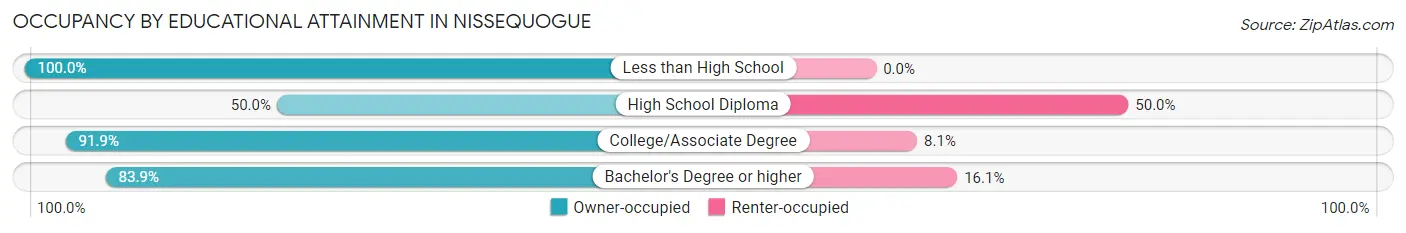
| Household Size | Owner-occupied | Renter-occupied |
| Less than High School | 2 (100.0%) | 0 (0.0%) |
| High School Diploma | 14 (50.0%) | 14 (50.0%) |
| College/Associate Degree | 113 (91.9%) | 10 (8.1%) |
| Bachelor's Degree or higher | 329 (83.9%) | 63 (16.1%) |
Occupancy by Age of Householder in Nissequogue
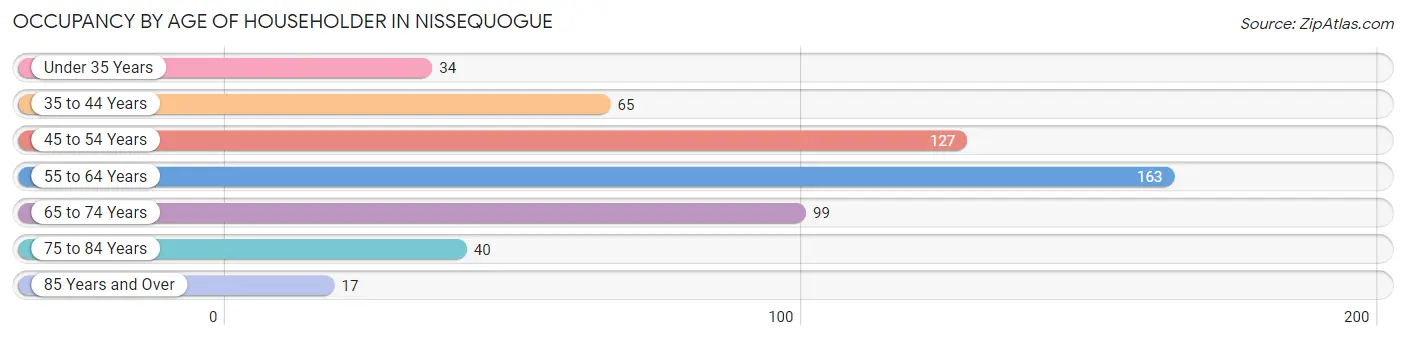
| Age Bracket | # Households | % Households |
| Under 35 Years | 34 | 6.2% |
| 35 to 44 Years | 65 | 11.9% |
| 45 to 54 Years | 127 | 23.3% |
| 55 to 64 Years | 163 | 29.9% |
| 65 to 74 Years | 99 | 18.2% |
| 75 to 84 Years | 40 | 7.3% |
| 85 Years and Over | 17 | 3.1% |
| Total | 545 | 100.0% |
Housing Finances in Nissequogue
Median Income by Occupancy in Nissequogue
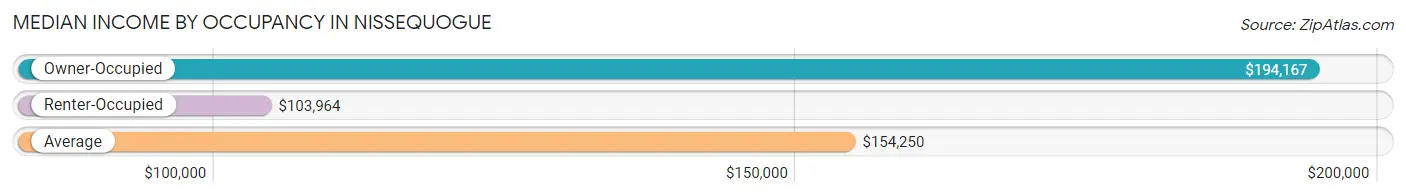
| Occupancy Type | # Households | Median Income |
| Owner-Occupied | 458 (84.0%) | $194,167 |
| Renter-Occupied | 87 (16.0%) | $103,964 |
| Average | 545 (100.0%) | $154,250 |
Occupancy by Householder Income Bracket in Nissequogue
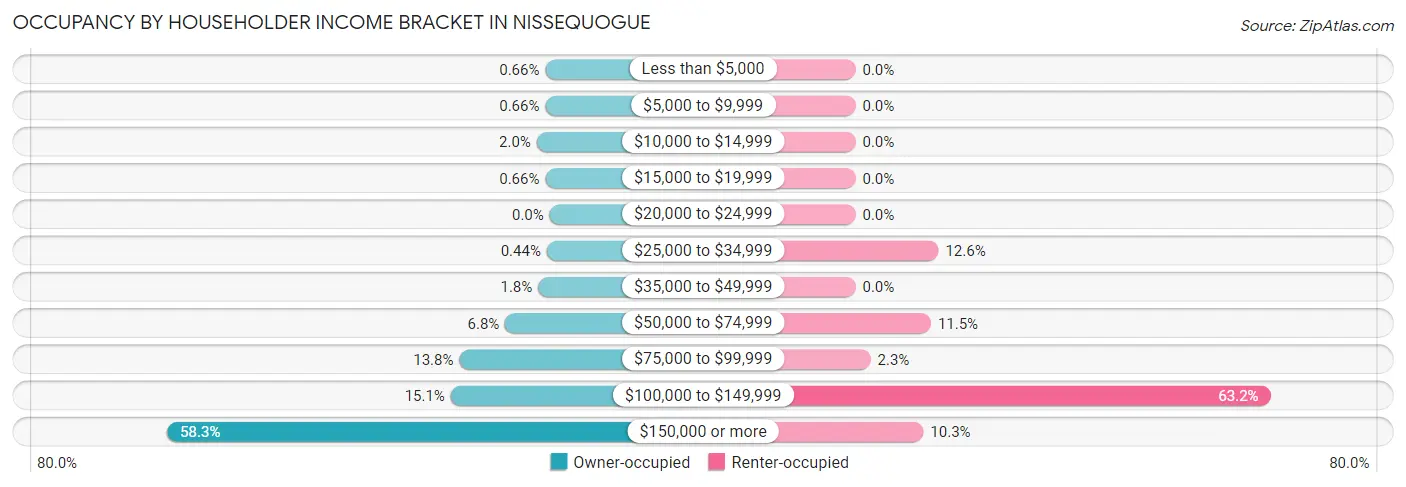
| Income Bracket | Owner-occupied | Renter-occupied |
| Less than $5,000 | 3 (0.7%) | 0 (0.0%) |
| $5,000 to $9,999 | 3 (0.7%) | 0 (0.0%) |
| $10,000 to $14,999 | 9 (2.0%) | 0 (0.0%) |
| $15,000 to $19,999 | 3 (0.7%) | 0 (0.0%) |
| $20,000 to $24,999 | 0 (0.0%) | 0 (0.0%) |
| $25,000 to $34,999 | 2 (0.4%) | 11 (12.6%) |
| $35,000 to $49,999 | 8 (1.8%) | 0 (0.0%) |
| $50,000 to $74,999 | 31 (6.8%) | 10 (11.5%) |
| $75,000 to $99,999 | 63 (13.8%) | 2 (2.3%) |
| $100,000 to $149,999 | 69 (15.1%) | 55 (63.2%) |
| $150,000 or more | 267 (58.3%) | 9 (10.3%) |
| Total | 458 (100.0%) | 87 (100.0%) |
Monthly Housing Cost Tiers in Nissequogue
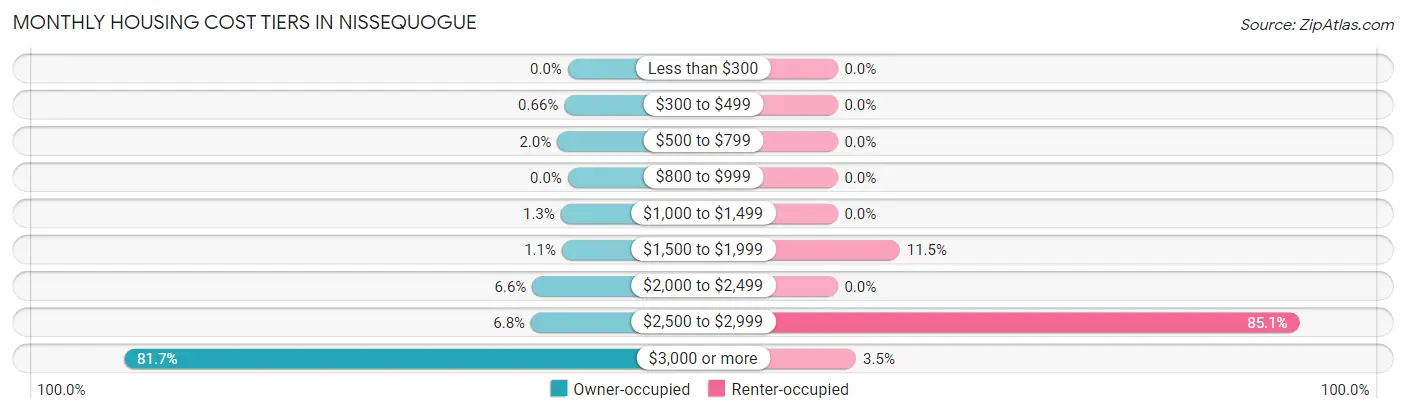
| Monthly Cost | Owner-occupied | Renter-occupied |
| Less than $300 | 0 (0.0%) | 0 (0.0%) |
| $300 to $499 | 3 (0.7%) | 0 (0.0%) |
| $500 to $799 | 9 (2.0%) | 0 (0.0%) |
| $800 to $999 | 0 (0.0%) | 0 (0.0%) |
| $1,000 to $1,499 | 6 (1.3%) | 0 (0.0%) |
| $1,500 to $1,999 | 5 (1.1%) | 10 (11.5%) |
| $2,000 to $2,499 | 30 (6.6%) | 0 (0.0%) |
| $2,500 to $2,999 | 31 (6.8%) | 74 (85.1%) |
| $3,000 or more | 374 (81.7%) | 3 (3.5%) |
| Total | 458 (100.0%) | 87 (100.0%) |
Physical Housing Characteristics in Nissequogue
Housing Structures in Nissequogue
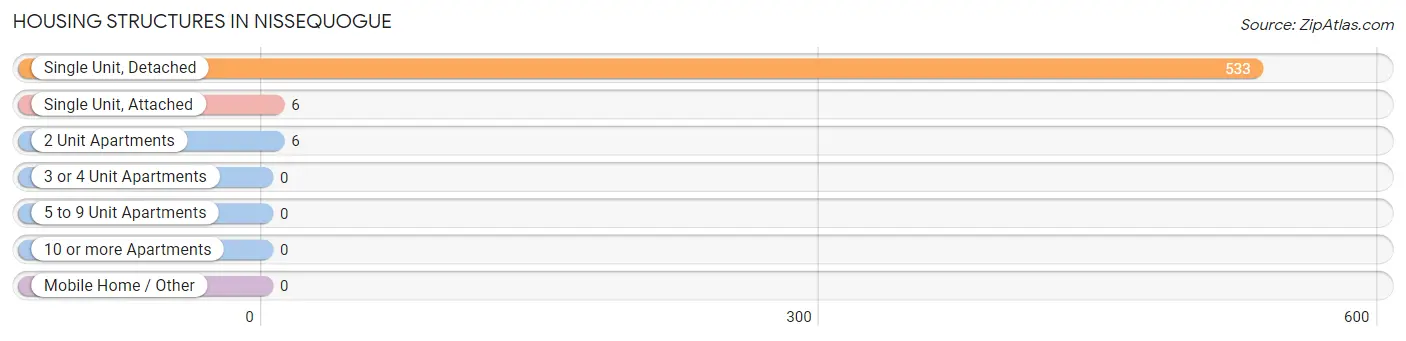
| Structure Type | # Housing Units | % Housing Units |
| Single Unit, Detached | 533 | 97.8% |
| Single Unit, Attached | 6 | 1.1% |
| 2 Unit Apartments | 6 | 1.1% |
| 3 or 4 Unit Apartments | 0 | 0.0% |
| 5 to 9 Unit Apartments | 0 | 0.0% |
| 10 or more Apartments | 0 | 0.0% |
| Mobile Home / Other | 0 | 0.0% |
| Total | 545 | 100.0% |
Housing Structures by Occupancy in Nissequogue
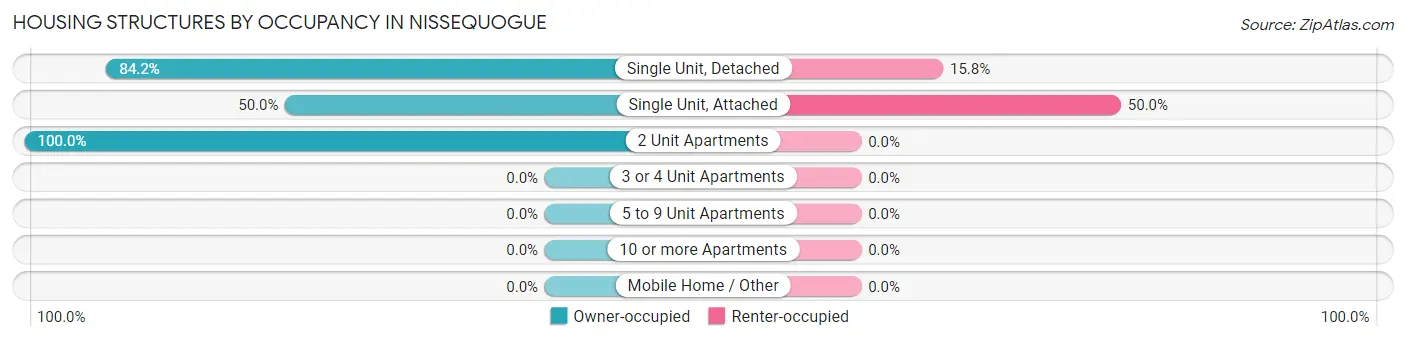
| Structure Type | Owner-occupied | Renter-occupied |
| Single Unit, Detached | 449 (84.2%) | 84 (15.8%) |
| Single Unit, Attached | 3 (50.0%) | 3 (50.0%) |
| 2 Unit Apartments | 6 (100.0%) | 0 (0.0%) |
| 3 or 4 Unit Apartments | 0 (0.0%) | 0 (0.0%) |
| 5 to 9 Unit Apartments | 0 (0.0%) | 0 (0.0%) |
| 10 or more Apartments | 0 (0.0%) | 0 (0.0%) |
| Mobile Home / Other | 0 (0.0%) | 0 (0.0%) |
| Total | 458 (84.0%) | 87 (16.0%) |
Housing Structures by Number of Rooms in Nissequogue
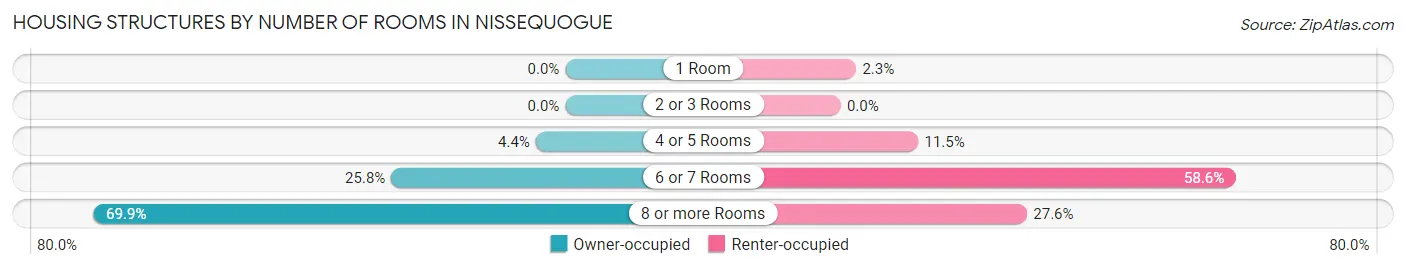
| Number of Rooms | Owner-occupied | Renter-occupied |
| 1 Room | 0 (0.0%) | 2 (2.3%) |
| 2 or 3 Rooms | 0 (0.0%) | 0 (0.0%) |
| 4 or 5 Rooms | 20 (4.4%) | 10 (11.5%) |
| 6 or 7 Rooms | 118 (25.8%) | 51 (58.6%) |
| 8 or more Rooms | 320 (69.9%) | 24 (27.6%) |
| Total | 458 (100.0%) | 87 (100.0%) |
Housing Structure by Heating Type in Nissequogue
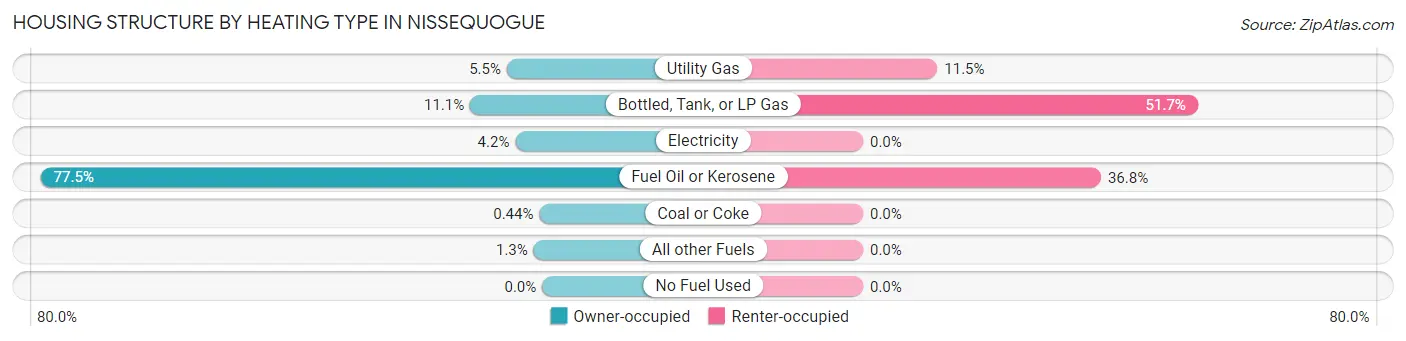
| Heating Type | Owner-occupied | Renter-occupied |
| Utility Gas | 25 (5.5%) | 10 (11.5%) |
| Bottled, Tank, or LP Gas | 51 (11.1%) | 45 (51.7%) |
| Electricity | 19 (4.2%) | 0 (0.0%) |
| Fuel Oil or Kerosene | 355 (77.5%) | 32 (36.8%) |
| Coal or Coke | 2 (0.4%) | 0 (0.0%) |
| All other Fuels | 6 (1.3%) | 0 (0.0%) |
| No Fuel Used | 0 (0.0%) | 0 (0.0%) |
| Total | 458 (100.0%) | 87 (100.0%) |
Household Vehicle Usage in Nissequogue
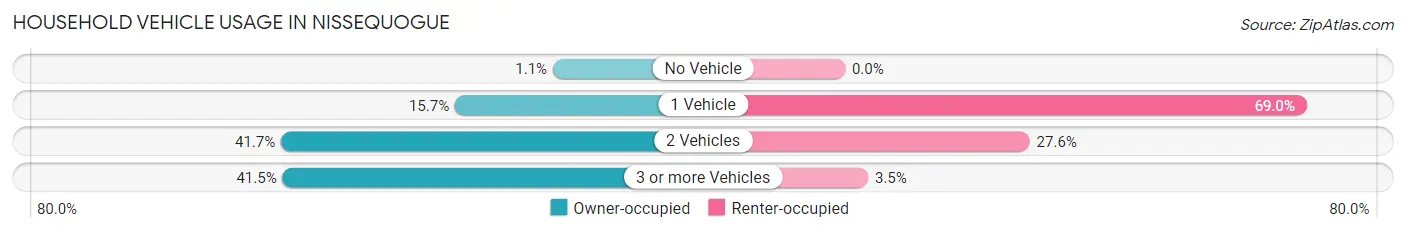
| Vehicles per Household | Owner-occupied | Renter-occupied |
| No Vehicle | 5 (1.1%) | 0 (0.0%) |
| 1 Vehicle | 72 (15.7%) | 60 (69.0%) |
| 2 Vehicles | 191 (41.7%) | 24 (27.6%) |
| 3 or more Vehicles | 190 (41.5%) | 3 (3.5%) |
| Total | 458 (100.0%) | 87 (100.0%) |
Real Estate & Mortgages in Nissequogue
Real Estate and Mortgage Overview in Nissequogue
| Characteristic | Without Mortgage | With Mortgage |
| Housing Units | 193 | 265 |
| Median Property Value | $1,171,500 | $958,300 |
| Median Household Income | $167,083 | $168 |
| Monthly Housing Costs | $1,501 | $255 |
| Real Estate Taxes | $10,001 | $0 |
Property Value by Mortgage Status in Nissequogue
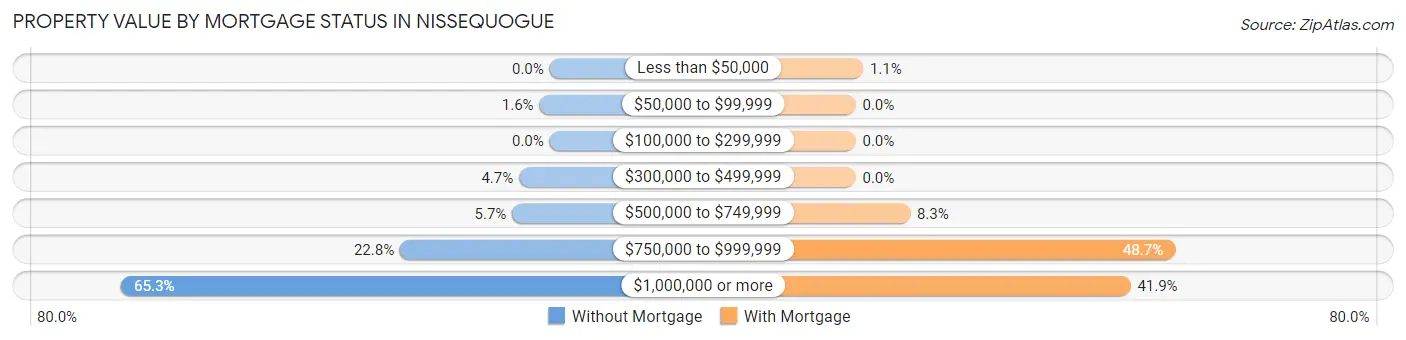
| Property Value | Without Mortgage | With Mortgage |
| Less than $50,000 | 0 (0.0%) | 3 (1.1%) |
| $50,000 to $99,999 | 3 (1.5%) | 0 (0.0%) |
| $100,000 to $299,999 | 0 (0.0%) | 0 (0.0%) |
| $300,000 to $499,999 | 9 (4.7%) | 0 (0.0%) |
| $500,000 to $749,999 | 11 (5.7%) | 22 (8.3%) |
| $750,000 to $999,999 | 44 (22.8%) | 129 (48.7%) |
| $1,000,000 or more | 126 (65.3%) | 111 (41.9%) |
| Total | 193 (100.0%) | 265 (100.0%) |
Household Income by Mortgage Status in Nissequogue
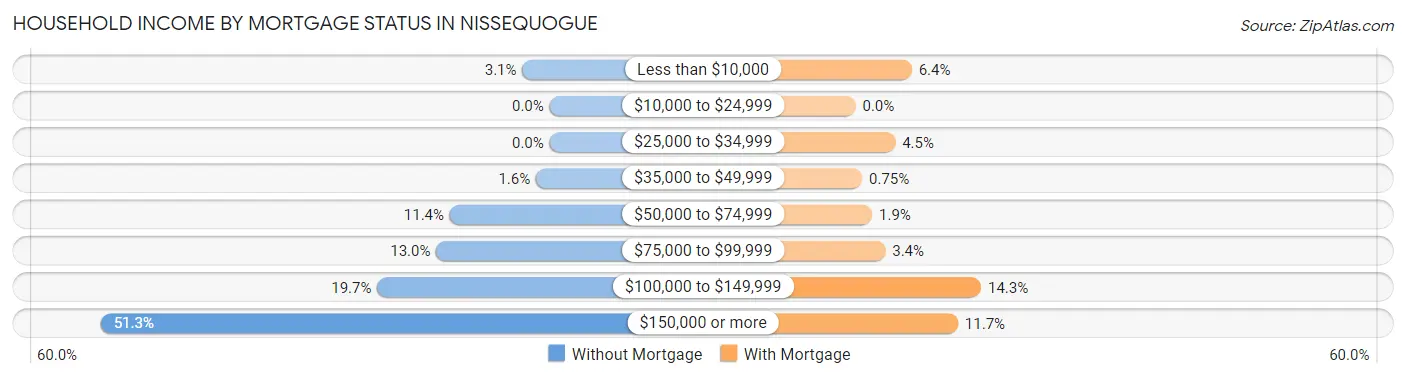
| Household Income | Without Mortgage | With Mortgage |
| Less than $10,000 | 6 (3.1%) | 17 (6.4%) |
| $10,000 to $24,999 | 0 (0.0%) | 0 (0.0%) |
| $25,000 to $34,999 | 0 (0.0%) | 12 (4.5%) |
| $35,000 to $49,999 | 3 (1.5%) | 2 (0.7%) |
| $50,000 to $74,999 | 22 (11.4%) | 5 (1.9%) |
| $75,000 to $99,999 | 25 (13.0%) | 9 (3.4%) |
| $100,000 to $149,999 | 38 (19.7%) | 38 (14.3%) |
| $150,000 or more | 99 (51.3%) | 31 (11.7%) |
| Total | 193 (100.0%) | 265 (100.0%) |
Property Value to Household Income Ratio in Nissequogue
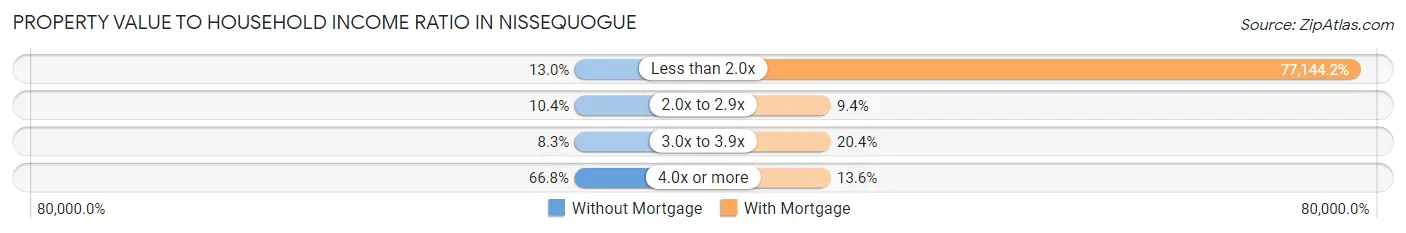
| Value-to-Income Ratio | Without Mortgage | With Mortgage |
| Less than 2.0x | 25 (13.0%) | 204,432 (77,144.2%) |
| 2.0x to 2.9x | 20 (10.4%) | 25 (9.4%) |
| 3.0x to 3.9x | 16 (8.3%) | 54 (20.4%) |
| 4.0x or more | 129 (66.8%) | 36 (13.6%) |
| Total | 193 (100.0%) | 265 (100.0%) |
Real Estate Taxes by Mortgage Status in Nissequogue
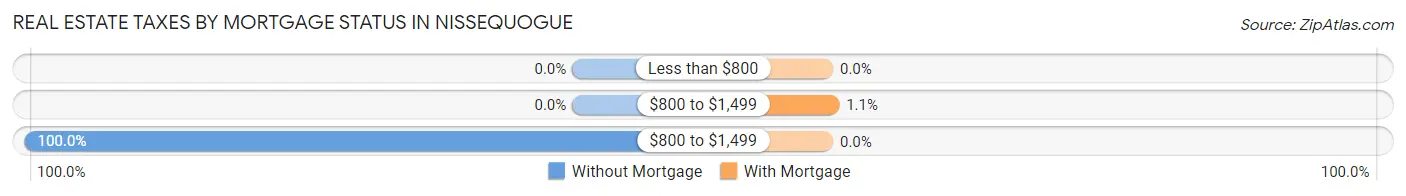
| Property Taxes | Without Mortgage | With Mortgage |
| Less than $800 | 0 (0.0%) | 0 (0.0%) |
| $800 to $1,499 | 0 (0.0%) | 3 (1.1%) |
| $800 to $1,499 | 193 (100.0%) | 0 (0.0%) |
| Total | 193 (100.0%) | 265 (100.0%) |
Health & Disability in Nissequogue
Health Insurance Coverage by Age in Nissequogue
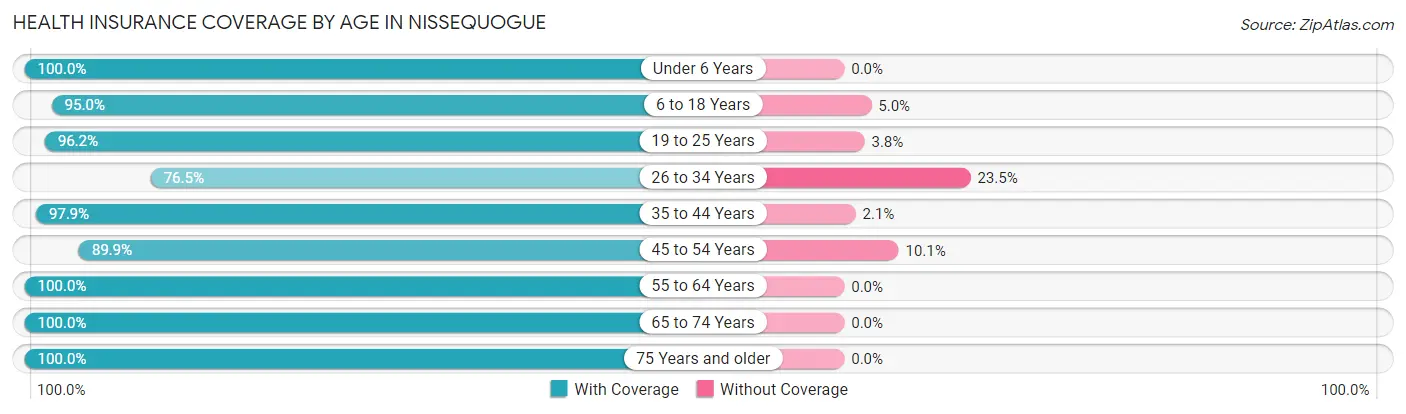
| Age Bracket | With Coverage | Without Coverage |
| Under 6 Years | 65 (100.0%) | 0 (0.0%) |
| 6 to 18 Years | 245 (95.0%) | 13 (5.0%) |
| 19 to 25 Years | 153 (96.2%) | 6 (3.8%) |
| 26 to 34 Years | 78 (76.5%) | 24 (23.5%) |
| 35 to 44 Years | 139 (97.9%) | 3 (2.1%) |
| 45 to 54 Years | 222 (89.9%) | 25 (10.1%) |
| 55 to 64 Years | 284 (100.0%) | 0 (0.0%) |
| 65 to 74 Years | 154 (100.0%) | 0 (0.0%) |
| 75 Years and older | 112 (100.0%) | 0 (0.0%) |
| Total | 1,452 (95.3%) | 71 (4.7%) |
Health Insurance Coverage by Citizenship Status in Nissequogue
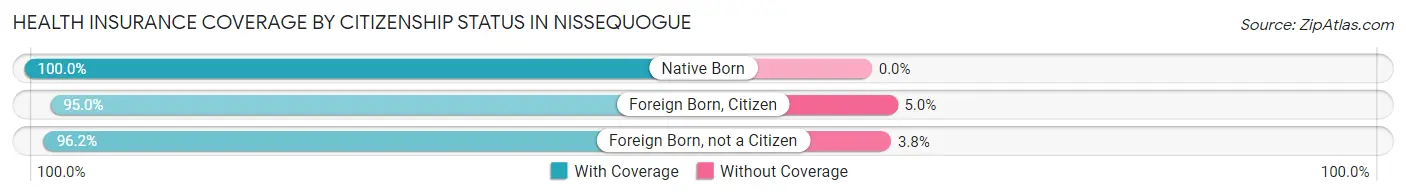
| Citizenship Status | With Coverage | Without Coverage |
| Native Born | 65 (100.0%) | 0 (0.0%) |
| Foreign Born, Citizen | 245 (95.0%) | 13 (5.0%) |
| Foreign Born, not a Citizen | 153 (96.2%) | 6 (3.8%) |
Health Insurance Coverage by Household Income in Nissequogue
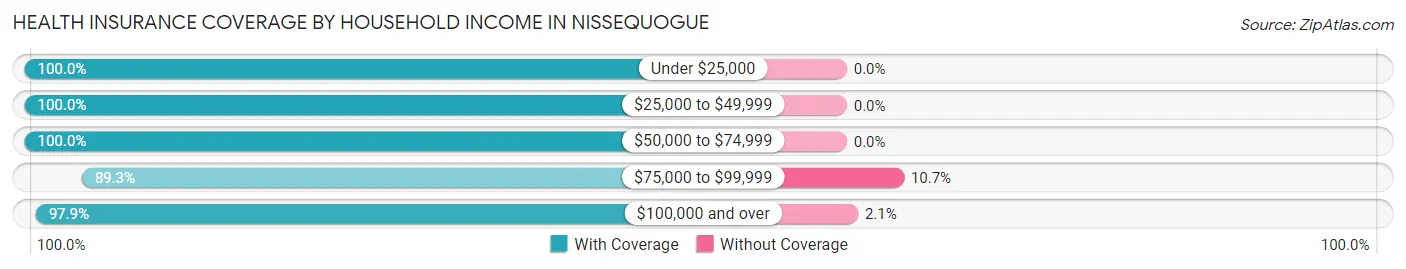
| Household Income | With Coverage | Without Coverage |
| Under $25,000 | 45 (100.0%) | 0 (0.0%) |
| $25,000 to $49,999 | 40 (100.0%) | 0 (0.0%) |
| $50,000 to $74,999 | 66 (100.0%) | 0 (0.0%) |
| $75,000 to $99,999 | 200 (89.3%) | 24 (10.7%) |
| $100,000 and over | 1,078 (97.9%) | 23 (2.1%) |
Public vs Private Health Insurance Coverage by Age in Nissequogue
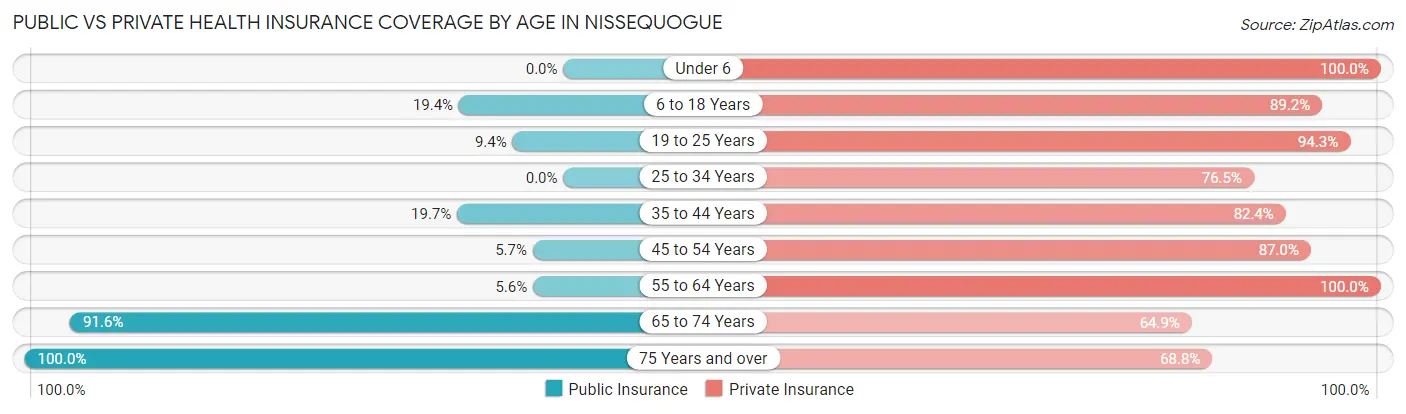
| Age Bracket | Public Insurance | Private Insurance |
| Under 6 | 0 (0.0%) | 65 (100.0%) |
| 6 to 18 Years | 50 (19.4%) | 230 (89.1%) |
| 19 to 25 Years | 15 (9.4%) | 150 (94.3%) |
| 25 to 34 Years | 0 (0.0%) | 78 (76.5%) |
| 35 to 44 Years | 28 (19.7%) | 117 (82.4%) |
| 45 to 54 Years | 14 (5.7%) | 215 (87.0%) |
| 55 to 64 Years | 16 (5.6%) | 284 (100.0%) |
| 65 to 74 Years | 141 (91.6%) | 100 (64.9%) |
| 75 Years and over | 112 (100.0%) | 77 (68.8%) |
| Total | 376 (24.7%) | 1,316 (86.4%) |
Disability Status by Sex by Age in Nissequogue
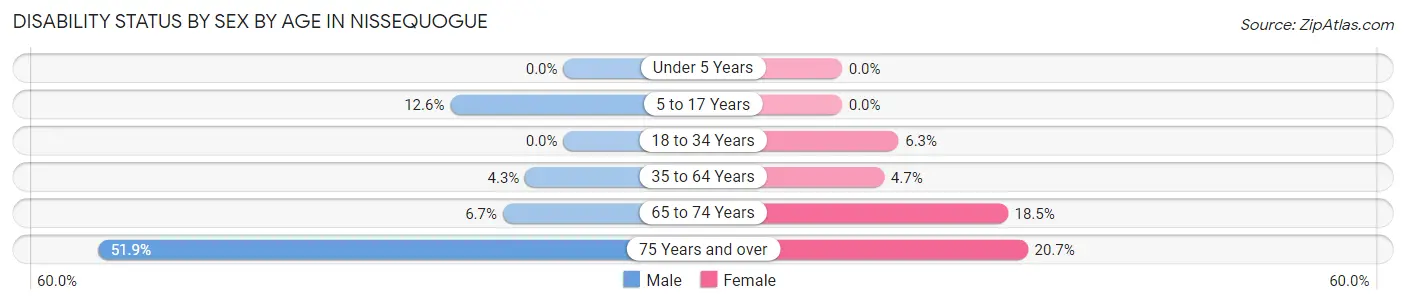
| Age Bracket | Male | Female |
| Under 5 Years | 0 (0.0%) | 0 (0.0%) |
| 5 to 17 Years | 16 (12.6%) | 0 (0.0%) |
| 18 to 34 Years | 0 (0.0%) | 11 (6.3%) |
| 35 to 64 Years | 15 (4.3%) | 15 (4.7%) |
| 65 to 74 Years | 6 (6.7%) | 12 (18.5%) |
| 75 Years and over | 28 (51.8%) | 12 (20.7%) |
Disability Class by Sex by Age in Nissequogue
Disability Class: Hearing Difficulty
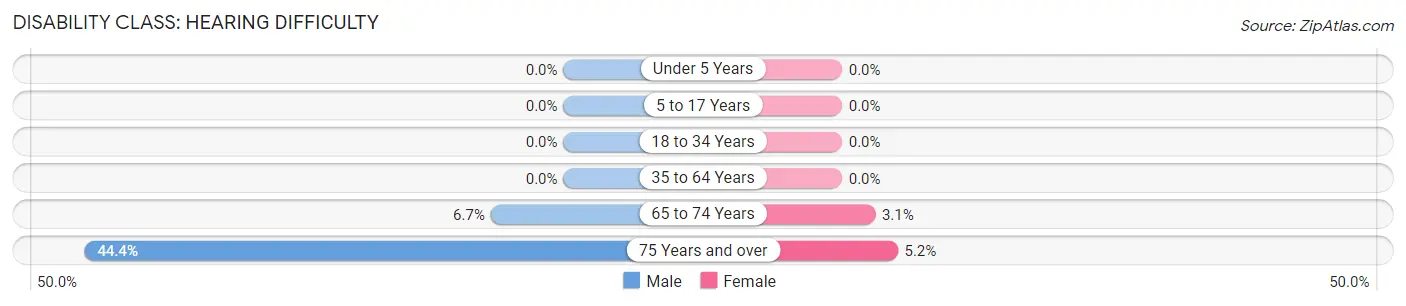
| Age Bracket | Male | Female |
| Under 5 Years | 0 (0.0%) | 0 (0.0%) |
| 5 to 17 Years | 0 (0.0%) | 0 (0.0%) |
| 18 to 34 Years | 0 (0.0%) | 0 (0.0%) |
| 35 to 64 Years | 0 (0.0%) | 0 (0.0%) |
| 65 to 74 Years | 6 (6.7%) | 2 (3.1%) |
| 75 Years and over | 24 (44.4%) | 3 (5.2%) |
Disability Class: Vision Difficulty
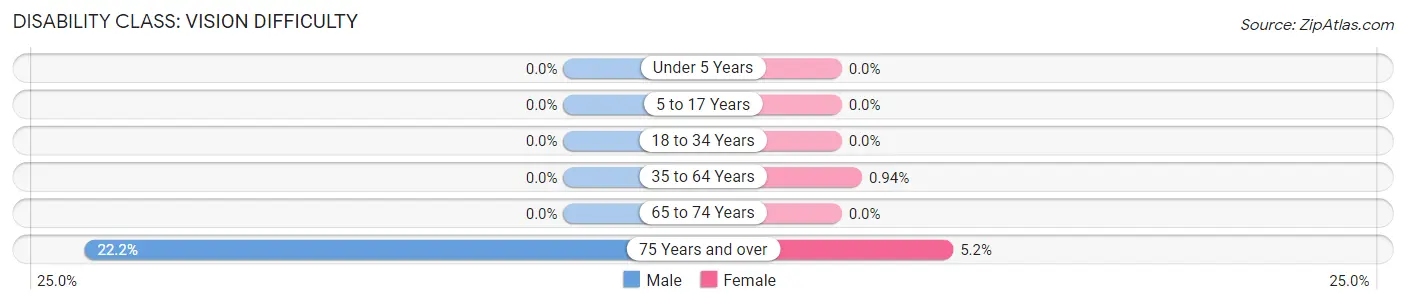
| Age Bracket | Male | Female |
| Under 5 Years | 0 (0.0%) | 0 (0.0%) |
| 5 to 17 Years | 0 (0.0%) | 0 (0.0%) |
| 18 to 34 Years | 0 (0.0%) | 0 (0.0%) |
| 35 to 64 Years | 0 (0.0%) | 3 (0.9%) |
| 65 to 74 Years | 0 (0.0%) | 0 (0.0%) |
| 75 Years and over | 12 (22.2%) | 3 (5.2%) |
Disability Class: Cognitive Difficulty
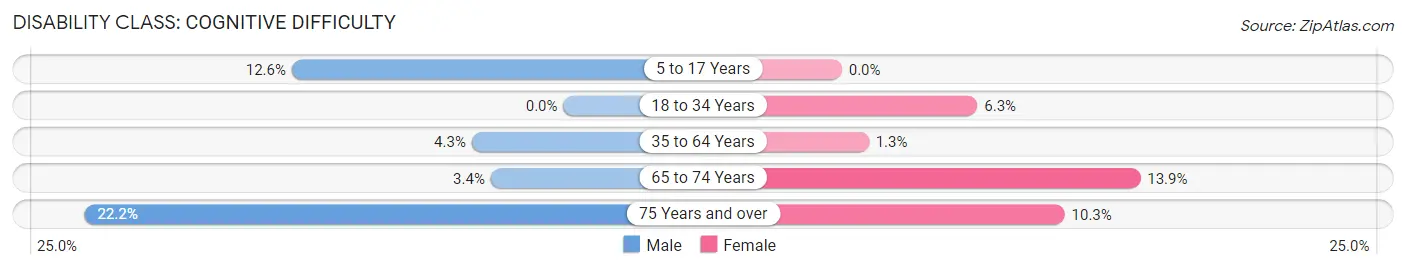
| Age Bracket | Male | Female |
| 5 to 17 Years | 16 (12.6%) | 0 (0.0%) |
| 18 to 34 Years | 0 (0.0%) | 11 (6.3%) |
| 35 to 64 Years | 15 (4.3%) | 4 (1.3%) |
| 65 to 74 Years | 3 (3.4%) | 9 (13.9%) |
| 75 Years and over | 12 (22.2%) | 6 (10.3%) |
Disability Class: Ambulatory Difficulty
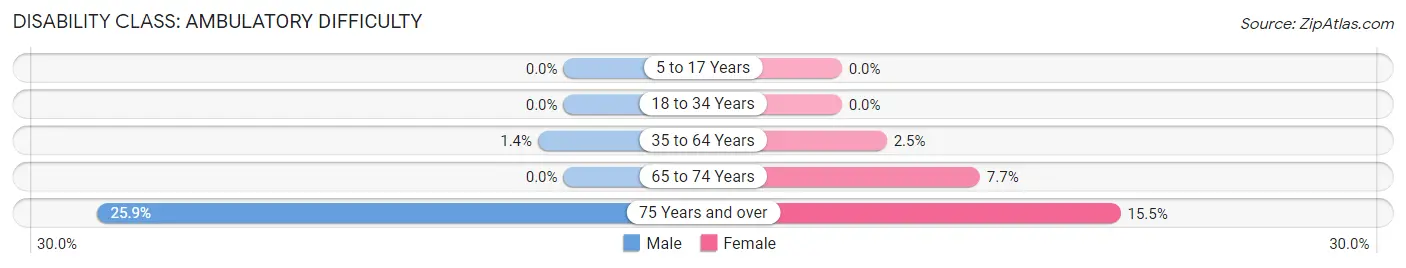
| Age Bracket | Male | Female |
| 5 to 17 Years | 0 (0.0%) | 0 (0.0%) |
| 18 to 34 Years | 0 (0.0%) | 0 (0.0%) |
| 35 to 64 Years | 5 (1.4%) | 8 (2.5%) |
| 65 to 74 Years | 0 (0.0%) | 5 (7.7%) |
| 75 Years and over | 14 (25.9%) | 9 (15.5%) |
Disability Class: Self-Care Difficulty
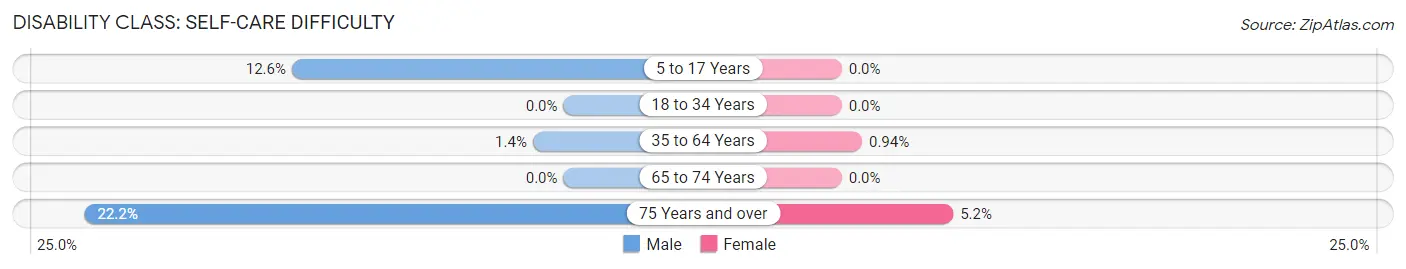
| Age Bracket | Male | Female |
| 5 to 17 Years | 16 (12.6%) | 0 (0.0%) |
| 18 to 34 Years | 0 (0.0%) | 0 (0.0%) |
| 35 to 64 Years | 5 (1.4%) | 3 (0.9%) |
| 65 to 74 Years | 0 (0.0%) | 0 (0.0%) |
| 75 Years and over | 12 (22.2%) | 3 (5.2%) |
Technology Access in Nissequogue
Computing Device Access in Nissequogue
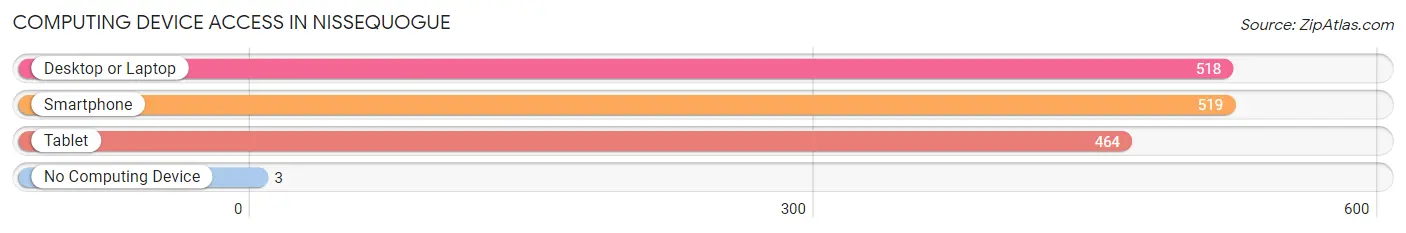
| Device Type | # Households | % Households |
| Desktop or Laptop | 518 | 95.1% |
| Smartphone | 519 | 95.2% |
| Tablet | 464 | 85.1% |
| No Computing Device | 3 | 0.5% |
| Total | 545 | 100.0% |
Internet Access in Nissequogue
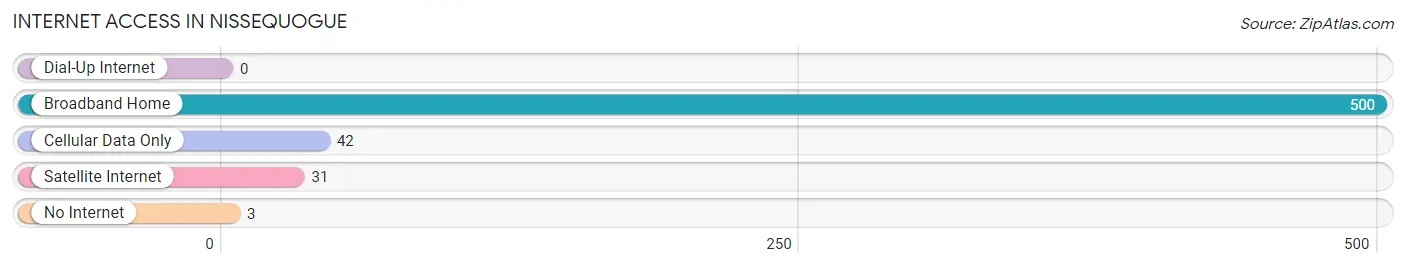
| Internet Type | # Households | % Households |
| Dial-Up Internet | 0 | 0.0% |
| Broadband Home | 500 | 91.7% |
| Cellular Data Only | 42 | 7.7% |
| Satellite Internet | 31 | 5.7% |
| No Internet | 3 | 0.5% |
| Total | 545 | 100.0% |
Nissequogue Summary
Nissequogue is a hamlet located in the Town of Smithtown in Suffolk County, New York. It is situated on the north shore of Long Island, approximately 60 miles east of New York City. The hamlet is bordered by the Nissequogue River to the north, St. James to the east, Smithtown to the south, and Stony Brook to the west.
History
The area now known as Nissequogue was originally inhabited by the Secatogue Indians, a branch of the Algonquin tribe. The name “Nissequogue” is derived from the Secatogue word “Nissequak,” which means “place of the black walnut tree.” The area was first settled by Europeans in the mid-17th century, and the hamlet was officially established in 1788.
In the 19th century, Nissequogue was a popular summer resort destination for wealthy New Yorkers. The area was home to several grand estates, including the estate of William K. Vanderbilt, which was later converted into a golf course.
Geography
Nissequogue is located on the north shore of Long Island, approximately 60 miles east of New York City. The hamlet is bordered by the Nissequogue River to the north, St. James to the east, Smithtown to the south, and Stony Brook to the west.
The hamlet is situated on a peninsula, with the Nissequogue River to the north and the Long Island Sound to the south. The area is mostly flat, with some rolling hills. The highest point in the hamlet is located at the intersection of Nissequogue River Road and St. James Road, at an elevation of approximately 100 feet.
Economy
Nissequogue is primarily a residential community, with a small commercial district located along Nissequogue River Road. The hamlet is home to several small businesses, including restaurants, shops, and professional services.
The hamlet is also home to the William K. Vanderbilt Country Club, which features an 18-hole golf course, tennis courts, and a swimming pool. The club is a popular destination for golfers and tennis players from across Long Island.
Demographics
As of the 2010 census, the population of Nissequogue was 4,845. The racial makeup of the hamlet was 94.3% White, 1.7% African American, 0.3% Native American, 1.2% Asian, 0.1% Pacific Islander, and 2.4% from other races. Hispanic or Latino of any race were 5.2% of the population.
The median household income in Nissequogue was $117,917, and the median family income was $133,917. The per capita income was $50,917. About 2.3% of families and 3.2% of the population were below the poverty line.
Conclusion
Nissequogue is a hamlet located in the Town of Smithtown in Suffolk County, New York. It is situated on the north shore of Long Island, approximately 60 miles east of New York City. The hamlet was originally inhabited by the Secatogue Indians, and was later settled by Europeans in the mid-17th century. Nissequogue is primarily a residential community, with a small commercial district located along Nissequogue River Road. The hamlet is also home to the William K. Vanderbilt Country Club, which features an 18-hole golf course, tennis courts, and a swimming pool. As of the 2010 census, the population of Nissequogue was 4,845. The median household income in Nissequogue was $117,917, and the median family income was $133,917.
Common Questions
What is Per Capita Income in Nissequogue?
Per Capita income in Nissequogue is $100,910.
What is the Median Family Income in Nissequogue?
Median Family Income in Nissequogue is $177,188.
What is the Median Household income in Nissequogue?
Median Household Income in Nissequogue is $154,250.
What is Income or Wage Gap in Nissequogue?
Income or Wage Gap in Nissequogue is 44.6%.
Women in Nissequogue earn 55.4 cents for every dollar earned by a man.
What is Family Income Deficit in Nissequogue?
Family Income Deficit in Nissequogue is $11,225.
Families that are below poverty line in Nissequogue earn $11,225 less on average than the poverty threshold level.
What is Inequality or Gini Index in Nissequogue?
Inequality or Gini Index in Nissequogue is 0.52.
What is the Total Population of Nissequogue?
Total Population of Nissequogue is 1,523.
What is the Total Male Population of Nissequogue?
Total Male Population of Nissequogue is 798.
What is the Total Female Population of Nissequogue?
Total Female Population of Nissequogue is 725.
What is the Ratio of Males per 100 Females in Nissequogue?
There are 110.07 Males per 100 Females in Nissequogue.
What is the Ratio of Females per 100 Males in Nissequogue?
There are 90.85 Females per 100 Males in Nissequogue.
What is the Median Population Age in Nissequogue?
Median Population Age in Nissequogue is 46.6 Years.
What is the Average Family Size in Nissequogue
Average Family Size in Nissequogue is 3.0 People.
What is the Average Household Size in Nissequogue
Average Household Size in Nissequogue is 2.7 People.
How Large is the Labor Force in Nissequogue?
There are 777 People in the Labor Forcein in Nissequogue.
What is the Percentage of People in the Labor Force in Nissequogue?
60.6% of People are in the Labor Force in Nissequogue.
What is the Unemployment Rate in Nissequogue?
Unemployment Rate in Nissequogue is 4.1%.