North Haven, NY Map & Demographics
North Haven Map
North Haven Overview
$177,262
PER CAPITA INCOME
$213,250
AVG FAMILY INCOME
$151,250
AVG HOUSEHOLD INCOME
45.0%
WAGE / INCOME GAP [ % ]
55.0¢/ $1
WAGE / INCOME GAP [ $ ]
0.61
INEQUALITY / GINI INDEX
913
TOTAL POPULATION
465
MALE POPULATION
448
FEMALE POPULATION
103.79
MALES / 100 FEMALES
96.34
FEMALES / 100 MALES
57.7
MEDIAN AGE
2.6
AVG FAMILY SIZE
2.1
AVG HOUSEHOLD SIZE
460
LABOR FORCE [ PEOPLE ]
56.9%
PERCENT IN LABOR FORCE
2.6%
UNEMPLOYMENT RATE
Income in North Haven
Income Overview in North Haven
Per Capita Income in North Haven is $177,262, while median incomes of families and households are $213,250 and $151,250 respectively.
| Characteristic | Number | Measure |
| Per Capita Income | 913 | $177,262 |
| Median Family Income | 291 | $213,250 |
| Mean Family Income | 291 | $445,772 |
| Median Household Income | 425 | $151,250 |
| Mean Household Income | 425 | $374,528 |
| Income Deficit | 291 | $0 |
| Wage / Income Gap (%) | 913 | 45.04% |
| Wage / Income Gap ($) | 913 | 54.96¢ per $1 |
| Gini / Inequality Index | 913 | 0.61 |
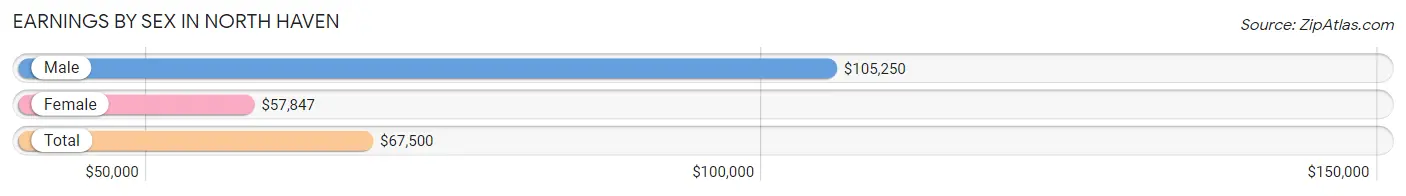
Earnings by Sex in North Haven
Average Earnings in North Haven are $67,500, $105,250 for men and $57,847 for women, a difference of 45.0%.
| Sex | Number | Average Earnings |
| Male | 289 (55.8%) | $105,250 |
| Female | 229 (44.2%) | $57,847 |
| Total | 518 (100.0%) | $67,500 |
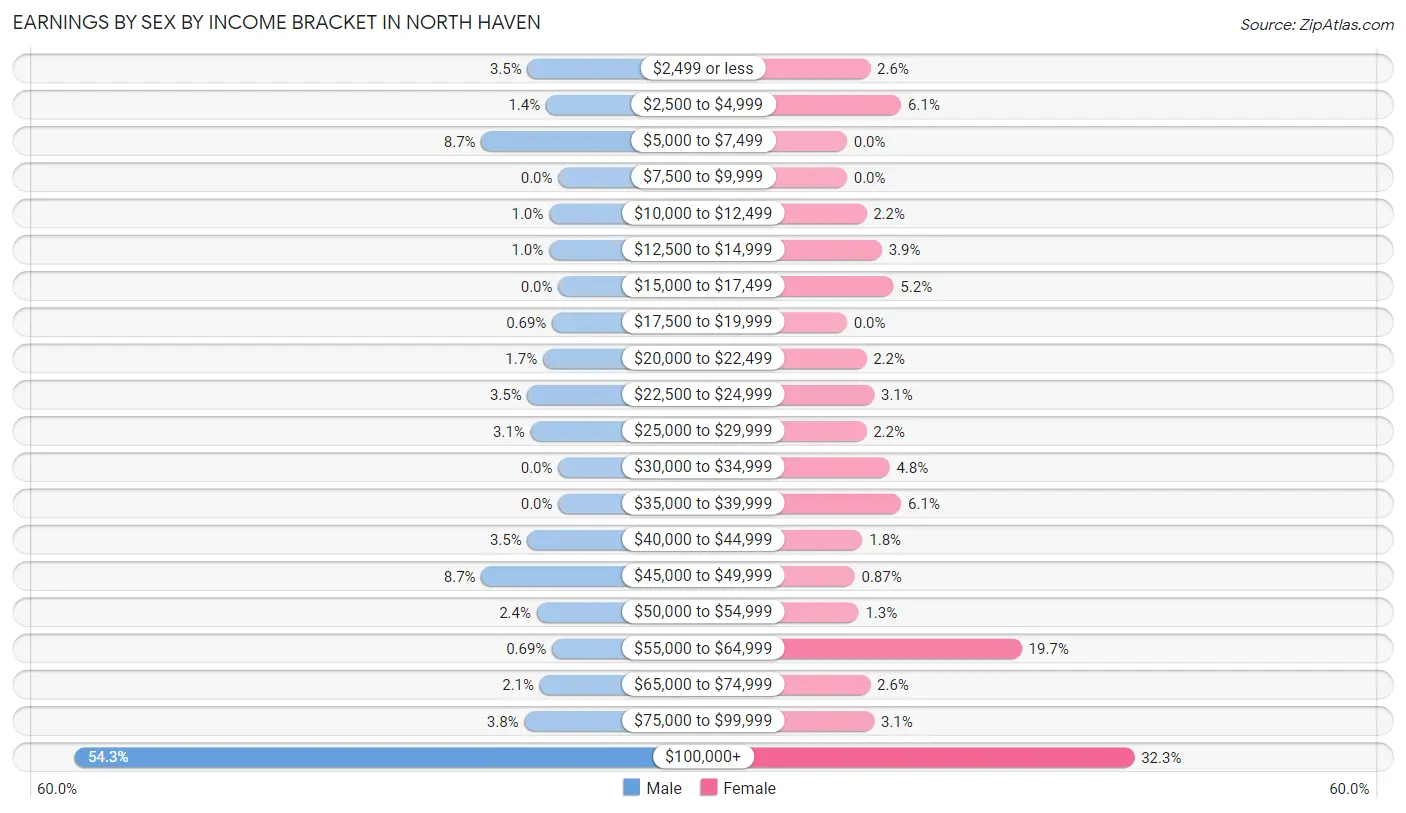
Earnings by Sex by Income Bracket in North Haven
The most common earnings brackets in North Haven are $100,000+ for men (157 | 54.3%) and $100,000+ for women (74 | 32.3%).
| Income | Male | Female |
| $2,499 or less | 10 (3.5%) | 6 (2.6%) |
| $2,500 to $4,999 | 4 (1.4%) | 14 (6.1%) |
| $5,000 to $7,499 | 25 (8.6%) | 0 (0.0%) |
| $7,500 to $9,999 | 0 (0.0%) | 0 (0.0%) |
| $10,000 to $12,499 | 3 (1.0%) | 5 (2.2%) |
| $12,500 to $14,999 | 3 (1.0%) | 9 (3.9%) |
| $15,000 to $17,499 | 0 (0.0%) | 12 (5.2%) |
| $17,500 to $19,999 | 2 (0.7%) | 0 (0.0%) |
| $20,000 to $22,499 | 5 (1.7%) | 5 (2.2%) |
| $22,500 to $24,999 | 10 (3.5%) | 7 (3.1%) |
| $25,000 to $29,999 | 9 (3.1%) | 5 (2.2%) |
| $30,000 to $34,999 | 0 (0.0%) | 11 (4.8%) |
| $35,000 to $39,999 | 0 (0.0%) | 14 (6.1%) |
| $40,000 to $44,999 | 10 (3.5%) | 4 (1.8%) |
| $45,000 to $49,999 | 25 (8.6%) | 2 (0.9%) |
| $50,000 to $54,999 | 7 (2.4%) | 3 (1.3%) |
| $55,000 to $64,999 | 2 (0.7%) | 45 (19.7%) |
| $65,000 to $74,999 | 6 (2.1%) | 6 (2.6%) |
| $75,000 to $99,999 | 11 (3.8%) | 7 (3.1%) |
| $100,000+ | 157 (54.3%) | 74 (32.3%) |
| Total | 289 (100.0%) | 229 (100.0%) |
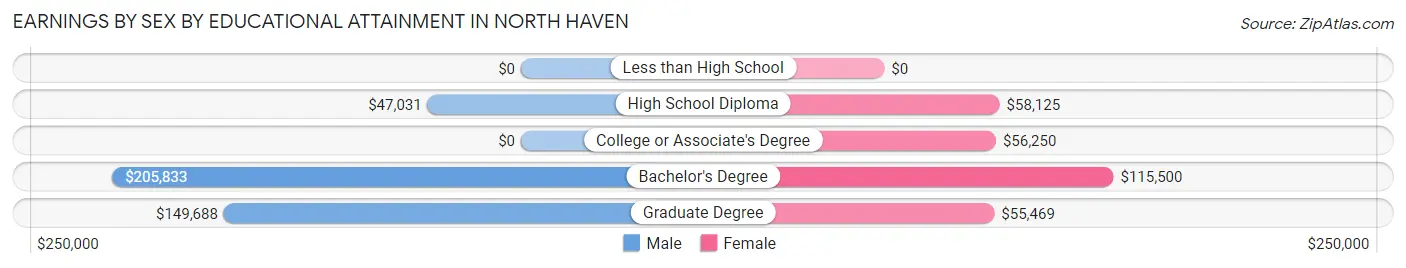
Earnings by Sex by Educational Attainment in North Haven
Average earnings in North Haven are $108,333 for men and $58,056 for women, a difference of 46.4%. Men with an educational attainment of bachelor's degree enjoy the highest average annual earnings of $205,833, while those with high school diploma education earn the least with $47,031. Women with an educational attainment of bachelor's degree earn the most with the average annual earnings of $115,500, while those with graduate degree education have the smallest earnings of $55,469.
| Educational Attainment | Male Income | Female Income |
| Less than High School | - | - |
| High School Diploma | $47,031 | $58,125 |
| College or Associate's Degree | - | - |
| Bachelor's Degree | $205,833 | $115,500 |
| Graduate Degree | $149,688 | $55,469 |
| Total | $108,333 | $58,056 |
Family Income in North Haven
Family Income Brackets in North Haven
According to the North Haven family income data, there are 150 families falling into the $200,000+ income range, which is the most common income bracket and makes up 51.5% of all families.
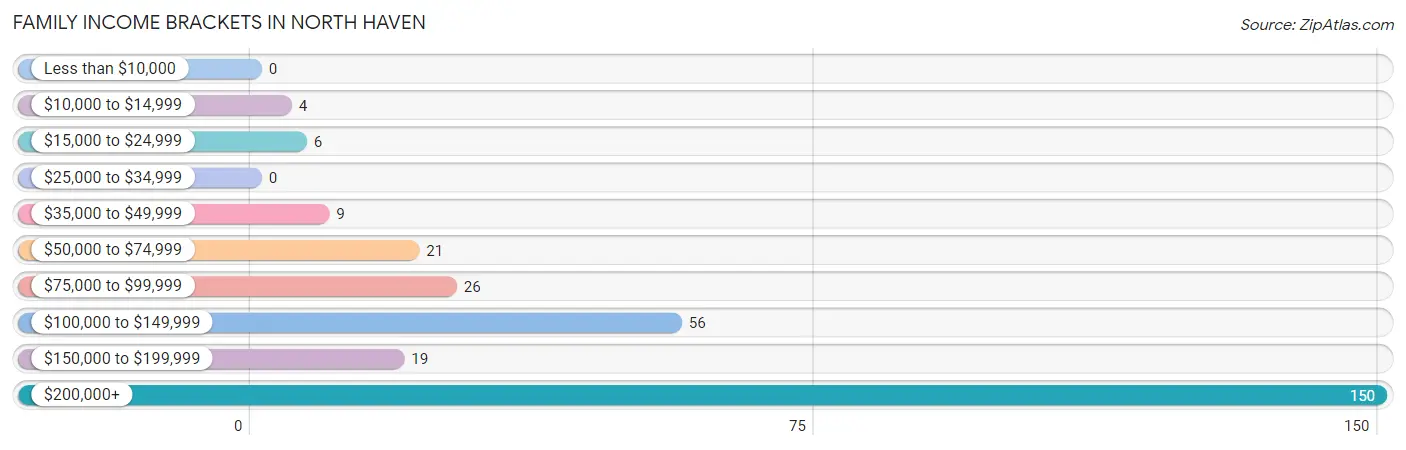
| Income Bracket | # Families | % Families |
| Less than $10,000 | 0 | 0.0% |
| $10,000 to $14,999 | 4 | 1.4% |
| $15,000 to $24,999 | 6 | 2.1% |
| $25,000 to $34,999 | 0 | 0.0% |
| $35,000 to $49,999 | 9 | 3.1% |
| $50,000 to $74,999 | 21 | 7.2% |
| $75,000 to $99,999 | 26 | 8.9% |
| $100,000 to $149,999 | 56 | 19.2% |
| $150,000 to $199,999 | 19 | 6.5% |
| $200,000+ | 150 | 51.5% |
Family Income by Famaliy Size in North Haven
3-person families (42 | 14.4%) account for the highest median family income in North Haven with $250,001 per family, while 3-person families (42 | 14.4%) have the highest median income of $83,334 per family member.
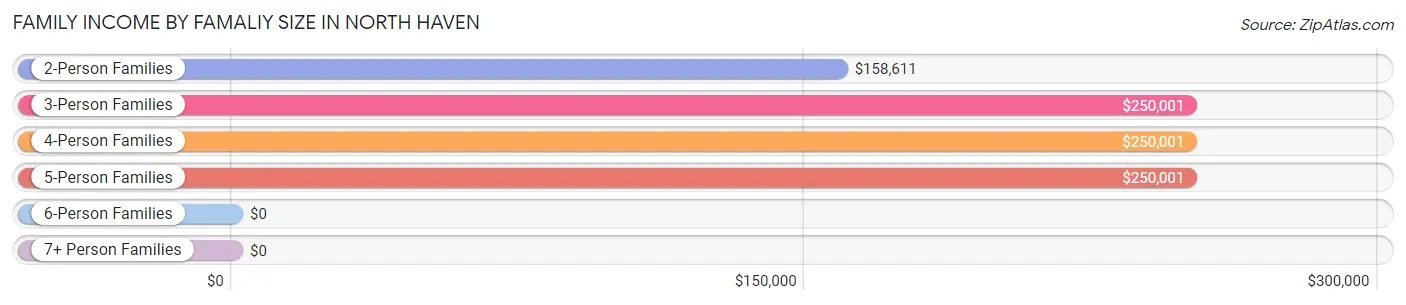
| Income Bracket | # Families | Median Income |
| 2-Person Families | 200 (68.7%) | $158,611 |
| 3-Person Families | 42 (14.4%) | $250,001 |
| 4-Person Families | 39 (13.4%) | $250,001 |
| 5-Person Families | 8 (2.8%) | $250,001 |
| 6-Person Families | 2 (0.7%) | $0 |
| 7+ Person Families | 0 (0.0%) | $0 |
| Total | 291 (100.0%) | $213,250 |
Family Income by Number of Earners in North Haven
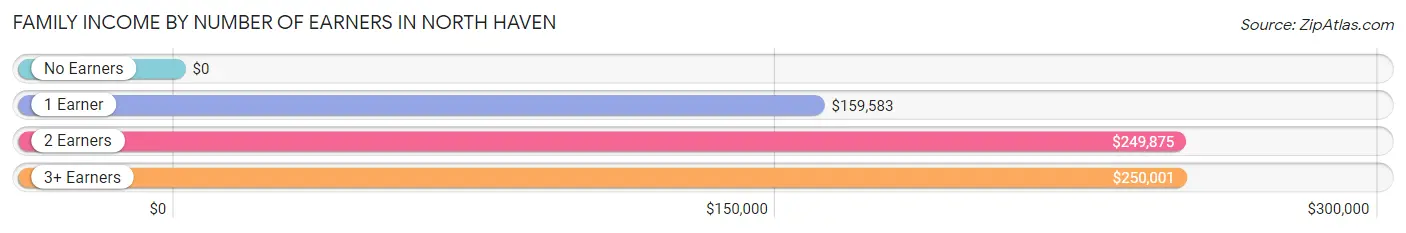
| Number of Earners | # Families | Median Income |
| No Earners | 48 (16.5%) | $0 |
| 1 Earner | 97 (33.3%) | $159,583 |
| 2 Earners | 129 (44.3%) | $249,875 |
| 3+ Earners | 17 (5.8%) | $250,001 |
| Total | 291 (100.0%) | $213,250 |
Household Income in North Haven
Household Income Brackets in North Haven
With 180 households falling in the category, the $200,000+ income range is the most frequent in North Haven, accounting for 42.3% of all households. In contrast, only 10 households (2.4%) fall into the $25,000 to $34,999 income bracket, making it the least populous group.
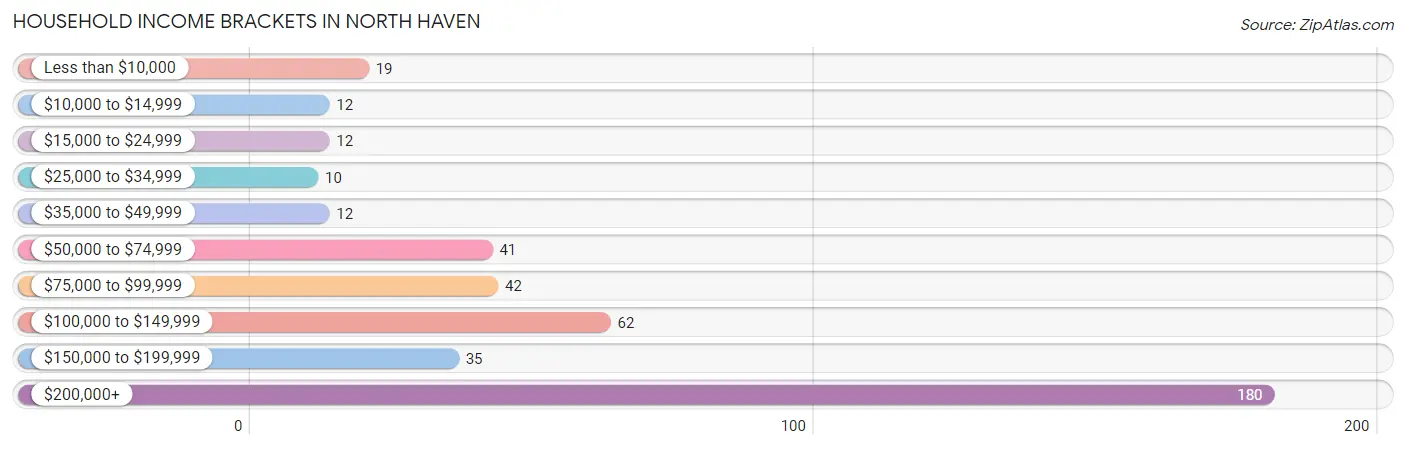
| Income Bracket | # Households | % Households |
| Less than $10,000 | 19 | 4.5% |
| $10,000 to $14,999 | 12 | 2.8% |
| $15,000 to $24,999 | 12 | 2.8% |
| $25,000 to $34,999 | 10 | 2.4% |
| $35,000 to $49,999 | 12 | 2.8% |
| $50,000 to $74,999 | 41 | 9.6% |
| $75,000 to $99,999 | 42 | 9.9% |
| $100,000 to $149,999 | 62 | 14.6% |
| $150,000 to $199,999 | 35 | 8.2% |
| $200,000+ | 180 | 42.4% |
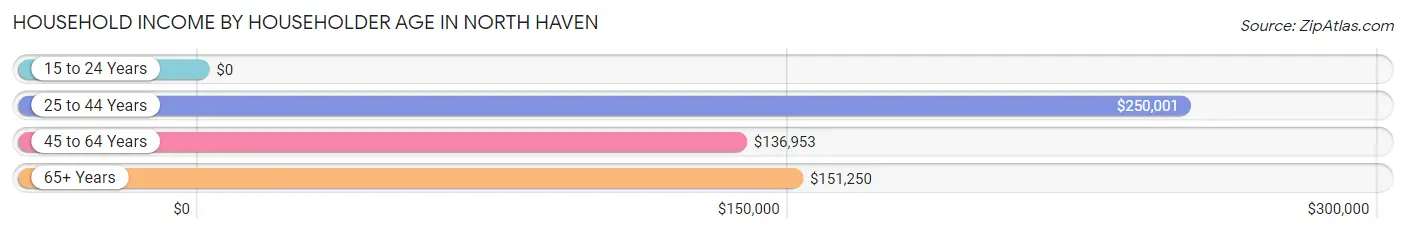
Household Income by Householder Age in North Haven
The median household income in North Haven is $151,250, with the highest median household income of $250,001 found in the 25 to 44 years age bracket for the primary householder. A total of 30 households (7.1%) fall into this category.
| Income Bracket | # Households | Median Income |
| 15 to 24 Years | 0 (0.0%) | $0 |
| 25 to 44 Years | 30 (7.1%) | $250,001 |
| 45 to 64 Years | 209 (49.2%) | $136,953 |
| 65+ Years | 186 (43.8%) | $151,250 |
| Total | 425 (100.0%) | $151,250 |
Poverty in North Haven
Income Below Poverty by Sex and Age in North Haven
With 4.1% poverty level for males and 5.8% for females among the residents of North Haven, 75 year old and over males and 75 year old and over females are the most vulnerable to poverty, with 8 males (16.3%) and 11 females (16.9%) in their respective age groups living below the poverty level.
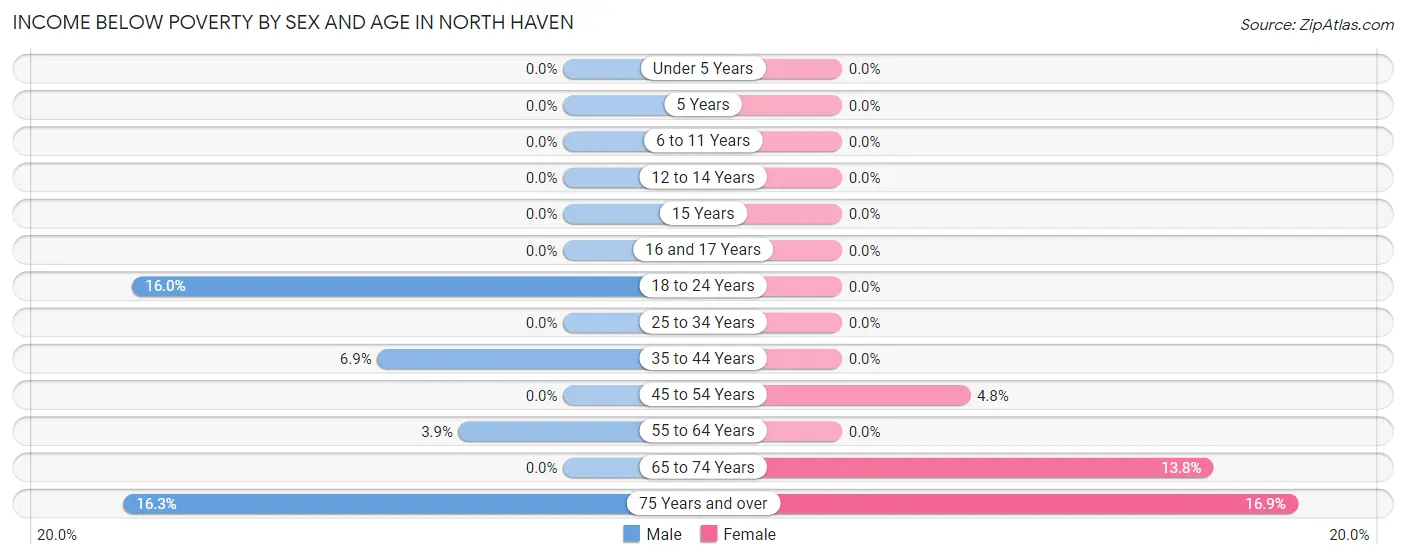
| Age Bracket | Male | Female |
| Under 5 Years | 0 (0.0%) | 0 (0.0%) |
| 5 Years | 0 (0.0%) | 0 (0.0%) |
| 6 to 11 Years | 0 (0.0%) | 0 (0.0%) |
| 12 to 14 Years | 0 (0.0%) | 0 (0.0%) |
| 15 Years | 0 (0.0%) | 0 (0.0%) |
| 16 and 17 Years | 0 (0.0%) | 0 (0.0%) |
| 18 to 24 Years | 4 (16.0%) | 0 (0.0%) |
| 25 to 34 Years | 0 (0.0%) | 0 (0.0%) |
| 35 to 44 Years | 2 (6.9%) | 0 (0.0%) |
| 45 to 54 Years | 0 (0.0%) | 3 (4.8%) |
| 55 to 64 Years | 5 (3.9%) | 0 (0.0%) |
| 65 to 74 Years | 0 (0.0%) | 12 (13.8%) |
| 75 Years and over | 8 (16.3%) | 11 (16.9%) |
| Total | 19 (4.1%) | 26 (5.8%) |
Income Above Poverty by Sex and Age in North Haven
According to the poverty statistics in North Haven, males aged under 5 years and females aged under 5 years are the age groups that are most secure financially, with 100.0% of males and 100.0% of females in these age groups living above the poverty line.
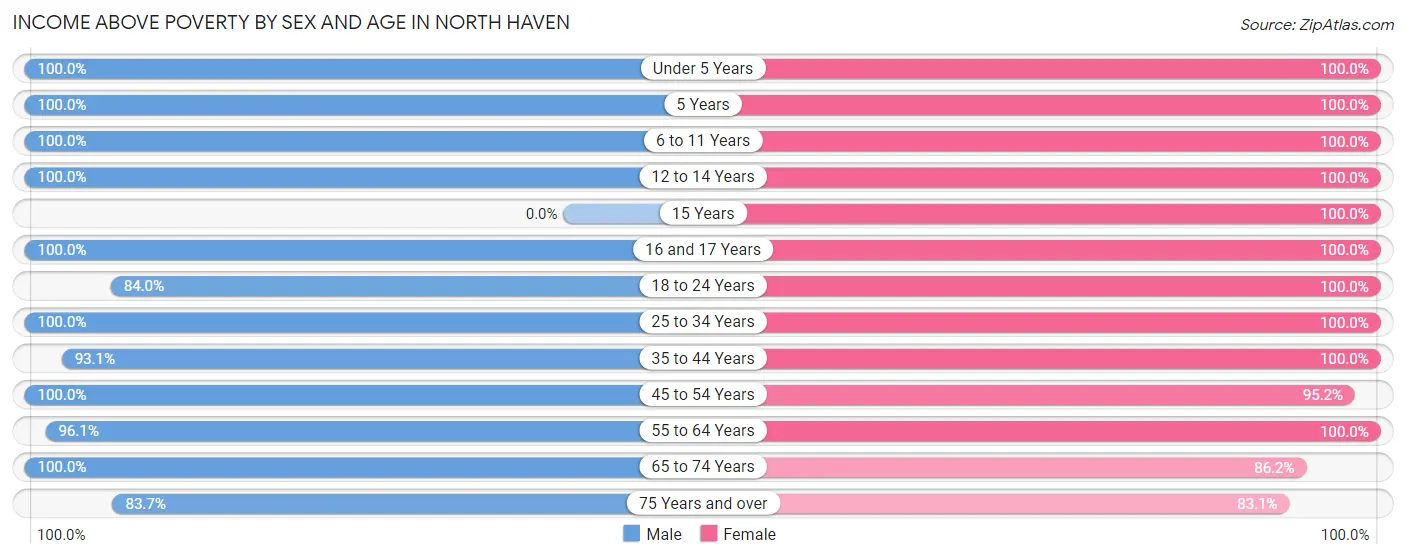
| Age Bracket | Male | Female |
| Under 5 Years | 11 (100.0%) | 12 (100.0%) |
| 5 Years | 3 (100.0%) | 6 (100.0%) |
| 6 to 11 Years | 12 (100.0%) | 20 (100.0%) |
| 12 to 14 Years | 16 (100.0%) | 22 (100.0%) |
| 15 Years | 0 (0.0%) | 3 (100.0%) |
| 16 and 17 Years | 19 (100.0%) | 10 (100.0%) |
| 18 to 24 Years | 21 (84.0%) | 6 (100.0%) |
| 25 to 34 Years | 17 (100.0%) | 13 (100.0%) |
| 35 to 44 Years | 27 (93.1%) | 35 (100.0%) |
| 45 to 54 Years | 55 (100.0%) | 60 (95.2%) |
| 55 to 64 Years | 124 (96.1%) | 106 (100.0%) |
| 65 to 74 Years | 100 (100.0%) | 75 (86.2%) |
| 75 Years and over | 41 (83.7%) | 54 (83.1%) |
| Total | 446 (95.9%) | 422 (94.2%) |
Income Below Poverty Among Married-Couple Families in North Haven
The poverty statistics for married-couple families in North Haven show that 2.9% or 7 of the total 244 families live below the poverty line. Families with no children have the highest poverty rate of 3.7%, comprising of 7 families. On the other hand, families with 1 or 2 children have the lowest poverty rate of 0.0%, which includes 0 families.
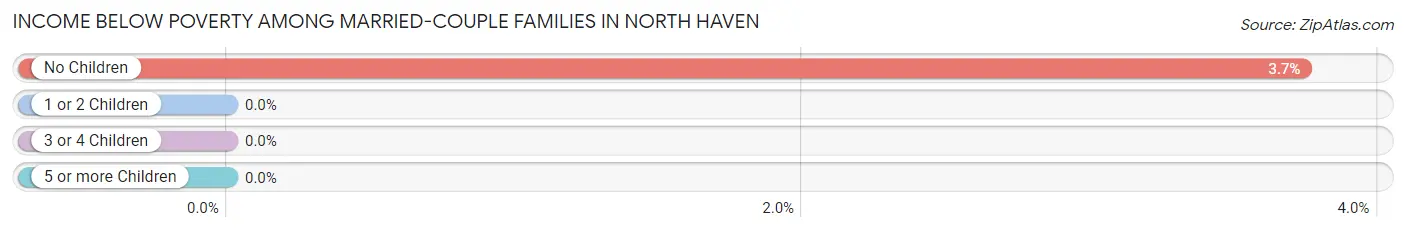
| Children | Above Poverty | Below Poverty |
| No Children | 180 (96.3%) | 7 (3.7%) |
| 1 or 2 Children | 51 (100.0%) | 0 (0.0%) |
| 3 or 4 Children | 6 (100.0%) | 0 (0.0%) |
| 5 or more Children | 0 (0.0%) | 0 (0.0%) |
| Total | 237 (97.1%) | 7 (2.9%) |
Income Below Poverty Among Single-Parent Households in North Haven
| Children | Single Father | Single Mother |
| No Children | 0 (0.0%) | 0 (0.0%) |
| 1 or 2 Children | 0 (0.0%) | 0 (0.0%) |
| 3 or 4 Children | 0 (0.0%) | 0 (0.0%) |
| 5 or more Children | 0 (0.0%) | 0 (0.0%) |
| Total | 0 (0.0%) | 0 (0.0%) |
Income Below Poverty Among Married-Couple vs Single-Parent Households in North Haven
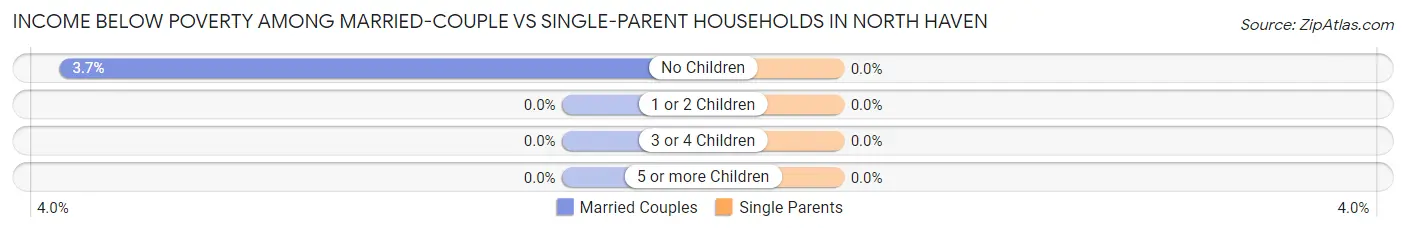
| Children | Married-Couple Families | Single-Parent Households |
| No Children | 7 (3.7%) | 0 (0.0%) |
| 1 or 2 Children | 0 (0.0%) | 0 (0.0%) |
| 3 or 4 Children | 0 (0.0%) | 0 (0.0%) |
| 5 or more Children | 0 (0.0%) | 0 (0.0%) |
| Total | 7 (2.9%) | 0 (0.0%) |
Race in North Haven
The most populous races in North Haven are White / Caucasian (851 | 93.2%), Two or more Races (43 | 4.7%), and Hispanic or Latino (20 | 2.2%).
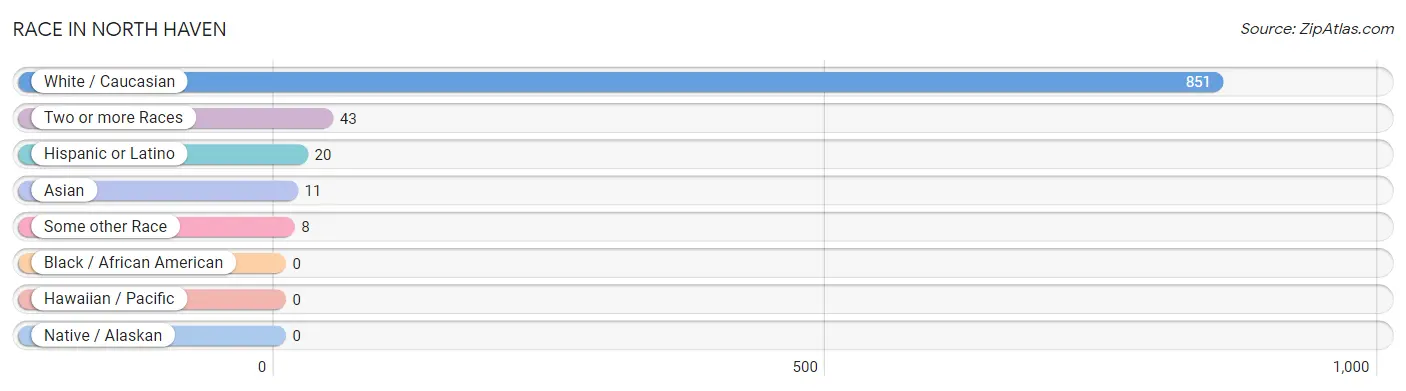
| Race | # Population | % Population |
| Asian | 11 | 1.2% |
| Black / African American | 0 | 0.0% |
| Hawaiian / Pacific | 0 | 0.0% |
| Hispanic or Latino | 20 | 2.2% |
| Native / Alaskan | 0 | 0.0% |
| White / Caucasian | 851 | 93.2% |
| Two or more Races | 43 | 4.7% |
| Some other Race | 8 | 0.9% |
| Total | 913 | 100.0% |
Ancestry in North Haven
The most populous ancestries reported in North Haven are English (158 | 17.3%), Irish (152 | 16.7%), Italian (137 | 15.0%), German (107 | 11.7%), and Polish (93 | 10.2%), together accounting for 70.9% of all North Haven residents.
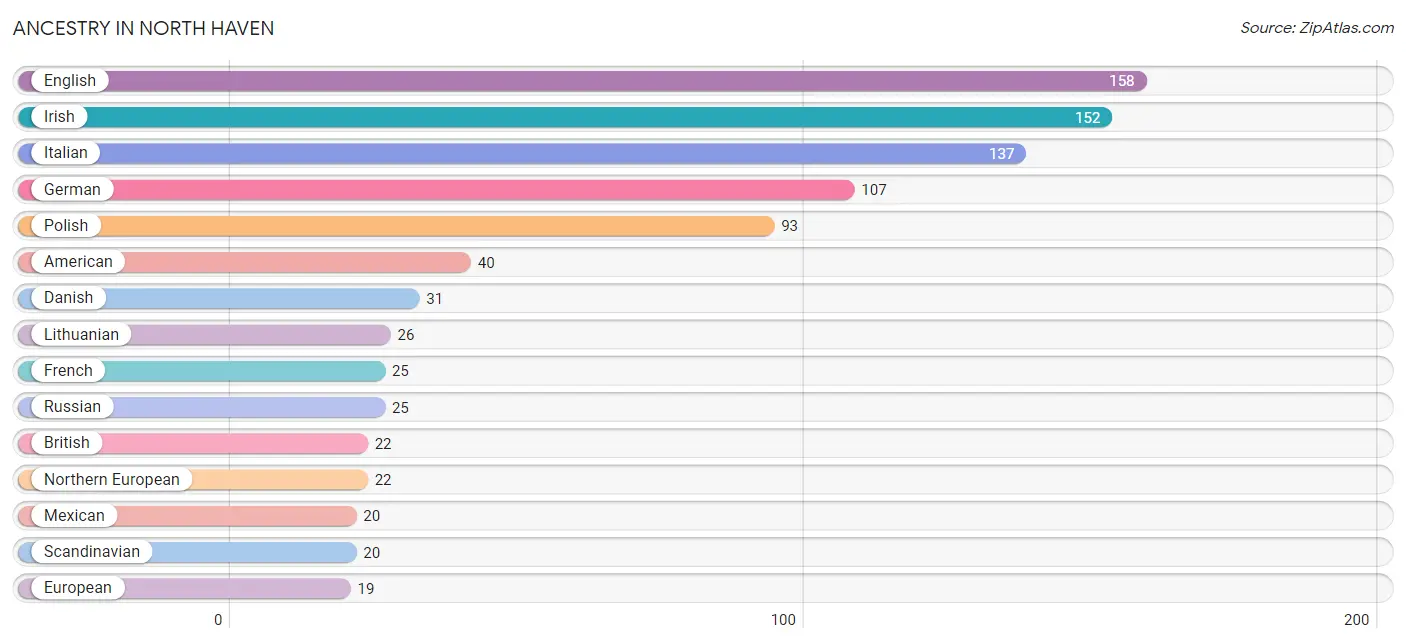
| Ancestry | # Population | % Population |
| American | 40 | 4.4% |
| Arab | 5 | 0.5% |
| Austrian | 7 | 0.8% |
| British | 22 | 2.4% |
| Danish | 31 | 3.4% |
| Dutch | 16 | 1.8% |
| Eastern European | 17 | 1.9% |
| English | 158 | 17.3% |
| European | 19 | 2.1% |
| French | 25 | 2.7% |
| German | 107 | 11.7% |
| Hungarian | 6 | 0.7% |
| Indian (Asian) | 16 | 1.8% |
| Irish | 152 | 16.7% |
| Italian | 137 | 15.0% |
| Latvian | 3 | 0.3% |
| Lithuanian | 26 | 2.9% |
| Mexican | 20 | 2.2% |
| Northern European | 22 | 2.4% |
| Polish | 93 | 10.2% |
| Portuguese | 4 | 0.4% |
| Russian | 25 | 2.7% |
| Scandinavian | 20 | 2.2% |
| Scotch-Irish | 2 | 0.2% |
| Scottish | 19 | 2.1% |
| Slovene | 5 | 0.5% |
| Swiss | 6 | 0.7% |
| Thai | 5 | 0.5% |
| Ukrainian | 4 | 0.4% |
| Welsh | 4 | 0.4% | View All 30 Rows |
Immigrants in North Haven
The most numerous immigrant groups reported in North Haven came from Europe (53 | 5.8%), Northern Europe (40 | 4.4%), England (14 | 1.5%), Latin America (13 | 1.4%), and South America (10 | 1.1%), together accounting for 14.2% of all North Haven residents.
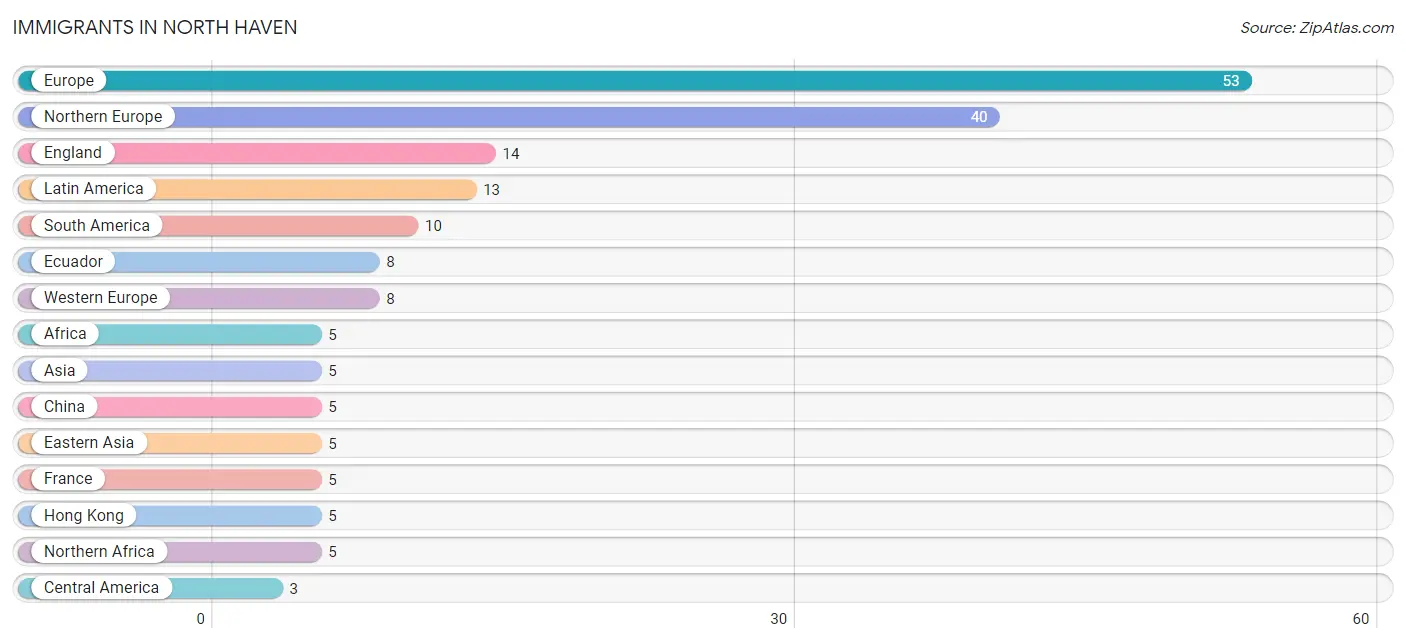
| Immigration Origin | # Population | % Population |
| Africa | 5 | 0.5% |
| Asia | 5 | 0.5% |
| Brazil | 2 | 0.2% |
| Canada | 2 | 0.2% |
| Central America | 3 | 0.3% |
| China | 5 | 0.5% |
| Denmark | 2 | 0.2% |
| Eastern Asia | 5 | 0.5% |
| Eastern Europe | 2 | 0.2% |
| Ecuador | 8 | 0.9% |
| England | 14 | 1.5% |
| Europe | 53 | 5.8% |
| France | 5 | 0.5% |
| Hong Kong | 5 | 0.5% |
| Italy | 3 | 0.3% |
| Latin America | 13 | 1.4% |
| Mexico | 3 | 0.3% |
| Netherlands | 3 | 0.3% |
| Northern Africa | 5 | 0.5% |
| Northern Europe | 40 | 4.4% |
| Russia | 2 | 0.2% |
| South America | 10 | 1.1% |
| Southern Europe | 3 | 0.3% |
| Western Europe | 8 | 0.9% | View All 24 Rows |
Sex and Age in North Haven
Sex and Age in North Haven
The most populous age groups in North Haven are 55 to 59 Years (86 | 18.5%) for men and 50 to 54 Years (59 | 13.2%) for women.
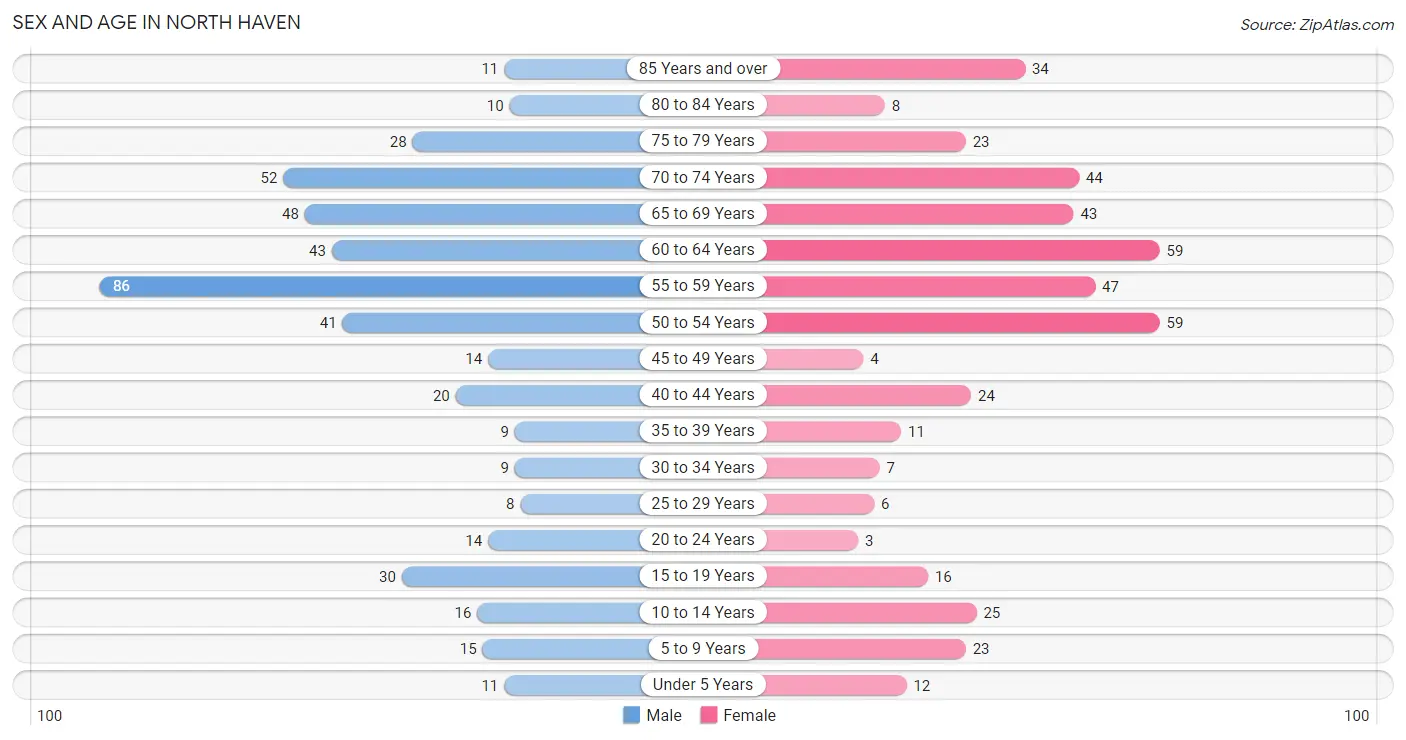
| Age Bracket | Male | Female |
| Under 5 Years | 11 (2.4%) | 12 (2.7%) |
| 5 to 9 Years | 15 (3.2%) | 23 (5.1%) |
| 10 to 14 Years | 16 (3.4%) | 25 (5.6%) |
| 15 to 19 Years | 30 (6.5%) | 16 (3.6%) |
| 20 to 24 Years | 14 (3.0%) | 3 (0.7%) |
| 25 to 29 Years | 8 (1.7%) | 6 (1.3%) |
| 30 to 34 Years | 9 (1.9%) | 7 (1.6%) |
| 35 to 39 Years | 9 (1.9%) | 11 (2.5%) |
| 40 to 44 Years | 20 (4.3%) | 24 (5.4%) |
| 45 to 49 Years | 14 (3.0%) | 4 (0.9%) |
| 50 to 54 Years | 41 (8.8%) | 59 (13.2%) |
| 55 to 59 Years | 86 (18.5%) | 47 (10.5%) |
| 60 to 64 Years | 43 (9.2%) | 59 (13.2%) |
| 65 to 69 Years | 48 (10.3%) | 43 (9.6%) |
| 70 to 74 Years | 52 (11.2%) | 44 (9.8%) |
| 75 to 79 Years | 28 (6.0%) | 23 (5.1%) |
| 80 to 84 Years | 10 (2.1%) | 8 (1.8%) |
| 85 Years and over | 11 (2.4%) | 34 (7.6%) |
| Total | 465 (100.0%) | 448 (100.0%) |
Families and Households in North Haven
Median Family Size in North Haven
The median family size in North Haven is 2.60 persons per family, with married-couple families (244 | 83.9%) accounting for the largest median family size of 2.65 persons per family. On the other hand, single female/mother families (23 | 7.9%) represent the smallest median family size with 2.17 persons per family.
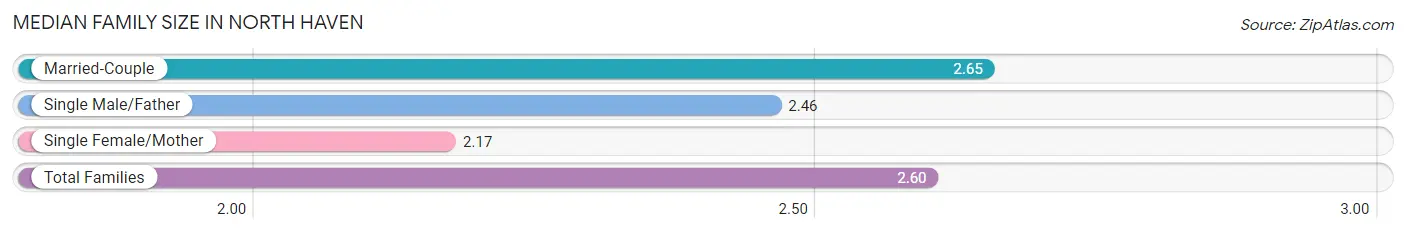
| Family Type | # Families | Family Size |
| Married-Couple | 244 (83.9%) | 2.65 |
| Single Male/Father | 24 (8.3%) | 2.46 |
| Single Female/Mother | 23 (7.9%) | 2.17 |
| Total Families | 291 (100.0%) | 2.60 |
Median Household Size in North Haven
The median household size in North Haven is 2.15 persons per household, with married-couple households (244 | 57.4%) accounting for the largest median household size of 2.66 persons per household. non-family households (134 | 31.5%) represent the smallest median household size with 1.08 persons per household.
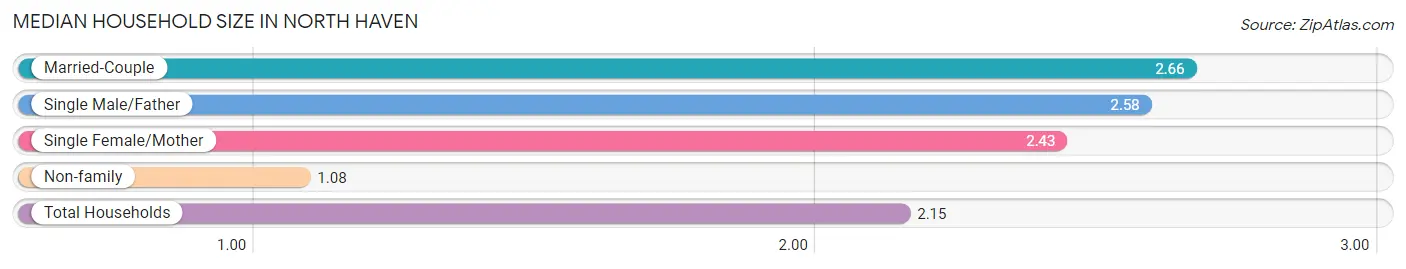
| Household Type | # Households | Household Size |
| Married-Couple | 244 (57.4%) | 2.66 |
| Single Male/Father | 24 (5.7%) | 2.58 |
| Single Female/Mother | 23 (5.4%) | 2.43 |
| Non-family | 134 (31.5%) | 1.08 |
| Total Households | 425 (100.0%) | 2.15 |
Household Size by Marriage Status in North Haven
Out of a total of 425 households in North Haven, 291 (68.5%) are family households, while 134 (31.5%) are nonfamily households. The most numerous type of family households are 2-person households, comprising 194, and the most common type of nonfamily households are 1-person households, comprising 124.
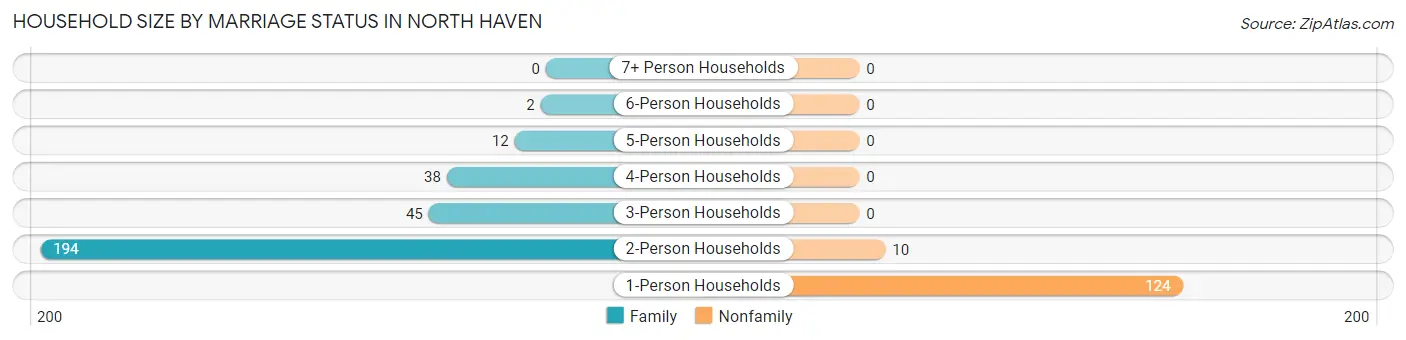
| Household Size | Family Households | Nonfamily Households |
| 1-Person Households | - | 124 (29.2%) |
| 2-Person Households | 194 (45.7%) | 10 (2.4%) |
| 3-Person Households | 45 (10.6%) | 0 (0.0%) |
| 4-Person Households | 38 (8.9%) | 0 (0.0%) |
| 5-Person Households | 12 (2.8%) | 0 (0.0%) |
| 6-Person Households | 2 (0.5%) | 0 (0.0%) |
| 7+ Person Households | 0 (0.0%) | 0 (0.0%) |
| Total | 291 (68.5%) | 134 (31.5%) |
Female Fertility in North Haven
Fertility by Age in North Haven
Average fertility rate in North Haven is 66.0 births per 1,000 women. Women in the age bracket of 20 to 34 years have the highest fertility rate with 188.0 births per 1,000 women. Women in the age bracket of 20 to 34 years acount for 60.0% of all women with births.
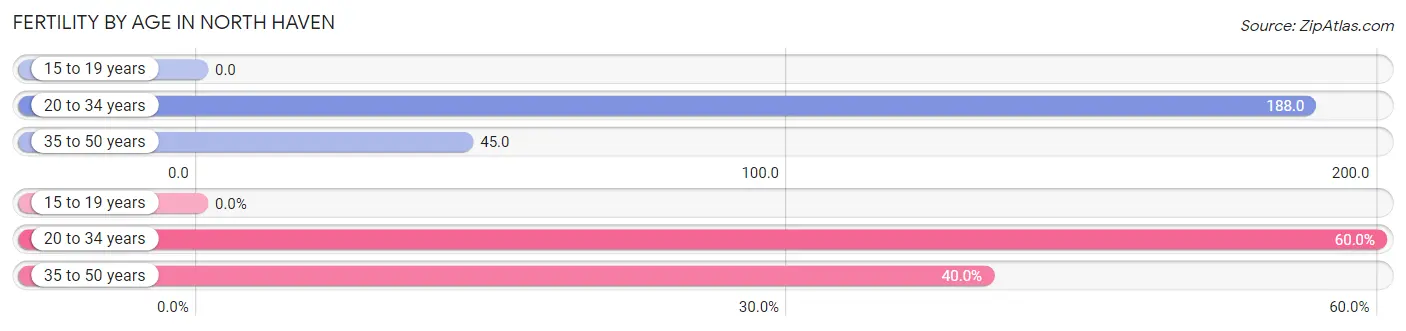
| Age Bracket | Women with Births | Births / 1,000 Women |
| 15 to 19 years | 0 (0.0%) | 0.0 |
| 20 to 34 years | 3 (60.0%) | 188.0 |
| 35 to 50 years | 2 (40.0%) | 45.0 |
| Total | 5 (100.0%) | 66.0 |
Fertility by Age by Marriage Status in North Haven
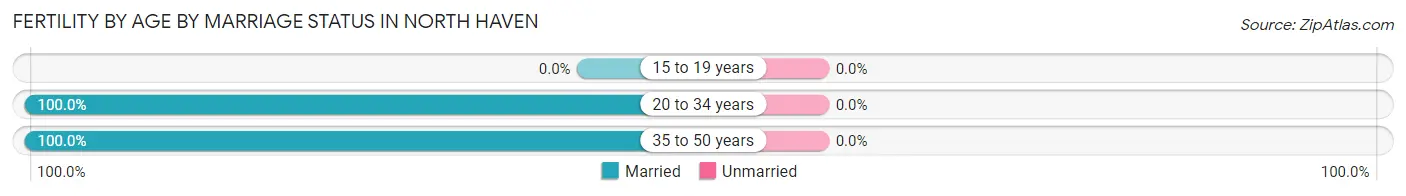
| Age Bracket | Married | Unmarried |
| 15 to 19 years | 0 (0.0%) | 0 (0.0%) |
| 20 to 34 years | 3 (100.0%) | 0 (0.0%) |
| 35 to 50 years | 2 (100.0%) | 0 (0.0%) |
| Total | 5 (100.0%) | 0 (0.0%) |
Fertility by Education in North Haven
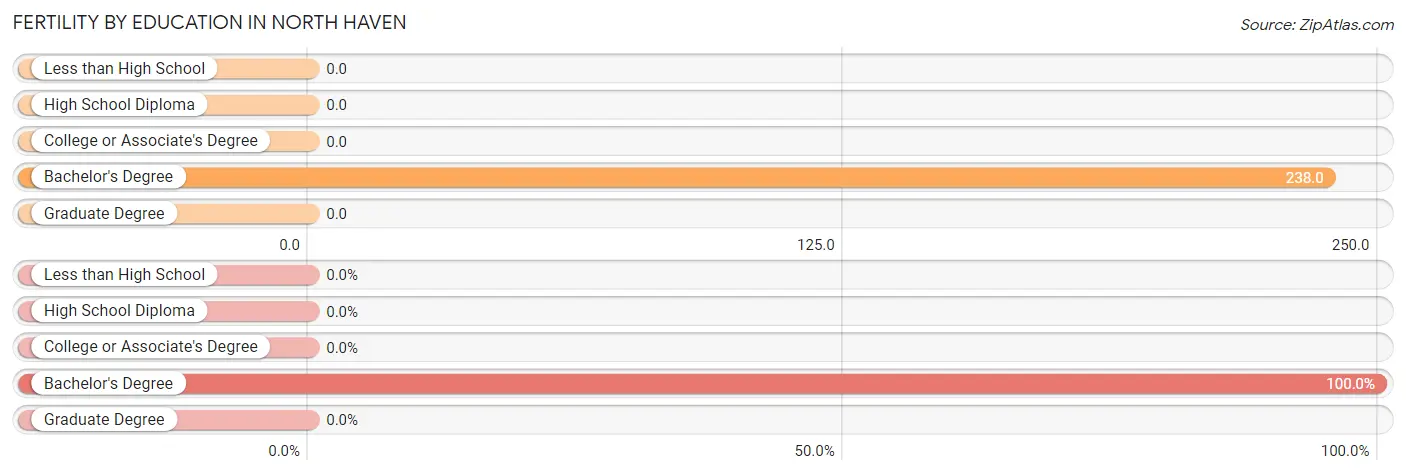
| Educational Attainment | Women with Births | Births / 1,000 Women |
| Less than High School | 0 (0.0%) | 0.0 |
| High School Diploma | 0 (0.0%) | 0.0 |
| College or Associate's Degree | 0 (0.0%) | 0.0 |
| Bachelor's Degree | 5 (100.0%) | 238.0 |
| Graduate Degree | 0 (0.0%) | 0.0 |
| Total | 5 (100.0%) | 66.0 |
Fertility by Education by Marriage Status in North Haven
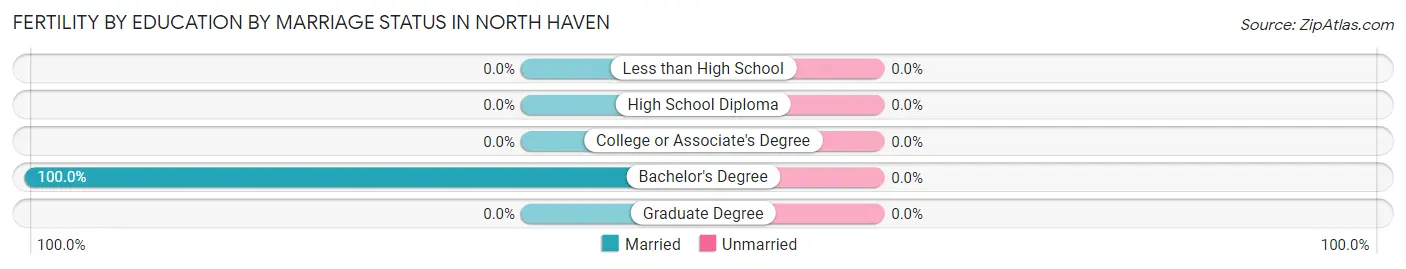
| Educational Attainment | Married | Unmarried |
| Less than High School | 0 (0.0%) | 0 (0.0%) |
| High School Diploma | 0 (0.0%) | 0 (0.0%) |
| College or Associate's Degree | 0 (0.0%) | 0 (0.0%) |
| Bachelor's Degree | 5 (100.0%) | 0 (0.0%) |
| Graduate Degree | 0 (0.0%) | 0 (0.0%) |
| Total | 5 (100.0%) | 0 (0.0%) |
Employment Characteristics in North Haven
Employment by Class of Employer in North Haven
Among the 434 employed individuals in North Haven, private company employees (190 | 43.8%), self-employed (not incorporated) (87 | 20.1%), and local government employees (66 | 15.2%) make up the most common classes of employment.
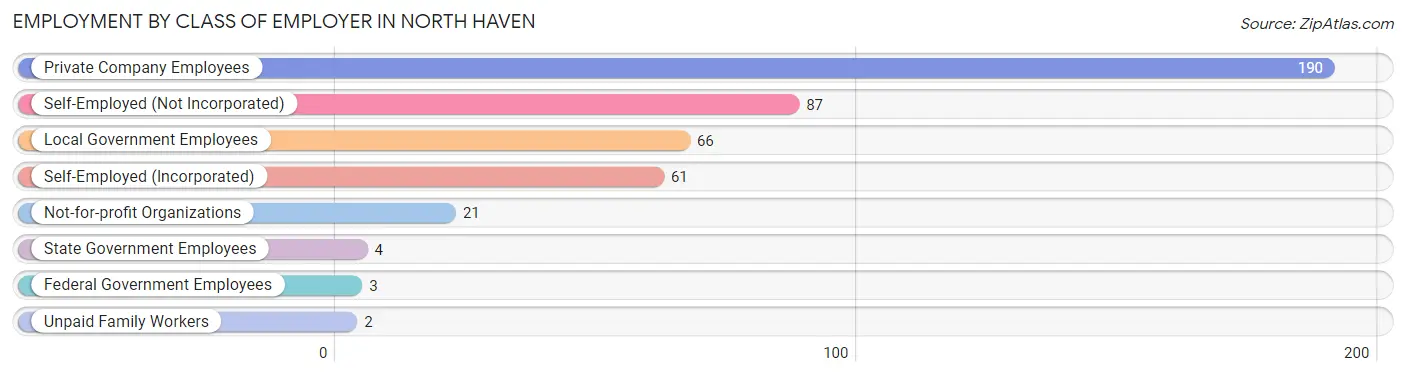
| Employer Class | # Employees | % Employees |
| Private Company Employees | 190 | 43.8% |
| Self-Employed (Incorporated) | 61 | 14.1% |
| Self-Employed (Not Incorporated) | 87 | 20.1% |
| Not-for-profit Organizations | 21 | 4.8% |
| Local Government Employees | 66 | 15.2% |
| State Government Employees | 4 | 0.9% |
| Federal Government Employees | 3 | 0.7% |
| Unpaid Family Workers | 2 | 0.5% |
| Total | 434 | 100.0% |
Employment Status by Age in North Haven
According to the labor force statistics for North Haven, out of the total population over 16 years of age (808), 56.9% or 460 individuals are in the labor force, with 2.6% or 12 of them unemployed. The age group with the highest labor force participation rate is 30 to 34 years, with 100.0% or 16 individuals in the labor force. Within the labor force, the 65 to 74 years age range has the highest percentage of unemployed individuals, with 8.8% or 7 of them being unemployed.
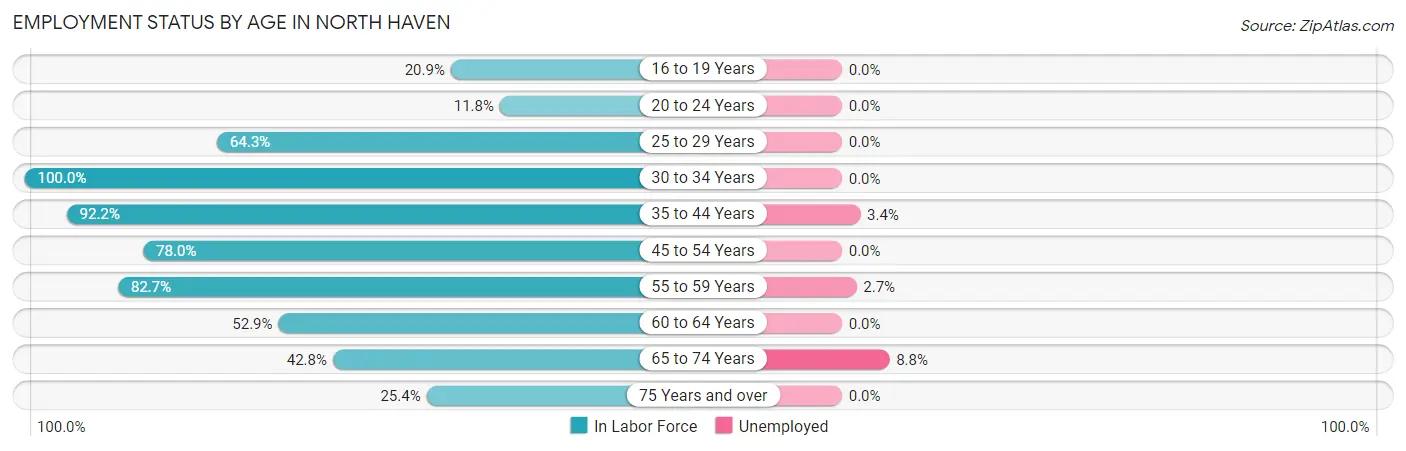
| Age Bracket | In Labor Force | Unemployed |
| 16 to 19 Years | 9 (20.9%) | 0 (0.0%) |
| 20 to 24 Years | 2 (11.8%) | 0 (0.0%) |
| 25 to 29 Years | 9 (64.3%) | 0 (0.0%) |
| 30 to 34 Years | 16 (100.0%) | 0 (0.0%) |
| 35 to 44 Years | 59 (92.2%) | 2 (3.4%) |
| 45 to 54 Years | 92 (78.0%) | 0 (0.0%) |
| 55 to 59 Years | 110 (82.7%) | 3 (2.7%) |
| 60 to 64 Years | 54 (52.9%) | 0 (0.0%) |
| 65 to 74 Years | 80 (42.8%) | 7 (8.8%) |
| 75 Years and over | 29 (25.4%) | 0 (0.0%) |
| Total | 460 (56.9%) | 12 (2.6%) |
Employment Status by Educational Attainment in North Haven
According to labor force statistics for North Haven, 76.1% of individuals (340) out of the total population between 25 and 64 years of age (447) are in the labor force, with 1.5% or 5 of them being unemployed. The group with the highest labor force participation rate are those with the educational attainment of less than high school, with 100.0% or 13 individuals in the labor force. Within the labor force, individuals with college / associate degree education have the highest percentage of unemployment, with 12.5% or 5 of them being unemployed.
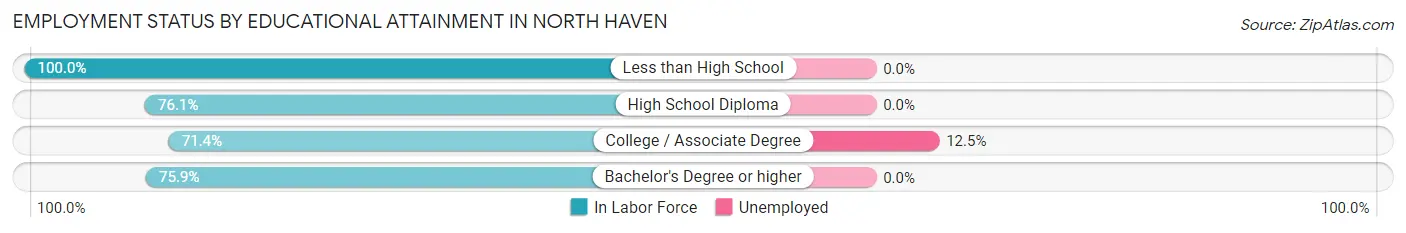
| Educational Attainment | In Labor Force | Unemployed |
| Less than High School | 13 (100.0%) | 0 (0.0%) |
| High School Diploma | 54 (76.1%) | 0 (0.0%) |
| College / Associate Degree | 40 (71.4%) | 7 (12.5%) |
| Bachelor's Degree or higher | 233 (75.9%) | 0 (0.0%) |
| Total | 340 (76.1%) | 7 (1.5%) |
Employment Occupations by Sex in North Haven
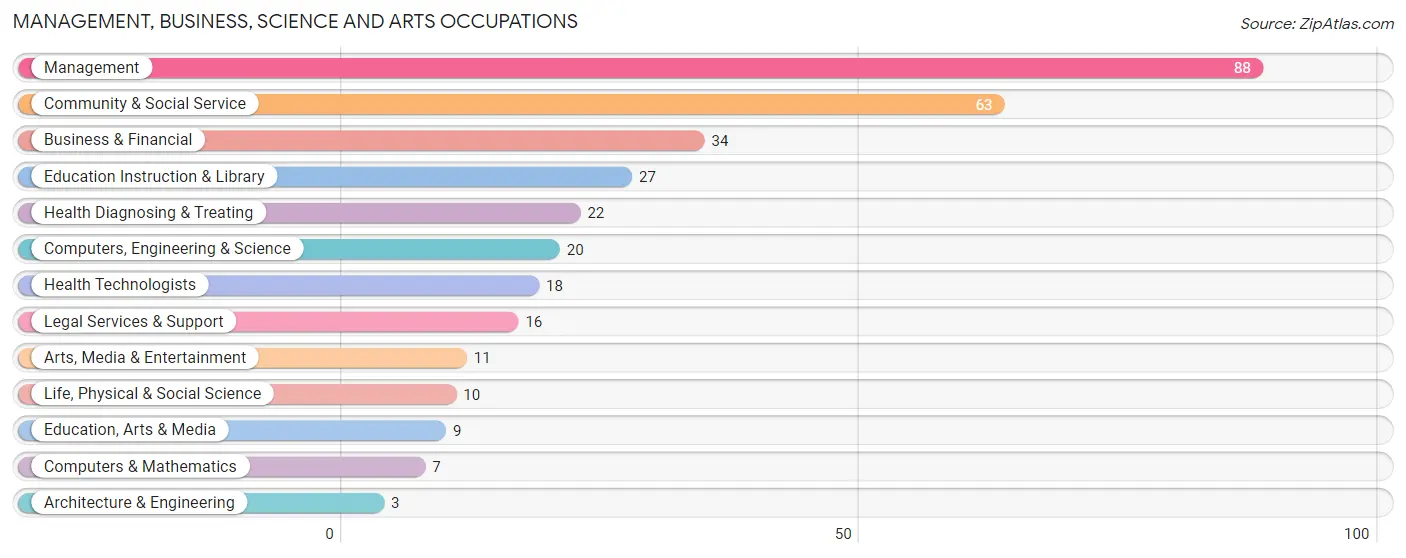
Management, Business, Science and Arts Occupations
The most common Management, Business, Science and Arts occupations in North Haven are Management (88 | 19.6%), Community & Social Service (63 | 14.1%), Business & Financial (34 | 7.6%), Education Instruction & Library (27 | 6.0%), and Health Diagnosing & Treating (22 | 4.9%).
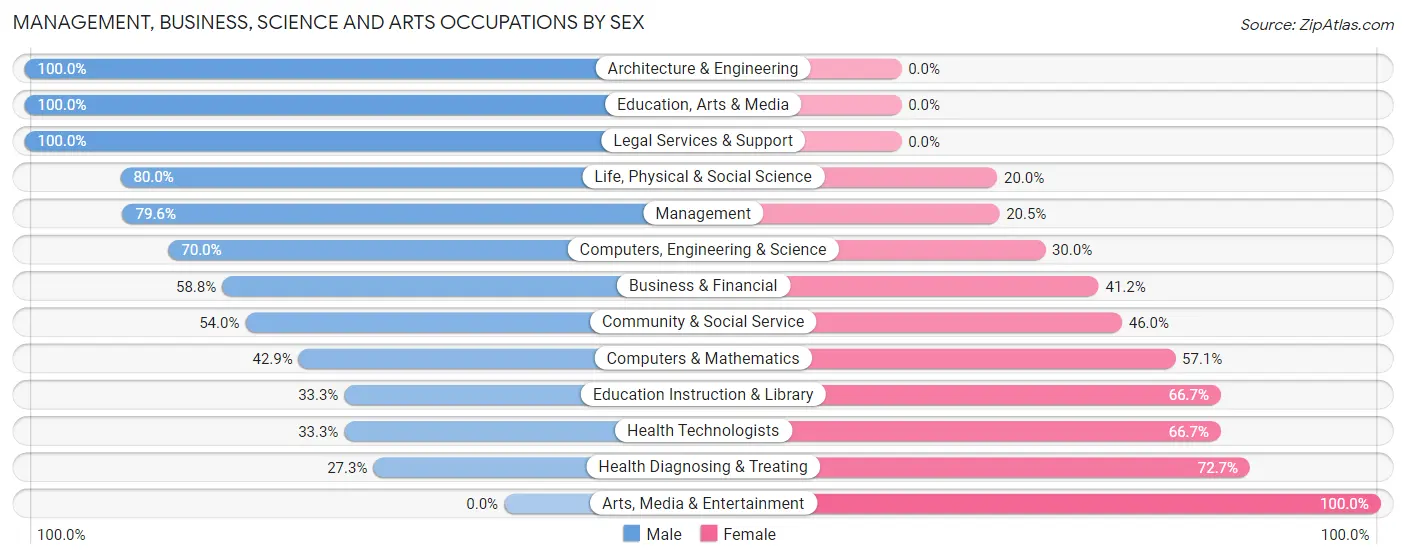
Management, Business, Science and Arts Occupations by Sex
Within the Management, Business, Science and Arts occupations in North Haven, the most male-oriented occupations are Architecture & Engineering (100.0%), Education, Arts & Media (100.0%), and Legal Services & Support (100.0%), while the most female-oriented occupations are Arts, Media & Entertainment (100.0%), Health Diagnosing & Treating (72.7%), and Education Instruction & Library (66.7%).
| Occupation | Male | Female |
| Management | 70 (79.5%) | 18 (20.4%) |
| Business & Financial | 20 (58.8%) | 14 (41.2%) |
| Computers, Engineering & Science | 14 (70.0%) | 6 (30.0%) |
| Computers & Mathematics | 3 (42.9%) | 4 (57.1%) |
| Architecture & Engineering | 3 (100.0%) | 0 (0.0%) |
| Life, Physical & Social Science | 8 (80.0%) | 2 (20.0%) |
| Community & Social Service | 34 (54.0%) | 29 (46.0%) |
| Education, Arts & Media | 9 (100.0%) | 0 (0.0%) |
| Legal Services & Support | 16 (100.0%) | 0 (0.0%) |
| Education Instruction & Library | 9 (33.3%) | 18 (66.7%) |
| Arts, Media & Entertainment | 0 (0.0%) | 11 (100.0%) |
| Health Diagnosing & Treating | 6 (27.3%) | 16 (72.7%) |
| Health Technologists | 6 (33.3%) | 12 (66.7%) |
| Total (Category) | 144 (63.4%) | 83 (36.6%) |
| Total (Overall) | 247 (55.1%) | 201 (44.9%) |
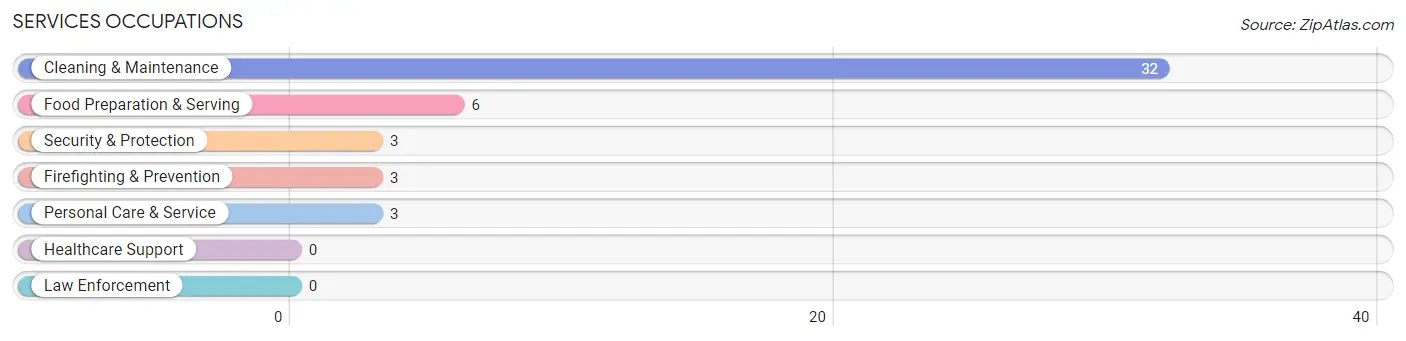
Services Occupations
The most common Services occupations in North Haven are Cleaning & Maintenance (32 | 7.1%), Food Preparation & Serving (6 | 1.3%), Security & Protection (3 | 0.7%), Firefighting & Prevention (3 | 0.7%), and Personal Care & Service (3 | 0.7%).
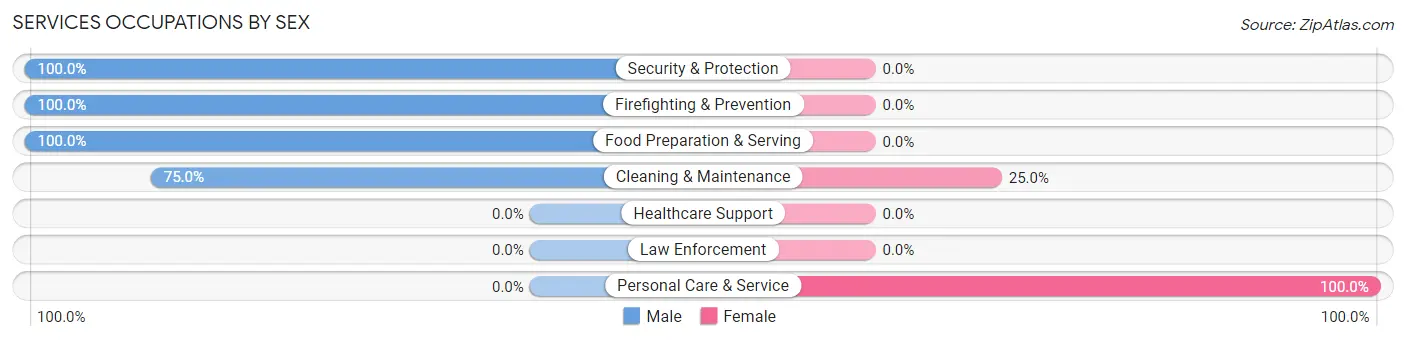
Services Occupations by Sex
Within the Services occupations in North Haven, the most male-oriented occupations are Security & Protection (100.0%), Firefighting & Prevention (100.0%), and Food Preparation & Serving (100.0%), while the most female-oriented occupations are Personal Care & Service (100.0%), and Cleaning & Maintenance (25.0%).
| Occupation | Male | Female |
| Healthcare Support | 0 (0.0%) | 0 (0.0%) |
| Security & Protection | 3 (100.0%) | 0 (0.0%) |
| Firefighting & Prevention | 3 (100.0%) | 0 (0.0%) |
| Law Enforcement | 0 (0.0%) | 0 (0.0%) |
| Food Preparation & Serving | 6 (100.0%) | 0 (0.0%) |
| Cleaning & Maintenance | 24 (75.0%) | 8 (25.0%) |
| Personal Care & Service | 0 (0.0%) | 3 (100.0%) |
| Total (Category) | 33 (75.0%) | 11 (25.0%) |
| Total (Overall) | 247 (55.1%) | 201 (44.9%) |
Sales and Office Occupations
The most common Sales and Office occupations in North Haven are Sales & Related (82 | 18.3%), and Office & Administration (46 | 10.3%).
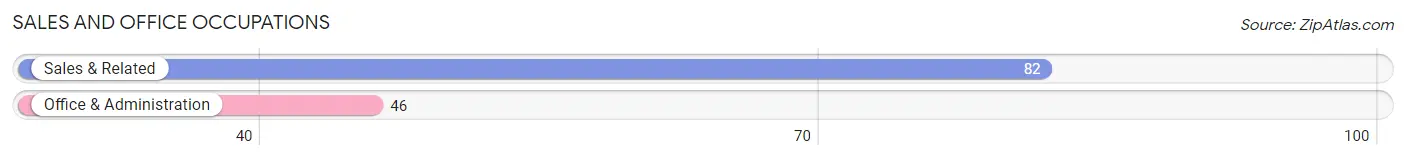
Sales and Office Occupations by Sex
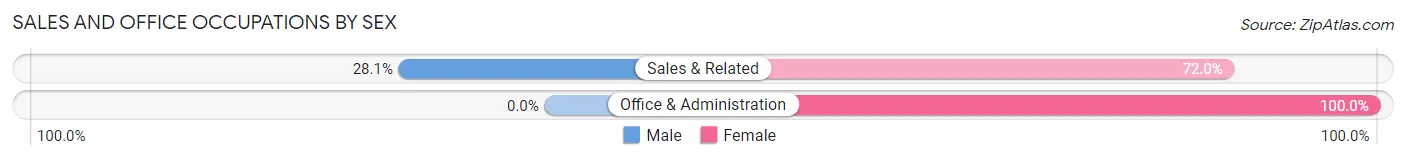
| Occupation | Male | Female |
| Sales & Related | 23 (28.1%) | 59 (72.0%) |
| Office & Administration | 0 (0.0%) | 46 (100.0%) |
| Total (Category) | 23 (18.0%) | 105 (82.0%) |
| Total (Overall) | 247 (55.1%) | 201 (44.9%) |
Natural Resources, Construction and Maintenance Occupations
The most common Natural Resources, Construction and Maintenance occupations in North Haven are Construction & Extraction (25 | 5.6%), Farming, Fishing & Forestry (3 | 0.7%), and Installation, Maintenance & Repair (2 | 0.4%).
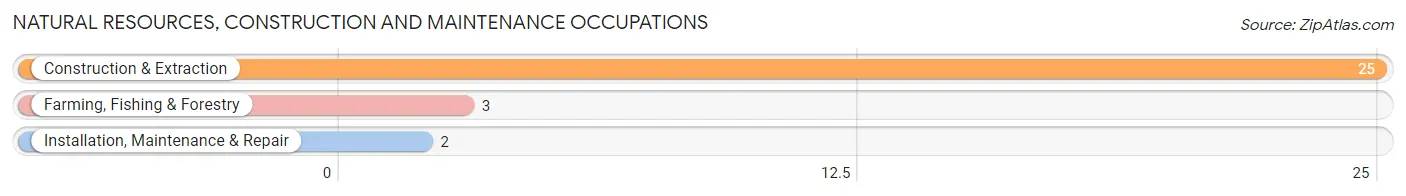
Natural Resources, Construction and Maintenance Occupations by Sex
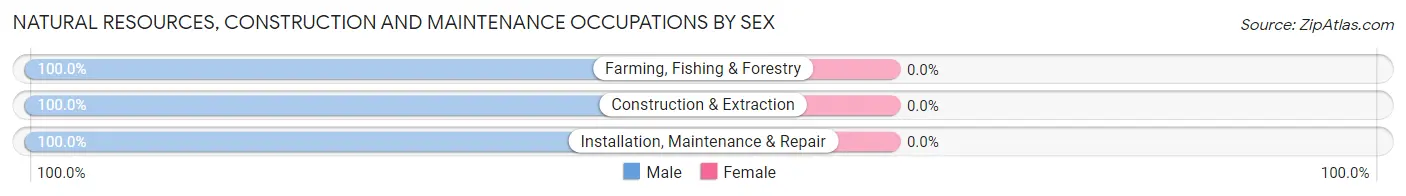
| Occupation | Male | Female |
| Farming, Fishing & Forestry | 3 (100.0%) | 0 (0.0%) |
| Construction & Extraction | 25 (100.0%) | 0 (0.0%) |
| Installation, Maintenance & Repair | 2 (100.0%) | 0 (0.0%) |
| Total (Category) | 30 (100.0%) | 0 (0.0%) |
| Total (Overall) | 247 (55.1%) | 201 (44.9%) |
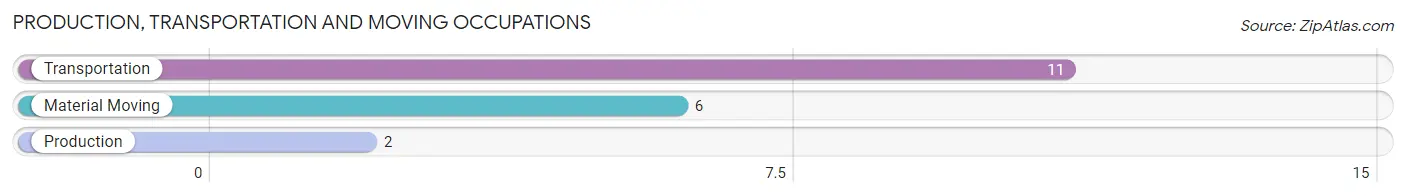
Production, Transportation and Moving Occupations
The most common Production, Transportation and Moving occupations in North Haven are Transportation (11 | 2.5%), Material Moving (6 | 1.3%), and Production (2 | 0.4%).
Production, Transportation and Moving Occupations by Sex
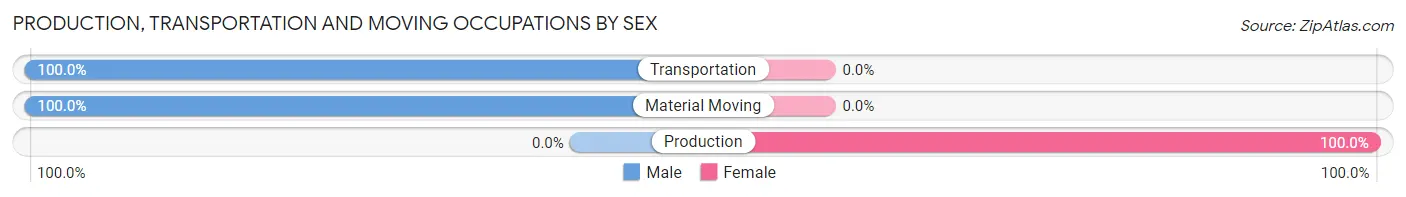
| Occupation | Male | Female |
| Production | 0 (0.0%) | 2 (100.0%) |
| Transportation | 11 (100.0%) | 0 (0.0%) |
| Material Moving | 6 (100.0%) | 0 (0.0%) |
| Total (Category) | 17 (89.5%) | 2 (10.5%) |
| Total (Overall) | 247 (55.1%) | 201 (44.9%) |
Employment Industries by Sex in North Haven
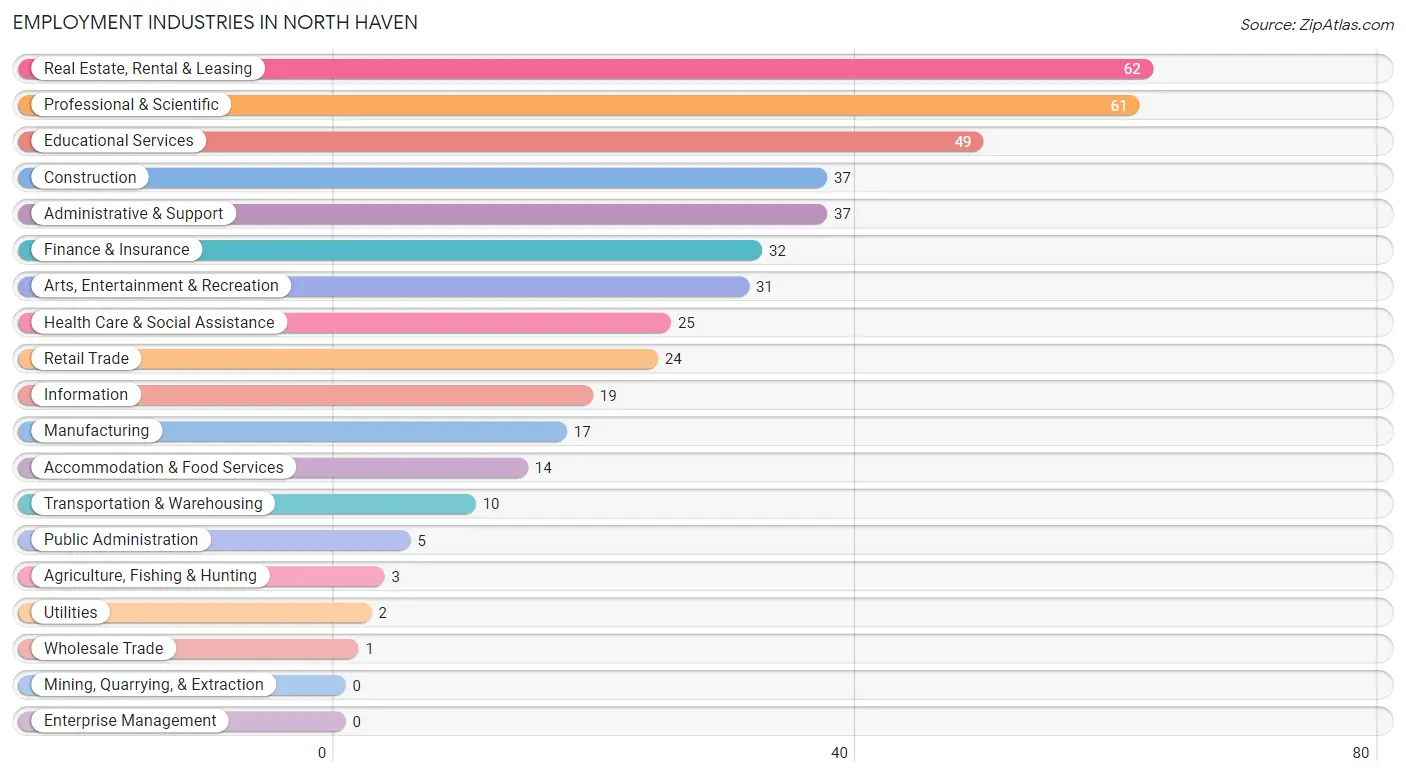
Employment Industries in North Haven
The major employment industries in North Haven include Real Estate, Rental & Leasing (62 | 13.8%), Professional & Scientific (61 | 13.6%), Educational Services (49 | 10.9%), Construction (37 | 8.3%), and Administrative & Support (37 | 8.3%).
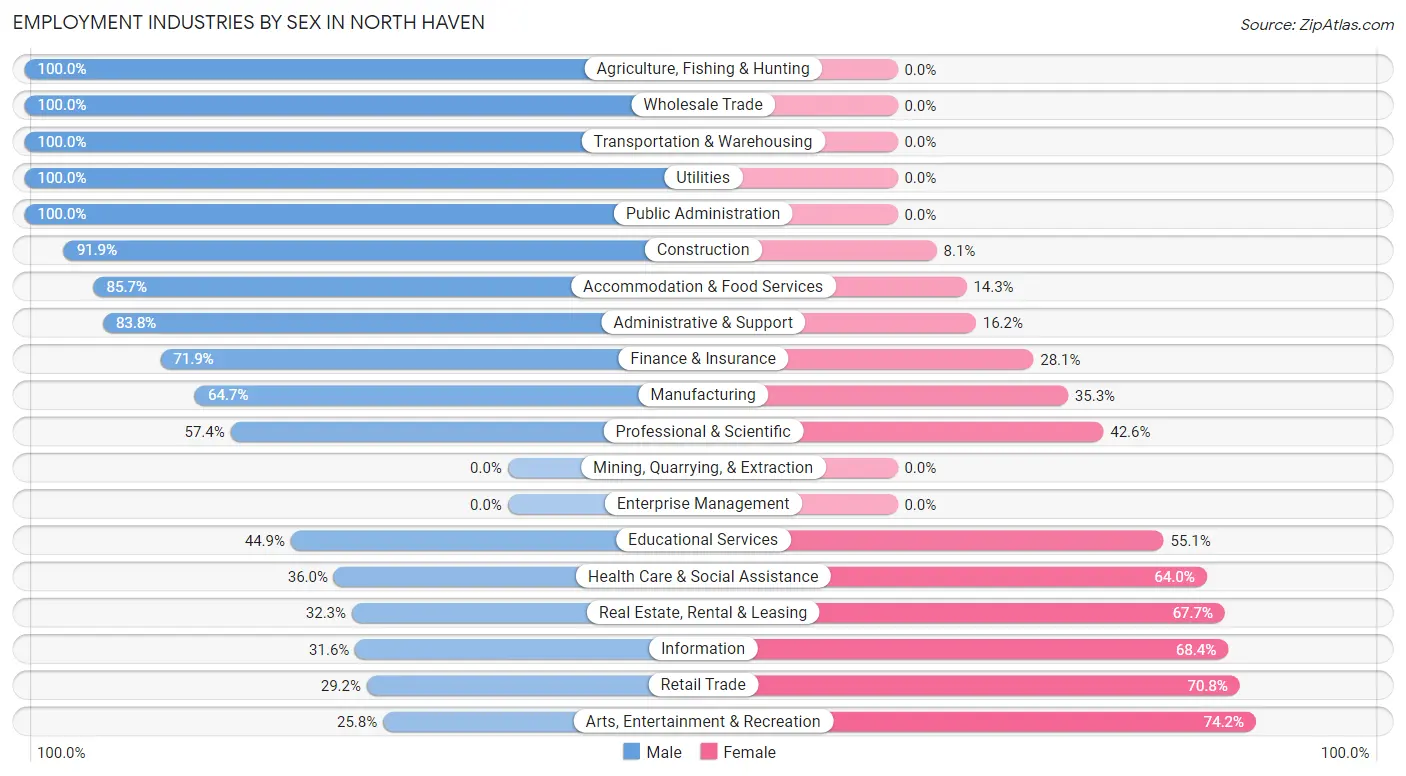
Employment Industries by Sex in North Haven
The North Haven industries that see more men than women are Agriculture, Fishing & Hunting (100.0%), Wholesale Trade (100.0%), and Transportation & Warehousing (100.0%), whereas the industries that tend to have a higher number of women are Arts, Entertainment & Recreation (74.2%), Retail Trade (70.8%), and Information (68.4%).
| Industry | Male | Female |
| Agriculture, Fishing & Hunting | 3 (100.0%) | 0 (0.0%) |
| Mining, Quarrying, & Extraction | 0 (0.0%) | 0 (0.0%) |
| Construction | 34 (91.9%) | 3 (8.1%) |
| Manufacturing | 11 (64.7%) | 6 (35.3%) |
| Wholesale Trade | 1 (100.0%) | 0 (0.0%) |
| Retail Trade | 7 (29.2%) | 17 (70.8%) |
| Transportation & Warehousing | 10 (100.0%) | 0 (0.0%) |
| Utilities | 2 (100.0%) | 0 (0.0%) |
| Information | 6 (31.6%) | 13 (68.4%) |
| Finance & Insurance | 23 (71.9%) | 9 (28.1%) |
| Real Estate, Rental & Leasing | 20 (32.3%) | 42 (67.7%) |
| Professional & Scientific | 35 (57.4%) | 26 (42.6%) |
| Enterprise Management | 0 (0.0%) | 0 (0.0%) |
| Administrative & Support | 31 (83.8%) | 6 (16.2%) |
| Educational Services | 22 (44.9%) | 27 (55.1%) |
| Health Care & Social Assistance | 9 (36.0%) | 16 (64.0%) |
| Arts, Entertainment & Recreation | 8 (25.8%) | 23 (74.2%) |
| Accommodation & Food Services | 12 (85.7%) | 2 (14.3%) |
| Public Administration | 5 (100.0%) | 0 (0.0%) |
| Total | 247 (55.1%) | 201 (44.9%) |
Education in North Haven
School Enrollment in North Haven
The most common levels of schooling among the 143 students in North Haven are high school (37 | 25.9%), middle school (30 | 21.0%), and college / undergraduate (25 | 17.5%).
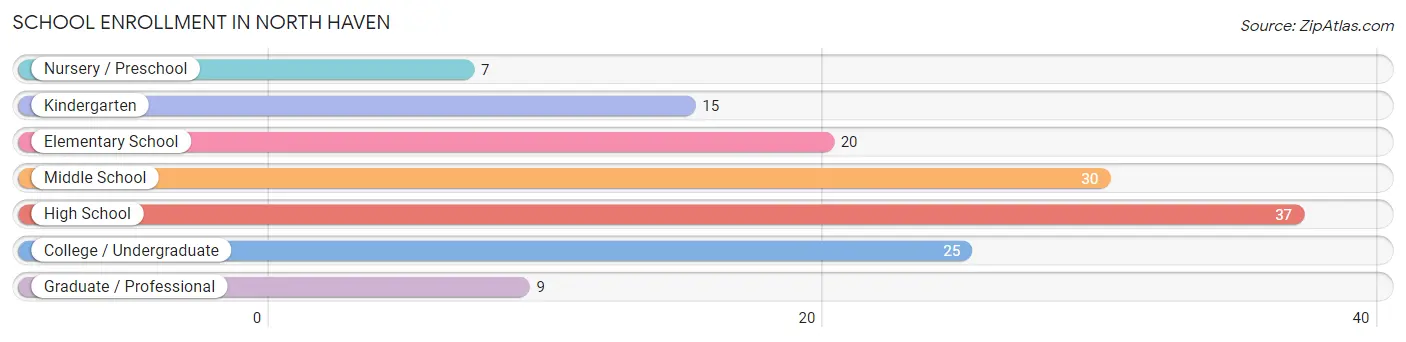
| School Level | # Students | % Students |
| Nursery / Preschool | 7 | 4.9% |
| Kindergarten | 15 | 10.5% |
| Elementary School | 20 | 14.0% |
| Middle School | 30 | 21.0% |
| High School | 37 | 25.9% |
| College / Undergraduate | 25 | 17.5% |
| Graduate / Professional | 9 | 6.3% |
| Total | 143 | 100.0% |
School Enrollment by Age by Funding Source in North Haven
Out of a total of 143 students who are enrolled in schools in North Haven, 24 (16.8%) attend a private institution, while the remaining 119 (83.2%) are enrolled in public schools. The age group of 25 to 34 year olds has the highest likelihood of being enrolled in private schools, with 5 (100.0% in the age bracket) enrolled. Conversely, the age group of 3 to 4 year olds has the lowest likelihood of being enrolled in a private school, with 4 (100.0% in the age bracket) attending a public institution.
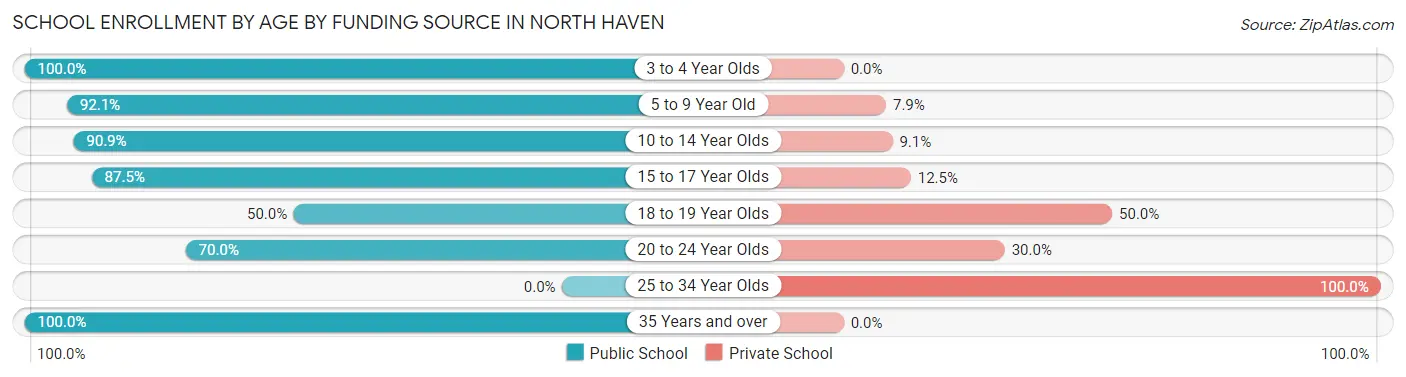
| Age Bracket | Public School | Private School |
| 3 to 4 Year Olds | 4 (100.0%) | 0 (0.0%) |
| 5 to 9 Year Old | 35 (92.1%) | 3 (7.9%) |
| 10 to 14 Year Olds | 30 (90.9%) | 3 (9.1%) |
| 15 to 17 Year Olds | 21 (87.5%) | 3 (12.5%) |
| 18 to 19 Year Olds | 7 (50.0%) | 7 (50.0%) |
| 20 to 24 Year Olds | 7 (70.0%) | 3 (30.0%) |
| 25 to 34 Year Olds | 0 (0.0%) | 5 (100.0%) |
| 35 Years and over | 15 (100.0%) | 0 (0.0%) |
| Total | 119 (83.2%) | 24 (16.8%) |
Educational Attainment by Field of Study in North Haven
Business (107 | 20.1%), social sciences (71 | 13.4%), liberal arts & history (51 | 9.6%), education (48 | 9.0%), and literature & languages (42 | 7.9%) are the most common fields of study among 532 individuals in North Haven who have obtained a bachelor's degree or higher.
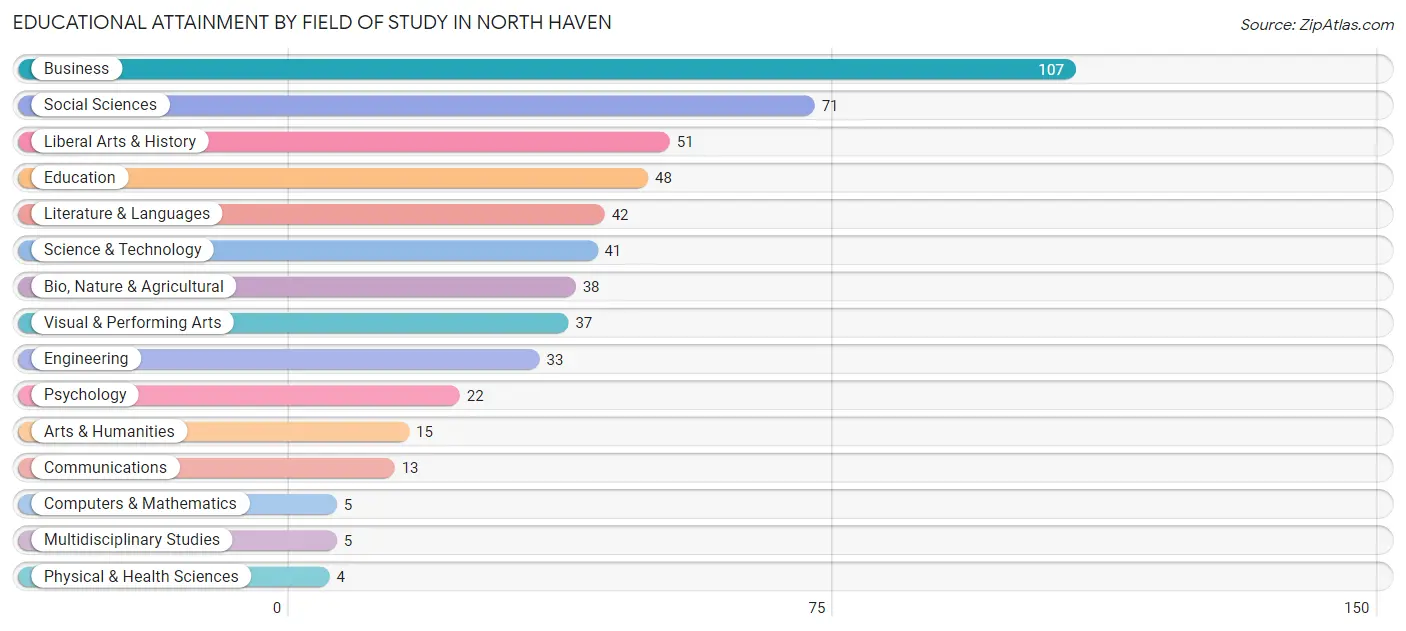
| Field of Study | # Graduates | % Graduates |
| Computers & Mathematics | 5 | 0.9% |
| Bio, Nature & Agricultural | 38 | 7.1% |
| Physical & Health Sciences | 4 | 0.7% |
| Psychology | 22 | 4.1% |
| Social Sciences | 71 | 13.4% |
| Engineering | 33 | 6.2% |
| Multidisciplinary Studies | 5 | 0.9% |
| Science & Technology | 41 | 7.7% |
| Business | 107 | 20.1% |
| Education | 48 | 9.0% |
| Literature & Languages | 42 | 7.9% |
| Liberal Arts & History | 51 | 9.6% |
| Visual & Performing Arts | 37 | 7.0% |
| Communications | 13 | 2.4% |
| Arts & Humanities | 15 | 2.8% |
| Total | 532 | 100.0% |
Transportation & Commute in North Haven
Vehicle Availability by Sex in North Haven
The most prevalent vehicle ownership categories in North Haven are males with 2 vehicles (110, accounting for 46.4%) and females with 2 vehicles (84, making up 55.8%).
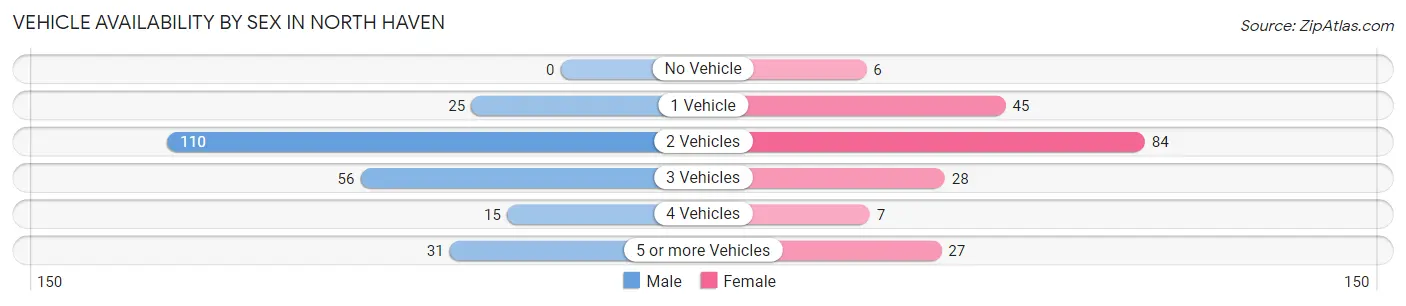
| Vehicles Available | Male | Female |
| No Vehicle | 0 (0.0%) | 6 (3.0%) |
| 1 Vehicle | 25 (10.5%) | 45 (22.8%) |
| 2 Vehicles | 110 (46.4%) | 84 (42.6%) |
| 3 Vehicles | 56 (23.6%) | 28 (14.2%) |
| 4 Vehicles | 15 (6.3%) | 7 (3.5%) |
| 5 or more Vehicles | 31 (13.1%) | 27 (13.7%) |
| Total | 237 (100.0%) | 197 (100.0%) |
Commute Time in North Haven
The most frequently occuring commute durations in North Haven are 20 to 24 minutes (95 commuters, 28.9%), 15 to 19 minutes (51 commuters, 15.5%), and 30 to 34 minutes (44 commuters, 13.4%).
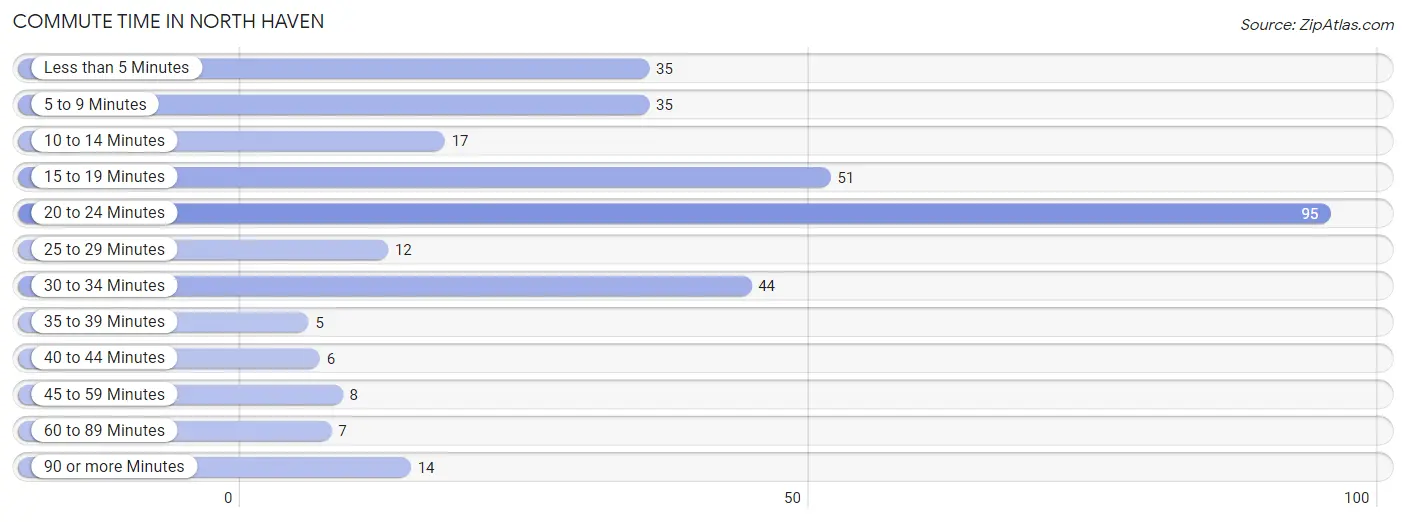
| Commute Time | # Commuters | % Commuters |
| Less than 5 Minutes | 35 | 10.6% |
| 5 to 9 Minutes | 35 | 10.6% |
| 10 to 14 Minutes | 17 | 5.2% |
| 15 to 19 Minutes | 51 | 15.5% |
| 20 to 24 Minutes | 95 | 28.9% |
| 25 to 29 Minutes | 12 | 3.6% |
| 30 to 34 Minutes | 44 | 13.4% |
| 35 to 39 Minutes | 5 | 1.5% |
| 40 to 44 Minutes | 6 | 1.8% |
| 45 to 59 Minutes | 8 | 2.4% |
| 60 to 89 Minutes | 7 | 2.1% |
| 90 or more Minutes | 14 | 4.3% |
Commute Time by Sex in North Haven
The most common commute times in North Haven are 20 to 24 minutes (39 commuters, 22.8%) for males and 20 to 24 minutes (56 commuters, 35.4%) for females.
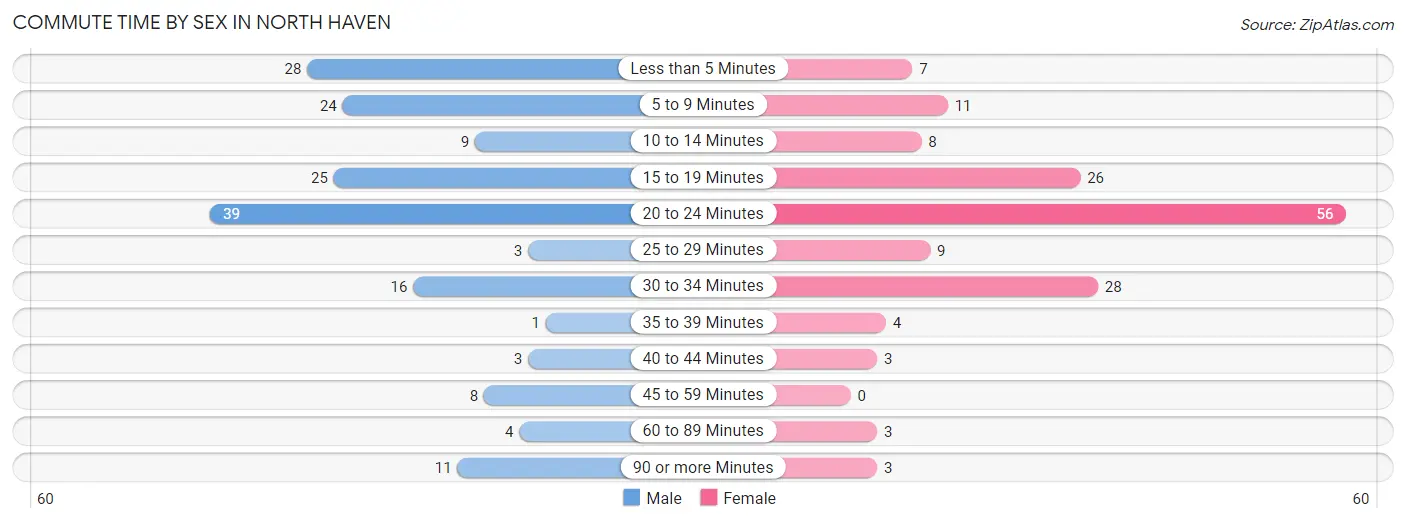
| Commute Time | Male | Female |
| Less than 5 Minutes | 28 (16.4%) | 7 (4.4%) |
| 5 to 9 Minutes | 24 (14.0%) | 11 (7.0%) |
| 10 to 14 Minutes | 9 (5.3%) | 8 (5.1%) |
| 15 to 19 Minutes | 25 (14.6%) | 26 (16.5%) |
| 20 to 24 Minutes | 39 (22.8%) | 56 (35.4%) |
| 25 to 29 Minutes | 3 (1.8%) | 9 (5.7%) |
| 30 to 34 Minutes | 16 (9.4%) | 28 (17.7%) |
| 35 to 39 Minutes | 1 (0.6%) | 4 (2.5%) |
| 40 to 44 Minutes | 3 (1.8%) | 3 (1.9%) |
| 45 to 59 Minutes | 8 (4.7%) | 0 (0.0%) |
| 60 to 89 Minutes | 4 (2.3%) | 3 (1.9%) |
| 90 or more Minutes | 11 (6.4%) | 3 (1.9%) |
Time of Departure to Work by Sex in North Haven
The most frequent times of departure to work in North Haven are 9:00 AM to 9:59 AM (44, 25.7%) for males and 9:00 AM to 9:59 AM (69, 43.7%) for females.
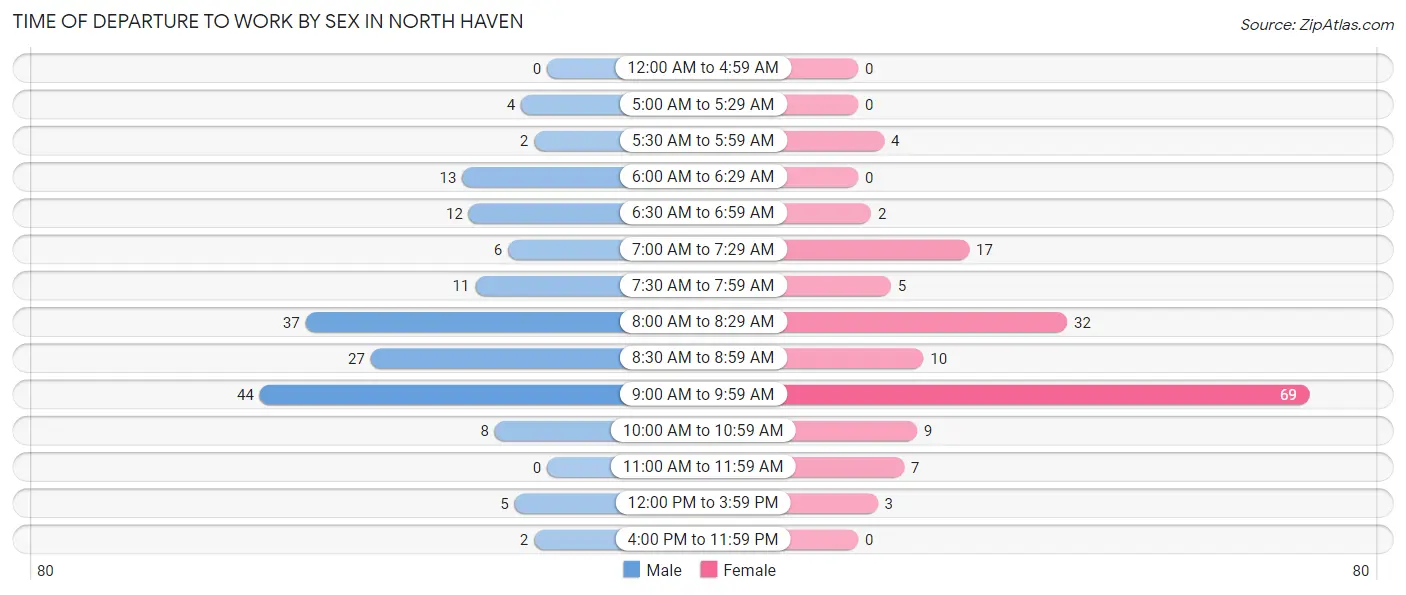
| Time of Departure | Male | Female |
| 12:00 AM to 4:59 AM | 0 (0.0%) | 0 (0.0%) |
| 5:00 AM to 5:29 AM | 4 (2.3%) | 0 (0.0%) |
| 5:30 AM to 5:59 AM | 2 (1.2%) | 4 (2.5%) |
| 6:00 AM to 6:29 AM | 13 (7.6%) | 0 (0.0%) |
| 6:30 AM to 6:59 AM | 12 (7.0%) | 2 (1.3%) |
| 7:00 AM to 7:29 AM | 6 (3.5%) | 17 (10.8%) |
| 7:30 AM to 7:59 AM | 11 (6.4%) | 5 (3.2%) |
| 8:00 AM to 8:29 AM | 37 (21.6%) | 32 (20.3%) |
| 8:30 AM to 8:59 AM | 27 (15.8%) | 10 (6.3%) |
| 9:00 AM to 9:59 AM | 44 (25.7%) | 69 (43.7%) |
| 10:00 AM to 10:59 AM | 8 (4.7%) | 9 (5.7%) |
| 11:00 AM to 11:59 AM | 0 (0.0%) | 7 (4.4%) |
| 12:00 PM to 3:59 PM | 5 (2.9%) | 3 (1.9%) |
| 4:00 PM to 11:59 PM | 2 (1.2%) | 0 (0.0%) |
| Total | 171 (100.0%) | 158 (100.0%) |
Housing Occupancy in North Haven
Occupancy by Ownership in North Haven
Of the total 425 dwellings in North Haven, owner-occupied units account for 404 (95.1%), while renter-occupied units make up 21 (4.9%).
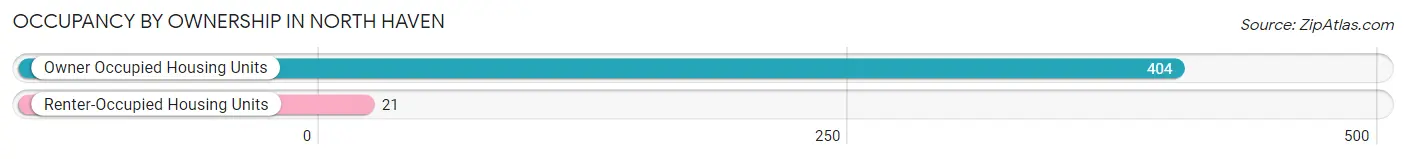
| Occupancy | # Housing Units | % Housing Units |
| Owner Occupied Housing Units | 404 | 95.1% |
| Renter-Occupied Housing Units | 21 | 4.9% |
| Total Occupied Housing Units | 425 | 100.0% |
Occupancy by Household Size in North Haven
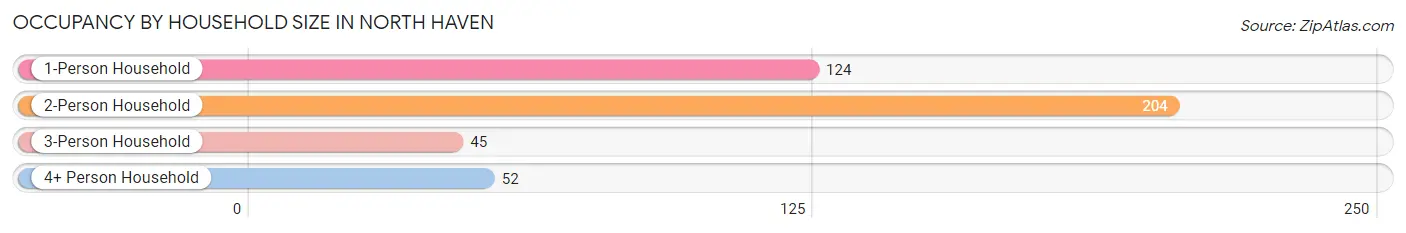
| Household Size | # Housing Units | % Housing Units |
| 1-Person Household | 124 | 29.2% |
| 2-Person Household | 204 | 48.0% |
| 3-Person Household | 45 | 10.6% |
| 4+ Person Household | 52 | 12.2% |
| Total Housing Units | 425 | 100.0% |
Occupancy by Ownership by Household Size in North Haven
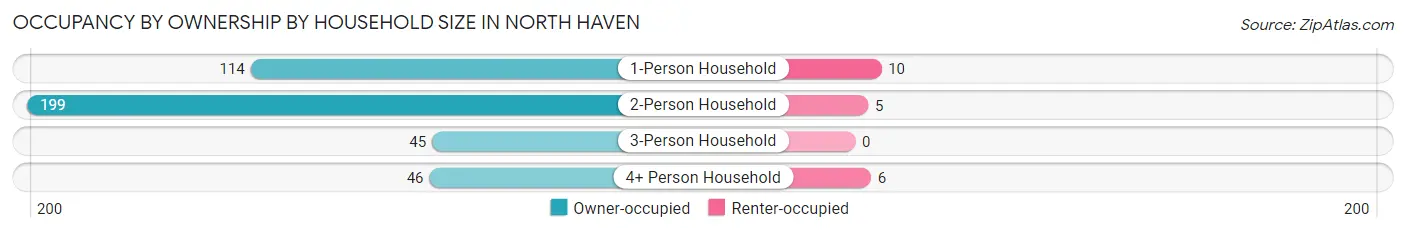
| Household Size | Owner-occupied | Renter-occupied |
| 1-Person Household | 114 (91.9%) | 10 (8.1%) |
| 2-Person Household | 199 (97.6%) | 5 (2.5%) |
| 3-Person Household | 45 (100.0%) | 0 (0.0%) |
| 4+ Person Household | 46 (88.5%) | 6 (11.5%) |
| Total Housing Units | 404 (95.1%) | 21 (4.9%) |
Occupancy by Educational Attainment in North Haven
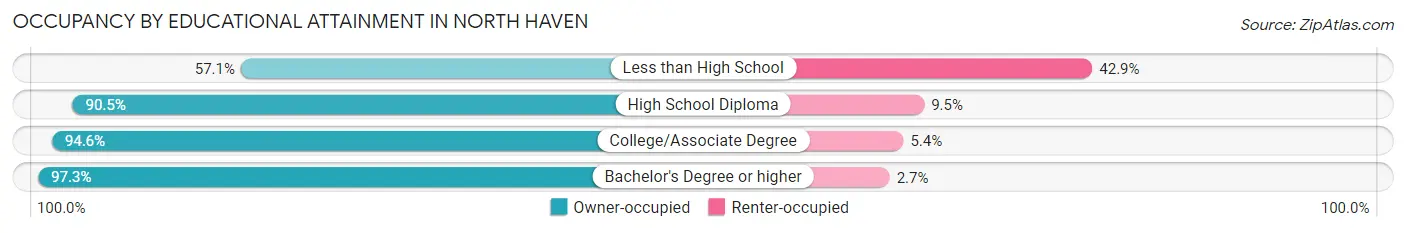
| Household Size | Owner-occupied | Renter-occupied |
| Less than High School | 4 (57.1%) | 3 (42.9%) |
| High School Diploma | 76 (90.5%) | 8 (9.5%) |
| College/Associate Degree | 35 (94.6%) | 2 (5.4%) |
| Bachelor's Degree or higher | 289 (97.3%) | 8 (2.7%) |
Occupancy by Age of Householder in North Haven
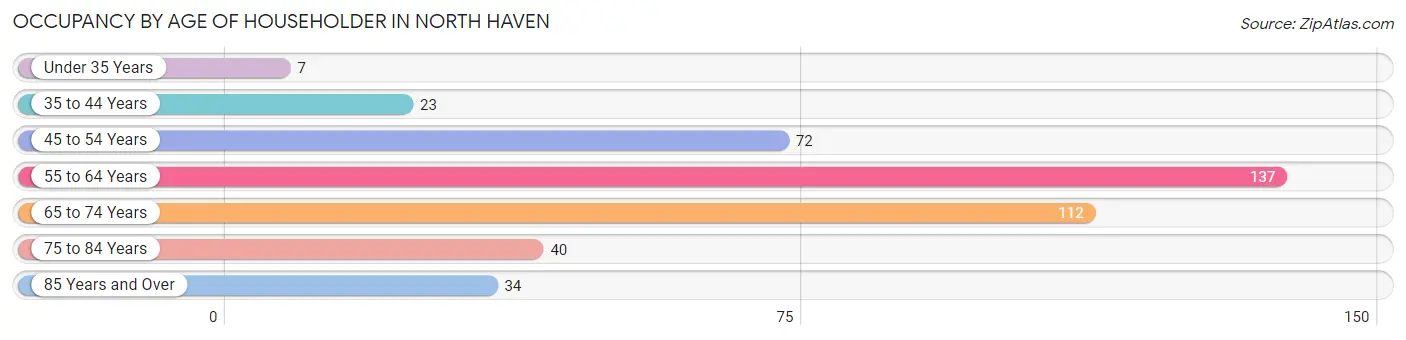
| Age Bracket | # Households | % Households |
| Under 35 Years | 7 | 1.7% |
| 35 to 44 Years | 23 | 5.4% |
| 45 to 54 Years | 72 | 16.9% |
| 55 to 64 Years | 137 | 32.2% |
| 65 to 74 Years | 112 | 26.4% |
| 75 to 84 Years | 40 | 9.4% |
| 85 Years and Over | 34 | 8.0% |
| Total | 425 | 100.0% |
Housing Finances in North Haven
Median Income by Occupancy in North Haven
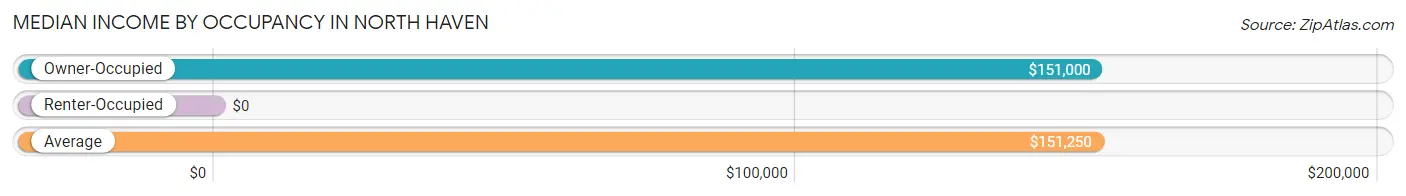
| Occupancy Type | # Households | Median Income |
| Owner-Occupied | 404 (95.1%) | $151,000 |
| Renter-Occupied | 21 (4.9%) | $0 |
| Average | 425 (100.0%) | $151,250 |
Occupancy by Householder Income Bracket in North Haven
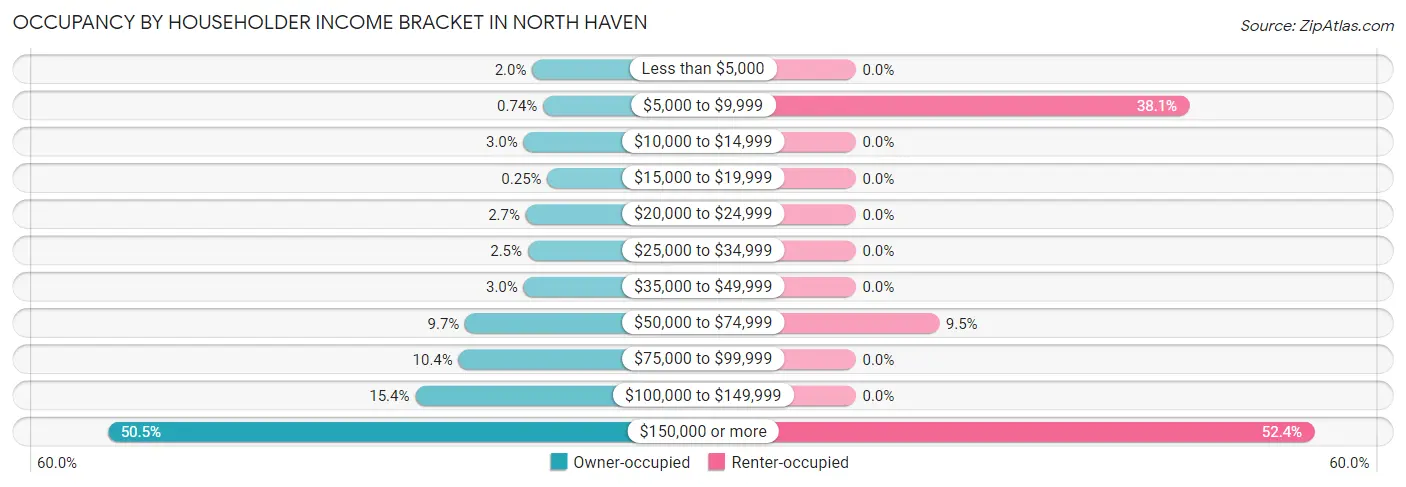
| Income Bracket | Owner-occupied | Renter-occupied |
| Less than $5,000 | 8 (2.0%) | 0 (0.0%) |
| $5,000 to $9,999 | 3 (0.7%) | 8 (38.1%) |
| $10,000 to $14,999 | 12 (3.0%) | 0 (0.0%) |
| $15,000 to $19,999 | 1 (0.3%) | 0 (0.0%) |
| $20,000 to $24,999 | 11 (2.7%) | 0 (0.0%) |
| $25,000 to $34,999 | 10 (2.5%) | 0 (0.0%) |
| $35,000 to $49,999 | 12 (3.0%) | 0 (0.0%) |
| $50,000 to $74,999 | 39 (9.7%) | 2 (9.5%) |
| $75,000 to $99,999 | 42 (10.4%) | 0 (0.0%) |
| $100,000 to $149,999 | 62 (15.3%) | 0 (0.0%) |
| $150,000 or more | 204 (50.5%) | 11 (52.4%) |
| Total | 404 (100.0%) | 21 (100.0%) |
Monthly Housing Cost Tiers in North Haven
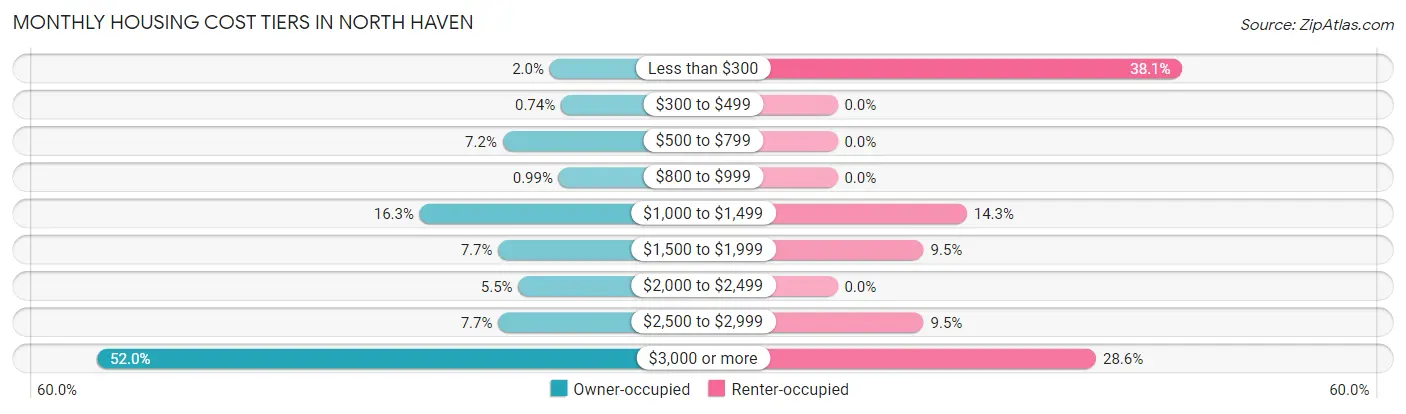
| Monthly Cost | Owner-occupied | Renter-occupied |
| Less than $300 | 8 (2.0%) | 8 (38.1%) |
| $300 to $499 | 3 (0.7%) | 0 (0.0%) |
| $500 to $799 | 29 (7.2%) | 0 (0.0%) |
| $800 to $999 | 4 (1.0%) | 0 (0.0%) |
| $1,000 to $1,499 | 66 (16.3%) | 3 (14.3%) |
| $1,500 to $1,999 | 31 (7.7%) | 2 (9.5%) |
| $2,000 to $2,499 | 22 (5.4%) | 0 (0.0%) |
| $2,500 to $2,999 | 31 (7.7%) | 2 (9.5%) |
| $3,000 or more | 210 (52.0%) | 6 (28.6%) |
| Total | 404 (100.0%) | 21 (100.0%) |
Physical Housing Characteristics in North Haven
Housing Structures in North Haven
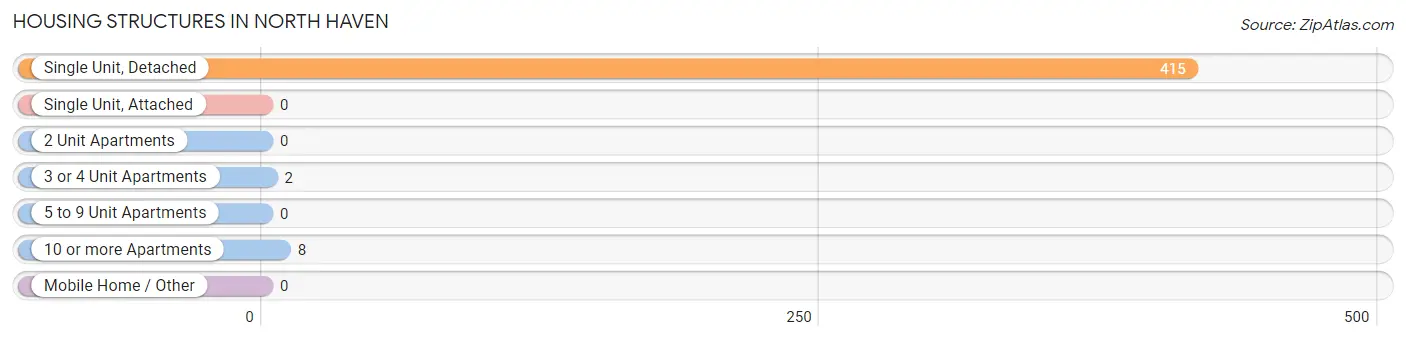
| Structure Type | # Housing Units | % Housing Units |
| Single Unit, Detached | 415 | 97.7% |
| Single Unit, Attached | 0 | 0.0% |
| 2 Unit Apartments | 0 | 0.0% |
| 3 or 4 Unit Apartments | 2 | 0.5% |
| 5 to 9 Unit Apartments | 0 | 0.0% |
| 10 or more Apartments | 8 | 1.9% |
| Mobile Home / Other | 0 | 0.0% |
| Total | 425 | 100.0% |
Housing Structures by Occupancy in North Haven
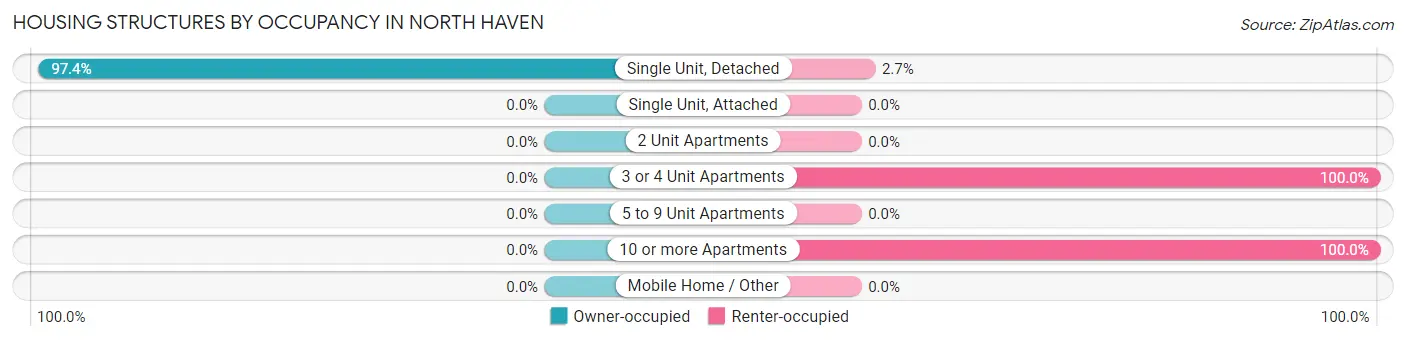
| Structure Type | Owner-occupied | Renter-occupied |
| Single Unit, Detached | 404 (97.4%) | 11 (2.6%) |
| Single Unit, Attached | 0 (0.0%) | 0 (0.0%) |
| 2 Unit Apartments | 0 (0.0%) | 0 (0.0%) |
| 3 or 4 Unit Apartments | 0 (0.0%) | 2 (100.0%) |
| 5 to 9 Unit Apartments | 0 (0.0%) | 0 (0.0%) |
| 10 or more Apartments | 0 (0.0%) | 8 (100.0%) |
| Mobile Home / Other | 0 (0.0%) | 0 (0.0%) |
| Total | 404 (95.1%) | 21 (4.9%) |
Housing Structures by Number of Rooms in North Haven
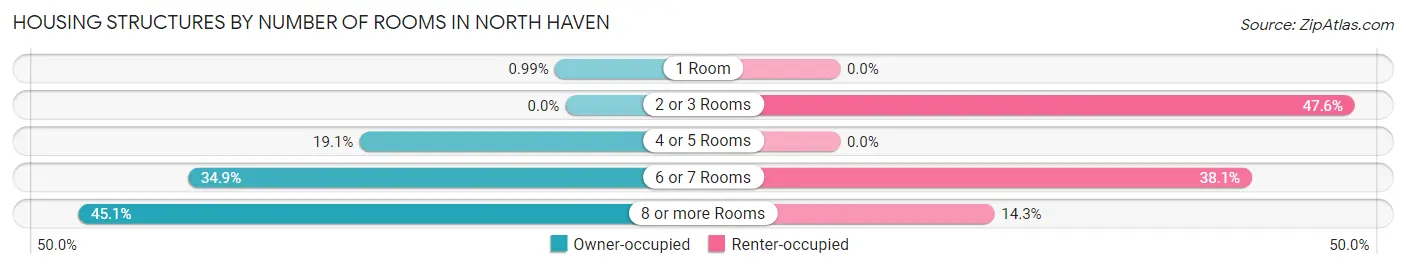
| Number of Rooms | Owner-occupied | Renter-occupied |
| 1 Room | 4 (1.0%) | 0 (0.0%) |
| 2 or 3 Rooms | 0 (0.0%) | 10 (47.6%) |
| 4 or 5 Rooms | 77 (19.1%) | 0 (0.0%) |
| 6 or 7 Rooms | 141 (34.9%) | 8 (38.1%) |
| 8 or more Rooms | 182 (45.1%) | 3 (14.3%) |
| Total | 404 (100.0%) | 21 (100.0%) |
Housing Structure by Heating Type in North Haven
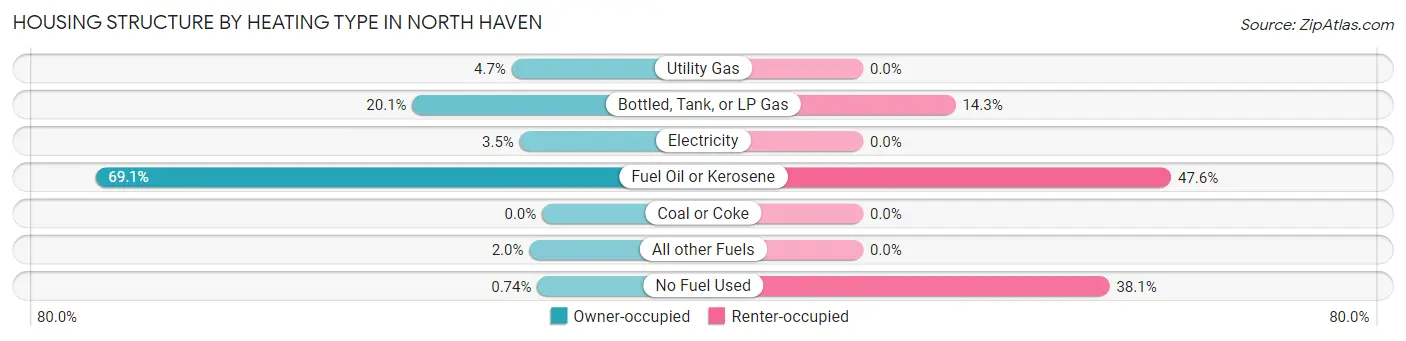
| Heating Type | Owner-occupied | Renter-occupied |
| Utility Gas | 19 (4.7%) | 0 (0.0%) |
| Bottled, Tank, or LP Gas | 81 (20.1%) | 3 (14.3%) |
| Electricity | 14 (3.5%) | 0 (0.0%) |
| Fuel Oil or Kerosene | 279 (69.1%) | 10 (47.6%) |
| Coal or Coke | 0 (0.0%) | 0 (0.0%) |
| All other Fuels | 8 (2.0%) | 0 (0.0%) |
| No Fuel Used | 3 (0.7%) | 8 (38.1%) |
| Total | 404 (100.0%) | 21 (100.0%) |
Household Vehicle Usage in North Haven
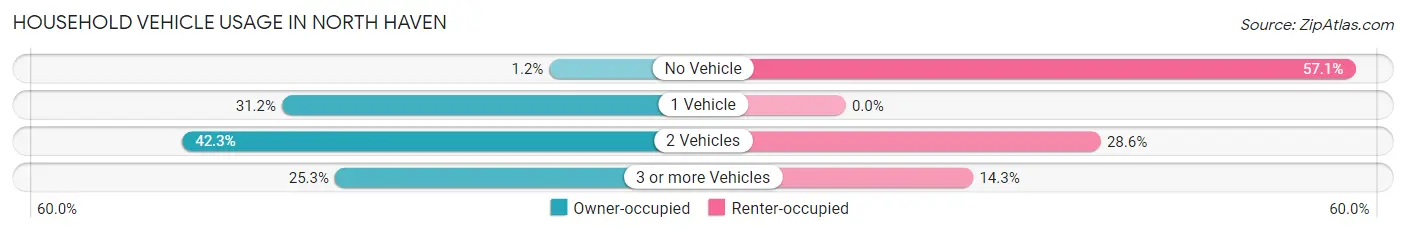
| Vehicles per Household | Owner-occupied | Renter-occupied |
| No Vehicle | 5 (1.2%) | 12 (57.1%) |
| 1 Vehicle | 126 (31.2%) | 0 (0.0%) |
| 2 Vehicles | 171 (42.3%) | 6 (28.6%) |
| 3 or more Vehicles | 102 (25.3%) | 3 (14.3%) |
| Total | 404 (100.0%) | 21 (100.0%) |
Real Estate & Mortgages in North Haven
Real Estate and Mortgage Overview in North Haven
| Characteristic | Without Mortgage | With Mortgage |
| Housing Units | 192 | 212 |
| Median Property Value | $1,116,300 | $1,812,500 |
| Median Household Income | $133,333 | $128 |
| Monthly Housing Costs | $1,371 | $174 |
| Real Estate Taxes | $7,000 | $4 |
Property Value by Mortgage Status in North Haven
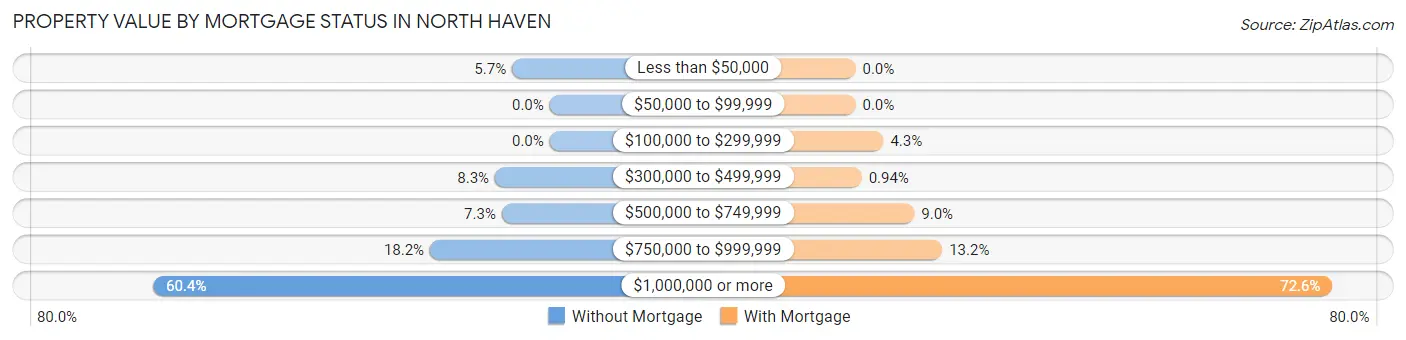
| Property Value | Without Mortgage | With Mortgage |
| Less than $50,000 | 11 (5.7%) | 0 (0.0%) |
| $50,000 to $99,999 | 0 (0.0%) | 0 (0.0%) |
| $100,000 to $299,999 | 0 (0.0%) | 9 (4.3%) |
| $300,000 to $499,999 | 16 (8.3%) | 2 (0.9%) |
| $500,000 to $749,999 | 14 (7.3%) | 19 (9.0%) |
| $750,000 to $999,999 | 35 (18.2%) | 28 (13.2%) |
| $1,000,000 or more | 116 (60.4%) | 154 (72.6%) |
| Total | 192 (100.0%) | 212 (100.0%) |
Household Income by Mortgage Status in North Haven
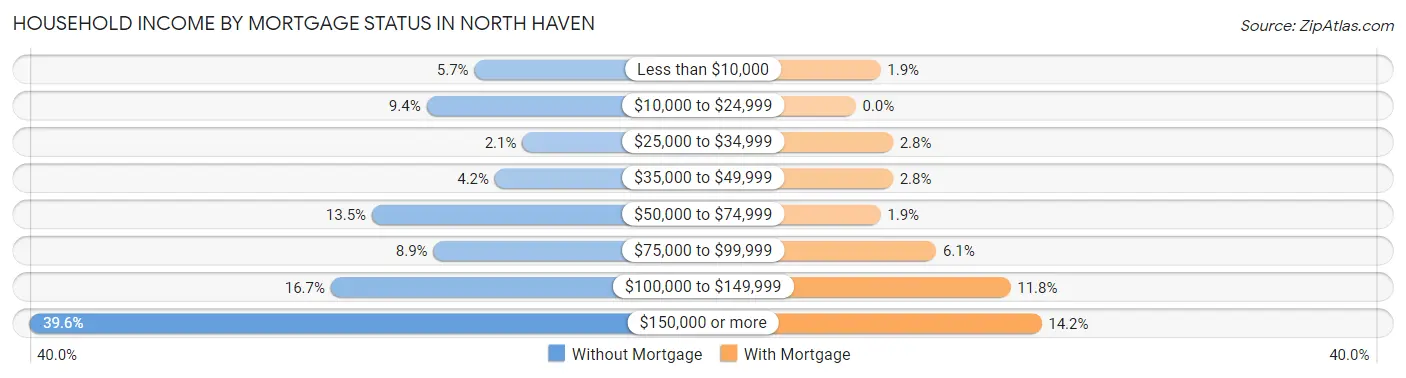
| Household Income | Without Mortgage | With Mortgage |
| Less than $10,000 | 11 (5.7%) | 4 (1.9%) |
| $10,000 to $24,999 | 18 (9.4%) | 0 (0.0%) |
| $25,000 to $34,999 | 4 (2.1%) | 6 (2.8%) |
| $35,000 to $49,999 | 8 (4.2%) | 6 (2.8%) |
| $50,000 to $74,999 | 26 (13.5%) | 4 (1.9%) |
| $75,000 to $99,999 | 17 (8.8%) | 13 (6.1%) |
| $100,000 to $149,999 | 32 (16.7%) | 25 (11.8%) |
| $150,000 or more | 76 (39.6%) | 30 (14.1%) |
| Total | 192 (100.0%) | 212 (100.0%) |
Property Value to Household Income Ratio in North Haven
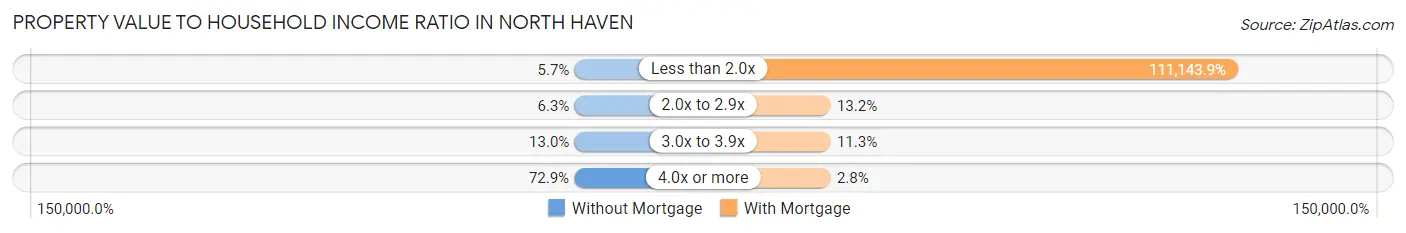
| Value-to-Income Ratio | Without Mortgage | With Mortgage |
| Less than 2.0x | 11 (5.7%) | 235,625 (111,143.9%) |
| 2.0x to 2.9x | 12 (6.2%) | 28 (13.2%) |
| 3.0x to 3.9x | 25 (13.0%) | 24 (11.3%) |
| 4.0x or more | 140 (72.9%) | 6 (2.8%) |
| Total | 192 (100.0%) | 212 (100.0%) |
Real Estate Taxes by Mortgage Status in North Haven
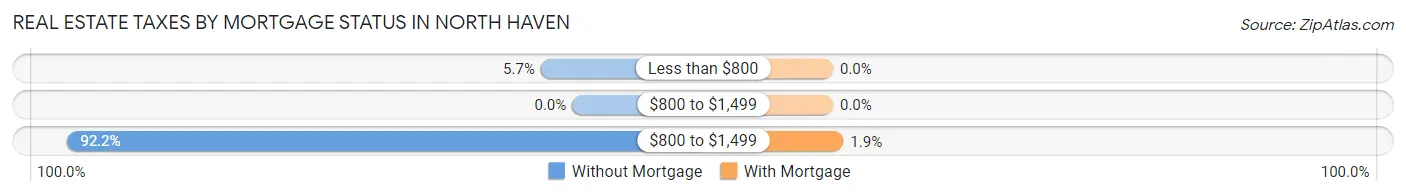
| Property Taxes | Without Mortgage | With Mortgage |
| Less than $800 | 11 (5.7%) | 0 (0.0%) |
| $800 to $1,499 | 0 (0.0%) | 0 (0.0%) |
| $800 to $1,499 | 177 (92.2%) | 4 (1.9%) |
| Total | 192 (100.0%) | 212 (100.0%) |
Health & Disability in North Haven
Health Insurance Coverage by Age in North Haven
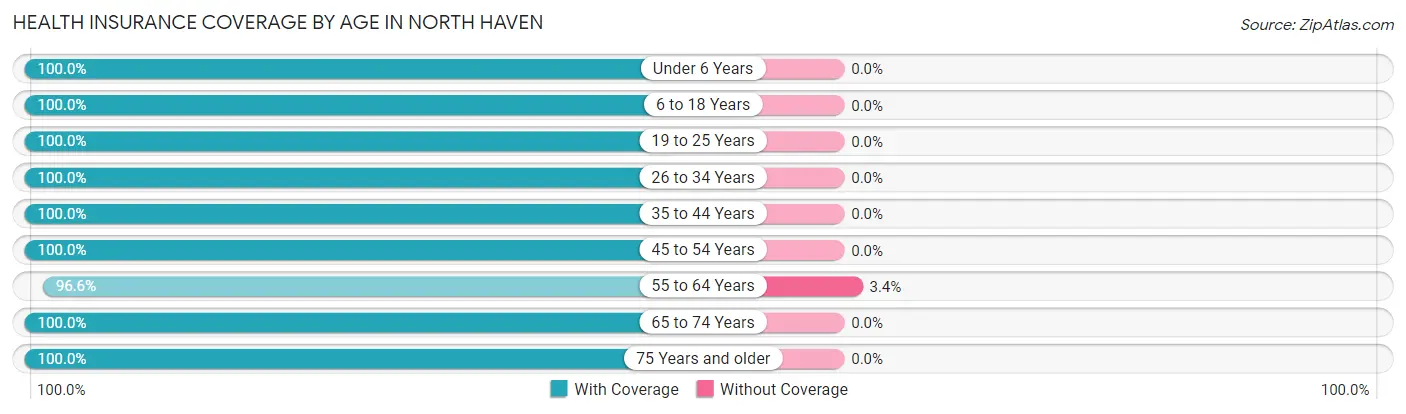
| Age Bracket | With Coverage | Without Coverage |
| Under 6 Years | 32 (100.0%) | 0 (0.0%) |
| 6 to 18 Years | 109 (100.0%) | 0 (0.0%) |
| 19 to 25 Years | 27 (100.0%) | 0 (0.0%) |
| 26 to 34 Years | 27 (100.0%) | 0 (0.0%) |
| 35 to 44 Years | 64 (100.0%) | 0 (0.0%) |
| 45 to 54 Years | 118 (100.0%) | 0 (0.0%) |
| 55 to 64 Years | 227 (96.6%) | 8 (3.4%) |
| 65 to 74 Years | 187 (100.0%) | 0 (0.0%) |
| 75 Years and older | 114 (100.0%) | 0 (0.0%) |
| Total | 905 (99.1%) | 8 (0.9%) |
Health Insurance Coverage by Citizenship Status in North Haven
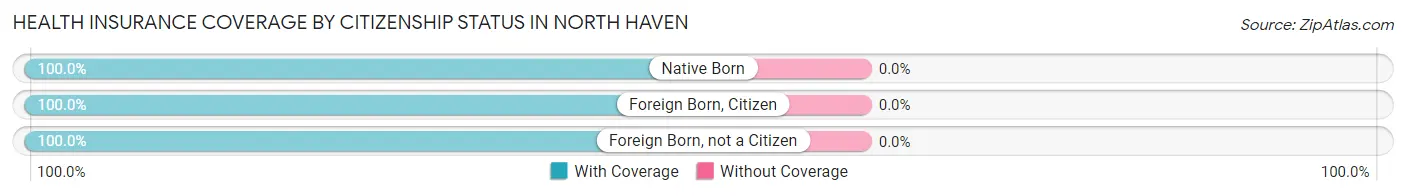
| Citizenship Status | With Coverage | Without Coverage |
| Native Born | 32 (100.0%) | 0 (0.0%) |
| Foreign Born, Citizen | 109 (100.0%) | 0 (0.0%) |
| Foreign Born, not a Citizen | 27 (100.0%) | 0 (0.0%) |
Health Insurance Coverage by Household Income in North Haven
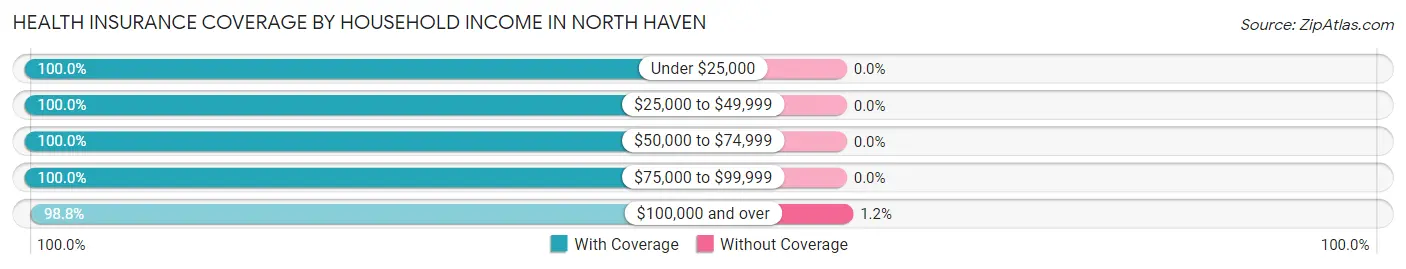
| Household Income | With Coverage | Without Coverage |
| Under $25,000 | 59 (100.0%) | 0 (0.0%) |
| $25,000 to $49,999 | 38 (100.0%) | 0 (0.0%) |
| $50,000 to $74,999 | 80 (100.0%) | 0 (0.0%) |
| $75,000 to $99,999 | 68 (100.0%) | 0 (0.0%) |
| $100,000 and over | 660 (98.8%) | 8 (1.2%) |
Public vs Private Health Insurance Coverage by Age in North Haven
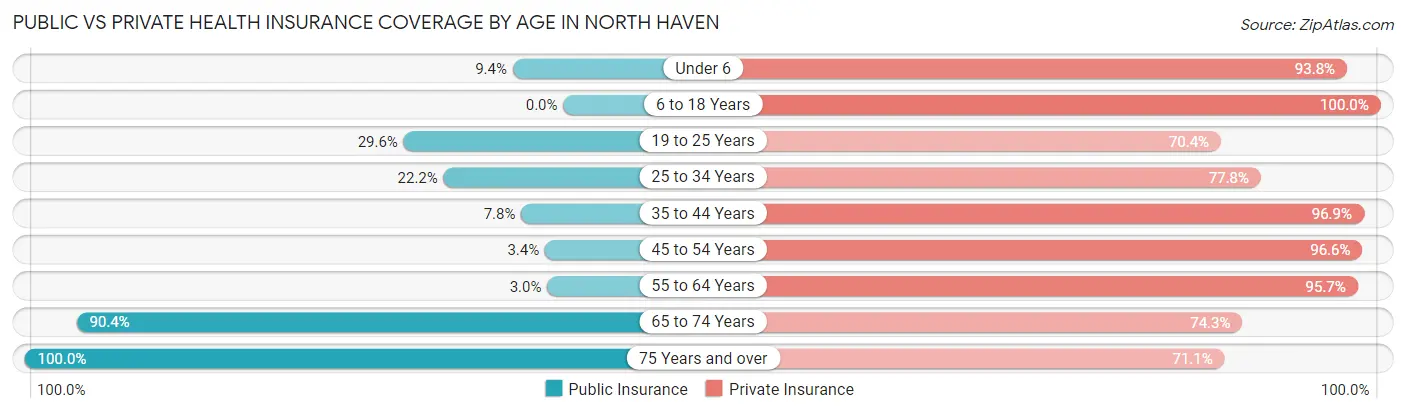
| Age Bracket | Public Insurance | Private Insurance |
| Under 6 | 3 (9.4%) | 30 (93.8%) |
| 6 to 18 Years | 0 (0.0%) | 109 (100.0%) |
| 19 to 25 Years | 8 (29.6%) | 19 (70.4%) |
| 25 to 34 Years | 6 (22.2%) | 21 (77.8%) |
| 35 to 44 Years | 5 (7.8%) | 62 (96.9%) |
| 45 to 54 Years | 4 (3.4%) | 114 (96.6%) |
| 55 to 64 Years | 7 (3.0%) | 225 (95.7%) |
| 65 to 74 Years | 169 (90.4%) | 139 (74.3%) |
| 75 Years and over | 114 (100.0%) | 81 (71.1%) |
| Total | 316 (34.6%) | 800 (87.6%) |
Disability Status by Sex by Age in North Haven
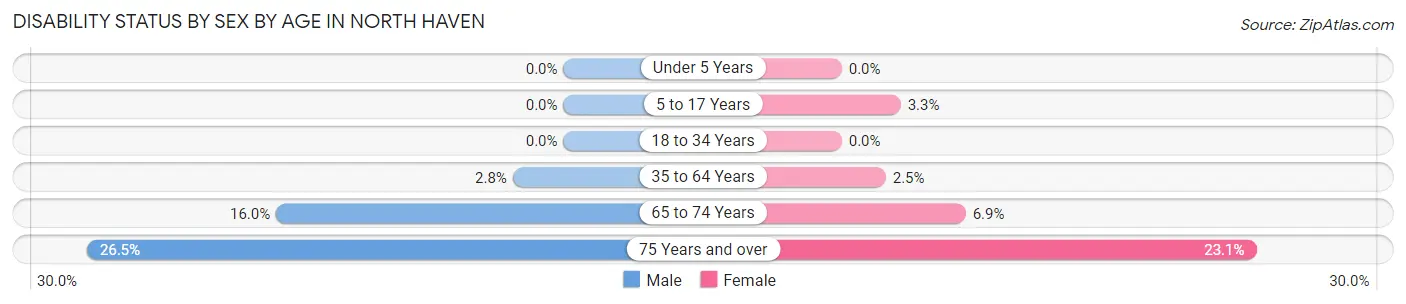
| Age Bracket | Male | Female |
| Under 5 Years | 0 (0.0%) | 0 (0.0%) |
| 5 to 17 Years | 0 (0.0%) | 2 (3.3%) |
| 18 to 34 Years | 0 (0.0%) | 0 (0.0%) |
| 35 to 64 Years | 6 (2.8%) | 5 (2.5%) |
| 65 to 74 Years | 16 (16.0%) | 6 (6.9%) |
| 75 Years and over | 13 (26.5%) | 15 (23.1%) |
Disability Class by Sex by Age in North Haven
Disability Class: Hearing Difficulty
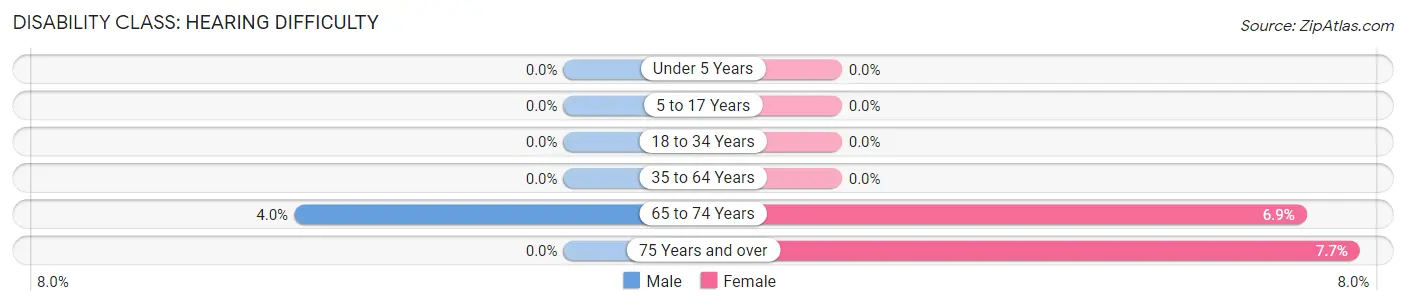
| Age Bracket | Male | Female |
| Under 5 Years | 0 (0.0%) | 0 (0.0%) |
| 5 to 17 Years | 0 (0.0%) | 0 (0.0%) |
| 18 to 34 Years | 0 (0.0%) | 0 (0.0%) |
| 35 to 64 Years | 0 (0.0%) | 0 (0.0%) |
| 65 to 74 Years | 4 (4.0%) | 6 (6.9%) |
| 75 Years and over | 0 (0.0%) | 5 (7.7%) |
Disability Class: Vision Difficulty
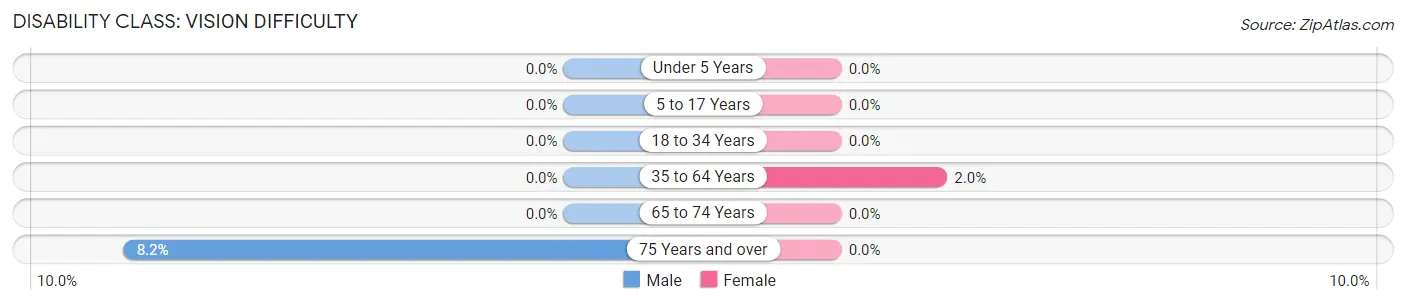
| Age Bracket | Male | Female |
| Under 5 Years | 0 (0.0%) | 0 (0.0%) |
| 5 to 17 Years | 0 (0.0%) | 0 (0.0%) |
| 18 to 34 Years | 0 (0.0%) | 0 (0.0%) |
| 35 to 64 Years | 0 (0.0%) | 4 (2.0%) |
| 65 to 74 Years | 0 (0.0%) | 0 (0.0%) |
| 75 Years and over | 4 (8.2%) | 0 (0.0%) |
Disability Class: Cognitive Difficulty
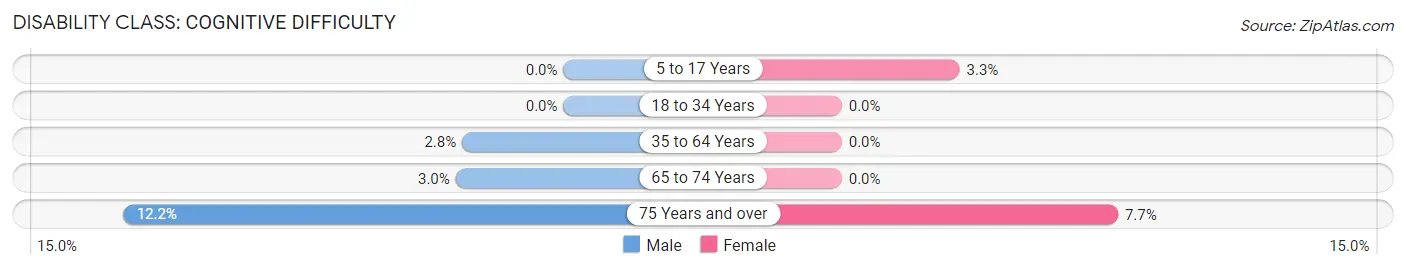
| Age Bracket | Male | Female |
| 5 to 17 Years | 0 (0.0%) | 2 (3.3%) |
| 18 to 34 Years | 0 (0.0%) | 0 (0.0%) |
| 35 to 64 Years | 6 (2.8%) | 0 (0.0%) |
| 65 to 74 Years | 3 (3.0%) | 0 (0.0%) |
| 75 Years and over | 6 (12.2%) | 5 (7.7%) |
Disability Class: Ambulatory Difficulty
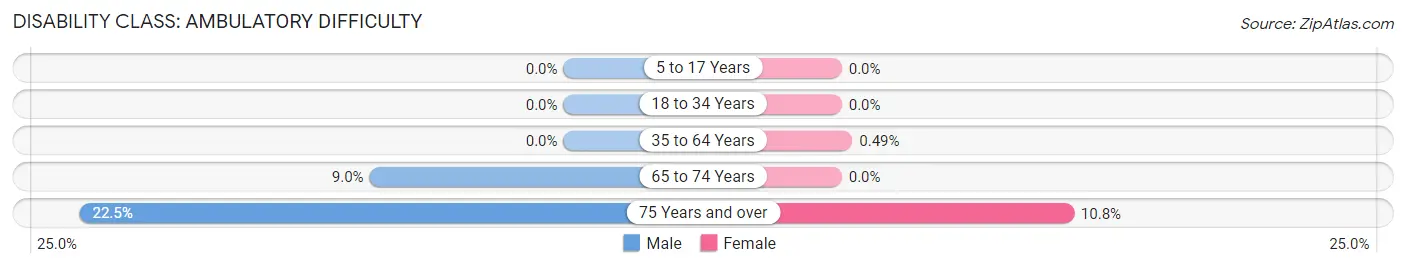
| Age Bracket | Male | Female |
| 5 to 17 Years | 0 (0.0%) | 0 (0.0%) |
| 18 to 34 Years | 0 (0.0%) | 0 (0.0%) |
| 35 to 64 Years | 0 (0.0%) | 1 (0.5%) |
| 65 to 74 Years | 9 (9.0%) | 0 (0.0%) |
| 75 Years and over | 11 (22.5%) | 7 (10.8%) |
Disability Class: Self-Care Difficulty
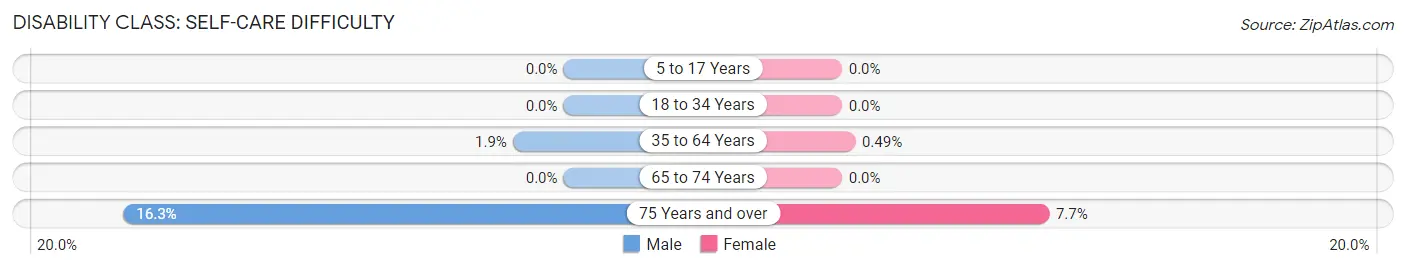
| Age Bracket | Male | Female |
| 5 to 17 Years | 0 (0.0%) | 0 (0.0%) |
| 18 to 34 Years | 0 (0.0%) | 0 (0.0%) |
| 35 to 64 Years | 4 (1.9%) | 1 (0.5%) |
| 65 to 74 Years | 0 (0.0%) | 0 (0.0%) |
| 75 Years and over | 8 (16.3%) | 5 (7.7%) |
Technology Access in North Haven
Computing Device Access in North Haven
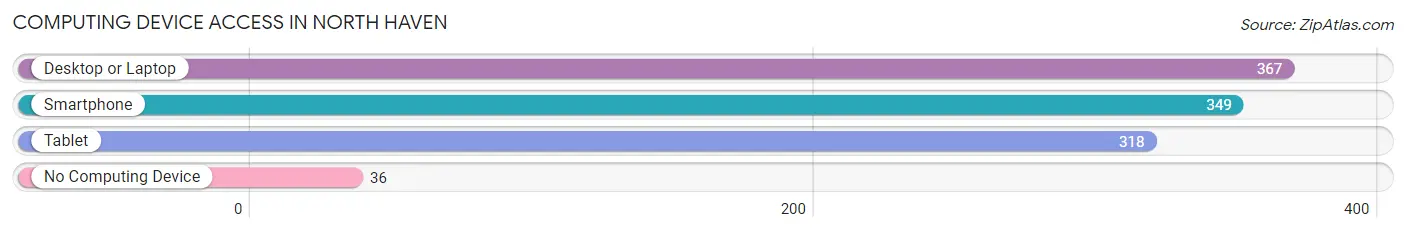
| Device Type | # Households | % Households |
| Desktop or Laptop | 367 | 86.4% |
| Smartphone | 349 | 82.1% |
| Tablet | 318 | 74.8% |
| No Computing Device | 36 | 8.5% |
| Total | 425 | 100.0% |
Internet Access in North Haven
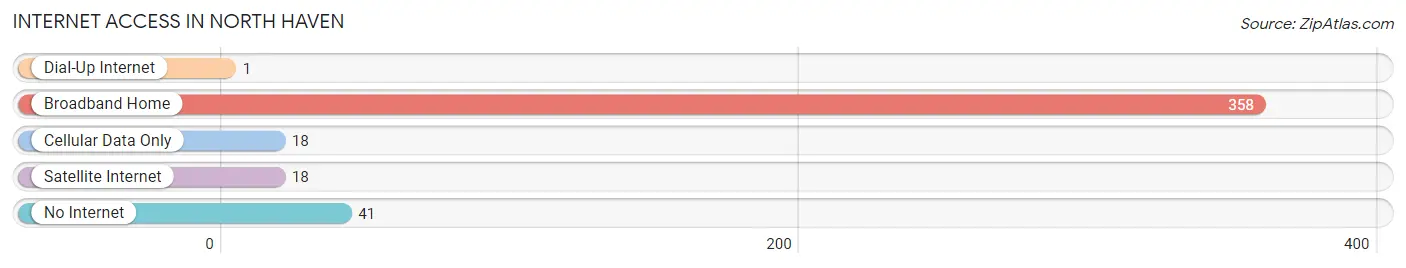
| Internet Type | # Households | % Households |
| Dial-Up Internet | 1 | 0.2% |
| Broadband Home | 358 | 84.2% |
| Cellular Data Only | 18 | 4.2% |
| Satellite Internet | 18 | 4.2% |
| No Internet | 41 | 9.7% |
| Total | 425 | 100.0% |
North Haven Summary
History
North Haven is a small hamlet located in the Town of Southold in Suffolk County, New York. It is located on the North Fork of Long Island, approximately 90 miles east of New York City. The hamlet was first settled in 1640 by English settlers from New Haven, Connecticut, and was originally known as “New Haven”. The name was changed to North Haven in 1790 to avoid confusion with the Connecticut town.
North Haven has a rich history of fishing and farming. The hamlet was once home to a thriving oyster industry, and the local economy was largely based on the harvesting of oysters and other shellfish. The oyster industry declined in the late 19th century, and the local economy shifted to farming. The hamlet was also home to a number of shipbuilding yards, which produced vessels for the fishing and oyster industries.
Geography
North Haven is located on the North Fork of Long Island, approximately 90 miles east of New York City. The hamlet is bordered by the Long Island Sound to the north, Shelter Island to the east, and the Peconic Bay to the south. The hamlet is situated on a peninsula, with the Long Island Sound to the north and the Peconic Bay to the south.
The hamlet is home to a number of small beaches, including North Haven Beach, which is located on the Long Island Sound. The beach is a popular destination for swimming, fishing, and other recreational activities.
Economy
The local economy of North Haven is largely based on tourism and agriculture. The hamlet is home to a number of wineries, which attract visitors from all over the world. The local farms produce a variety of fruits and vegetables, including apples, peaches, and potatoes. The hamlet is also home to a number of seafood restaurants, which serve fresh seafood caught in the local waters.
Demographics
As of the 2010 census, the population of North Haven was 1,845. The population is predominantly white (94.3%), with a small percentage of African Americans (2.2%) and Hispanics (2.2%). The median household income is $77,917, and the median home value is $541,000. The hamlet is home to a number of small businesses, including restaurants, wineries, and retail stores.
Common Questions
What is Per Capita Income in North Haven?
Per Capita income in North Haven is $177,262.
What is the Median Family Income in North Haven?
Median Family Income in North Haven is $213,250.
What is the Median Household income in North Haven?
Median Household Income in North Haven is $151,250.
What is Income or Wage Gap in North Haven?
Income or Wage Gap in North Haven is 45.0%.
Women in North Haven earn 55.0 cents for every dollar earned by a man.
What is Inequality or Gini Index in North Haven?
Inequality or Gini Index in North Haven is 0.61.
What is the Total Population of North Haven?
Total Population of North Haven is 913.
What is the Total Male Population of North Haven?
Total Male Population of North Haven is 465.
What is the Total Female Population of North Haven?
Total Female Population of North Haven is 448.
What is the Ratio of Males per 100 Females in North Haven?
There are 103.79 Males per 100 Females in North Haven.
What is the Ratio of Females per 100 Males in North Haven?
There are 96.34 Females per 100 Males in North Haven.
What is the Median Population Age in North Haven?
Median Population Age in North Haven is 57.7 Years.
What is the Average Family Size in North Haven
Average Family Size in North Haven is 2.6 People.
What is the Average Household Size in North Haven
Average Household Size in North Haven is 2.1 People.
How Large is the Labor Force in North Haven?
There are 460 People in the Labor Forcein in North Haven.
What is the Percentage of People in the Labor Force in North Haven?
56.9% of People are in the Labor Force in North Haven.
What is the Unemployment Rate in North Haven?
Unemployment Rate in North Haven is 2.6%.