Harbor Hills, NY Map & Demographics
Harbor Hills Map
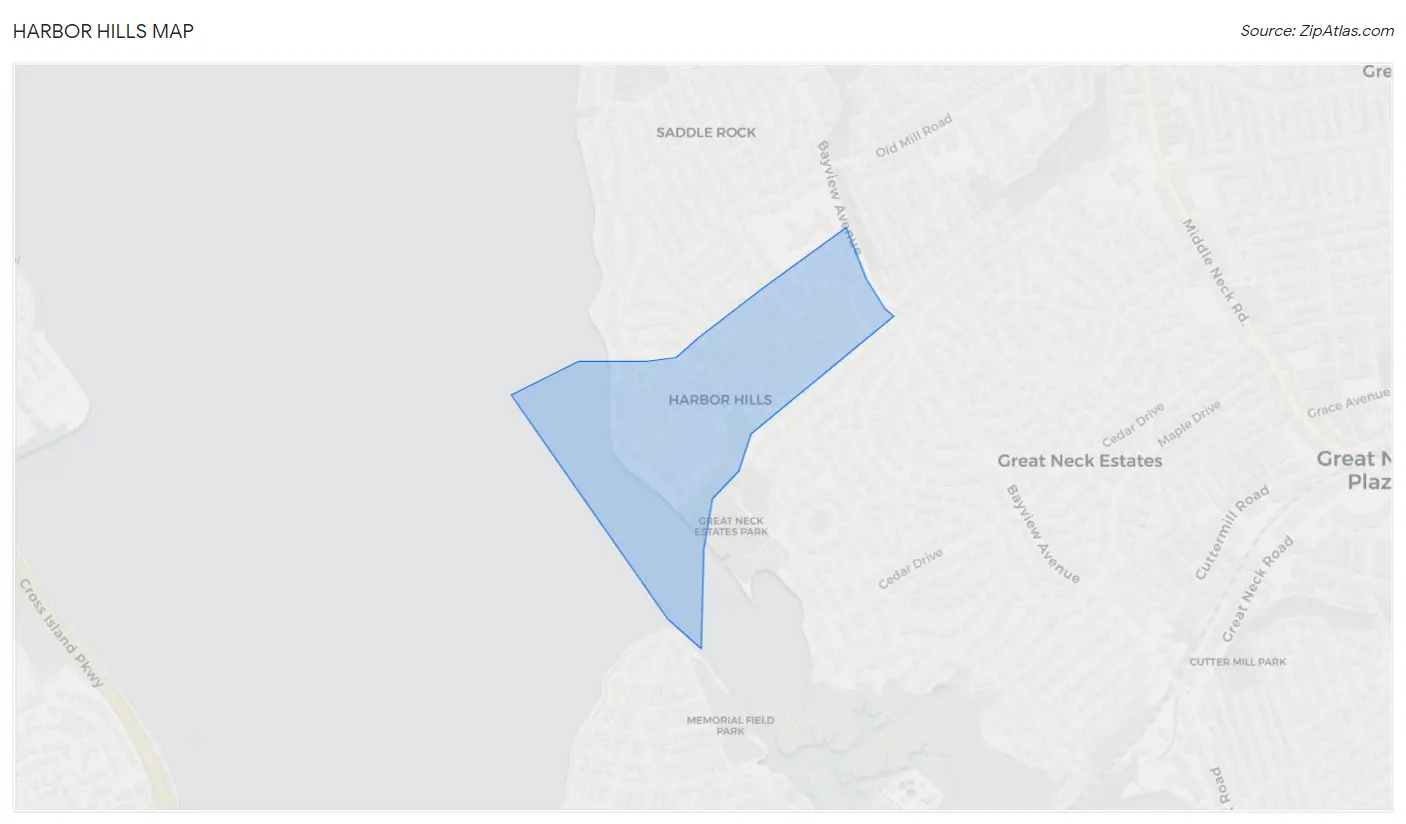
Harbor Hills Overview
$103,414
PER CAPITA INCOME
$183,073
AVG HOUSEHOLD INCOME
0.51
INEQUALITY / GINI INDEX
462
TOTAL POPULATION
195
MALE POPULATION
267
FEMALE POPULATION
73.03
MALES / 100 FEMALES
136.92
FEMALES / 100 MALES
36.4
MEDIAN AGE
3.7
AVG FAMILY SIZE
2.9
AVG HOUSEHOLD SIZE
234
LABOR FORCE [ PEOPLE ]
78.5%
PERCENT IN LABOR FORCE
Income in Harbor Hills
Income Overview in Harbor Hills
| Characteristic | Number | Measure |
| Per Capita Income | 462 | $103,414 |
| Median Family Income | 111 | $0 |
| Mean Family Income | 111 | $397,678 |
| Median Household Income | 159 | $183,073 |
| Mean Household Income | 159 | $299,363 |
| Income Deficit | 111 | $0 |
| Wage / Income Gap (%) | 462 | 0.00% |
| Wage / Income Gap ($) | 462 | 100.00¢ per $1 |
| Gini / Inequality Index | 462 | 0.51 |
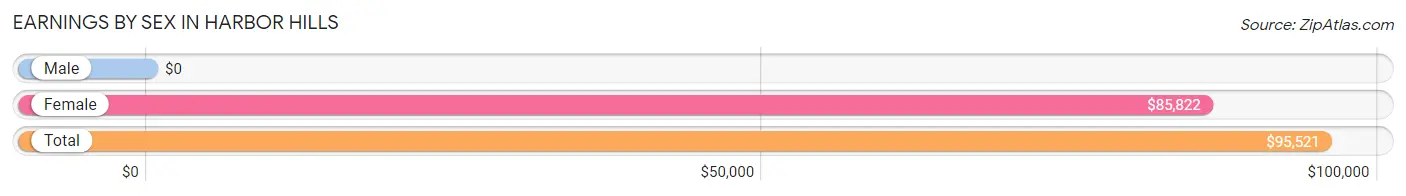
Earnings by Sex in Harbor Hills
| Sex | Number | Average Earnings |
| Male | 99 (42.3%) | $0 |
| Female | 135 (57.7%) | $85,822 |
| Total | 234 (100.0%) | $95,521 |
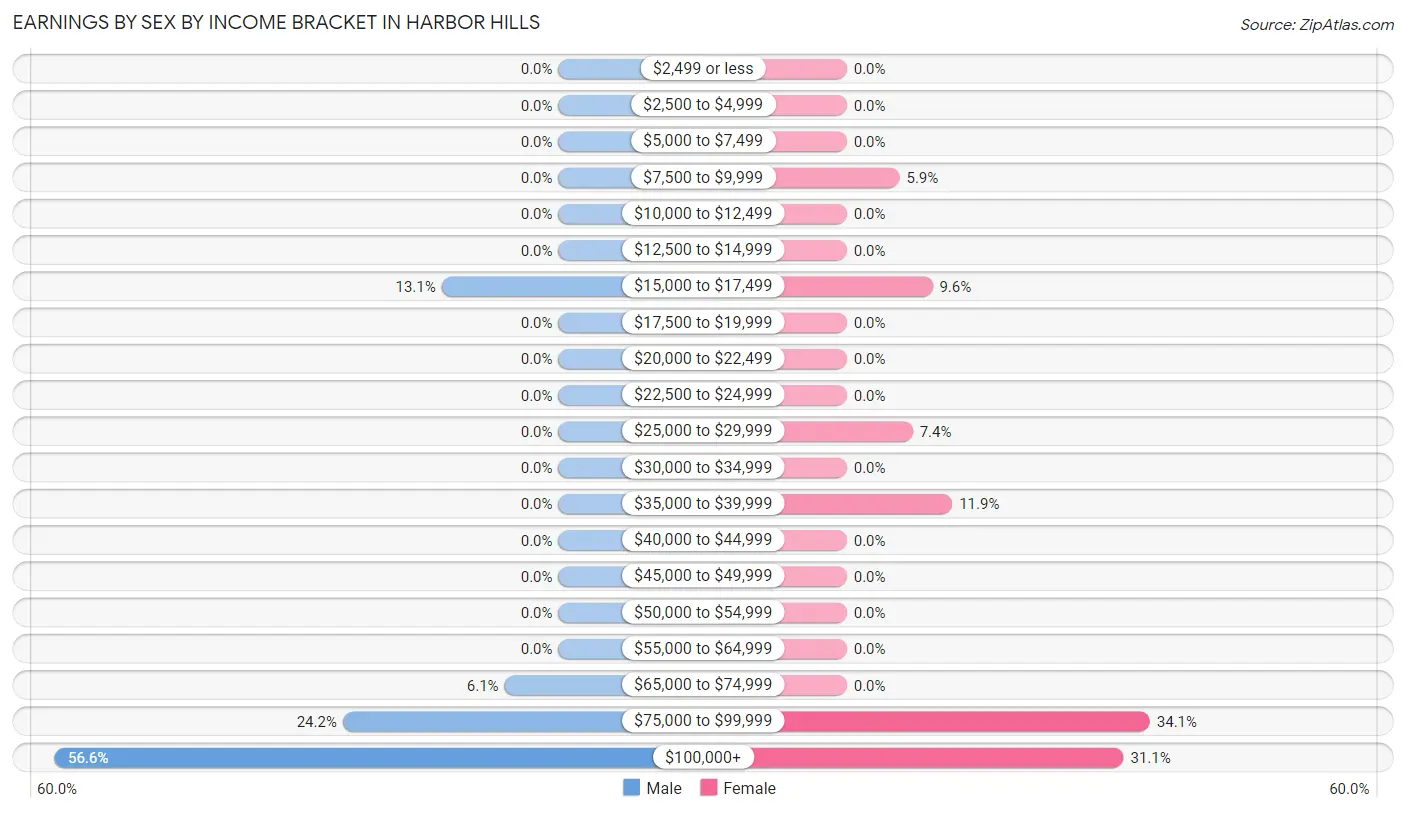
Earnings by Sex by Income Bracket in Harbor Hills
The most common earnings brackets in Harbor Hills are $100,000+ for men (56 | 56.6%) and $75,000 to $99,999 for women (46 | 34.1%).
| Income | Male | Female |
| $2,499 or less | 0 (0.0%) | 0 (0.0%) |
| $2,500 to $4,999 | 0 (0.0%) | 0 (0.0%) |
| $5,000 to $7,499 | 0 (0.0%) | 0 (0.0%) |
| $7,500 to $9,999 | 0 (0.0%) | 8 (5.9%) |
| $10,000 to $12,499 | 0 (0.0%) | 0 (0.0%) |
| $12,500 to $14,999 | 0 (0.0%) | 0 (0.0%) |
| $15,000 to $17,499 | 13 (13.1%) | 13 (9.6%) |
| $17,500 to $19,999 | 0 (0.0%) | 0 (0.0%) |
| $20,000 to $22,499 | 0 (0.0%) | 0 (0.0%) |
| $22,500 to $24,999 | 0 (0.0%) | 0 (0.0%) |
| $25,000 to $29,999 | 0 (0.0%) | 10 (7.4%) |
| $30,000 to $34,999 | 0 (0.0%) | 0 (0.0%) |
| $35,000 to $39,999 | 0 (0.0%) | 16 (11.8%) |
| $40,000 to $44,999 | 0 (0.0%) | 0 (0.0%) |
| $45,000 to $49,999 | 0 (0.0%) | 0 (0.0%) |
| $50,000 to $54,999 | 0 (0.0%) | 0 (0.0%) |
| $55,000 to $64,999 | 0 (0.0%) | 0 (0.0%) |
| $65,000 to $74,999 | 6 (6.1%) | 0 (0.0%) |
| $75,000 to $99,999 | 24 (24.2%) | 46 (34.1%) |
| $100,000+ | 56 (56.6%) | 42 (31.1%) |
| Total | 99 (100.0%) | 135 (100.0%) |
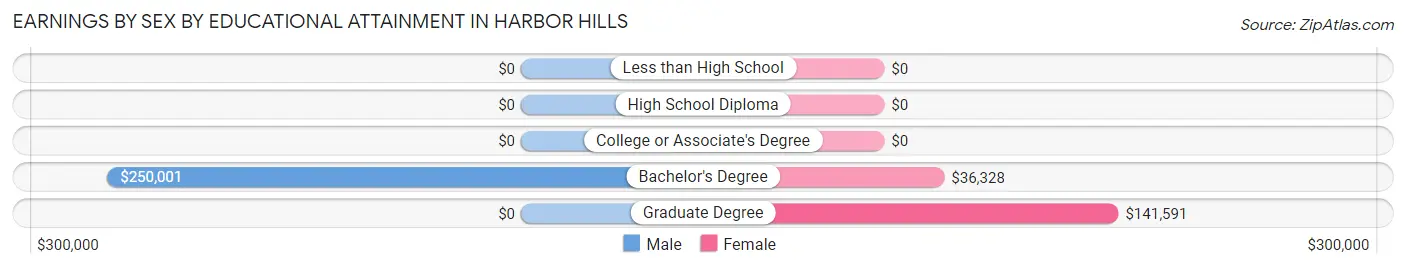
Earnings by Sex by Educational Attainment in Harbor Hills
| Educational Attainment | Male Income | Female Income |
| Less than High School | - | - |
| High School Diploma | - | - |
| College or Associate's Degree | - | - |
| Bachelor's Degree | $250,001 | $36,328 |
| Graduate Degree | - | - |
| Total | - | - |
Family Income in Harbor Hills
Family Income Brackets in Harbor Hills
According to the Harbor Hills family income data, there are 55 families falling into the $200,000+ income range, which is the most common income bracket and makes up 49.5% of all families.
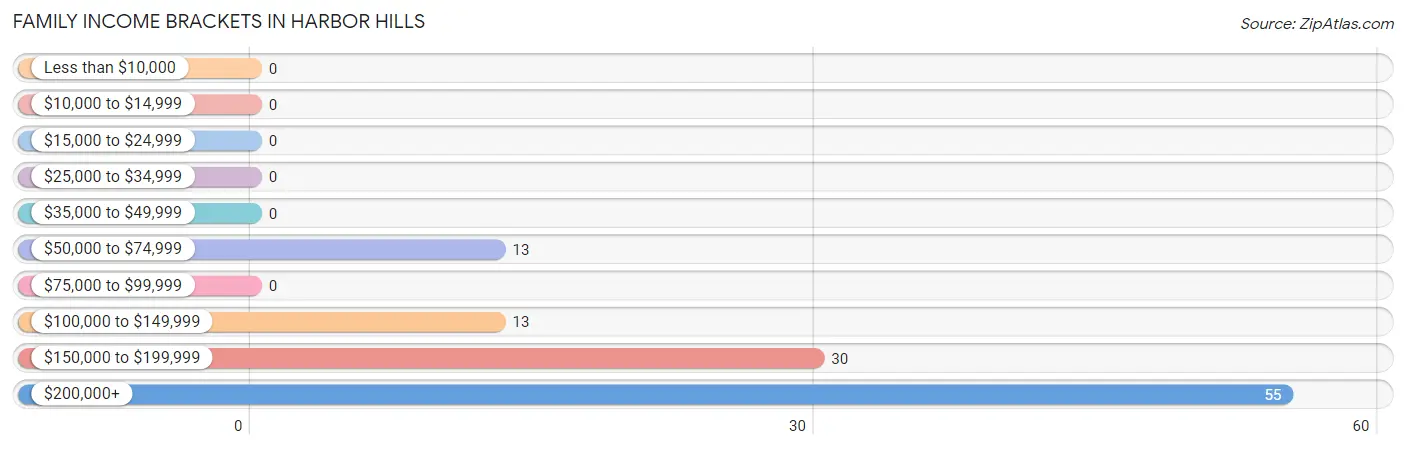
| Income Bracket | # Families | % Families |
| Less than $10,000 | 0 | 0.0% |
| $10,000 to $14,999 | 0 | 0.0% |
| $15,000 to $24,999 | 0 | 0.0% |
| $25,000 to $34,999 | 0 | 0.0% |
| $35,000 to $49,999 | 0 | 0.0% |
| $50,000 to $74,999 | 13 | 11.7% |
| $75,000 to $99,999 | 0 | 0.0% |
| $100,000 to $149,999 | 13 | 11.7% |
| $150,000 to $199,999 | 30 | 27.0% |
| $200,000+ | 55 | 49.5% |
Family Income by Famaliy Size in Harbor Hills
3-person families (37 | 33.3%) account for the highest median family income in Harbor Hills with $250,001 per family, while 3-person families (37 | 33.3%) have the highest median income of $83,334 per family member.
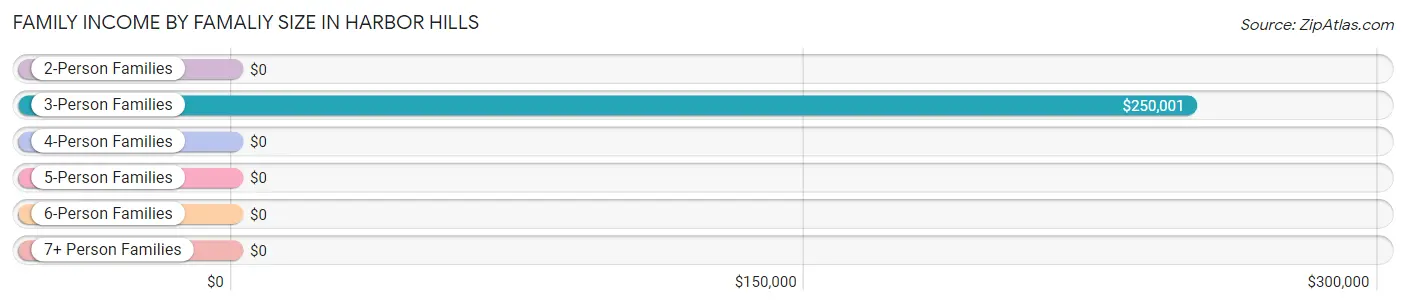
| Income Bracket | # Families | Median Income |
| 2-Person Families | 21 (18.9%) | $0 |
| 3-Person Families | 37 (33.3%) | $250,001 |
| 4-Person Families | 0 (0.0%) | $0 |
| 5-Person Families | 47 (42.3%) | $0 |
| 6-Person Families | 6 (5.4%) | $0 |
| 7+ Person Families | 0 (0.0%) | $0 |
| Total | 111 (100.0%) | $0 |
Family Income by Number of Earners in Harbor Hills
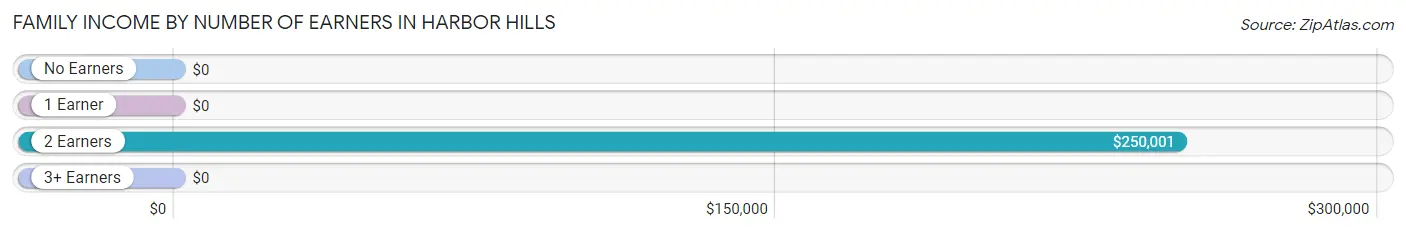
| Number of Earners | # Families | Median Income |
| No Earners | 0 (0.0%) | $0 |
| 1 Earner | 26 (23.4%) | $0 |
| 2 Earners | 61 (54.9%) | $250,001 |
| 3+ Earners | 24 (21.6%) | $0 |
| Total | 111 (100.0%) | $0 |
Household Income in Harbor Hills
Household Income Brackets in Harbor Hills
With 55 households falling in the category, the $200,000+ income range is the most frequent in Harbor Hills, accounting for 34.6% of all households.
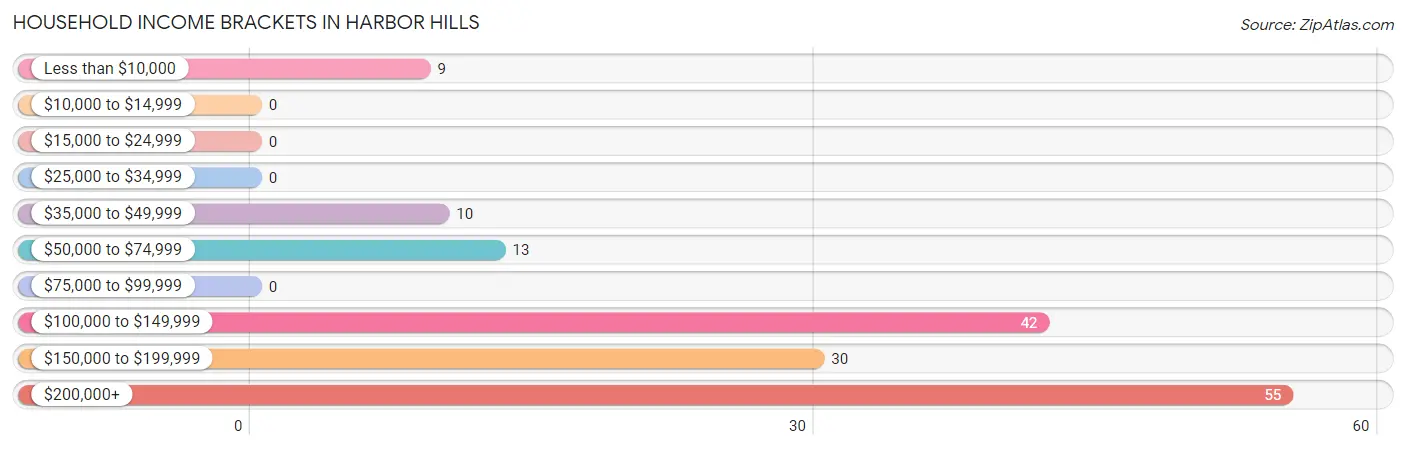
| Income Bracket | # Households | % Households |
| Less than $10,000 | 9 | 5.7% |
| $10,000 to $14,999 | 0 | 0.0% |
| $15,000 to $24,999 | 0 | 0.0% |
| $25,000 to $34,999 | 0 | 0.0% |
| $35,000 to $49,999 | 10 | 6.3% |
| $50,000 to $74,999 | 13 | 8.2% |
| $75,000 to $99,999 | 0 | 0.0% |
| $100,000 to $149,999 | 42 | 26.4% |
| $150,000 to $199,999 | 30 | 18.9% |
| $200,000+ | 55 | 34.6% |
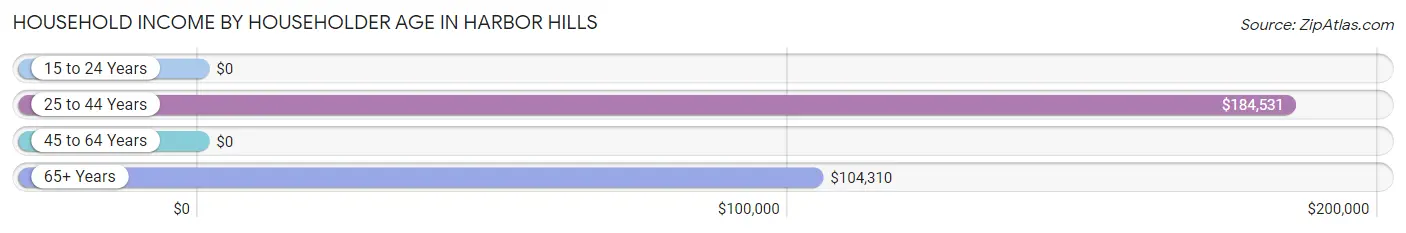
Household Income by Householder Age in Harbor Hills
The median household income in Harbor Hills is $183,073, with the highest median household income of $184,531 found in the 25 to 44 years age bracket for the primary householder. A total of 39 households (24.5%) fall into this category.
| Income Bracket | # Households | Median Income |
| 15 to 24 Years | 0 (0.0%) | $0 |
| 25 to 44 Years | 39 (24.5%) | $184,531 |
| 45 to 64 Years | 14 (8.8%) | $0 |
| 65+ Years | 106 (66.7%) | $104,310 |
| Total | 159 (100.0%) | $183,073 |
Poverty in Harbor Hills
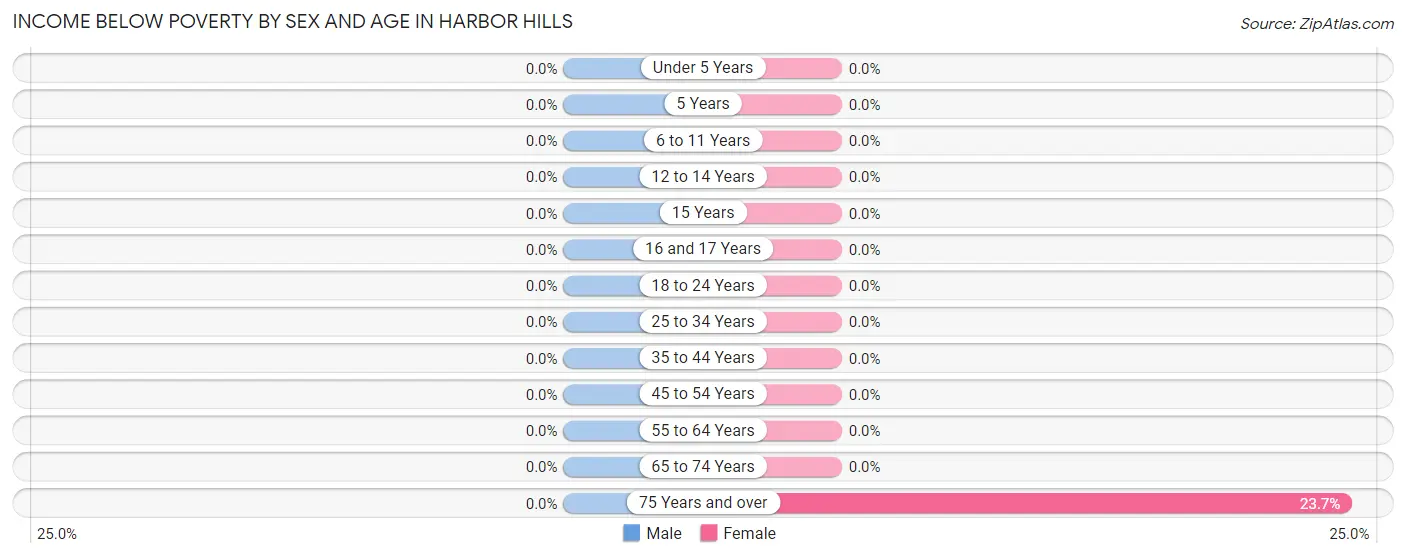
Income Below Poverty by Sex and Age in Harbor Hills
| Age Bracket | Male | Female |
| Under 5 Years | 0 (0.0%) | 0 (0.0%) |
| 5 Years | 0 (0.0%) | 0 (0.0%) |
| 6 to 11 Years | 0 (0.0%) | 0 (0.0%) |
| 12 to 14 Years | 0 (0.0%) | 0 (0.0%) |
| 15 Years | 0 (0.0%) | 0 (0.0%) |
| 16 and 17 Years | 0 (0.0%) | 0 (0.0%) |
| 18 to 24 Years | 0 (0.0%) | 0 (0.0%) |
| 25 to 34 Years | 0 (0.0%) | 0 (0.0%) |
| 35 to 44 Years | 0 (0.0%) | 0 (0.0%) |
| 45 to 54 Years | 0 (0.0%) | 0 (0.0%) |
| 55 to 64 Years | 0 (0.0%) | 0 (0.0%) |
| 65 to 74 Years | 0 (0.0%) | 0 (0.0%) |
| 75 Years and over | 0 (0.0%) | 9 (23.7%) |
| Total | 0 (0.0%) | 9 (3.4%) |
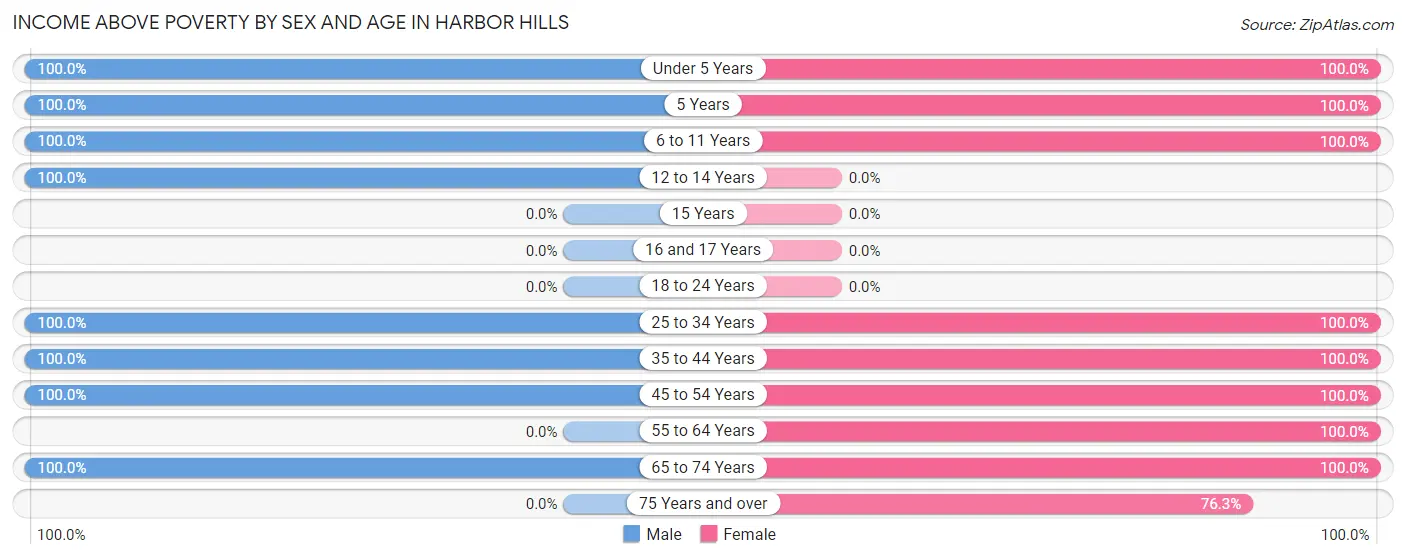
Income Above Poverty by Sex and Age in Harbor Hills
According to the poverty statistics in Harbor Hills, males aged under 5 years and females aged under 5 years are the age groups that are most secure financially, with 100.0% of males and 100.0% of females in these age groups living above the poverty line.
| Age Bracket | Male | Female |
| Under 5 Years | 20 (100.0%) | 22 (100.0%) |
| 5 Years | 6 (100.0%) | 23 (100.0%) |
| 6 to 11 Years | 32 (100.0%) | 36 (100.0%) |
| 12 to 14 Years | 25 (100.0%) | 0 (0.0%) |
| 15 Years | 0 (0.0%) | 0 (0.0%) |
| 16 and 17 Years | 0 (0.0%) | 0 (0.0%) |
| 18 to 24 Years | 0 (0.0%) | 0 (0.0%) |
| 25 to 34 Years | 24 (100.0%) | 38 (100.0%) |
| 35 to 44 Years | 27 (100.0%) | 26 (100.0%) |
| 45 to 54 Years | 14 (100.0%) | 13 (100.0%) |
| 55 to 64 Years | 0 (0.0%) | 29 (100.0%) |
| 65 to 74 Years | 47 (100.0%) | 42 (100.0%) |
| 75 Years and over | 0 (0.0%) | 29 (76.3%) |
| Total | 195 (100.0%) | 258 (96.6%) |
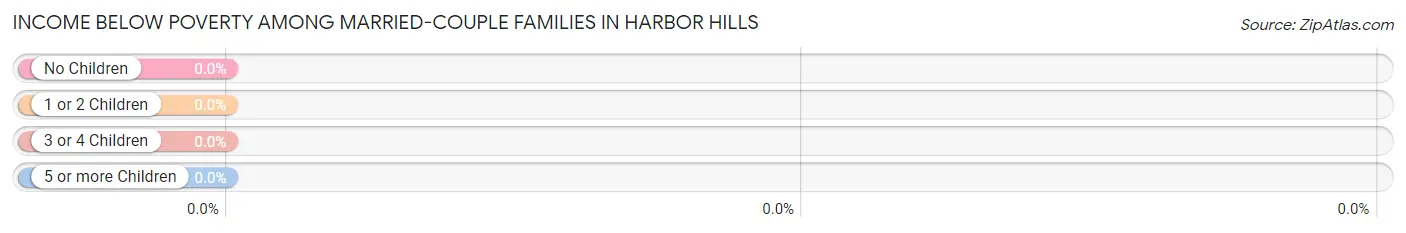
Income Below Poverty Among Married-Couple Families in Harbor Hills
| Children | Above Poverty | Below Poverty |
| No Children | 34 (100.0%) | 0 (0.0%) |
| 1 or 2 Children | 13 (100.0%) | 0 (0.0%) |
| 3 or 4 Children | 53 (100.0%) | 0 (0.0%) |
| 5 or more Children | 0 (0.0%) | 0 (0.0%) |
| Total | 100 (100.0%) | 0 (0.0%) |
Income Below Poverty Among Single-Parent Households in Harbor Hills
| Children | Single Father | Single Mother |
| No Children | 0 (0.0%) | 0 (0.0%) |
| 1 or 2 Children | 0 (0.0%) | 0 (0.0%) |
| 3 or 4 Children | 0 (0.0%) | 0 (0.0%) |
| 5 or more Children | 0 (0.0%) | 0 (0.0%) |
| Total | 0 (0.0%) | 0 (0.0%) |
Income Below Poverty Among Married-Couple vs Single-Parent Households in Harbor Hills
| Children | Married-Couple Families | Single-Parent Households |
| No Children | 0 (0.0%) | 0 (0.0%) |
| 1 or 2 Children | 0 (0.0%) | 0 (0.0%) |
| 3 or 4 Children | 0 (0.0%) | 0 (0.0%) |
| 5 or more Children | 0 (0.0%) | 0 (0.0%) |
| Total | 0 (0.0%) | 0 (0.0%) |
Race in Harbor Hills
The most populous races in Harbor Hills are White / Caucasian (436 | 94.4%), and Two or more Races (26 | 5.6%).
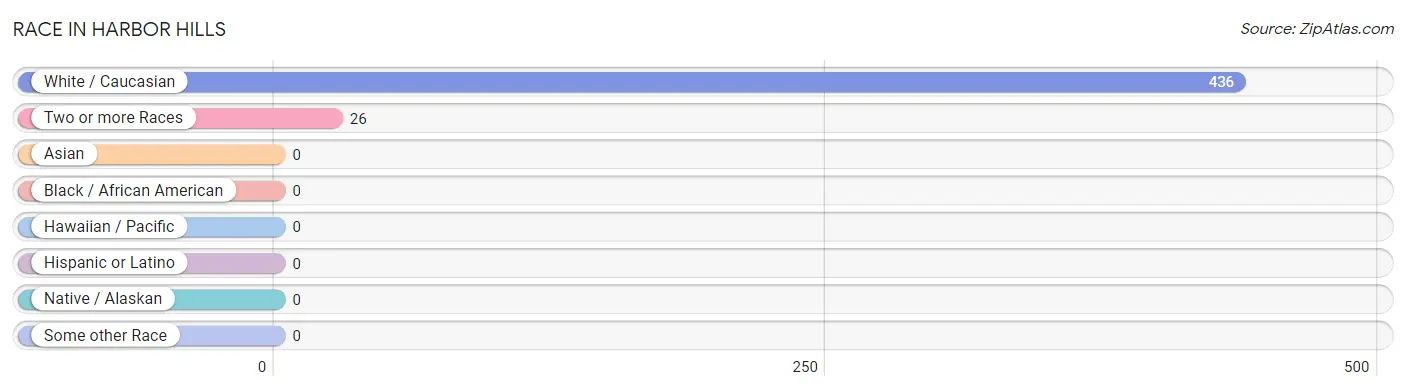
| Race | # Population | % Population |
| Asian | 0 | 0.0% |
| Black / African American | 0 | 0.0% |
| Hawaiian / Pacific | 0 | 0.0% |
| Hispanic or Latino | 0 | 0.0% |
| Native / Alaskan | 0 | 0.0% |
| White / Caucasian | 436 | 94.4% |
| Two or more Races | 26 | 5.6% |
| Some other Race | 0 | 0.0% |
| Total | 462 | 100.0% |
Ancestry in Harbor Hills
The most populous ancestries reported in Harbor Hills are Polish (93 | 20.1%), Iranian (75 | 16.2%), Russian (51 | 11.0%), American (42 | 9.1%), and Ukrainian (29 | 6.3%), together accounting for 62.8% of all Harbor Hills residents.
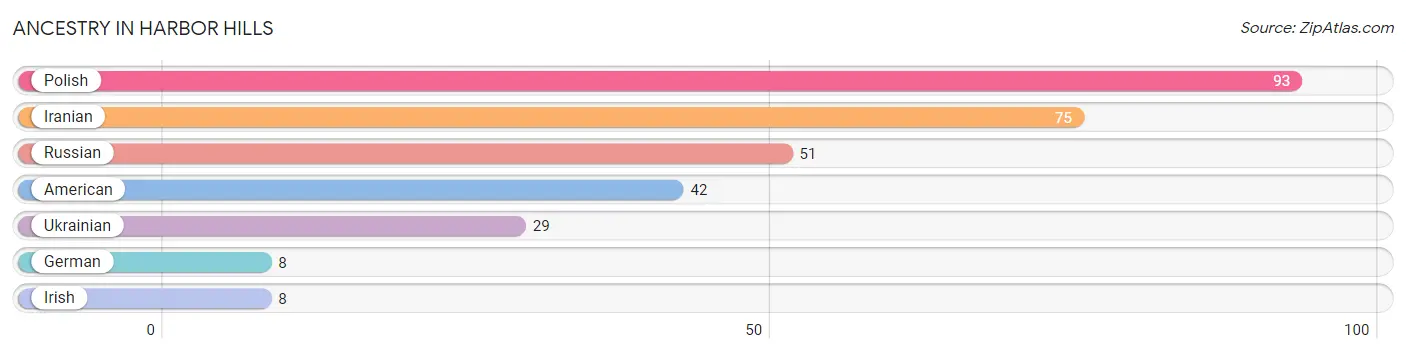
| Ancestry | # Population | % Population |
| American | 42 | 9.1% |
| German | 8 | 1.7% |
| Iranian | 75 | 16.2% |
| Irish | 8 | 1.7% |
| Polish | 93 | 20.1% |
| Russian | 51 | 11.0% |
| Ukrainian | 29 | 6.3% | View All 7 Rows |
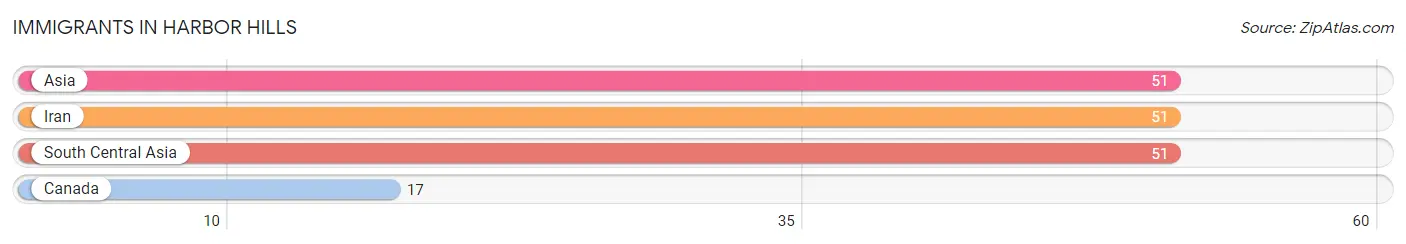
Immigrants in Harbor Hills
The most numerous immigrant groups reported in Harbor Hills came from Asia (51 | 11.0%), Iran (51 | 11.0%), South Central Asia (51 | 11.0%), and Canada (17 | 3.7%), together accounting for 36.8% of all Harbor Hills residents.
| Immigration Origin | # Population | % Population |
| Asia | 51 | 11.0% |
| Canada | 17 | 3.7% |
| Iran | 51 | 11.0% |
| South Central Asia | 51 | 11.0% | View All 4 Rows |
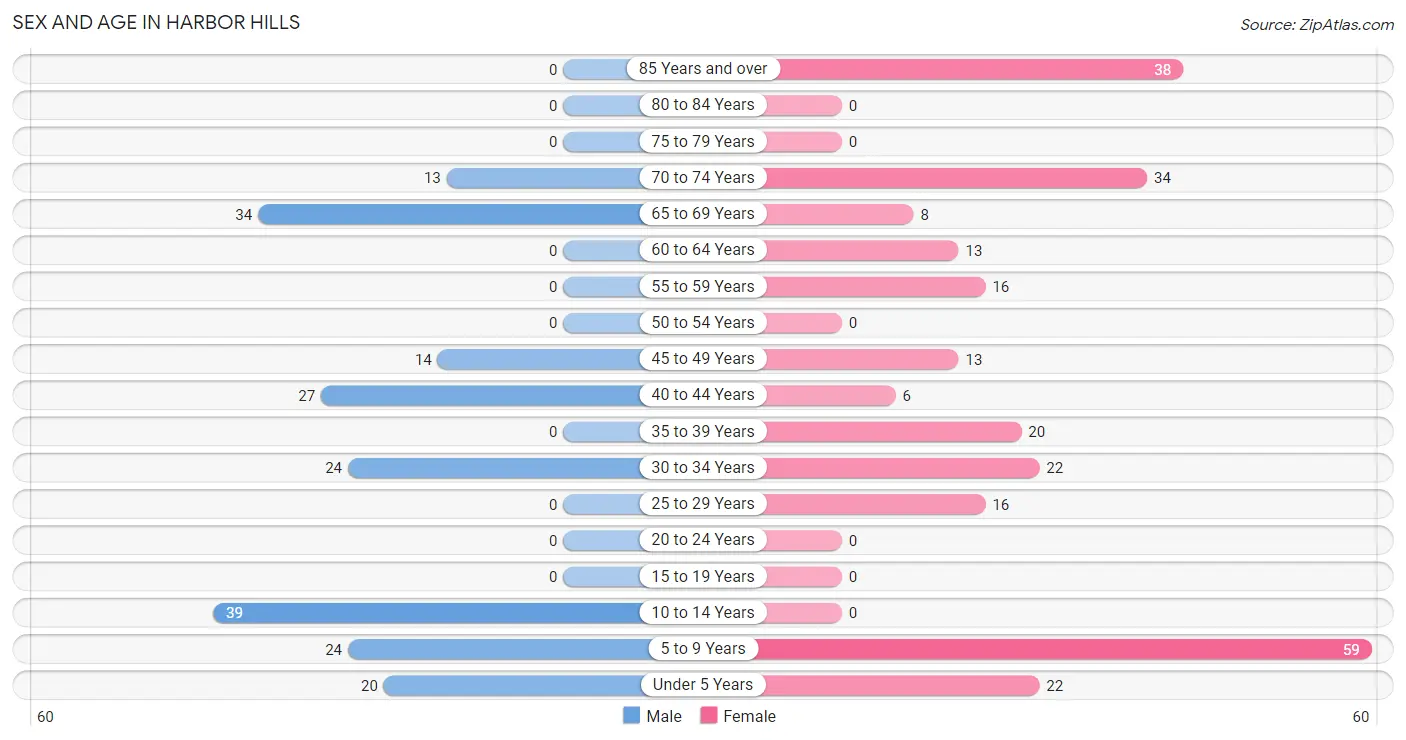
Sex and Age in Harbor Hills
Sex and Age in Harbor Hills
The most populous age groups in Harbor Hills are 10 to 14 Years (39 | 20.0%) for men and 5 to 9 Years (59 | 22.1%) for women.
| Age Bracket | Male | Female |
| Under 5 Years | 20 (10.3%) | 22 (8.2%) |
| 5 to 9 Years | 24 (12.3%) | 59 (22.1%) |
| 10 to 14 Years | 39 (20.0%) | 0 (0.0%) |
| 15 to 19 Years | 0 (0.0%) | 0 (0.0%) |
| 20 to 24 Years | 0 (0.0%) | 0 (0.0%) |
| 25 to 29 Years | 0 (0.0%) | 16 (6.0%) |
| 30 to 34 Years | 24 (12.3%) | 22 (8.2%) |
| 35 to 39 Years | 0 (0.0%) | 20 (7.5%) |
| 40 to 44 Years | 27 (13.9%) | 6 (2.2%) |
| 45 to 49 Years | 14 (7.2%) | 13 (4.9%) |
| 50 to 54 Years | 0 (0.0%) | 0 (0.0%) |
| 55 to 59 Years | 0 (0.0%) | 16 (6.0%) |
| 60 to 64 Years | 0 (0.0%) | 13 (4.9%) |
| 65 to 69 Years | 34 (17.4%) | 8 (3.0%) |
| 70 to 74 Years | 13 (6.7%) | 34 (12.7%) |
| 75 to 79 Years | 0 (0.0%) | 0 (0.0%) |
| 80 to 84 Years | 0 (0.0%) | 0 (0.0%) |
| 85 Years and over | 0 (0.0%) | 38 (14.2%) |
| Total | 195 (100.0%) | 267 (100.0%) |
Families and Households in Harbor Hills
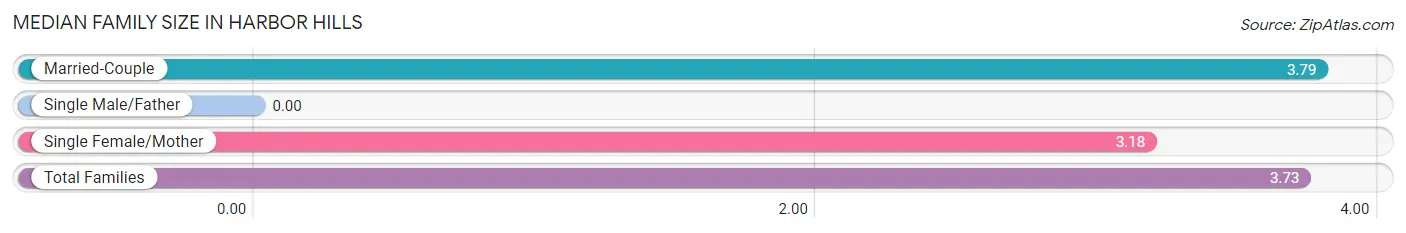
Median Family Size in Harbor Hills
| Family Type | # Families | Family Size |
| Married-Couple | 100 (90.1%) | 3.79 |
| Single Male/Father | 0 (0.0%) | - |
| Single Female/Mother | 11 (9.9%) | 3.18 |
| Total Families | 111 (100.0%) | 3.73 |
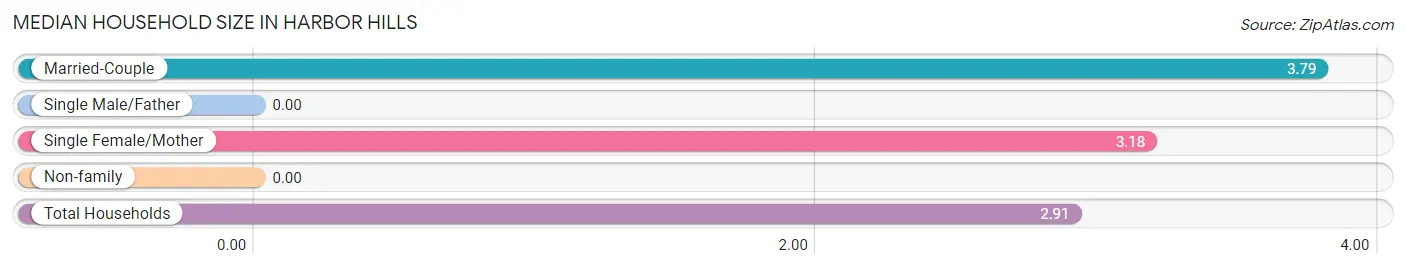
Median Household Size in Harbor Hills
| Household Type | # Households | Household Size |
| Married-Couple | 100 (62.9%) | 3.79 |
| Single Male/Father | 0 (0.0%) | - |
| Single Female/Mother | 11 (6.9%) | 3.18 |
| Non-family | 48 (30.2%) | - |
| Total Households | 159 (100.0%) | 2.91 |
Household Size by Marriage Status in Harbor Hills
Out of a total of 159 households in Harbor Hills, 111 (69.8%) are family households, while 48 (30.2%) are nonfamily households. The most numerous type of family households are 5-person households, comprising 47, and the most common type of nonfamily households are 1-person households, comprising 48.
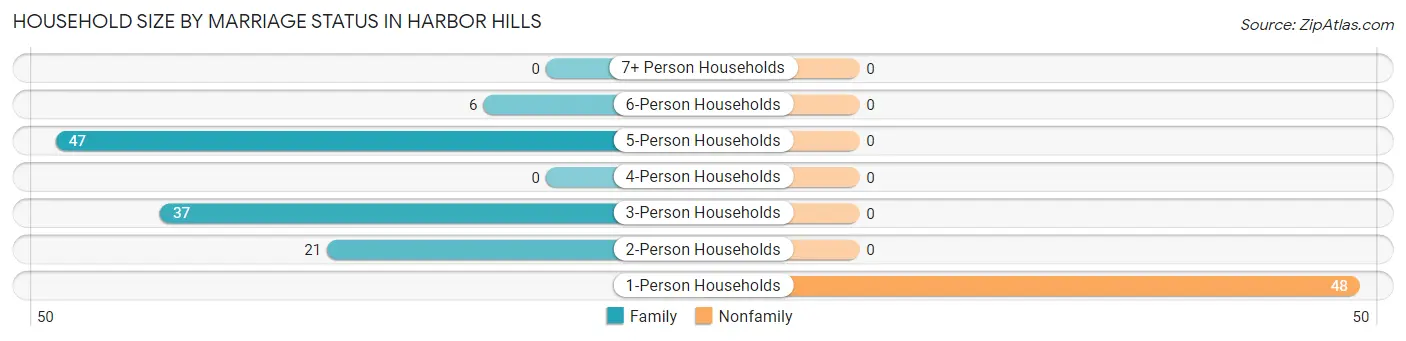
| Household Size | Family Households | Nonfamily Households |
| 1-Person Households | - | 48 (30.2%) |
| 2-Person Households | 21 (13.2%) | 0 (0.0%) |
| 3-Person Households | 37 (23.3%) | 0 (0.0%) |
| 4-Person Households | 0 (0.0%) | 0 (0.0%) |
| 5-Person Households | 47 (29.6%) | 0 (0.0%) |
| 6-Person Households | 6 (3.8%) | 0 (0.0%) |
| 7+ Person Households | 0 (0.0%) | 0 (0.0%) |
| Total | 111 (69.8%) | 48 (30.2%) |
Female Fertility in Harbor Hills
Fertility by Age in Harbor Hills
| Age Bracket | Women with Births | Births / 1,000 Women |
| 15 to 19 years | 0 (0.0%) | 0.0 |
| 20 to 34 years | 0 (0.0%) | 0.0 |
| 35 to 50 years | 0 (0.0%) | 0.0 |
| Total | 0 (0.0%) | 0.0 |
Fertility by Age by Marriage Status in Harbor Hills
| Age Bracket | Married | Unmarried |
| 15 to 19 years | 0 (0.0%) | 0 (0.0%) |
| 20 to 34 years | 0 (0.0%) | 0 (0.0%) |
| 35 to 50 years | 0 (0.0%) | 0 (0.0%) |
| Total | 0 (0.0%) | 0 (0.0%) |
Fertility by Education in Harbor Hills
| Educational Attainment | Women with Births | Births / 1,000 Women |
| Less than High School | 0 (0.0%) | 0.0 |
| High School Diploma | 0 (0.0%) | 0.0 |
| College or Associate's Degree | 0 (0.0%) | 0.0 |
| Bachelor's Degree | 0 (0.0%) | 0.0 |
| Graduate Degree | 0 (0.0%) | 0.0 |
| Total | 0 (0.0%) | 0.0 |
Fertility by Education by Marriage Status in Harbor Hills
| Educational Attainment | Married | Unmarried |
| Less than High School | 0 (0.0%) | 0 (0.0%) |
| High School Diploma | 0 (0.0%) | 0 (0.0%) |
| College or Associate's Degree | 0 (0.0%) | 0 (0.0%) |
| Bachelor's Degree | 0 (0.0%) | 0 (0.0%) |
| Graduate Degree | 0 (0.0%) | 0 (0.0%) |
| Total | 0 (0.0%) | 0 (0.0%) |
Employment Characteristics in Harbor Hills
Employment by Class of Employer in Harbor Hills
Among the 234 employed individuals in Harbor Hills, private company employees (165 | 70.5%), self-employed (incorporated) (28 | 12.0%), and not-for-profit organizations (27 | 11.5%) make up the most common classes of employment.
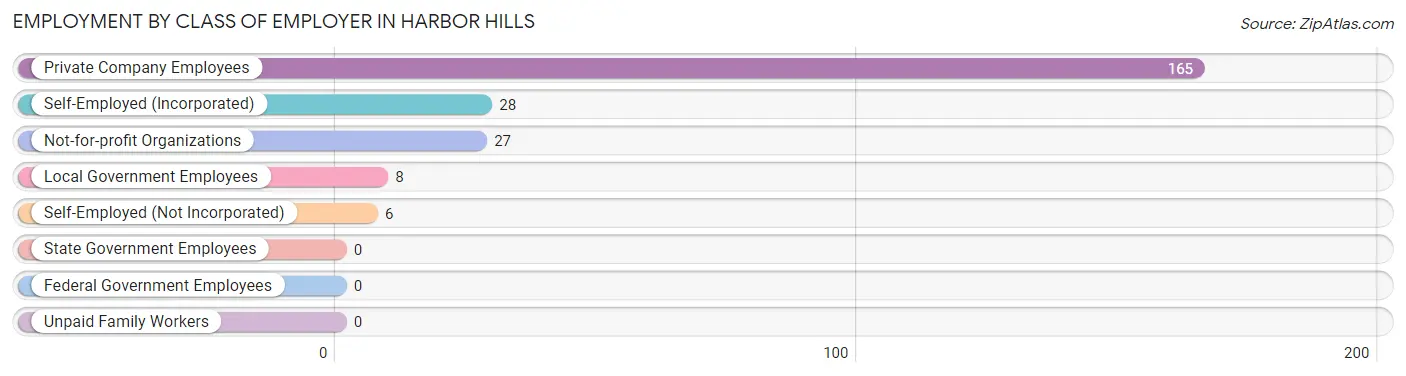
| Employer Class | # Employees | % Employees |
| Private Company Employees | 165 | 70.5% |
| Self-Employed (Incorporated) | 28 | 12.0% |
| Self-Employed (Not Incorporated) | 6 | 2.6% |
| Not-for-profit Organizations | 27 | 11.5% |
| Local Government Employees | 8 | 3.4% |
| State Government Employees | 0 | 0.0% |
| Federal Government Employees | 0 | 0.0% |
| Unpaid Family Workers | 0 | 0.0% |
| Total | 234 | 100.0% |
Employment Status by Age in Harbor Hills
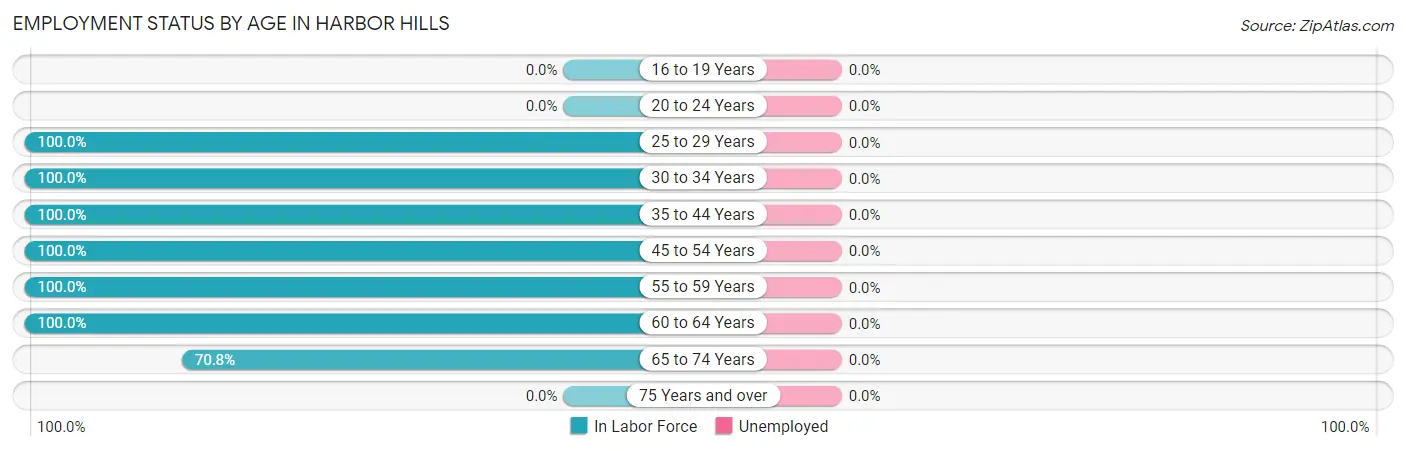
| Age Bracket | In Labor Force | Unemployed |
| 16 to 19 Years | 0 (0.0%) | 0 (0.0%) |
| 20 to 24 Years | 0 (0.0%) | 0 (0.0%) |
| 25 to 29 Years | 16 (100.0%) | 0 (0.0%) |
| 30 to 34 Years | 46 (100.0%) | 0 (0.0%) |
| 35 to 44 Years | 53 (100.0%) | 0 (0.0%) |
| 45 to 54 Years | 27 (100.0%) | 0 (0.0%) |
| 55 to 59 Years | 16 (100.0%) | 0 (0.0%) |
| 60 to 64 Years | 13 (100.0%) | 0 (0.0%) |
| 65 to 74 Years | 63 (70.8%) | 0 (0.0%) |
| 75 Years and over | 0 (0.0%) | 0 (0.0%) |
| Total | 234 (78.5%) | 0 (0.0%) |
Employment Status by Educational Attainment in Harbor Hills
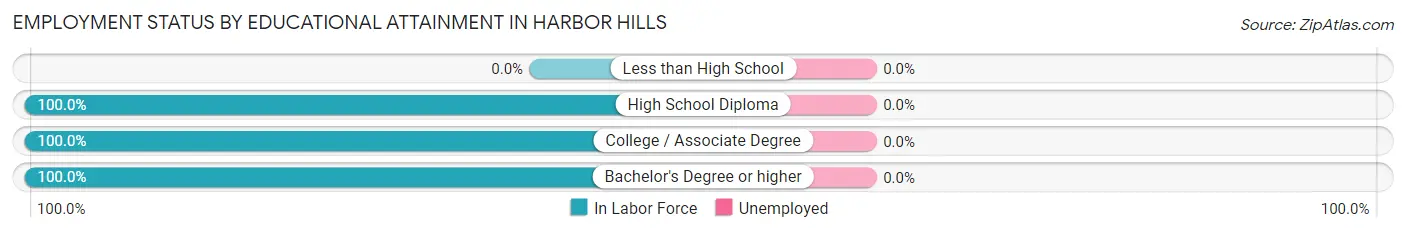
| Educational Attainment | In Labor Force | Unemployed |
| Less than High School | 0 (0.0%) | 0 (0.0%) |
| High School Diploma | 12 (100.0%) | 0 (0.0%) |
| College / Associate Degree | 16 (100.0%) | 0 (0.0%) |
| Bachelor's Degree or higher | 143 (100.0%) | 0 (0.0%) |
| Total | 171 (100.0%) | 0 (0.0%) |
Employment Occupations by Sex in Harbor Hills
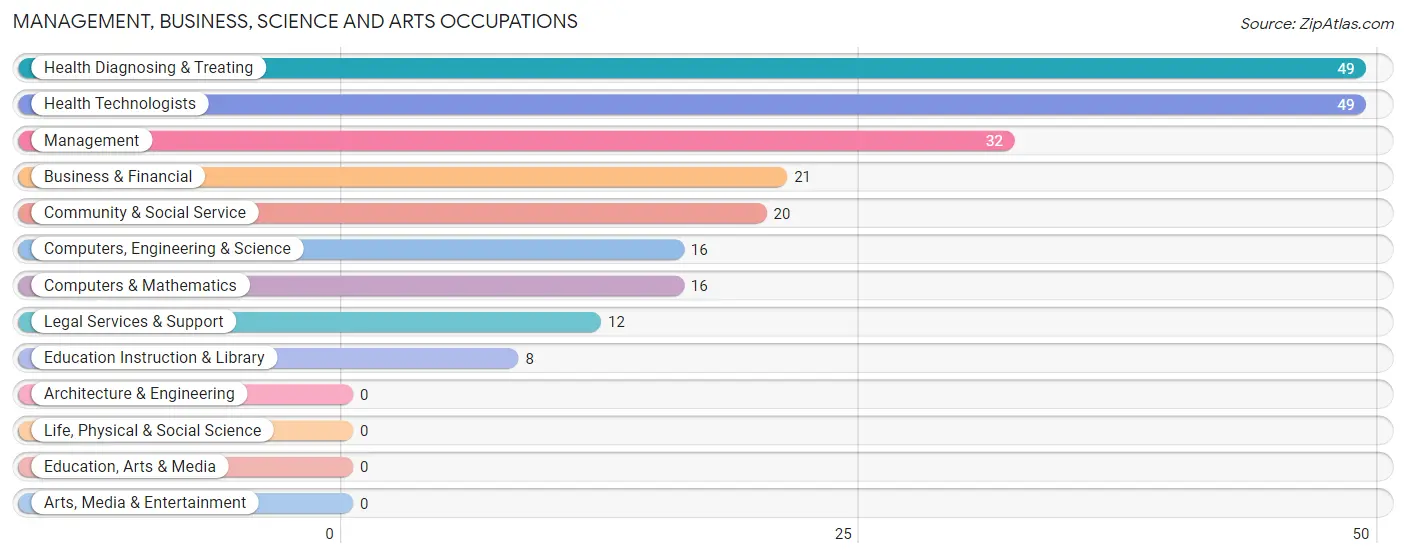
Management, Business, Science and Arts Occupations
The most common Management, Business, Science and Arts occupations in Harbor Hills are Health Diagnosing & Treating (49 | 20.9%), Health Technologists (49 | 20.9%), Management (32 | 13.7%), Business & Financial (21 | 9.0%), and Community & Social Service (20 | 8.6%).
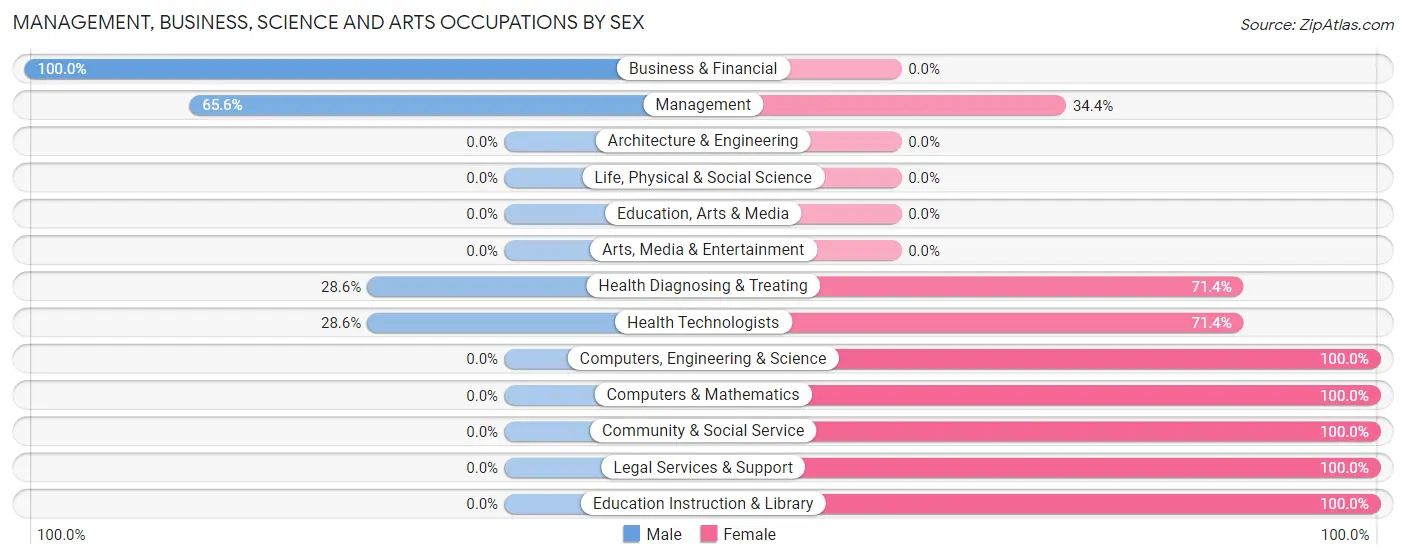
Management, Business, Science and Arts Occupations by Sex
Within the Management, Business, Science and Arts occupations in Harbor Hills, the most male-oriented occupations are Business & Financial (100.0%), Management (65.6%), and Health Diagnosing & Treating (28.6%), while the most female-oriented occupations are Computers, Engineering & Science (100.0%), Computers & Mathematics (100.0%), and Community & Social Service (100.0%).
| Occupation | Male | Female |
| Management | 21 (65.6%) | 11 (34.4%) |
| Business & Financial | 21 (100.0%) | 0 (0.0%) |
| Computers, Engineering & Science | 0 (0.0%) | 16 (100.0%) |
| Computers & Mathematics | 0 (0.0%) | 16 (100.0%) |
| Architecture & Engineering | 0 (0.0%) | 0 (0.0%) |
| Life, Physical & Social Science | 0 (0.0%) | 0 (0.0%) |
| Community & Social Service | 0 (0.0%) | 20 (100.0%) |
| Education, Arts & Media | 0 (0.0%) | 0 (0.0%) |
| Legal Services & Support | 0 (0.0%) | 12 (100.0%) |
| Education Instruction & Library | 0 (0.0%) | 8 (100.0%) |
| Arts, Media & Entertainment | 0 (0.0%) | 0 (0.0%) |
| Health Diagnosing & Treating | 14 (28.6%) | 35 (71.4%) |
| Health Technologists | 14 (28.6%) | 35 (71.4%) |
| Total (Category) | 56 (40.6%) | 82 (59.4%) |
| Total (Overall) | 99 (42.3%) | 135 (57.7%) |
Services Occupations
Services Occupations by Sex
| Occupation | Male | Female |
| Healthcare Support | 0 (0.0%) | 0 (0.0%) |
| Security & Protection | 0 (0.0%) | 0 (0.0%) |
| Firefighting & Prevention | 0 (0.0%) | 0 (0.0%) |
| Law Enforcement | 0 (0.0%) | 0 (0.0%) |
| Food Preparation & Serving | 0 (0.0%) | 0 (0.0%) |
| Cleaning & Maintenance | 0 (0.0%) | 0 (0.0%) |
| Personal Care & Service | 0 (0.0%) | 0 (0.0%) |
| Total (Category) | 0 (0.0%) | 0 (0.0%) |
| Total (Overall) | 99 (42.3%) | 135 (57.7%) |
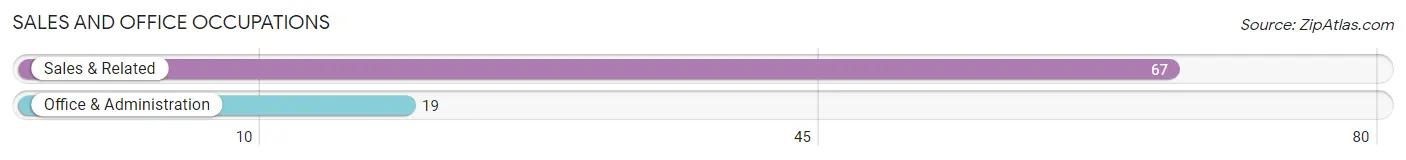
Sales and Office Occupations
The most common Sales and Office occupations in Harbor Hills are Sales & Related (67 | 28.6%), and Office & Administration (19 | 8.1%).
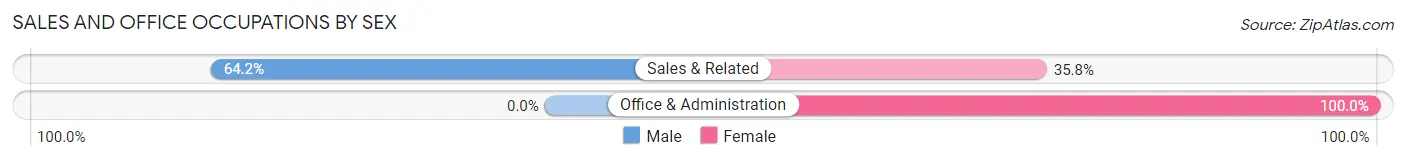
Sales and Office Occupations by Sex
| Occupation | Male | Female |
| Sales & Related | 43 (64.2%) | 24 (35.8%) |
| Office & Administration | 0 (0.0%) | 19 (100.0%) |
| Total (Category) | 43 (50.0%) | 43 (50.0%) |
| Total (Overall) | 99 (42.3%) | 135 (57.7%) |
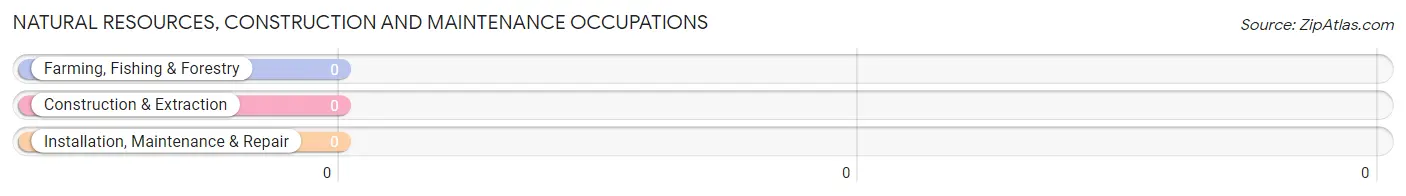
Natural Resources, Construction and Maintenance Occupations
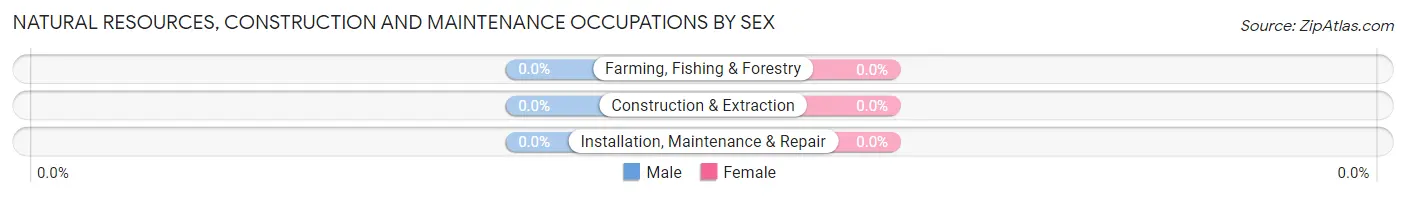
Natural Resources, Construction and Maintenance Occupations by Sex
| Occupation | Male | Female |
| Farming, Fishing & Forestry | 0 (0.0%) | 0 (0.0%) |
| Construction & Extraction | 0 (0.0%) | 0 (0.0%) |
| Installation, Maintenance & Repair | 0 (0.0%) | 0 (0.0%) |
| Total (Category) | 0 (0.0%) | 0 (0.0%) |
| Total (Overall) | 99 (42.3%) | 135 (57.7%) |
Production, Transportation and Moving Occupations
The most common Production, Transportation and Moving occupations in Harbor Hills are , and Material Moving (10 | 4.3%).
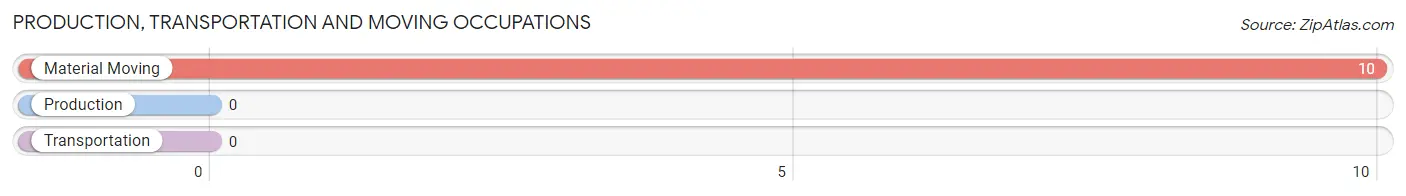
Production, Transportation and Moving Occupations by Sex
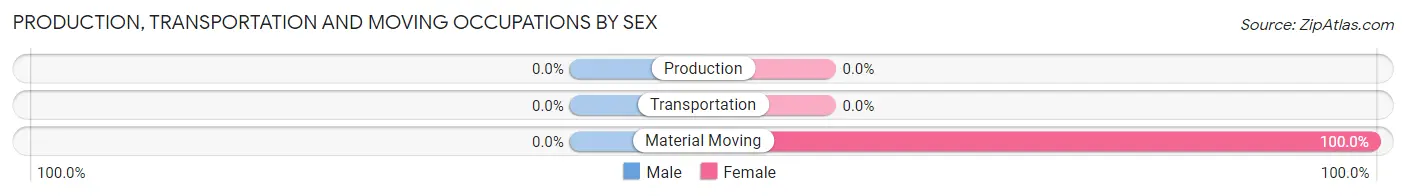
| Occupation | Male | Female |
| Production | 0 (0.0%) | 0 (0.0%) |
| Transportation | 0 (0.0%) | 0 (0.0%) |
| Material Moving | 0 (0.0%) | 10 (100.0%) |
| Total (Category) | 0 (0.0%) | 10 (100.0%) |
| Total (Overall) | 99 (42.3%) | 135 (57.7%) |
Employment Industries by Sex in Harbor Hills
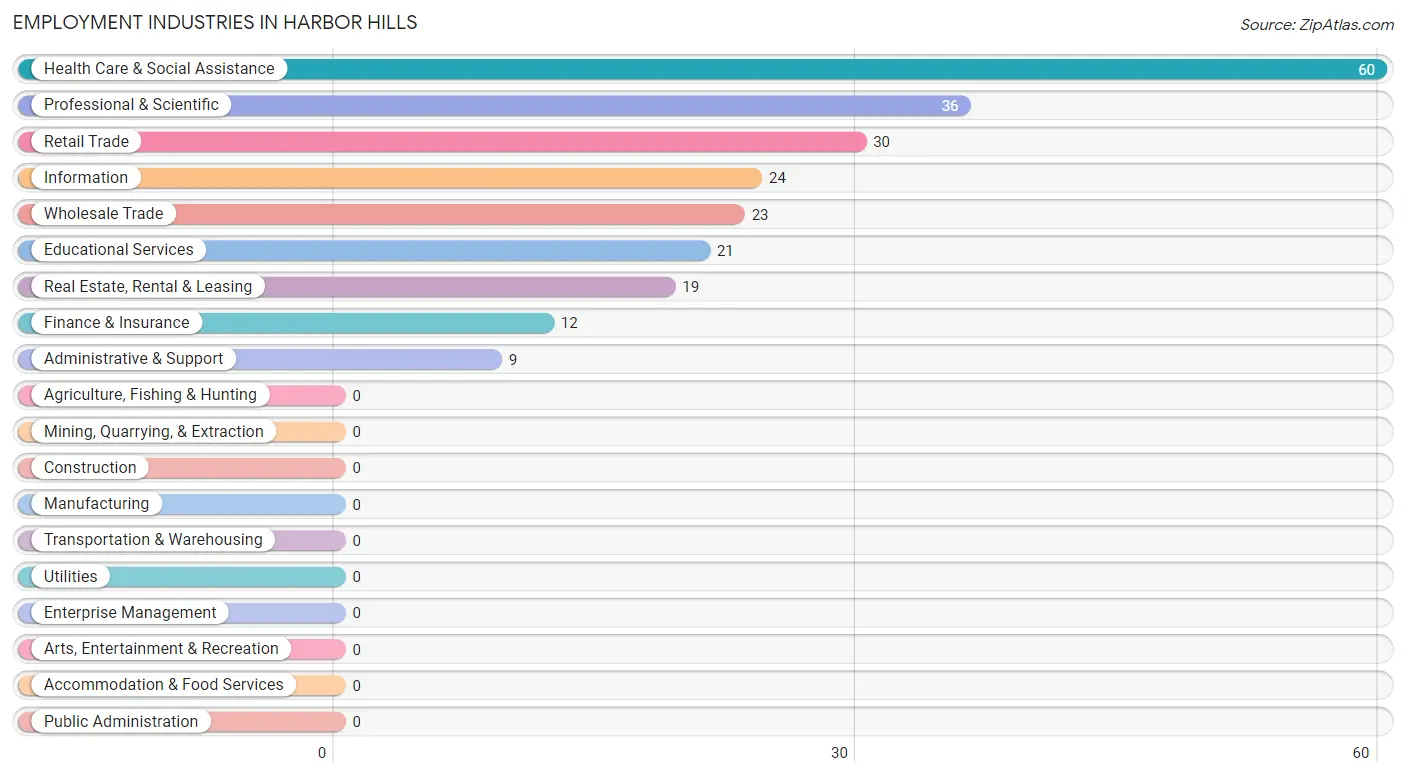
Employment Industries in Harbor Hills
The major employment industries in Harbor Hills include Health Care & Social Assistance (60 | 25.6%), Professional & Scientific (36 | 15.4%), Retail Trade (30 | 12.8%), Information (24 | 10.3%), and Wholesale Trade (23 | 9.8%).
Employment Industries by Sex in Harbor Hills
The Harbor Hills industries that see more men than women are Information (100.0%), Finance & Insurance (100.0%), and Administrative & Support (100.0%), whereas the industries that tend to have a higher number of women are Educational Services (100.0%), Retail Trade (80.0%), and Professional & Scientific (77.8%).
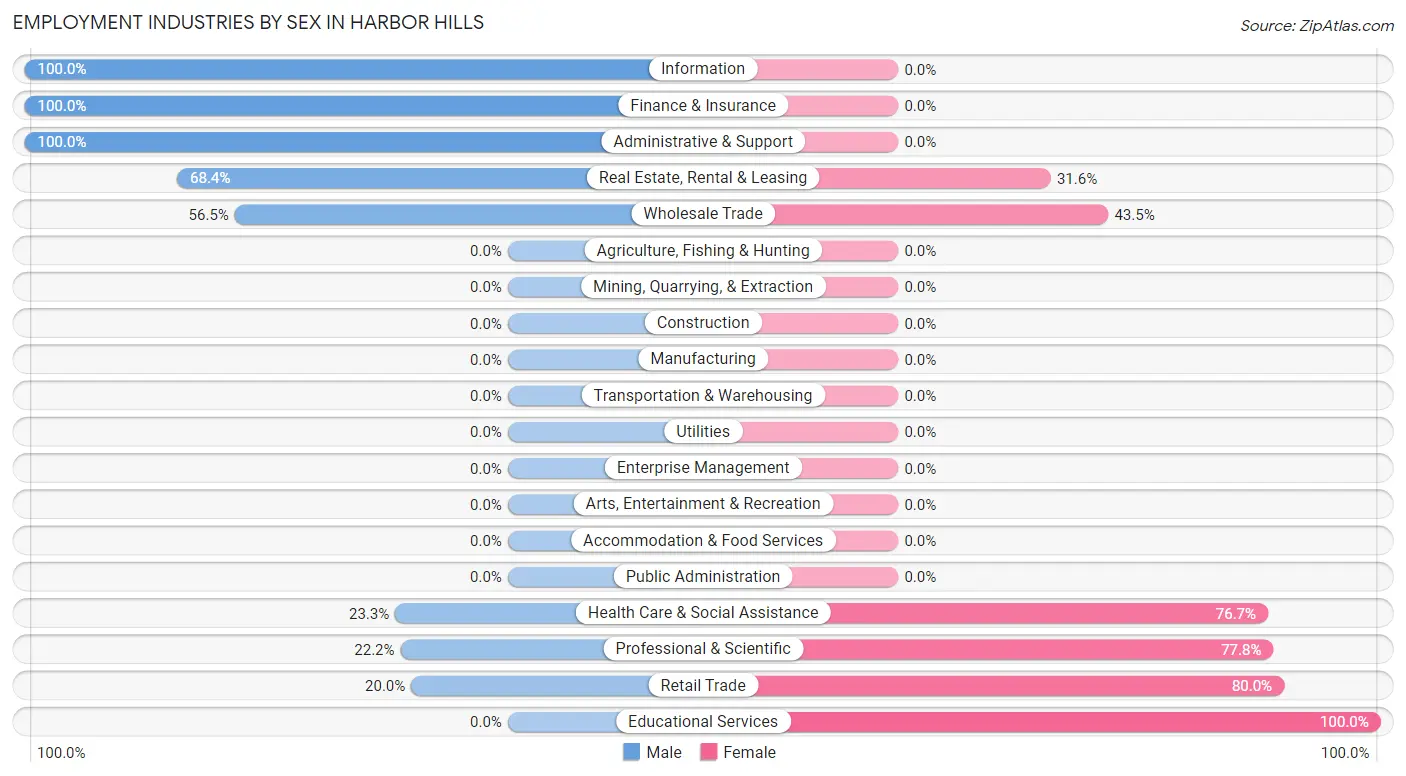
| Industry | Male | Female |
| Agriculture, Fishing & Hunting | 0 (0.0%) | 0 (0.0%) |
| Mining, Quarrying, & Extraction | 0 (0.0%) | 0 (0.0%) |
| Construction | 0 (0.0%) | 0 (0.0%) |
| Manufacturing | 0 (0.0%) | 0 (0.0%) |
| Wholesale Trade | 13 (56.5%) | 10 (43.5%) |
| Retail Trade | 6 (20.0%) | 24 (80.0%) |
| Transportation & Warehousing | 0 (0.0%) | 0 (0.0%) |
| Utilities | 0 (0.0%) | 0 (0.0%) |
| Information | 24 (100.0%) | 0 (0.0%) |
| Finance & Insurance | 12 (100.0%) | 0 (0.0%) |
| Real Estate, Rental & Leasing | 13 (68.4%) | 6 (31.6%) |
| Professional & Scientific | 8 (22.2%) | 28 (77.8%) |
| Enterprise Management | 0 (0.0%) | 0 (0.0%) |
| Administrative & Support | 9 (100.0%) | 0 (0.0%) |
| Educational Services | 0 (0.0%) | 21 (100.0%) |
| Health Care & Social Assistance | 14 (23.3%) | 46 (76.7%) |
| Arts, Entertainment & Recreation | 0 (0.0%) | 0 (0.0%) |
| Accommodation & Food Services | 0 (0.0%) | 0 (0.0%) |
| Public Administration | 0 (0.0%) | 0 (0.0%) |
| Total | 99 (42.3%) | 135 (57.7%) |
Education in Harbor Hills
School Enrollment in Harbor Hills
The most common levels of schooling among the 144 students in Harbor Hills are kindergarten (49 | 34.0%), elementary school (34 | 23.6%), and middle school (26 | 18.1%).
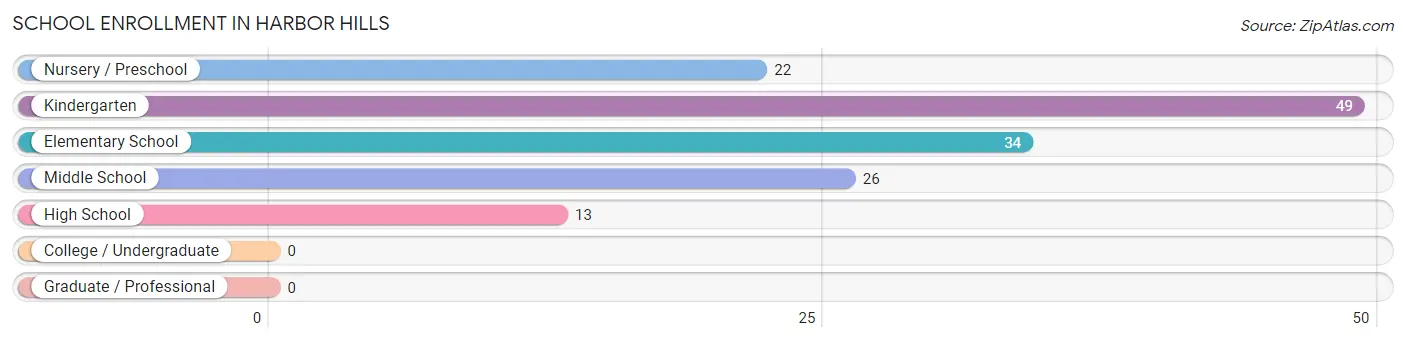
| School Level | # Students | % Students |
| Nursery / Preschool | 22 | 15.3% |
| Kindergarten | 49 | 34.0% |
| Elementary School | 34 | 23.6% |
| Middle School | 26 | 18.1% |
| High School | 13 | 9.0% |
| College / Undergraduate | 0 | 0.0% |
| Graduate / Professional | 0 | 0.0% |
| Total | 144 | 100.0% |
School Enrollment by Age by Funding Source in Harbor Hills
Out of a total of 144 students who are enrolled in schools in Harbor Hills, 32 (22.2%) attend a private institution, while the remaining 112 (77.8%) are enrolled in public schools. The age group of 5 to 9 year old has the highest likelihood of being enrolled in private schools, with 26 (31.3% in the age bracket) enrolled. Conversely, the age group of 3 to 4 year olds has the lowest likelihood of being enrolled in a private school, with 22 (100.0% in the age bracket) attending a public institution.
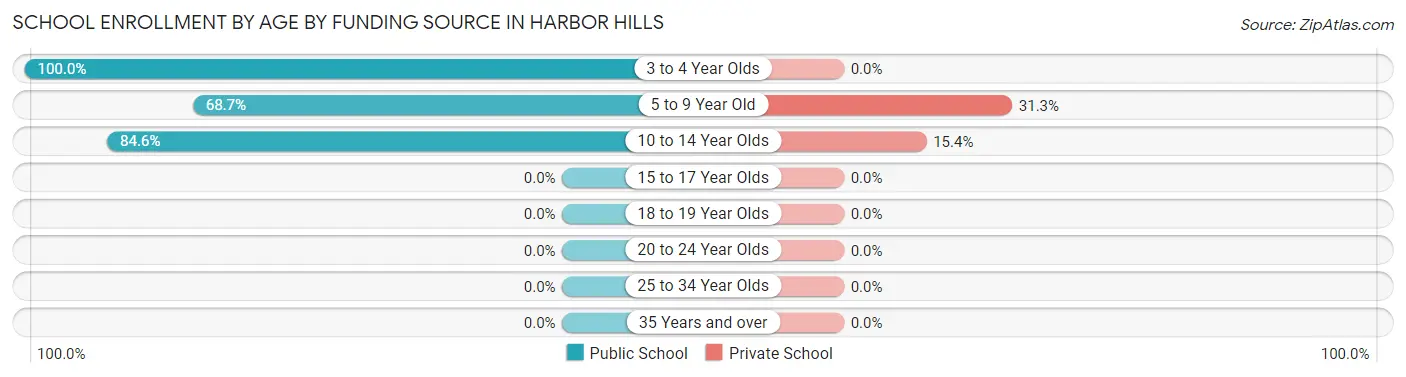
| Age Bracket | Public School | Private School |
| 3 to 4 Year Olds | 22 (100.0%) | 0 (0.0%) |
| 5 to 9 Year Old | 57 (68.7%) | 26 (31.3%) |
| 10 to 14 Year Olds | 33 (84.6%) | 6 (15.4%) |
| 15 to 17 Year Olds | 0 (0.0%) | 0 (0.0%) |
| 18 to 19 Year Olds | 0 (0.0%) | 0 (0.0%) |
| 20 to 24 Year Olds | 0 (0.0%) | 0 (0.0%) |
| 25 to 34 Year Olds | 0 (0.0%) | 0 (0.0%) |
| 35 Years and over | 0 (0.0%) | 0 (0.0%) |
| Total | 112 (77.8%) | 32 (22.2%) |
Educational Attainment by Field of Study in Harbor Hills
Literature & languages (78 | 30.9%), bio, nature & agricultural (49 | 19.4%), business (47 | 18.6%), social sciences (41 | 16.3%), and science & technology (24 | 9.5%) are the most common fields of study among 252 individuals in Harbor Hills who have obtained a bachelor's degree or higher.
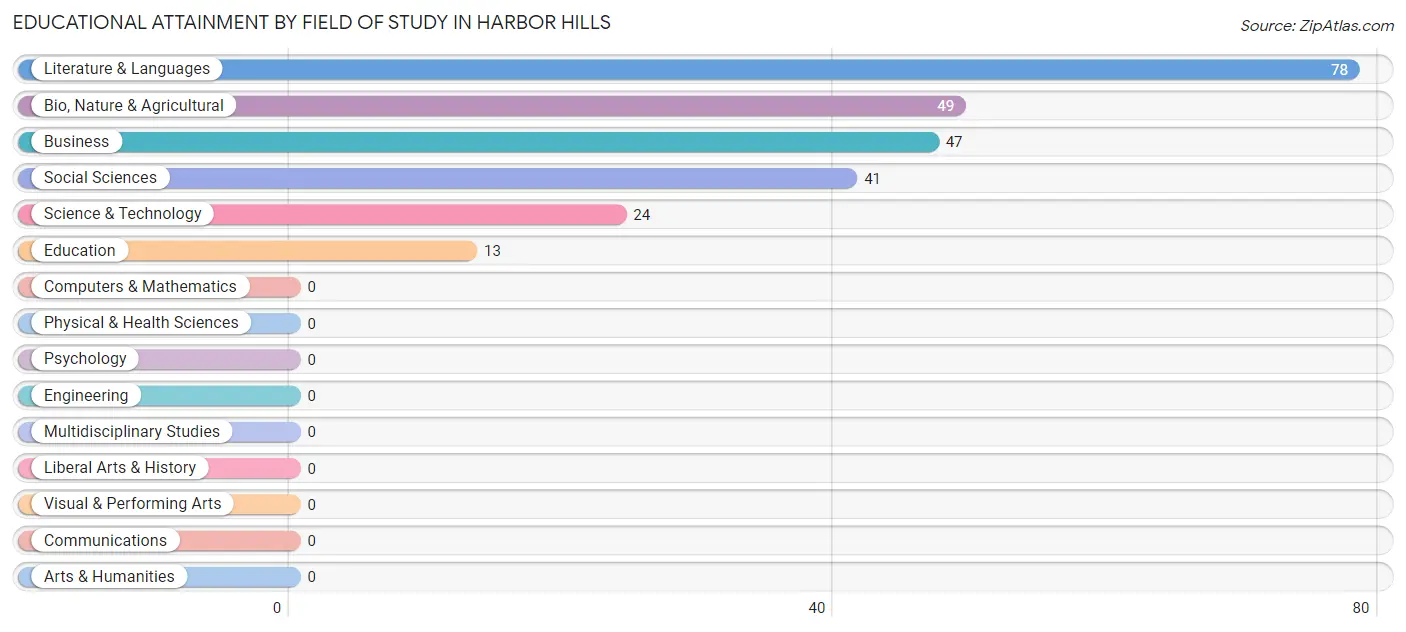
| Field of Study | # Graduates | % Graduates |
| Computers & Mathematics | 0 | 0.0% |
| Bio, Nature & Agricultural | 49 | 19.4% |
| Physical & Health Sciences | 0 | 0.0% |
| Psychology | 0 | 0.0% |
| Social Sciences | 41 | 16.3% |
| Engineering | 0 | 0.0% |
| Multidisciplinary Studies | 0 | 0.0% |
| Science & Technology | 24 | 9.5% |
| Business | 47 | 18.6% |
| Education | 13 | 5.2% |
| Literature & Languages | 78 | 30.9% |
| Liberal Arts & History | 0 | 0.0% |
| Visual & Performing Arts | 0 | 0.0% |
| Communications | 0 | 0.0% |
| Arts & Humanities | 0 | 0.0% |
| Total | 252 | 100.0% |
Transportation & Commute in Harbor Hills
Vehicle Availability by Sex in Harbor Hills
The most prevalent vehicle ownership categories in Harbor Hills are males with 2 vehicles (70, accounting for 70.7%) and females with 2 vehicles (73, making up 51.8%).
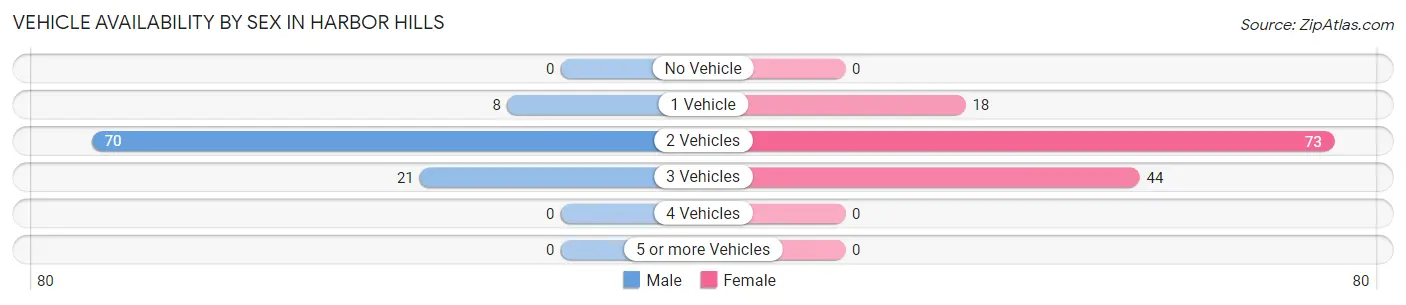
| Vehicles Available | Male | Female |
| No Vehicle | 0 (0.0%) | 0 (0.0%) |
| 1 Vehicle | 8 (8.1%) | 18 (13.3%) |
| 2 Vehicles | 70 (70.7%) | 73 (54.1%) |
| 3 Vehicles | 21 (21.2%) | 44 (32.6%) |
| 4 Vehicles | 0 (0.0%) | 0 (0.0%) |
| 5 or more Vehicles | 0 (0.0%) | 0 (0.0%) |
| Total | 99 (100.0%) | 135 (100.0%) |
Commute Time in Harbor Hills
The most frequently occuring commute durations in Harbor Hills are 60 to 89 minutes (64 commuters, 29.0%), 45 to 59 minutes (52 commuters, 23.5%), and 15 to 19 minutes (30 commuters, 13.6%).
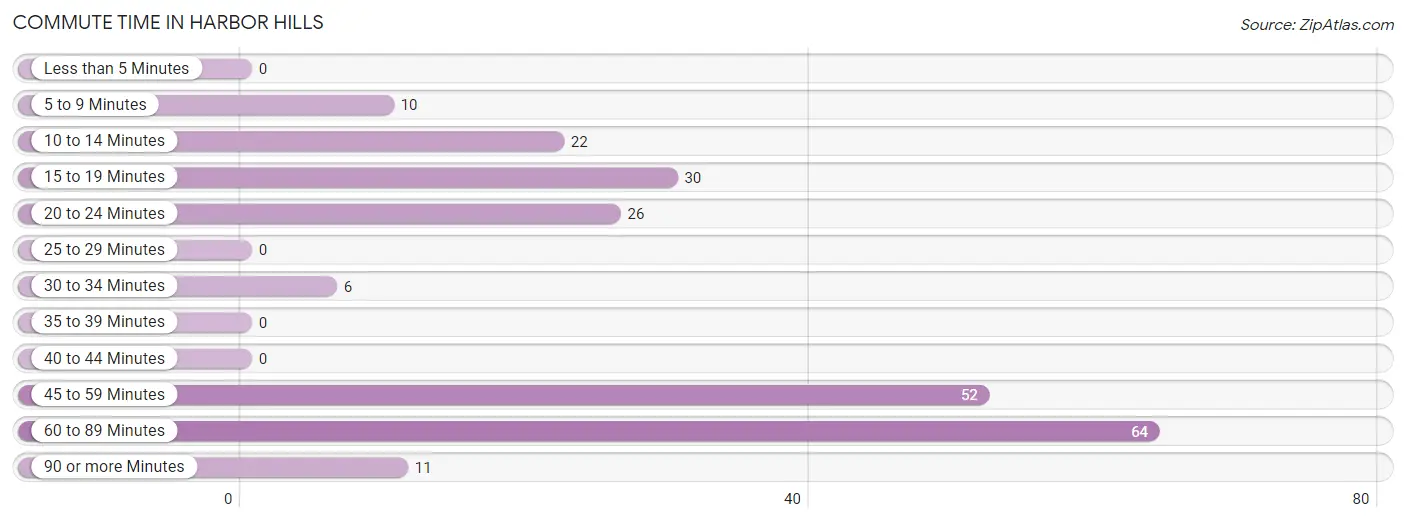
| Commute Time | # Commuters | % Commuters |
| Less than 5 Minutes | 0 | 0.0% |
| 5 to 9 Minutes | 10 | 4.5% |
| 10 to 14 Minutes | 22 | 10.0% |
| 15 to 19 Minutes | 30 | 13.6% |
| 20 to 24 Minutes | 26 | 11.8% |
| 25 to 29 Minutes | 0 | 0.0% |
| 30 to 34 Minutes | 6 | 2.7% |
| 35 to 39 Minutes | 0 | 0.0% |
| 40 to 44 Minutes | 0 | 0.0% |
| 45 to 59 Minutes | 52 | 23.5% |
| 60 to 89 Minutes | 64 | 29.0% |
| 90 or more Minutes | 11 | 5.0% |
Commute Time by Sex in Harbor Hills
The most common commute times in Harbor Hills are 60 to 89 minutes (24 commuters, 24.2%) for males and 45 to 59 minutes (40 commuters, 32.8%) for females.
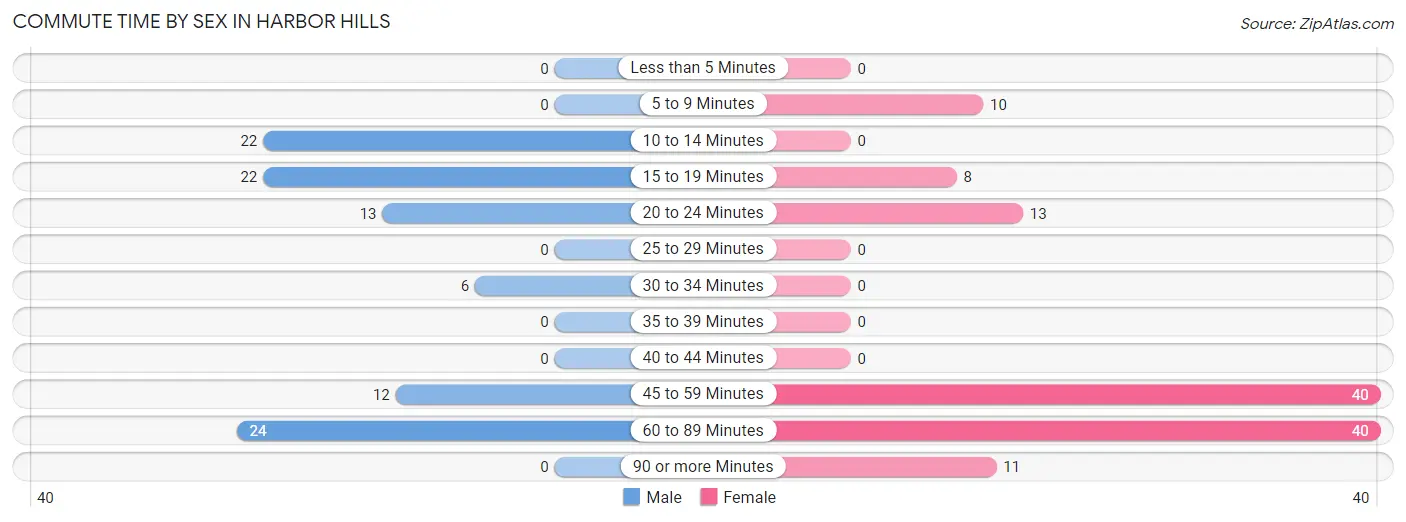
| Commute Time | Male | Female |
| Less than 5 Minutes | 0 (0.0%) | 0 (0.0%) |
| 5 to 9 Minutes | 0 (0.0%) | 10 (8.2%) |
| 10 to 14 Minutes | 22 (22.2%) | 0 (0.0%) |
| 15 to 19 Minutes | 22 (22.2%) | 8 (6.6%) |
| 20 to 24 Minutes | 13 (13.1%) | 13 (10.7%) |
| 25 to 29 Minutes | 0 (0.0%) | 0 (0.0%) |
| 30 to 34 Minutes | 6 (6.1%) | 0 (0.0%) |
| 35 to 39 Minutes | 0 (0.0%) | 0 (0.0%) |
| 40 to 44 Minutes | 0 (0.0%) | 0 (0.0%) |
| 45 to 59 Minutes | 12 (12.1%) | 40 (32.8%) |
| 60 to 89 Minutes | 24 (24.2%) | 40 (32.8%) |
| 90 or more Minutes | 0 (0.0%) | 11 (9.0%) |
Time of Departure to Work by Sex in Harbor Hills
The most frequent times of departure to work in Harbor Hills are 7:00 AM to 7:29 AM (47, 47.5%) for males and 9:00 AM to 9:59 AM (67, 54.9%) for females.
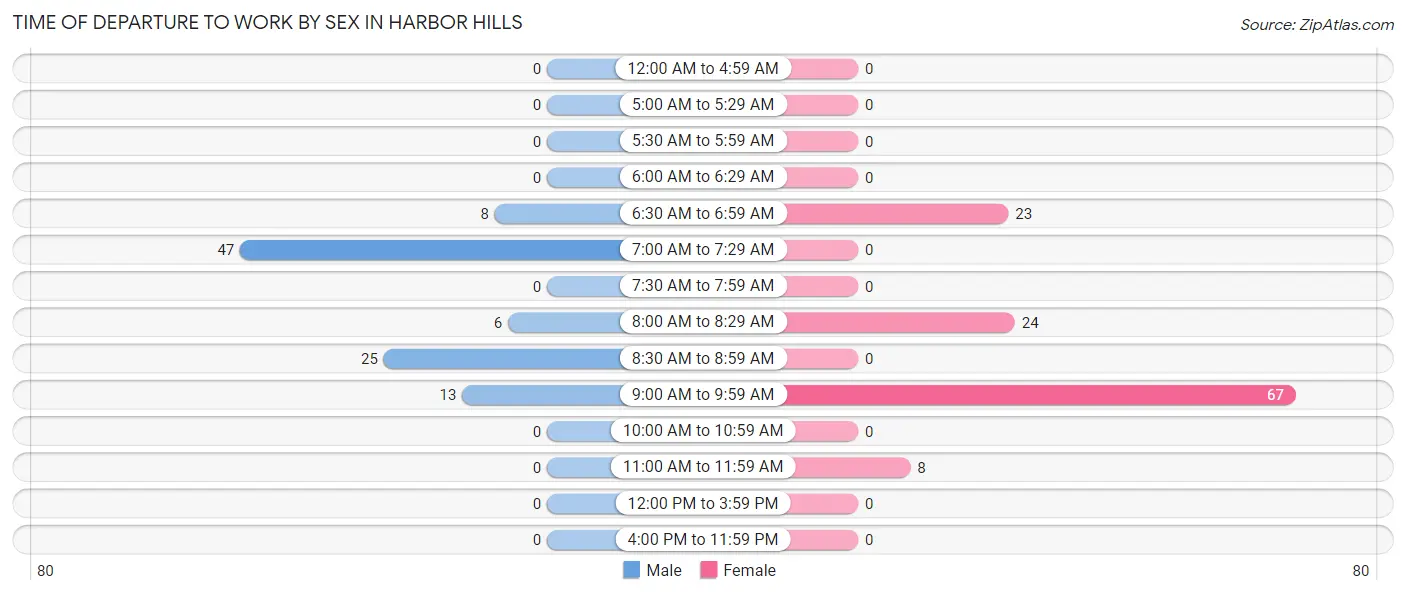
| Time of Departure | Male | Female |
| 12:00 AM to 4:59 AM | 0 (0.0%) | 0 (0.0%) |
| 5:00 AM to 5:29 AM | 0 (0.0%) | 0 (0.0%) |
| 5:30 AM to 5:59 AM | 0 (0.0%) | 0 (0.0%) |
| 6:00 AM to 6:29 AM | 0 (0.0%) | 0 (0.0%) |
| 6:30 AM to 6:59 AM | 8 (8.1%) | 23 (18.9%) |
| 7:00 AM to 7:29 AM | 47 (47.5%) | 0 (0.0%) |
| 7:30 AM to 7:59 AM | 0 (0.0%) | 0 (0.0%) |
| 8:00 AM to 8:29 AM | 6 (6.1%) | 24 (19.7%) |
| 8:30 AM to 8:59 AM | 25 (25.3%) | 0 (0.0%) |
| 9:00 AM to 9:59 AM | 13 (13.1%) | 67 (54.9%) |
| 10:00 AM to 10:59 AM | 0 (0.0%) | 0 (0.0%) |
| 11:00 AM to 11:59 AM | 0 (0.0%) | 8 (6.6%) |
| 12:00 PM to 3:59 PM | 0 (0.0%) | 0 (0.0%) |
| 4:00 PM to 11:59 PM | 0 (0.0%) | 0 (0.0%) |
| Total | 99 (100.0%) | 122 (100.0%) |
Housing Occupancy in Harbor Hills
Occupancy by Ownership in Harbor Hills
Of the total 159 dwellings in Harbor Hills, owner-occupied units account for 159 (100.0%), while renter-occupied units make up 0 (0.0%).
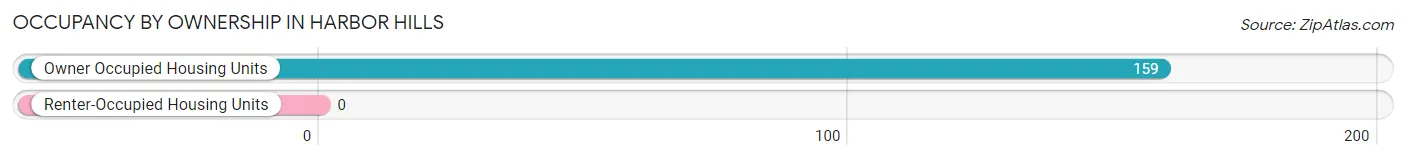
| Occupancy | # Housing Units | % Housing Units |
| Owner Occupied Housing Units | 159 | 100.0% |
| Renter-Occupied Housing Units | 0 | 0.0% |
| Total Occupied Housing Units | 159 | 100.0% |
Occupancy by Household Size in Harbor Hills
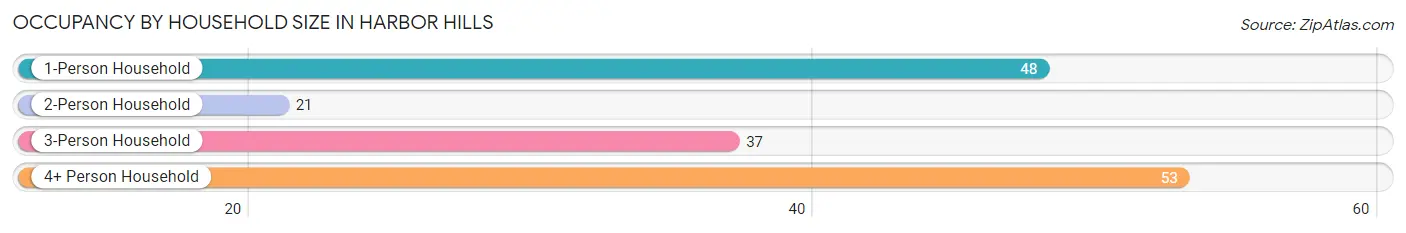
| Household Size | # Housing Units | % Housing Units |
| 1-Person Household | 48 | 30.2% |
| 2-Person Household | 21 | 13.2% |
| 3-Person Household | 37 | 23.3% |
| 4+ Person Household | 53 | 33.3% |
| Total Housing Units | 159 | 100.0% |
Occupancy by Ownership by Household Size in Harbor Hills
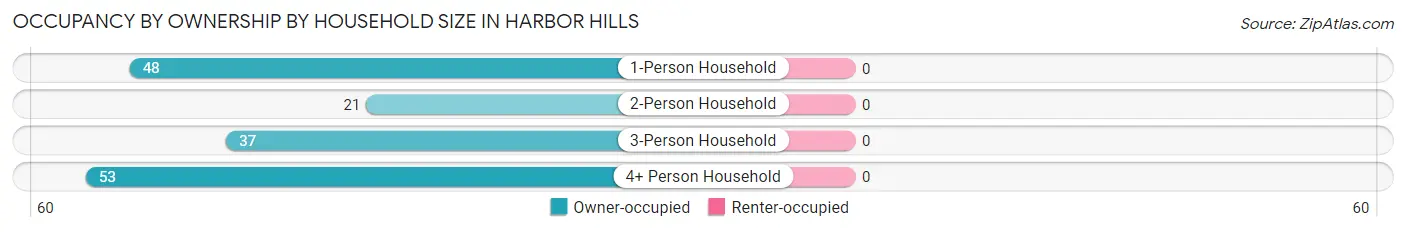
| Household Size | Owner-occupied | Renter-occupied |
| 1-Person Household | 48 (100.0%) | 0 (0.0%) |
| 2-Person Household | 21 (100.0%) | 0 (0.0%) |
| 3-Person Household | 37 (100.0%) | 0 (0.0%) |
| 4+ Person Household | 53 (100.0%) | 0 (0.0%) |
| Total Housing Units | 159 (100.0%) | 0 (0.0%) |
Occupancy by Educational Attainment in Harbor Hills
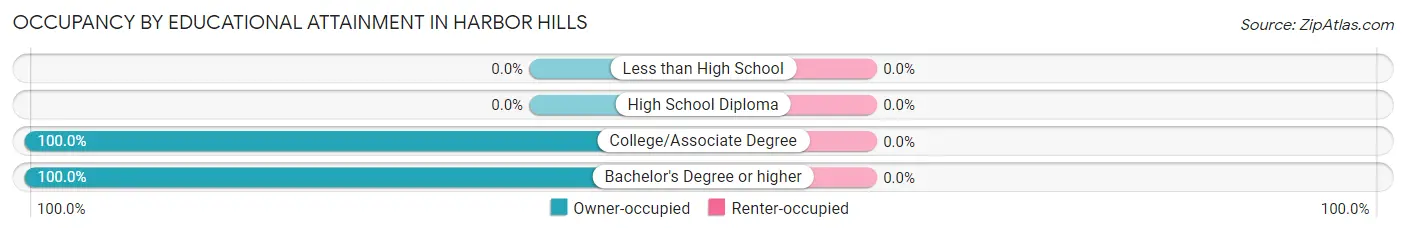
| Household Size | Owner-occupied | Renter-occupied |
| Less than High School | 0 (0.0%) | 0 (0.0%) |
| High School Diploma | 0 (0.0%) | 0 (0.0%) |
| College/Associate Degree | 10 (100.0%) | 0 (0.0%) |
| Bachelor's Degree or higher | 149 (100.0%) | 0 (0.0%) |
Occupancy by Age of Householder in Harbor Hills
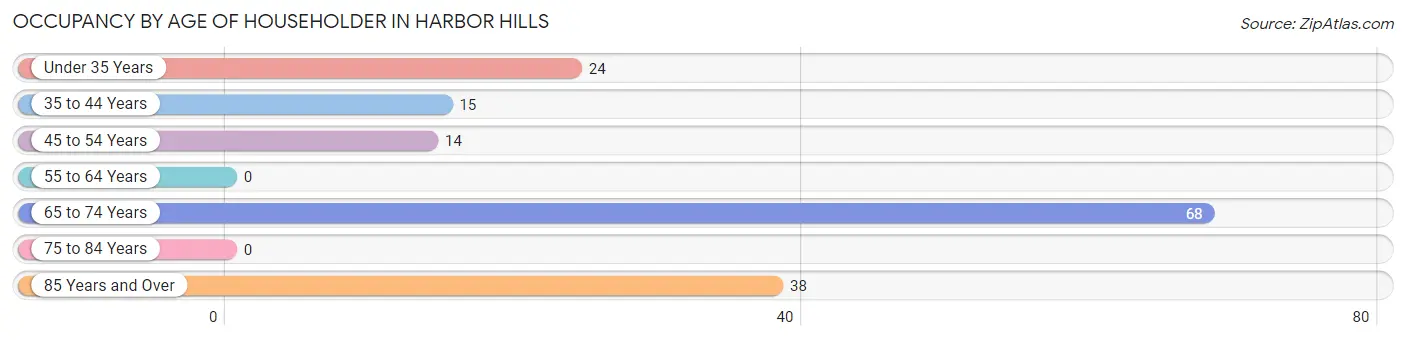
| Age Bracket | # Households | % Households |
| Under 35 Years | 24 | 15.1% |
| 35 to 44 Years | 15 | 9.4% |
| 45 to 54 Years | 14 | 8.8% |
| 55 to 64 Years | 0 | 0.0% |
| 65 to 74 Years | 68 | 42.8% |
| 75 to 84 Years | 0 | 0.0% |
| 85 Years and Over | 38 | 23.9% |
| Total | 159 | 100.0% |
Housing Finances in Harbor Hills
Median Income by Occupancy in Harbor Hills
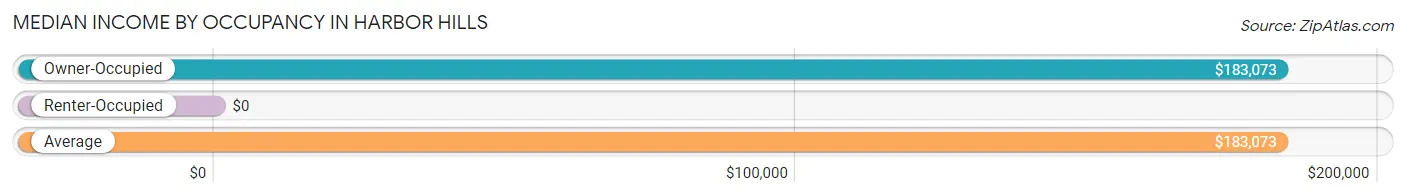
| Occupancy Type | # Households | Median Income |
| Owner-Occupied | 159 (100.0%) | $183,073 |
| Renter-Occupied | 0 (0.0%) | $0 |
| Average | 159 (100.0%) | $183,073 |
Occupancy by Householder Income Bracket in Harbor Hills
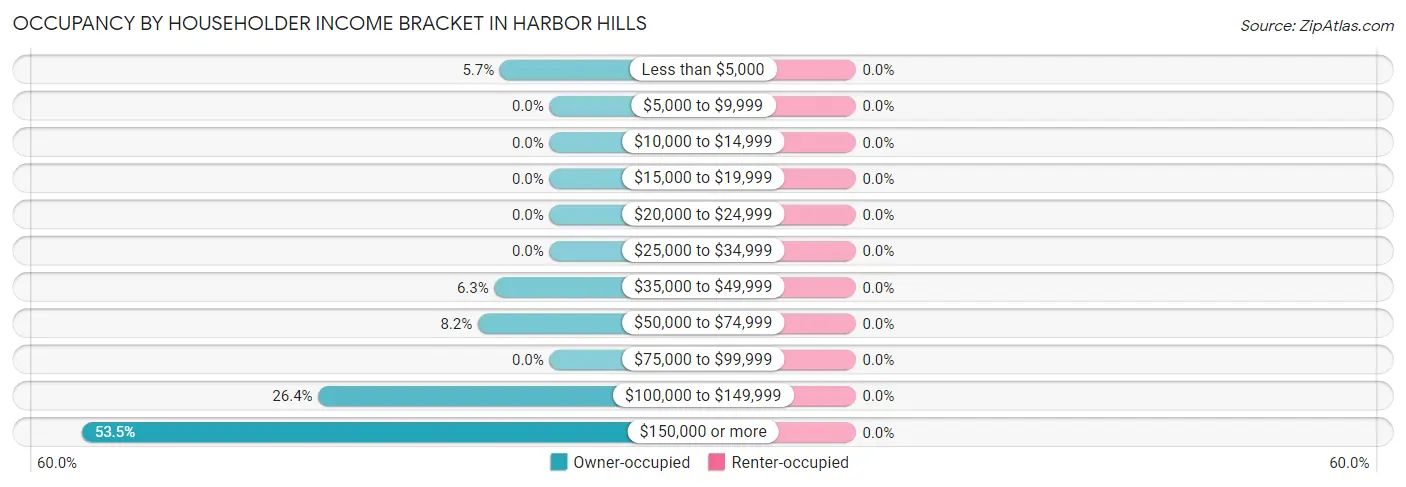
| Income Bracket | Owner-occupied | Renter-occupied |
| Less than $5,000 | 9 (5.7%) | 0 (0.0%) |
| $5,000 to $9,999 | 0 (0.0%) | 0 (0.0%) |
| $10,000 to $14,999 | 0 (0.0%) | 0 (0.0%) |
| $15,000 to $19,999 | 0 (0.0%) | 0 (0.0%) |
| $20,000 to $24,999 | 0 (0.0%) | 0 (0.0%) |
| $25,000 to $34,999 | 0 (0.0%) | 0 (0.0%) |
| $35,000 to $49,999 | 10 (6.3%) | 0 (0.0%) |
| $50,000 to $74,999 | 13 (8.2%) | 0 (0.0%) |
| $75,000 to $99,999 | 0 (0.0%) | 0 (0.0%) |
| $100,000 to $149,999 | 42 (26.4%) | 0 (0.0%) |
| $150,000 or more | 85 (53.5%) | 0 (0.0%) |
| Total | 159 (100.0%) | 0 (0.0%) |
Monthly Housing Cost Tiers in Harbor Hills
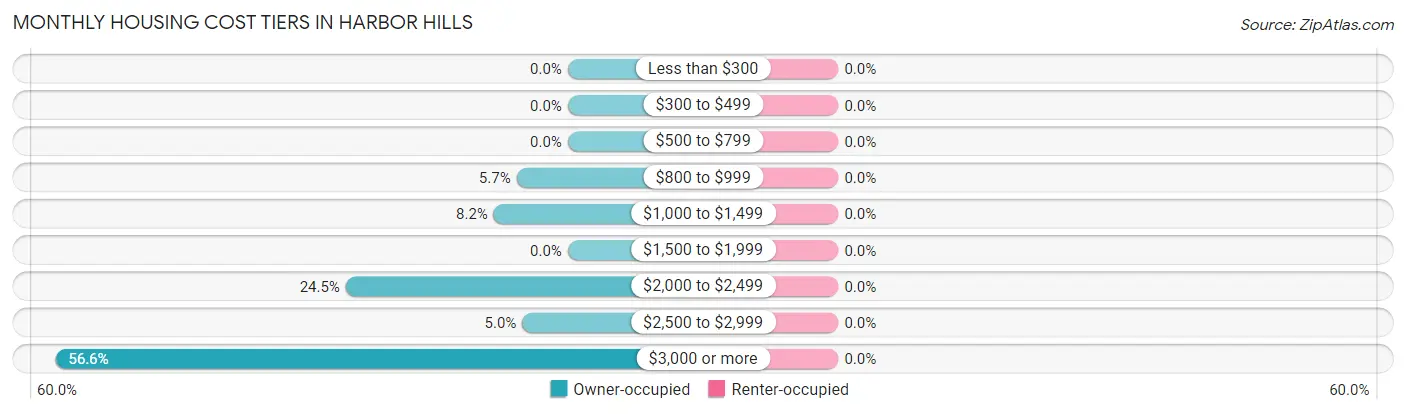
| Monthly Cost | Owner-occupied | Renter-occupied |
| Less than $300 | 0 (0.0%) | 0 (0.0%) |
| $300 to $499 | 0 (0.0%) | 0 (0.0%) |
| $500 to $799 | 0 (0.0%) | 0 (0.0%) |
| $800 to $999 | 9 (5.7%) | 0 (0.0%) |
| $1,000 to $1,499 | 13 (8.2%) | 0 (0.0%) |
| $1,500 to $1,999 | 0 (0.0%) | 0 (0.0%) |
| $2,000 to $2,499 | 39 (24.5%) | 0 (0.0%) |
| $2,500 to $2,999 | 8 (5.0%) | 0 (0.0%) |
| $3,000 or more | 90 (56.6%) | 0 (0.0%) |
| Total | 159 (100.0%) | 0 (0.0%) |
Physical Housing Characteristics in Harbor Hills
Housing Structures in Harbor Hills
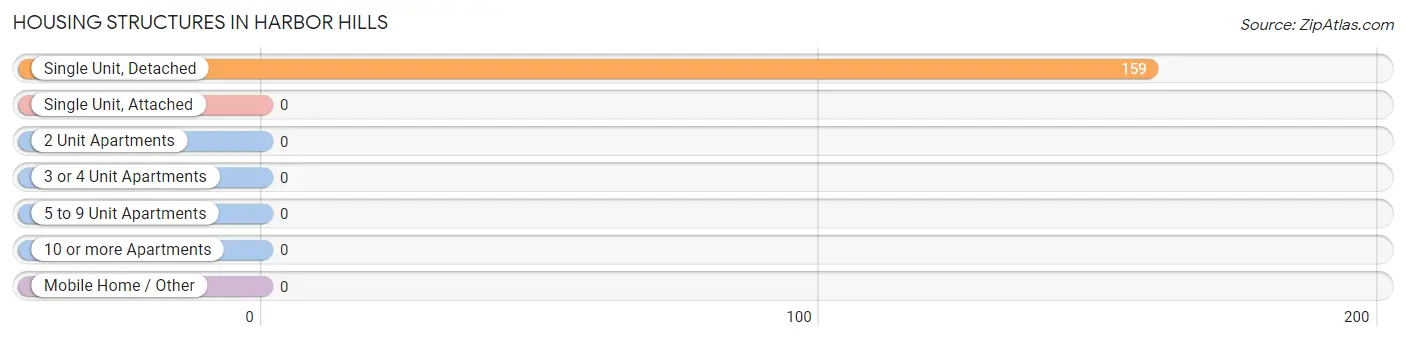
| Structure Type | # Housing Units | % Housing Units |
| Single Unit, Detached | 159 | 100.0% |
| Single Unit, Attached | 0 | 0.0% |
| 2 Unit Apartments | 0 | 0.0% |
| 3 or 4 Unit Apartments | 0 | 0.0% |
| 5 to 9 Unit Apartments | 0 | 0.0% |
| 10 or more Apartments | 0 | 0.0% |
| Mobile Home / Other | 0 | 0.0% |
| Total | 159 | 100.0% |
Housing Structures by Occupancy in Harbor Hills
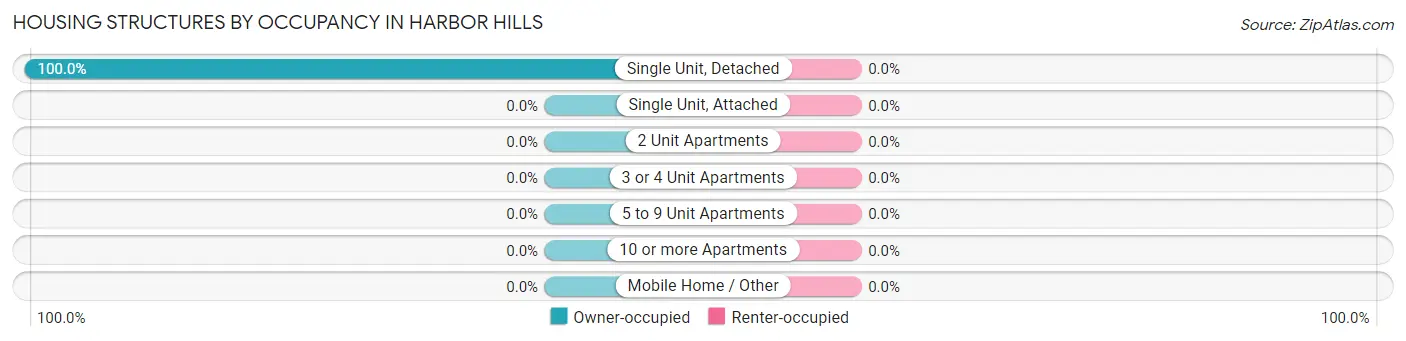
| Structure Type | Owner-occupied | Renter-occupied |
| Single Unit, Detached | 159 (100.0%) | 0 (0.0%) |
| Single Unit, Attached | 0 (0.0%) | 0 (0.0%) |
| 2 Unit Apartments | 0 (0.0%) | 0 (0.0%) |
| 3 or 4 Unit Apartments | 0 (0.0%) | 0 (0.0%) |
| 5 to 9 Unit Apartments | 0 (0.0%) | 0 (0.0%) |
| 10 or more Apartments | 0 (0.0%) | 0 (0.0%) |
| Mobile Home / Other | 0 (0.0%) | 0 (0.0%) |
| Total | 159 (100.0%) | 0 (0.0%) |
Housing Structures by Number of Rooms in Harbor Hills
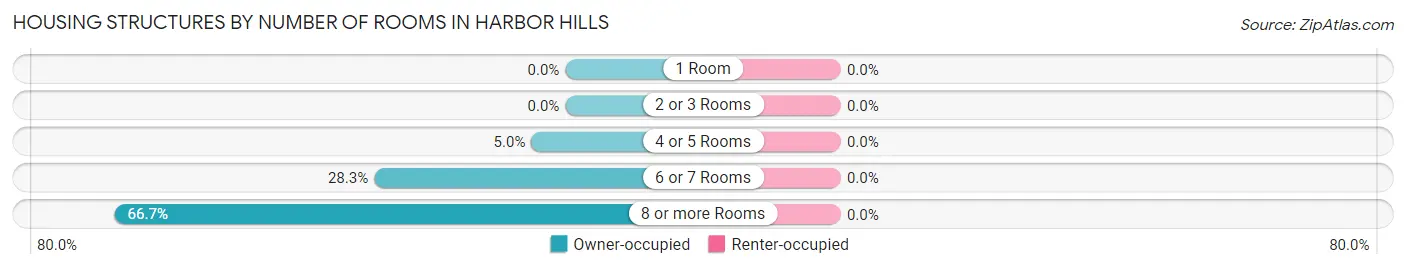
| Number of Rooms | Owner-occupied | Renter-occupied |
| 1 Room | 0 (0.0%) | 0 (0.0%) |
| 2 or 3 Rooms | 0 (0.0%) | 0 (0.0%) |
| 4 or 5 Rooms | 8 (5.0%) | 0 (0.0%) |
| 6 or 7 Rooms | 45 (28.3%) | 0 (0.0%) |
| 8 or more Rooms | 106 (66.7%) | 0 (0.0%) |
| Total | 159 (100.0%) | 0 (0.0%) |
Housing Structure by Heating Type in Harbor Hills
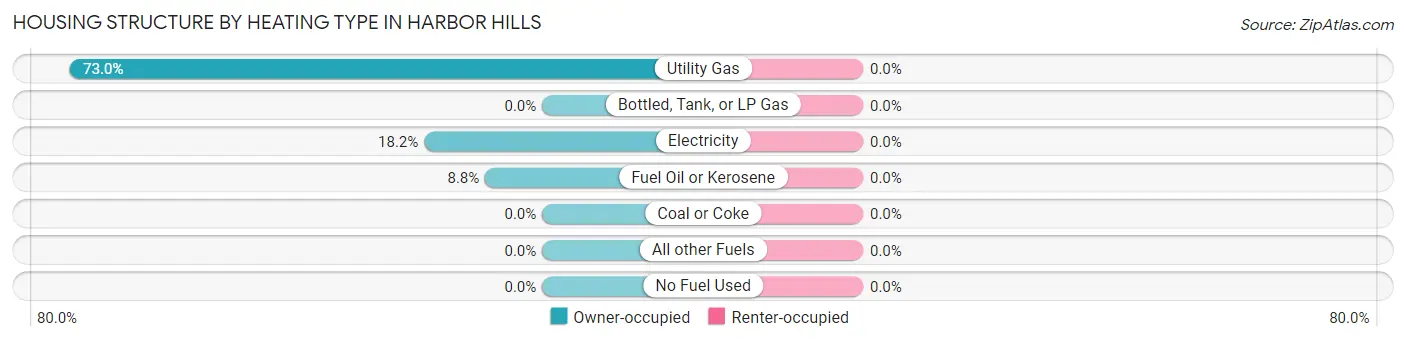
| Heating Type | Owner-occupied | Renter-occupied |
| Utility Gas | 116 (73.0%) | 0 (0.0%) |
| Bottled, Tank, or LP Gas | 0 (0.0%) | 0 (0.0%) |
| Electricity | 29 (18.2%) | 0 (0.0%) |
| Fuel Oil or Kerosene | 14 (8.8%) | 0 (0.0%) |
| Coal or Coke | 0 (0.0%) | 0 (0.0%) |
| All other Fuels | 0 (0.0%) | 0 (0.0%) |
| No Fuel Used | 0 (0.0%) | 0 (0.0%) |
| Total | 159 (100.0%) | 0 (0.0%) |
Household Vehicle Usage in Harbor Hills
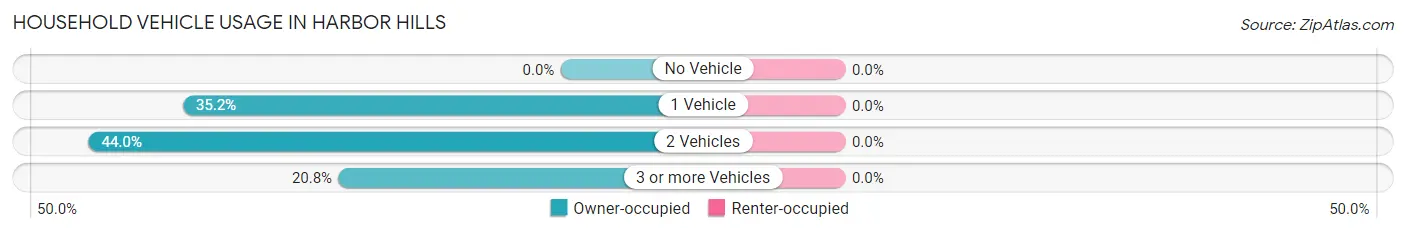
| Vehicles per Household | Owner-occupied | Renter-occupied |
| No Vehicle | 0 (0.0%) | 0 (0.0%) |
| 1 Vehicle | 56 (35.2%) | 0 (0.0%) |
| 2 Vehicles | 70 (44.0%) | 0 (0.0%) |
| 3 or more Vehicles | 33 (20.7%) | 0 (0.0%) |
| Total | 159 (100.0%) | 0 (0.0%) |
Real Estate & Mortgages in Harbor Hills
Real Estate and Mortgage Overview in Harbor Hills
| Characteristic | Without Mortgage | With Mortgage |
| Housing Units | 61 | 98 |
| Median Property Value | - | - |
| Median Household Income | $103,491 | $72 |
| Monthly Housing Costs | $1,501 | $90 |
| Real Estate Taxes | $10,001 | $0 |
Property Value by Mortgage Status in Harbor Hills
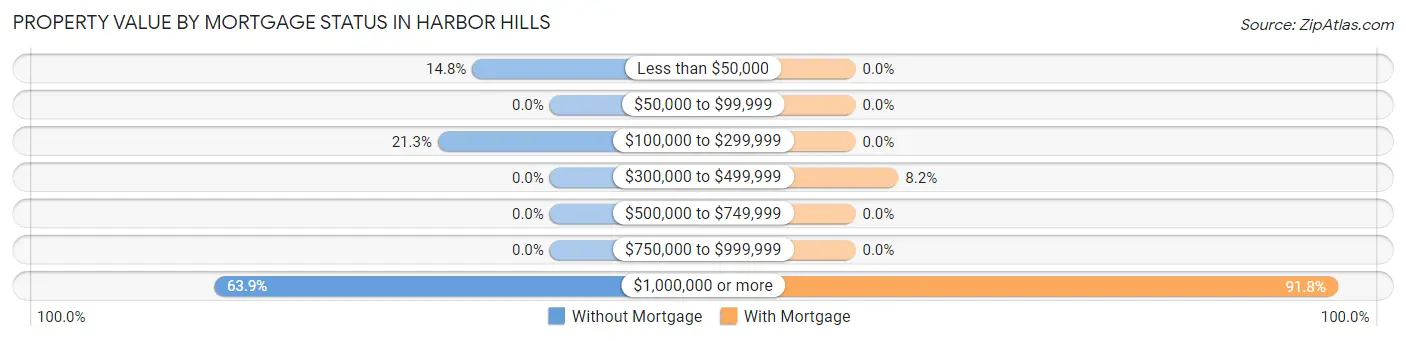
| Property Value | Without Mortgage | With Mortgage |
| Less than $50,000 | 9 (14.7%) | 0 (0.0%) |
| $50,000 to $99,999 | 0 (0.0%) | 0 (0.0%) |
| $100,000 to $299,999 | 13 (21.3%) | 0 (0.0%) |
| $300,000 to $499,999 | 0 (0.0%) | 8 (8.2%) |
| $500,000 to $749,999 | 0 (0.0%) | 0 (0.0%) |
| $750,000 to $999,999 | 0 (0.0%) | 0 (0.0%) |
| $1,000,000 or more | 39 (63.9%) | 90 (91.8%) |
| Total | 61 (100.0%) | 98 (100.0%) |
Household Income by Mortgage Status in Harbor Hills
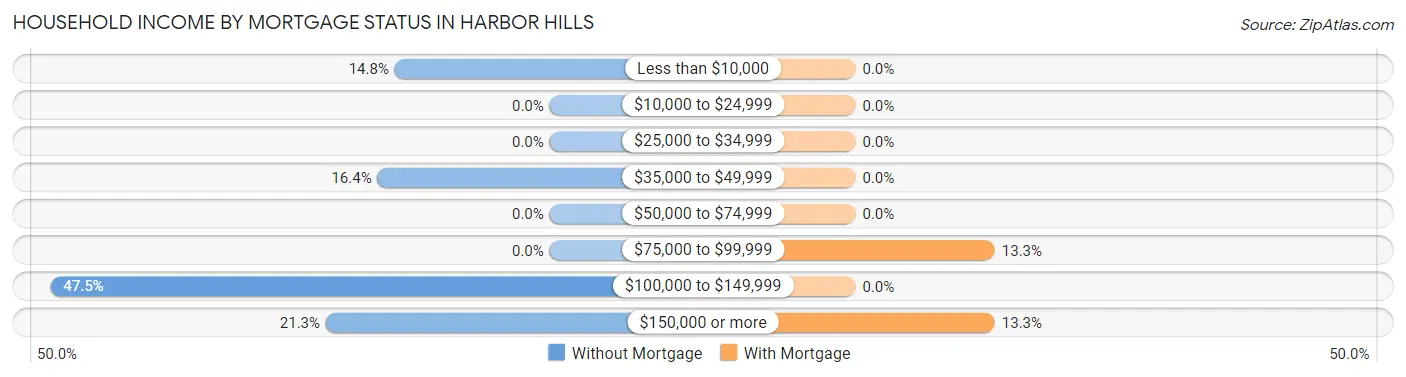
| Household Income | Without Mortgage | With Mortgage |
| Less than $10,000 | 9 (14.7%) | 0 (0.0%) |
| $10,000 to $24,999 | 0 (0.0%) | 0 (0.0%) |
| $25,000 to $34,999 | 0 (0.0%) | 0 (0.0%) |
| $35,000 to $49,999 | 10 (16.4%) | 0 (0.0%) |
| $50,000 to $74,999 | 0 (0.0%) | 0 (0.0%) |
| $75,000 to $99,999 | 0 (0.0%) | 13 (13.3%) |
| $100,000 to $149,999 | 29 (47.5%) | 0 (0.0%) |
| $150,000 or more | 13 (21.3%) | 13 (13.3%) |
| Total | 61 (100.0%) | 98 (100.0%) |
Property Value to Household Income Ratio in Harbor Hills
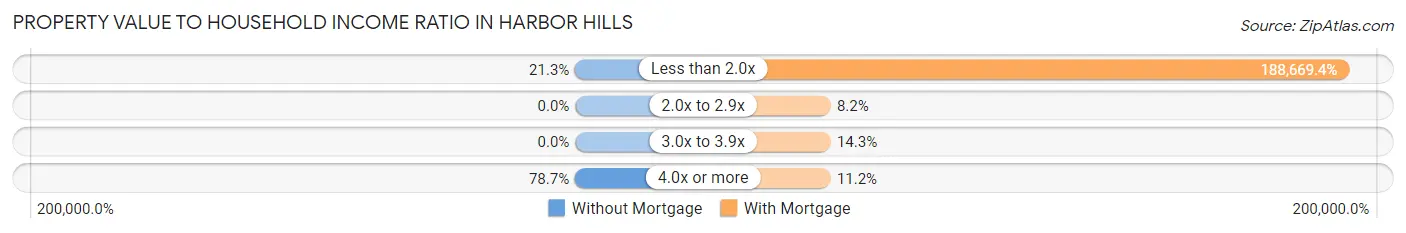
| Value-to-Income Ratio | Without Mortgage | With Mortgage |
| Less than 2.0x | 13 (21.3%) | 184,896 (188,669.4%) |
| 2.0x to 2.9x | 0 (0.0%) | 8 (8.2%) |
| 3.0x to 3.9x | 0 (0.0%) | 14 (14.3%) |
| 4.0x or more | 48 (78.7%) | 11 (11.2%) |
| Total | 61 (100.0%) | 98 (100.0%) |
Real Estate Taxes by Mortgage Status in Harbor Hills
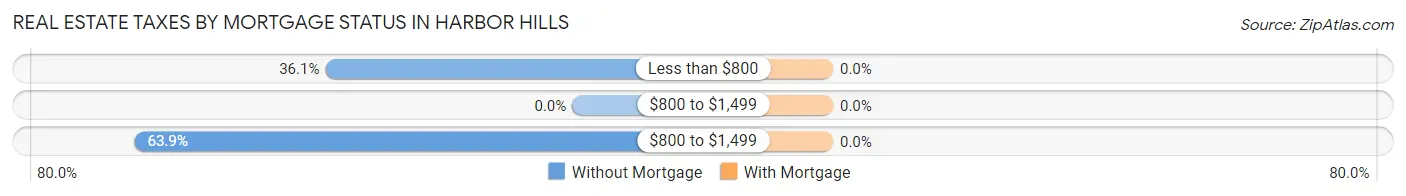
| Property Taxes | Without Mortgage | With Mortgage |
| Less than $800 | 22 (36.1%) | 0 (0.0%) |
| $800 to $1,499 | 0 (0.0%) | 0 (0.0%) |
| $800 to $1,499 | 39 (63.9%) | 0 (0.0%) |
| Total | 61 (100.0%) | 98 (100.0%) |
Health & Disability in Harbor Hills
Health Insurance Coverage by Age in Harbor Hills
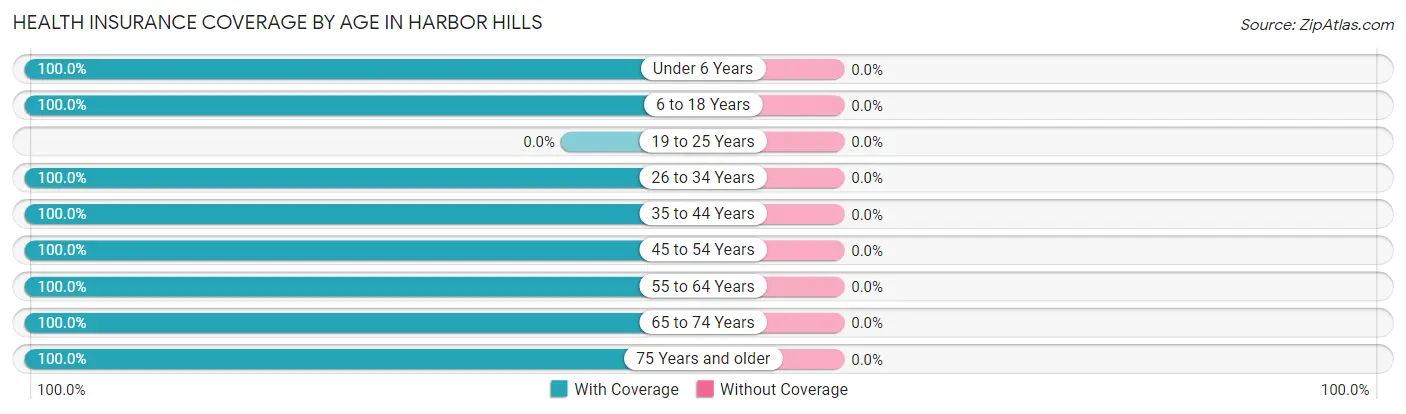
| Age Bracket | With Coverage | Without Coverage |
| Under 6 Years | 71 (100.0%) | 0 (0.0%) |
| 6 to 18 Years | 93 (100.0%) | 0 (0.0%) |
| 19 to 25 Years | 0 (0.0%) | 0 (0.0%) |
| 26 to 34 Years | 62 (100.0%) | 0 (0.0%) |
| 35 to 44 Years | 53 (100.0%) | 0 (0.0%) |
| 45 to 54 Years | 27 (100.0%) | 0 (0.0%) |
| 55 to 64 Years | 29 (100.0%) | 0 (0.0%) |
| 65 to 74 Years | 89 (100.0%) | 0 (0.0%) |
| 75 Years and older | 38 (100.0%) | 0 (0.0%) |
| Total | 462 (100.0%) | 0 (0.0%) |
Health Insurance Coverage by Citizenship Status in Harbor Hills
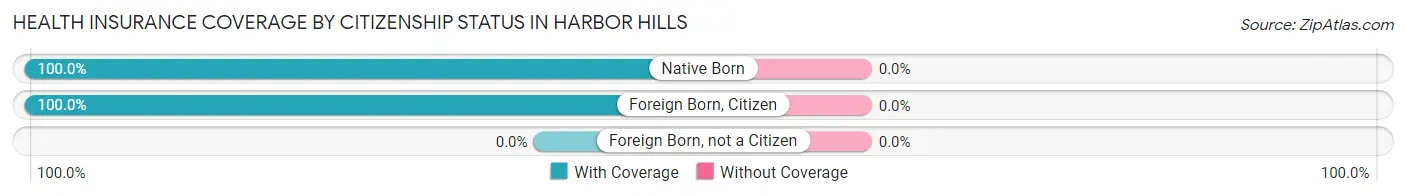
| Citizenship Status | With Coverage | Without Coverage |
| Native Born | 71 (100.0%) | 0 (0.0%) |
| Foreign Born, Citizen | 93 (100.0%) | 0 (0.0%) |
| Foreign Born, not a Citizen | 0 (0.0%) | 0 (0.0%) |
Health Insurance Coverage by Household Income in Harbor Hills
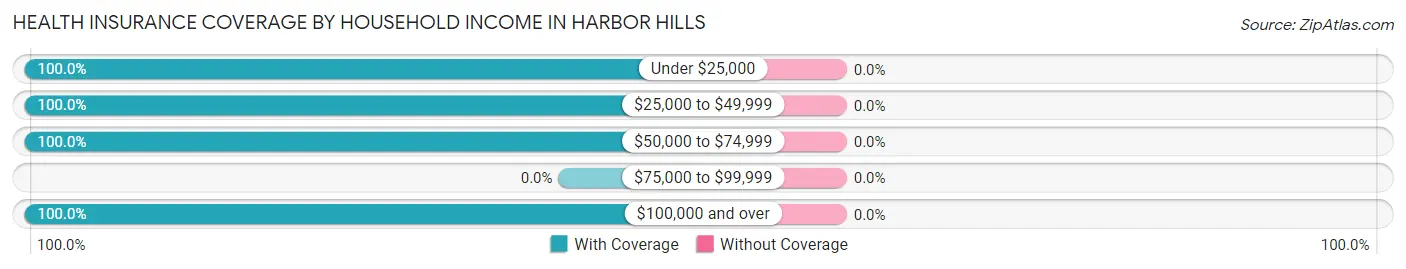
| Household Income | With Coverage | Without Coverage |
| Under $25,000 | 9 (100.0%) | 0 (0.0%) |
| $25,000 to $49,999 | 10 (100.0%) | 0 (0.0%) |
| $50,000 to $74,999 | 26 (100.0%) | 0 (0.0%) |
| $75,000 to $99,999 | 0 (0.0%) | 0 (0.0%) |
| $100,000 and over | 417 (100.0%) | 0 (0.0%) |
Public vs Private Health Insurance Coverage by Age in Harbor Hills
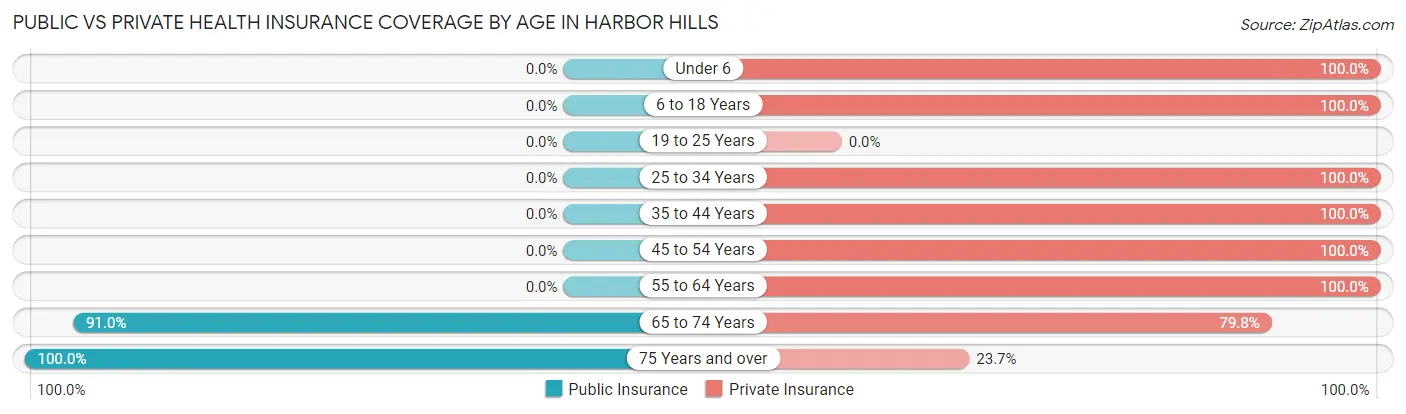
| Age Bracket | Public Insurance | Private Insurance |
| Under 6 | 0 (0.0%) | 71 (100.0%) |
| 6 to 18 Years | 0 (0.0%) | 93 (100.0%) |
| 19 to 25 Years | 0 (0.0%) | 0 (0.0%) |
| 25 to 34 Years | 0 (0.0%) | 62 (100.0%) |
| 35 to 44 Years | 0 (0.0%) | 53 (100.0%) |
| 45 to 54 Years | 0 (0.0%) | 27 (100.0%) |
| 55 to 64 Years | 0 (0.0%) | 29 (100.0%) |
| 65 to 74 Years | 81 (91.0%) | 71 (79.8%) |
| 75 Years and over | 38 (100.0%) | 9 (23.7%) |
| Total | 119 (25.8%) | 415 (89.8%) |
Disability Status by Sex by Age in Harbor Hills
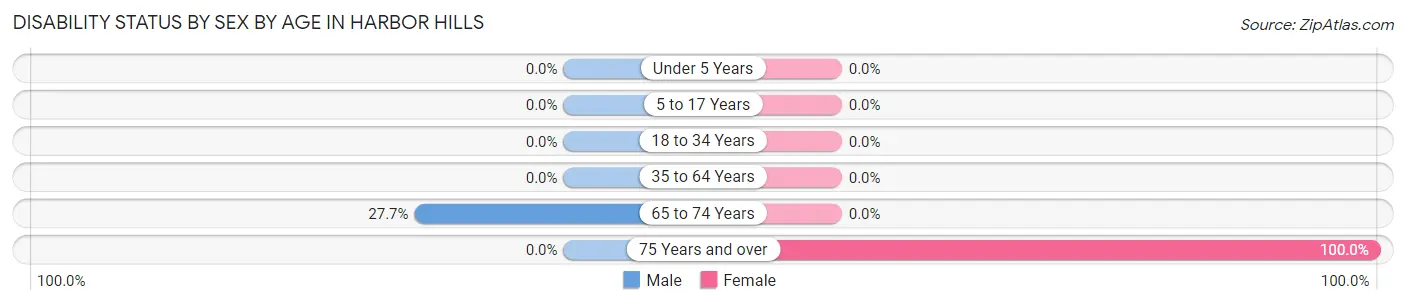
| Age Bracket | Male | Female |
| Under 5 Years | 0 (0.0%) | 0 (0.0%) |
| 5 to 17 Years | 0 (0.0%) | 0 (0.0%) |
| 18 to 34 Years | 0 (0.0%) | 0 (0.0%) |
| 35 to 64 Years | 0 (0.0%) | 0 (0.0%) |
| 65 to 74 Years | 13 (27.7%) | 0 (0.0%) |
| 75 Years and over | 0 (0.0%) | 38 (100.0%) |
Disability Class by Sex by Age in Harbor Hills
Disability Class: Hearing Difficulty
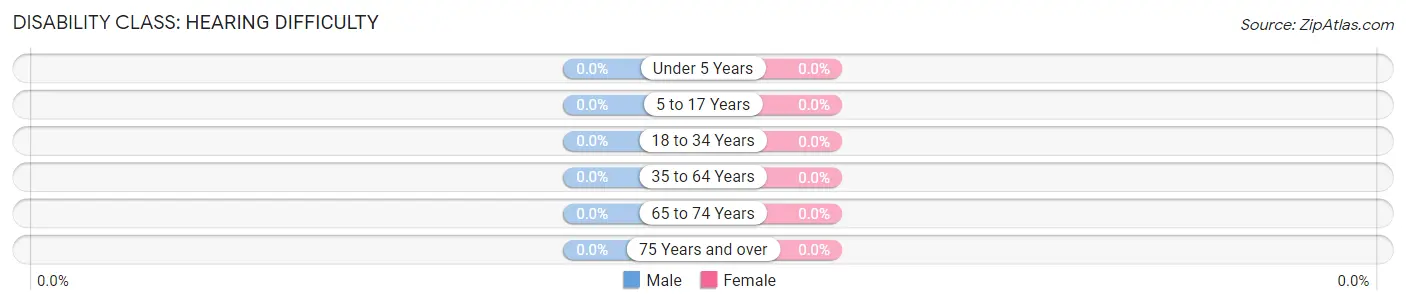
| Age Bracket | Male | Female |
| Under 5 Years | 0 (0.0%) | 0 (0.0%) |
| 5 to 17 Years | 0 (0.0%) | 0 (0.0%) |
| 18 to 34 Years | 0 (0.0%) | 0 (0.0%) |
| 35 to 64 Years | 0 (0.0%) | 0 (0.0%) |
| 65 to 74 Years | 0 (0.0%) | 0 (0.0%) |
| 75 Years and over | 0 (0.0%) | 0 (0.0%) |
Disability Class: Vision Difficulty
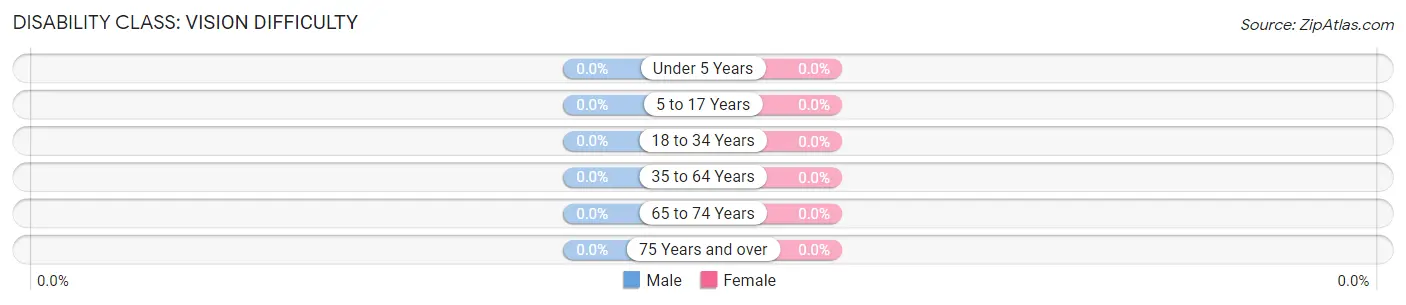
| Age Bracket | Male | Female |
| Under 5 Years | 0 (0.0%) | 0 (0.0%) |
| 5 to 17 Years | 0 (0.0%) | 0 (0.0%) |
| 18 to 34 Years | 0 (0.0%) | 0 (0.0%) |
| 35 to 64 Years | 0 (0.0%) | 0 (0.0%) |
| 65 to 74 Years | 0 (0.0%) | 0 (0.0%) |
| 75 Years and over | 0 (0.0%) | 0 (0.0%) |
Disability Class: Cognitive Difficulty
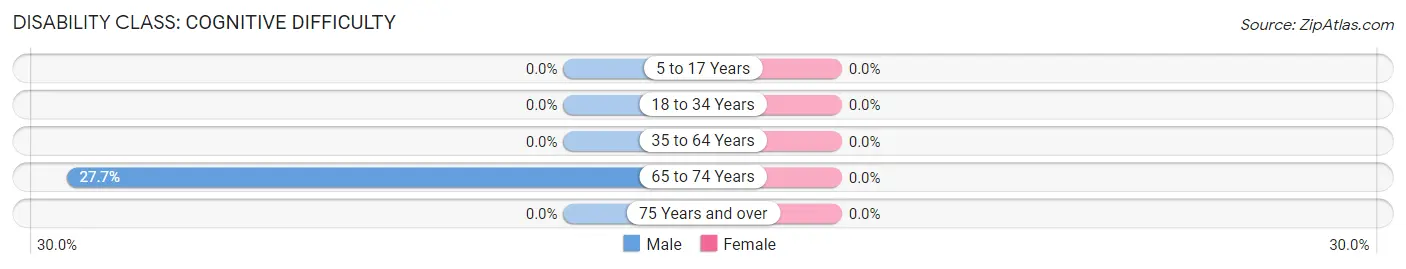
| Age Bracket | Male | Female |
| 5 to 17 Years | 0 (0.0%) | 0 (0.0%) |
| 18 to 34 Years | 0 (0.0%) | 0 (0.0%) |
| 35 to 64 Years | 0 (0.0%) | 0 (0.0%) |
| 65 to 74 Years | 13 (27.7%) | 0 (0.0%) |
| 75 Years and over | 0 (0.0%) | 0 (0.0%) |
Disability Class: Ambulatory Difficulty
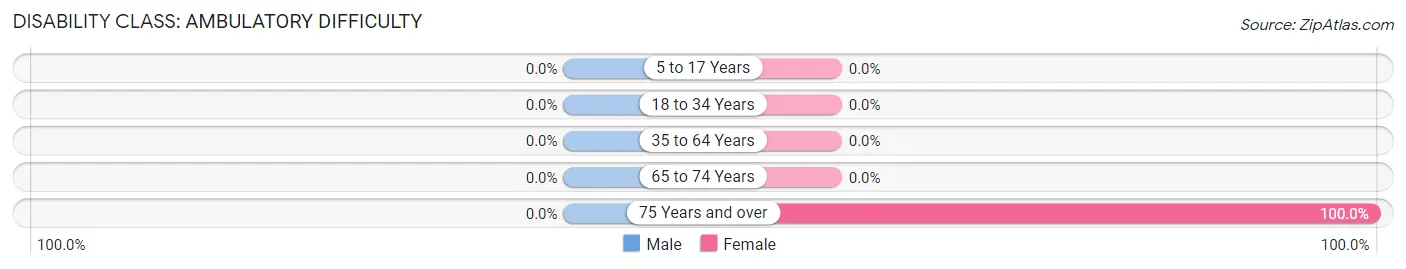
| Age Bracket | Male | Female |
| 5 to 17 Years | 0 (0.0%) | 0 (0.0%) |
| 18 to 34 Years | 0 (0.0%) | 0 (0.0%) |
| 35 to 64 Years | 0 (0.0%) | 0 (0.0%) |
| 65 to 74 Years | 0 (0.0%) | 0 (0.0%) |
| 75 Years and over | 0 (0.0%) | 38 (100.0%) |
Disability Class: Self-Care Difficulty
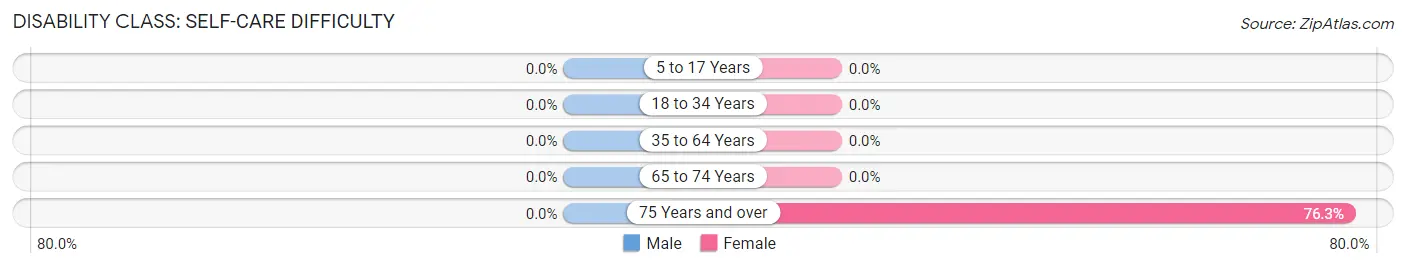
| Age Bracket | Male | Female |
| 5 to 17 Years | 0 (0.0%) | 0 (0.0%) |
| 18 to 34 Years | 0 (0.0%) | 0 (0.0%) |
| 35 to 64 Years | 0 (0.0%) | 0 (0.0%) |
| 65 to 74 Years | 0 (0.0%) | 0 (0.0%) |
| 75 Years and over | 0 (0.0%) | 29 (76.3%) |
Technology Access in Harbor Hills
Computing Device Access in Harbor Hills
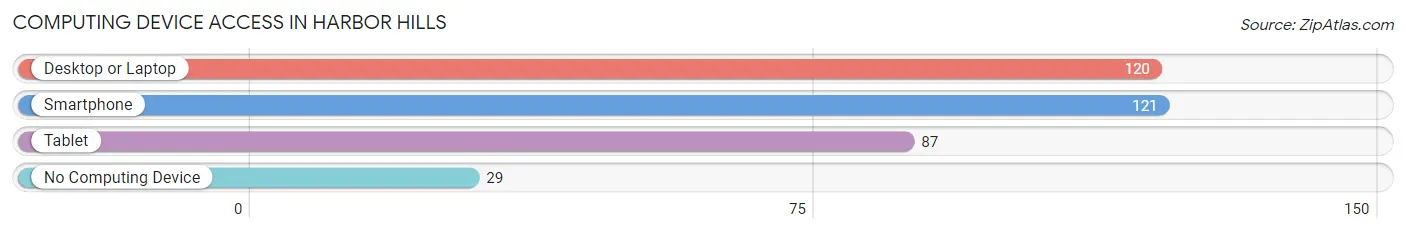
| Device Type | # Households | % Households |
| Desktop or Laptop | 120 | 75.5% |
| Smartphone | 121 | 76.1% |
| Tablet | 87 | 54.7% |
| No Computing Device | 29 | 18.2% |
| Total | 159 | 100.0% |
Internet Access in Harbor Hills
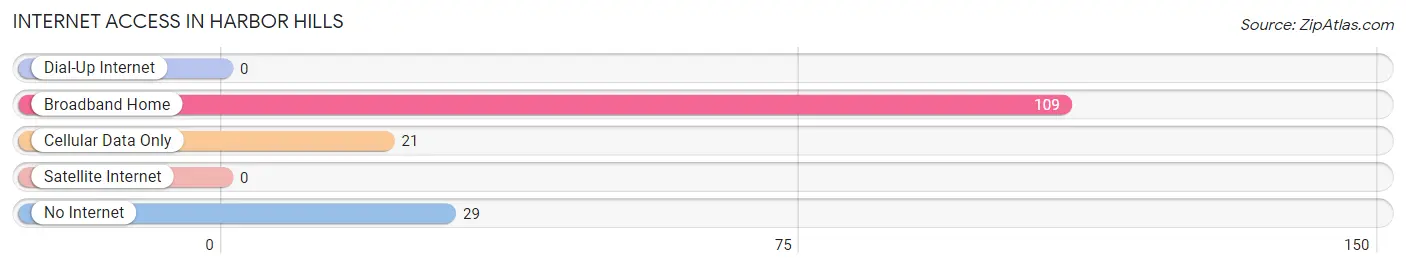
| Internet Type | # Households | % Households |
| Dial-Up Internet | 0 | 0.0% |
| Broadband Home | 109 | 68.5% |
| Cellular Data Only | 21 | 13.2% |
| Satellite Internet | 0 | 0.0% |
| No Internet | 29 | 18.2% |
| Total | 159 | 100.0% |
Harbor Hills Summary
Harbor Hills is a hamlet located in the Town of Huntington in Suffolk County, New York. It is situated on the north shore of Long Island, approximately 50 miles east of New York City. The hamlet is bordered by the hamlets of Lloyd Harbor to the east, Centerport to the south, and Huntington Bay to the west.
History
Harbor Hills was originally inhabited by the Matinecock Native American tribe. The area was first settled by Europeans in the mid-17th century. The hamlet was originally known as “Little Neck” and was part of the Town of Oyster Bay. In 1788, the Town of Huntington was formed and Little Neck was included in its boundaries. The hamlet was renamed “Harbor Hills” in 1845.
Geography
Harbor Hills is located on the north shore of Long Island, approximately 50 miles east of New York City. The hamlet is bordered by the hamlets of Lloyd Harbor to the east, Centerport to the south, and Huntington Bay to the west. The hamlet is situated on a peninsula that juts out into Huntington Bay. The peninsula is surrounded by the waters of Lloyd Harbor and Huntington Bay. The area is characterized by rolling hills and wooded areas.
Economy
The economy of Harbor Hills is largely based on tourism and recreation. The hamlet is home to several marinas, yacht clubs, and boatyards. There are also several restaurants and bars located in the area. The hamlet is also home to a number of small businesses, including a grocery store, a hardware store, and a pharmacy.
Demographics
As of the 2010 census, the population of Harbor Hills was 1,845. The median household income was $107,917, and the median age was 44. The population was predominantly white (94.3%), with a small percentage of African Americans (2.2%) and Asians (2.1%). The majority of the population (90.2%) was born in the United States.
Conclusion
Harbor Hills is a hamlet located in the Town of Huntington in Suffolk County, New York. It is situated on the north shore of Long Island, approximately 50 miles east of New York City. The hamlet is bordered by the hamlets of Lloyd Harbor to the east, Centerport to the south, and Huntington Bay to the west. The economy of Harbor Hills is largely based on tourism and recreation. As of the 2010 census, the population of Harbor Hills was 1,845. The median household income was $107,917, and the median age was 44. The population was predominantly white (94.3%), with a small percentage of African Americans (2.2%) and Asians (2.1%).
Common Questions
What is Per Capita Income in Harbor Hills?
Per Capita income in Harbor Hills is $103,414.
What is the Median Household income in Harbor Hills?
Median Household Income in Harbor Hills is $183,073.
What is Inequality or Gini Index in Harbor Hills?
Inequality or Gini Index in Harbor Hills is 0.51.
What is the Total Population of Harbor Hills?
Total Population of Harbor Hills is 462.
What is the Total Male Population of Harbor Hills?
Total Male Population of Harbor Hills is 195.
What is the Total Female Population of Harbor Hills?
Total Female Population of Harbor Hills is 267.
What is the Ratio of Males per 100 Females in Harbor Hills?
There are 73.03 Males per 100 Females in Harbor Hills.
What is the Ratio of Females per 100 Males in Harbor Hills?
There are 136.92 Females per 100 Males in Harbor Hills.
What is the Median Population Age in Harbor Hills?
Median Population Age in Harbor Hills is 36.4 Years.
What is the Average Family Size in Harbor Hills
Average Family Size in Harbor Hills is 3.7 People.
What is the Average Household Size in Harbor Hills
Average Household Size in Harbor Hills is 2.9 People.
How Large is the Labor Force in Harbor Hills?
There are 234 People in the Labor Forcein in Harbor Hills.
What is the Percentage of People in the Labor Force in Harbor Hills?
78.5% of People are in the Labor Force in Harbor Hills.