Roslyn Estates, NY Map & Demographics
Roslyn Estates Map
Roslyn Estates Overview
$133,703
PER CAPITA INCOME
$250,001
AVG FAMILY INCOME
$250,001
AVG HOUSEHOLD INCOME
67.5%
WAGE / INCOME GAP [ % ]
32.5¢/ $1
WAGE / INCOME GAP [ $ ]
0.47
INEQUALITY / GINI INDEX
1,350
TOTAL POPULATION
640
MALE POPULATION
710
FEMALE POPULATION
90.14
MALES / 100 FEMALES
110.94
FEMALES / 100 MALES
43.8
MEDIAN AGE
3.2
AVG FAMILY SIZE
3.1
AVG HOUSEHOLD SIZE
639
LABOR FORCE [ PEOPLE ]
59.6%
PERCENT IN LABOR FORCE
2.2%
UNEMPLOYMENT RATE
Income in Roslyn Estates
Income Overview in Roslyn Estates
Per Capita Income in Roslyn Estates is $133,703, while median incomes of families and households are $250,001 and $250,001 respectively.
| Characteristic | Number | Measure |
| Per Capita Income | 1,350 | $133,703 |
| Median Family Income | 396 | $250,001 |
| Mean Family Income | 396 | $428,689 |
| Median Household Income | 434 | $250,001 |
| Mean Household Income | 434 | $409,199 |
| Income Deficit | 396 | $0 |
| Wage / Income Gap (%) | 1,350 | 67.47% |
| Wage / Income Gap ($) | 1,350 | 32.53¢ per $1 |
| Gini / Inequality Index | 1,350 | 0.47 |
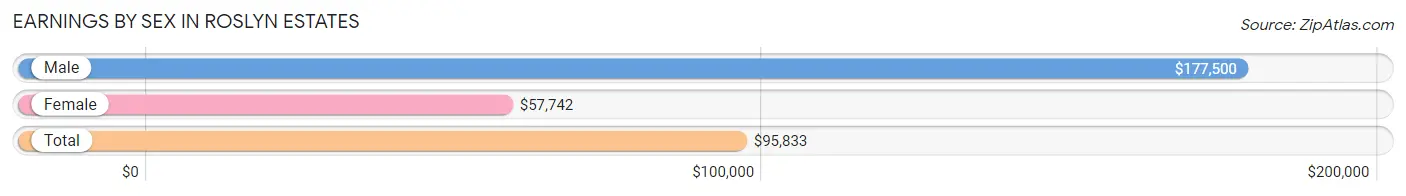
Earnings by Sex in Roslyn Estates
Average Earnings in Roslyn Estates are $95,833, $177,500 for men and $57,742 for women, a difference of 67.5%.
| Sex | Number | Average Earnings |
| Male | 396 (59.5%) | $177,500 |
| Female | 270 (40.5%) | $57,742 |
| Total | 666 (100.0%) | $95,833 |
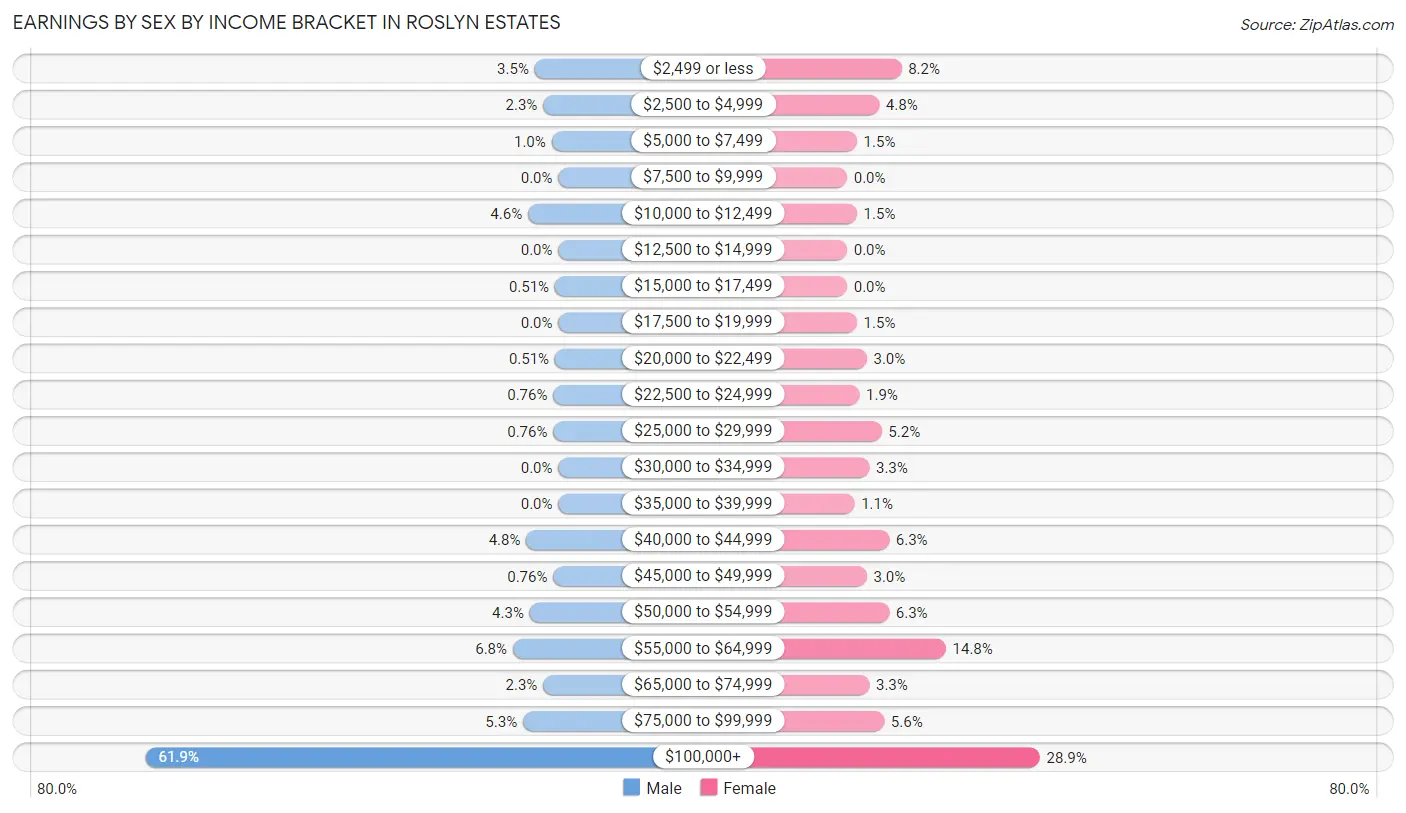
Earnings by Sex by Income Bracket in Roslyn Estates
The most common earnings brackets in Roslyn Estates are $100,000+ for men (245 | 61.9%) and $100,000+ for women (78 | 28.9%).
| Income | Male | Female |
| $2,499 or less | 14 (3.5%) | 22 (8.2%) |
| $2,500 to $4,999 | 9 (2.3%) | 13 (4.8%) |
| $5,000 to $7,499 | 4 (1.0%) | 4 (1.5%) |
| $7,500 to $9,999 | 0 (0.0%) | 0 (0.0%) |
| $10,000 to $12,499 | 18 (4.5%) | 4 (1.5%) |
| $12,500 to $14,999 | 0 (0.0%) | 0 (0.0%) |
| $15,000 to $17,499 | 2 (0.5%) | 0 (0.0%) |
| $17,500 to $19,999 | 0 (0.0%) | 4 (1.5%) |
| $20,000 to $22,499 | 2 (0.5%) | 8 (3.0%) |
| $22,500 to $24,999 | 3 (0.8%) | 5 (1.8%) |
| $25,000 to $29,999 | 3 (0.8%) | 14 (5.2%) |
| $30,000 to $34,999 | 0 (0.0%) | 9 (3.3%) |
| $35,000 to $39,999 | 0 (0.0%) | 3 (1.1%) |
| $40,000 to $44,999 | 19 (4.8%) | 17 (6.3%) |
| $45,000 to $49,999 | 3 (0.8%) | 8 (3.0%) |
| $50,000 to $54,999 | 17 (4.3%) | 17 (6.3%) |
| $55,000 to $64,999 | 27 (6.8%) | 40 (14.8%) |
| $65,000 to $74,999 | 9 (2.3%) | 9 (3.3%) |
| $75,000 to $99,999 | 21 (5.3%) | 15 (5.6%) |
| $100,000+ | 245 (61.9%) | 78 (28.9%) |
| Total | 396 (100.0%) | 270 (100.0%) |
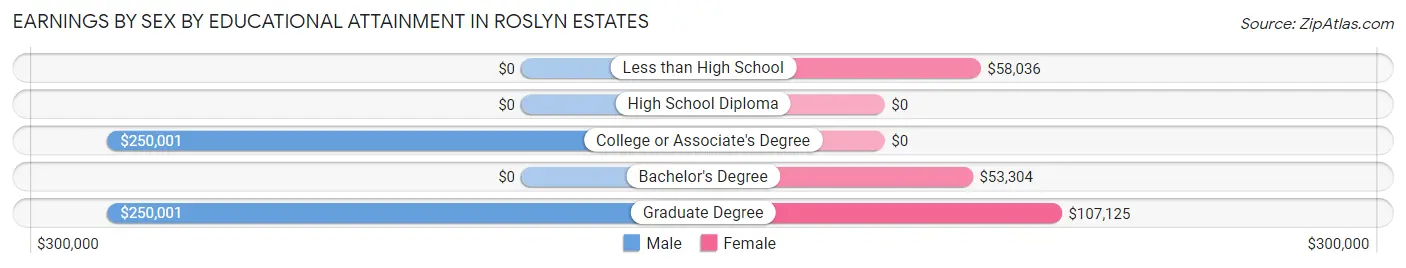
Earnings by Sex by Educational Attainment in Roslyn Estates
Average earnings in Roslyn Estates are $230,268 for men and $58,750 for women, a difference of 74.5%. Men with an educational attainment of college or associate's degree enjoy the highest average annual earnings of $250,001, while those with college or associate's degree education earn the least with $250,001. Women with an educational attainment of graduate degree earn the most with the average annual earnings of $107,125, while those with bachelor's degree education have the smallest earnings of $53,304.
| Educational Attainment | Male Income | Female Income |
| Less than High School | - | - |
| High School Diploma | - | - |
| College or Associate's Degree | $250,001 | $0 |
| Bachelor's Degree | - | - |
| Graduate Degree | $250,001 | $107,125 |
| Total | $230,268 | $58,750 |
Family Income in Roslyn Estates
Family Income Brackets in Roslyn Estates
According to the Roslyn Estates family income data, there are 256 families falling into the $200,000+ income range, which is the most common income bracket and makes up 64.6% of all families.
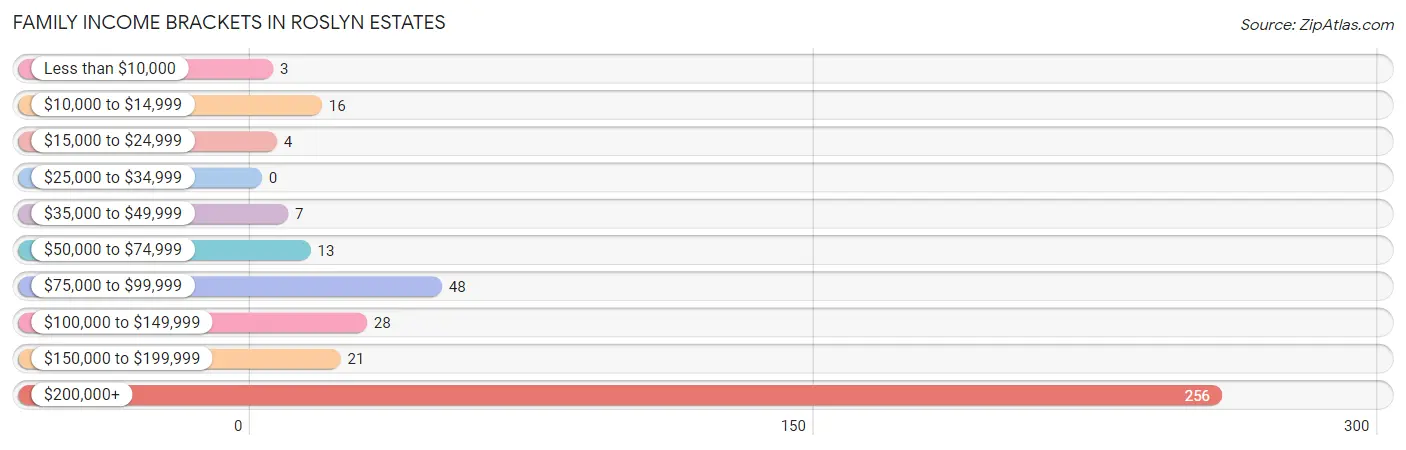
| Income Bracket | # Families | % Families |
| Less than $10,000 | 3 | 0.8% |
| $10,000 to $14,999 | 16 | 4.0% |
| $15,000 to $24,999 | 4 | 1.0% |
| $25,000 to $34,999 | 0 | 0.0% |
| $35,000 to $49,999 | 7 | 1.8% |
| $50,000 to $74,999 | 13 | 3.3% |
| $75,000 to $99,999 | 48 | 12.1% |
| $100,000 to $149,999 | 28 | 7.1% |
| $150,000 to $199,999 | 21 | 5.3% |
| $200,000+ | 256 | 64.6% |
Family Income by Famaliy Size in Roslyn Estates
4-person families (92 | 23.2%) account for the highest median family income in Roslyn Estates with $250,001 per family, while 2-person families (178 | 45.0%) have the highest median income of $113,125 per family member.
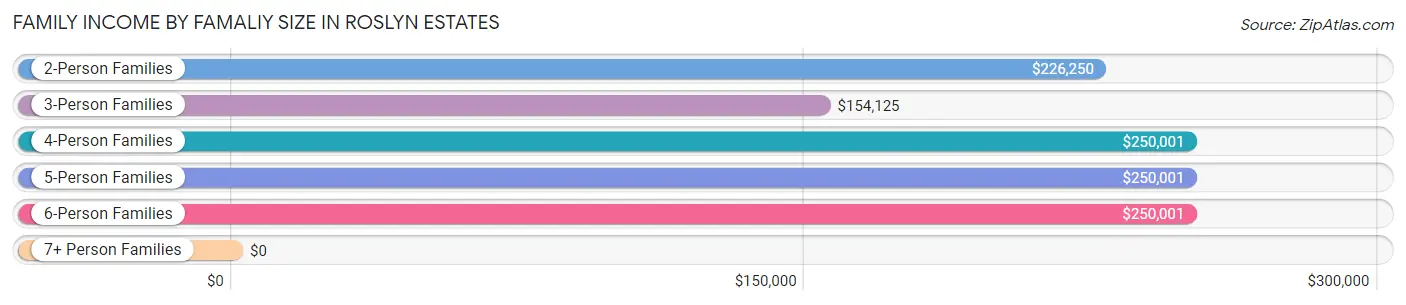
| Income Bracket | # Families | Median Income |
| 2-Person Families | 178 (45.0%) | $226,250 |
| 3-Person Families | 57 (14.4%) | $154,125 |
| 4-Person Families | 92 (23.2%) | $250,001 |
| 5-Person Families | 51 (12.9%) | $250,001 |
| 6-Person Families | 18 (4.5%) | $250,001 |
| 7+ Person Families | 0 (0.0%) | $0 |
| Total | 396 (100.0%) | $250,001 |
Family Income by Number of Earners in Roslyn Estates
The median family income in Roslyn Estates is $250,001, with families comprising 1 earner (145) having the highest median family income of $250,001, while families with no earners (69) have the lowest median family income of $91,250, accounting for 36.6% and 17.4% of families, respectively.
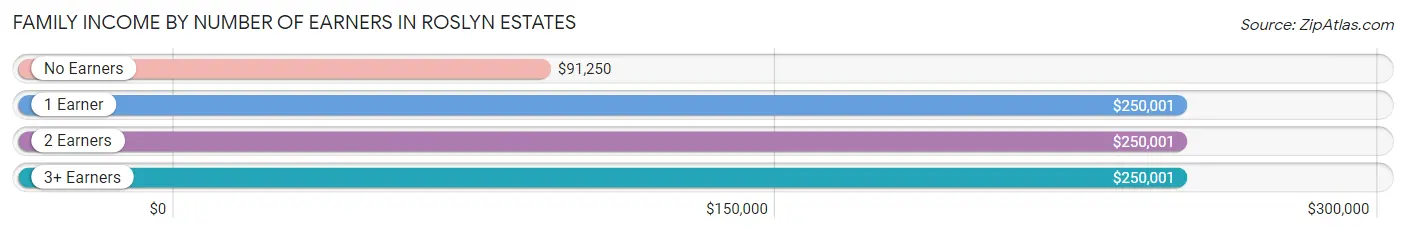
| Number of Earners | # Families | Median Income |
| No Earners | 69 (17.4%) | $91,250 |
| 1 Earner | 145 (36.6%) | $250,001 |
| 2 Earners | 111 (28.0%) | $250,001 |
| 3+ Earners | 71 (17.9%) | $250,001 |
| Total | 396 (100.0%) | $250,001 |
Household Income in Roslyn Estates
Household Income Brackets in Roslyn Estates
With 267 households falling in the category, the $200,000+ income range is the most frequent in Roslyn Estates, accounting for 61.5% of all households.
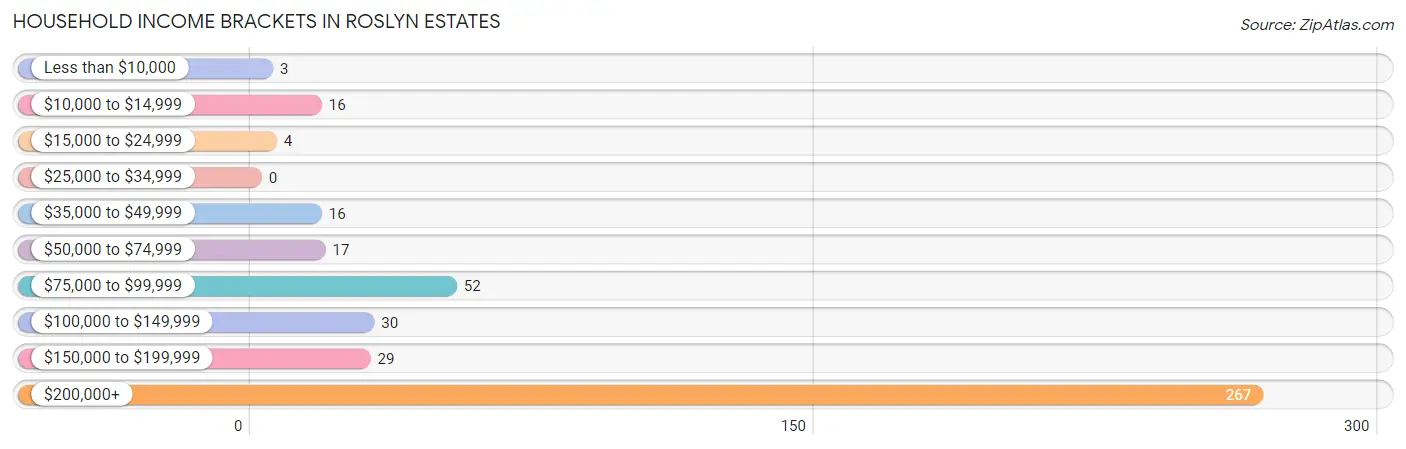
| Income Bracket | # Households | % Households |
| Less than $10,000 | 3 | 0.7% |
| $10,000 to $14,999 | 16 | 3.7% |
| $15,000 to $24,999 | 4 | 0.9% |
| $25,000 to $34,999 | 0 | 0.0% |
| $35,000 to $49,999 | 16 | 3.7% |
| $50,000 to $74,999 | 17 | 3.9% |
| $75,000 to $99,999 | 52 | 12.0% |
| $100,000 to $149,999 | 30 | 6.9% |
| $150,000 to $199,999 | 29 | 6.7% |
| $200,000+ | 267 | 61.5% |
Household Income by Householder Age in Roslyn Estates
The median household income in Roslyn Estates is $250,001, with the highest median household income of $250,001 found in the 25 to 44 years age bracket for the primary householder. A total of 83 households (19.1%) fall into this category.
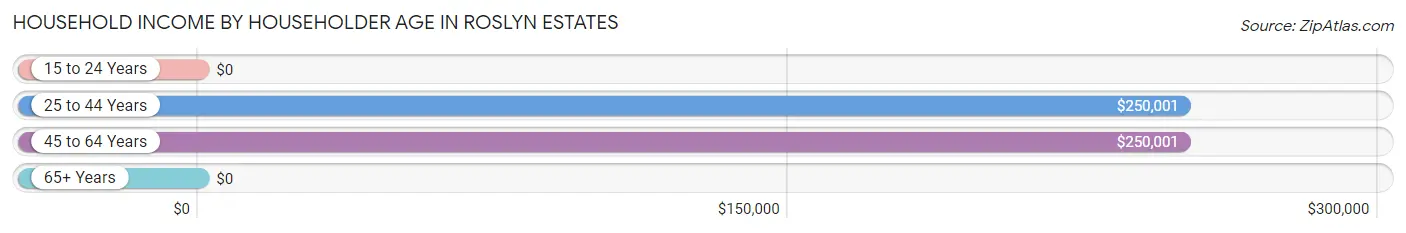
| Income Bracket | # Households | Median Income |
| 15 to 24 Years | 0 (0.0%) | $0 |
| 25 to 44 Years | 83 (19.1%) | $250,001 |
| 45 to 64 Years | 202 (46.5%) | $250,001 |
| 65+ Years | 149 (34.3%) | $0 |
| Total | 434 (100.0%) | $250,001 |
Poverty in Roslyn Estates
Income Below Poverty by Sex and Age in Roslyn Estates
With 3.9% poverty level for males and 7.3% for females among the residents of Roslyn Estates, 16 and 17 year old males and 12 to 14 year old females are the most vulnerable to poverty, with 2 males (33.3%) and 3 females (100.0%) in their respective age groups living below the poverty level.
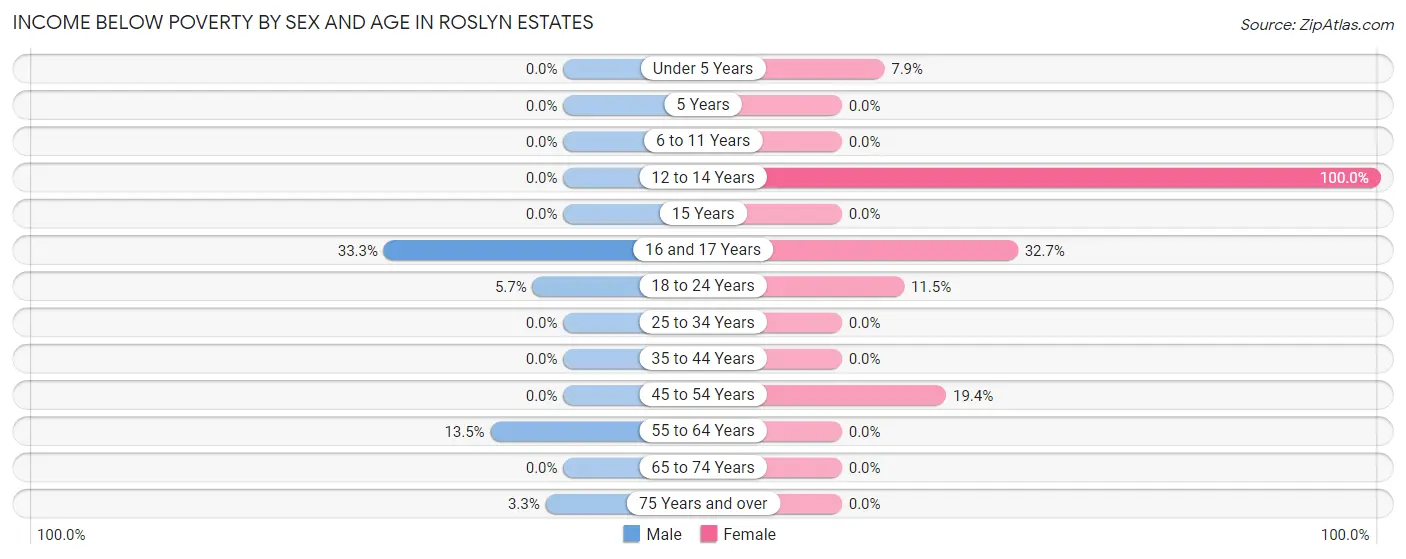
| Age Bracket | Male | Female |
| Under 5 Years | 0 (0.0%) | 3 (7.9%) |
| 5 Years | 0 (0.0%) | 0 (0.0%) |
| 6 to 11 Years | 0 (0.0%) | 0 (0.0%) |
| 12 to 14 Years | 0 (0.0%) | 3 (100.0%) |
| 15 Years | 0 (0.0%) | 0 (0.0%) |
| 16 and 17 Years | 2 (33.3%) | 16 (32.7%) |
| 18 to 24 Years | 2 (5.7%) | 6 (11.5%) |
| 25 to 34 Years | 0 (0.0%) | 0 (0.0%) |
| 35 to 44 Years | 0 (0.0%) | 0 (0.0%) |
| 45 to 54 Years | 0 (0.0%) | 24 (19.4%) |
| 55 to 64 Years | 18 (13.5%) | 0 (0.0%) |
| 65 to 74 Years | 0 (0.0%) | 0 (0.0%) |
| 75 Years and over | 3 (3.3%) | 0 (0.0%) |
| Total | 25 (3.9%) | 52 (7.3%) |
Income Above Poverty by Sex and Age in Roslyn Estates
According to the poverty statistics in Roslyn Estates, males aged under 5 years and females aged 5 years are the age groups that are most secure financially, with 100.0% of males and 100.0% of females in these age groups living above the poverty line.
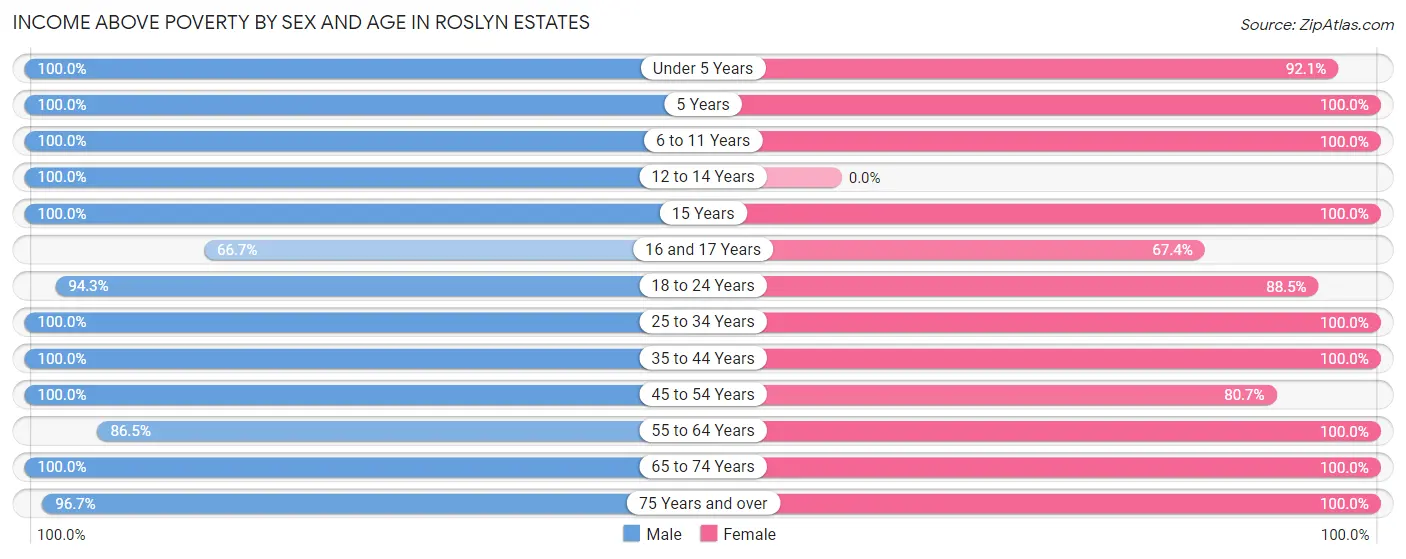
| Age Bracket | Male | Female |
| Under 5 Years | 24 (100.0%) | 35 (92.1%) |
| 5 Years | 12 (100.0%) | 8 (100.0%) |
| 6 to 11 Years | 67 (100.0%) | 77 (100.0%) |
| 12 to 14 Years | 33 (100.0%) | 0 (0.0%) |
| 15 Years | 10 (100.0%) | 3 (100.0%) |
| 16 and 17 Years | 4 (66.7%) | 33 (67.3%) |
| 18 to 24 Years | 33 (94.3%) | 46 (88.5%) |
| 25 to 34 Years | 38 (100.0%) | 36 (100.0%) |
| 35 to 44 Years | 100 (100.0%) | 86 (100.0%) |
| 45 to 54 Years | 41 (100.0%) | 100 (80.6%) |
| 55 to 64 Years | 115 (86.5%) | 94 (100.0%) |
| 65 to 74 Years | 47 (100.0%) | 88 (100.0%) |
| 75 Years and over | 88 (96.7%) | 52 (100.0%) |
| Total | 612 (96.1%) | 658 (92.7%) |
Income Below Poverty Among Married-Couple Families in Roslyn Estates
The poverty statistics for married-couple families in Roslyn Estates show that 4.8% or 18 of the total 376 families live below the poverty line. Families with 1 or 2 children have the highest poverty rate of 18.0%, comprising of 18 families. On the other hand, families with no children have the lowest poverty rate of 0.0%, which includes 0 families.
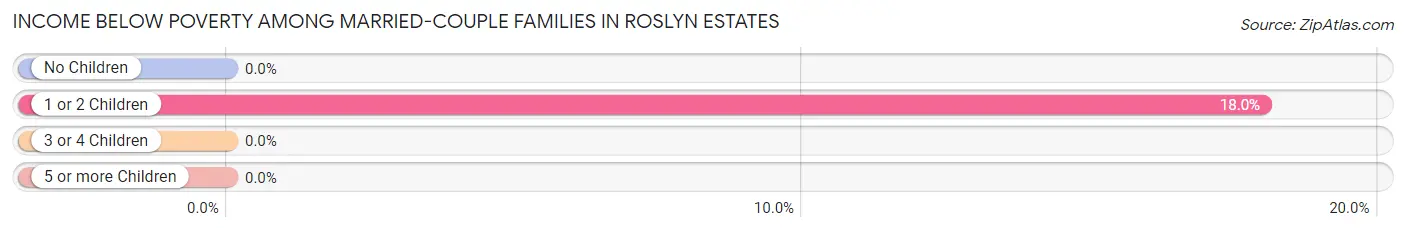
| Children | Above Poverty | Below Poverty |
| No Children | 237 (100.0%) | 0 (0.0%) |
| 1 or 2 Children | 82 (82.0%) | 18 (18.0%) |
| 3 or 4 Children | 39 (100.0%) | 0 (0.0%) |
| 5 or more Children | 0 (0.0%) | 0 (0.0%) |
| Total | 358 (95.2%) | 18 (4.8%) |
Income Below Poverty Among Single-Parent Households in Roslyn Estates
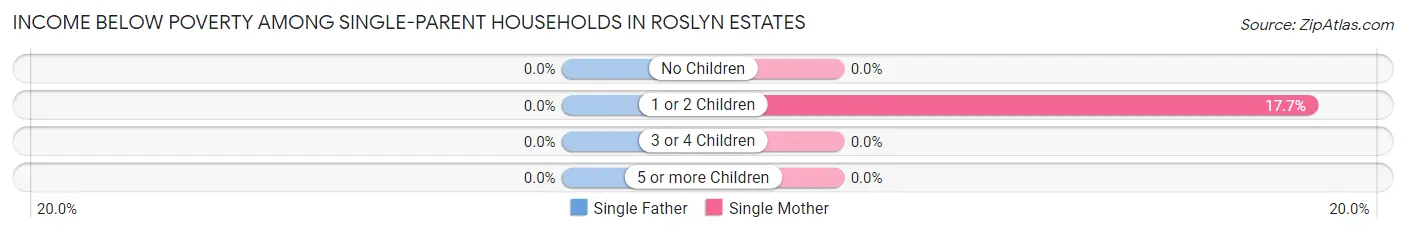
| Children | Single Father | Single Mother |
| No Children | 0 (0.0%) | 0 (0.0%) |
| 1 or 2 Children | 0 (0.0%) | 3 (17.6%) |
| 3 or 4 Children | 0 (0.0%) | 0 (0.0%) |
| 5 or more Children | 0 (0.0%) | 0 (0.0%) |
| Total | 0 (0.0%) | 3 (15.0%) |
Income Below Poverty Among Married-Couple vs Single-Parent Households in Roslyn Estates
The poverty data for Roslyn Estates shows that 18 of the married-couple family households (4.8%) and 3 of the single-parent households (15.0%) are living below the poverty level. Within the married-couple family households, those with 1 or 2 children have the highest poverty rate, with 18 households (18.0%) falling below the poverty line. Among the single-parent households, those with 1 or 2 children have the highest poverty rate, with 3 household (17.6%) living below poverty.
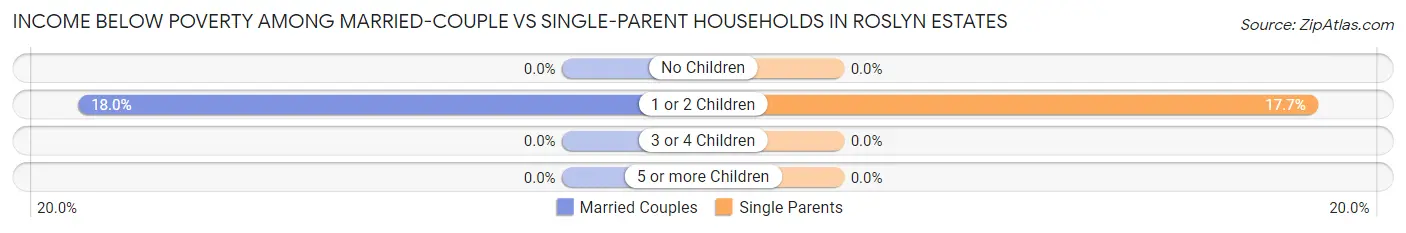
| Children | Married-Couple Families | Single-Parent Households |
| No Children | 0 (0.0%) | 0 (0.0%) |
| 1 or 2 Children | 18 (18.0%) | 3 (17.6%) |
| 3 or 4 Children | 0 (0.0%) | 0 (0.0%) |
| 5 or more Children | 0 (0.0%) | 0 (0.0%) |
| Total | 18 (4.8%) | 3 (15.0%) |
Race in Roslyn Estates
The most populous races in Roslyn Estates are White / Caucasian (1,150 | 85.2%), Asian (136 | 10.1%), and Hispanic or Latino (65 | 4.8%).
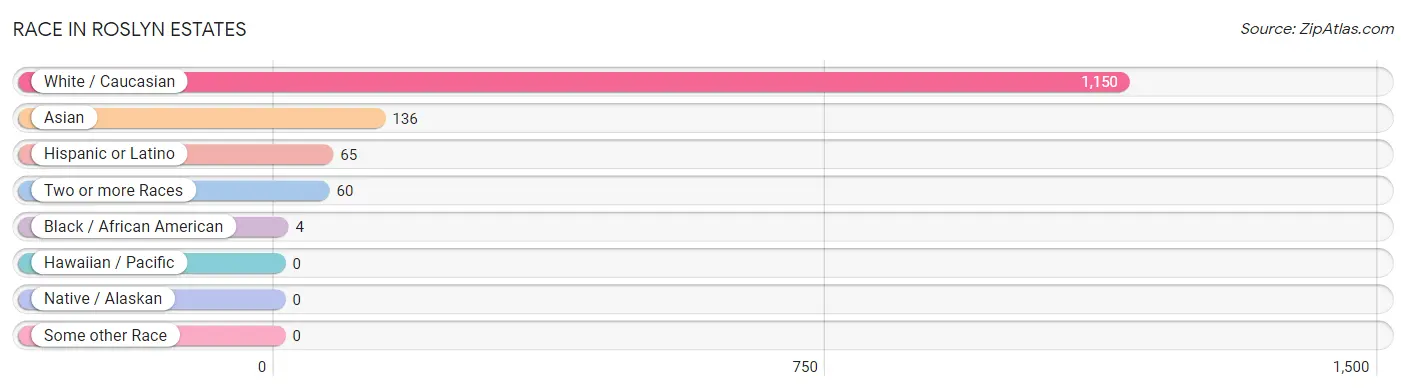
| Race | # Population | % Population |
| Asian | 136 | 10.1% |
| Black / African American | 4 | 0.3% |
| Hawaiian / Pacific | 0 | 0.0% |
| Hispanic or Latino | 65 | 4.8% |
| Native / Alaskan | 0 | 0.0% |
| White / Caucasian | 1,150 | 85.2% |
| Two or more Races | 60 | 4.4% |
| Some other Race | 0 | 0.0% |
| Total | 1,350 | 100.0% |
Ancestry in Roslyn Estates
The most populous ancestries reported in Roslyn Estates are Eastern European (200 | 14.8%), Iranian (85 | 6.3%), Albanian (76 | 5.6%), Polish (72 | 5.3%), and Ukrainian (60 | 4.4%), together accounting for 36.5% of all Roslyn Estates residents.
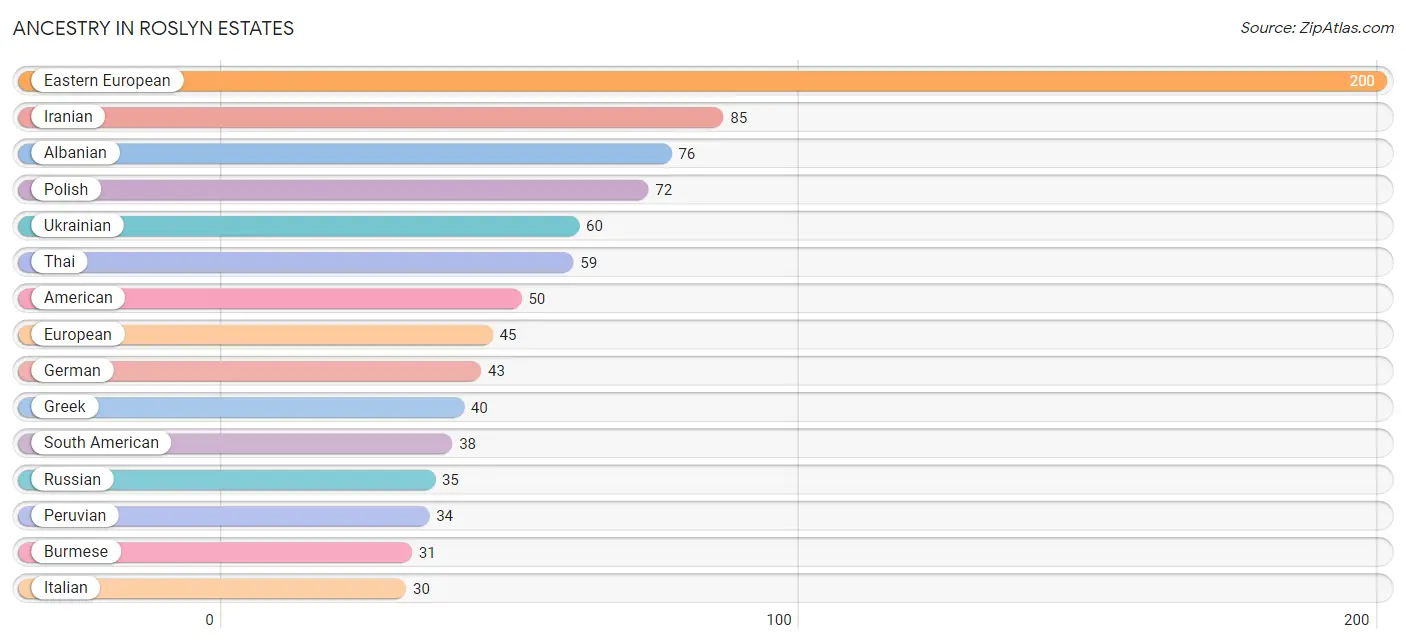
| Ancestry | # Population | % Population |
| Albanian | 76 | 5.6% |
| American | 50 | 3.7% |
| Arab | 6 | 0.4% |
| Austrian | 7 | 0.5% |
| Bhutanese | 2 | 0.2% |
| Burmese | 31 | 2.3% |
| Colombian | 4 | 0.3% |
| Czech | 3 | 0.2% |
| Czechoslovakian | 3 | 0.2% |
| Dutch | 9 | 0.7% |
| Eastern European | 200 | 14.8% |
| Egyptian | 4 | 0.3% |
| European | 45 | 3.3% |
| Filipino | 16 | 1.2% |
| French | 12 | 0.9% |
| German | 43 | 3.2% |
| Greek | 40 | 3.0% |
| Hungarian | 18 | 1.3% |
| Indian (Asian) | 19 | 1.4% |
| Iranian | 85 | 6.3% |
| Irish | 21 | 1.6% |
| Israeli | 15 | 1.1% |
| Italian | 30 | 2.2% |
| Korean | 4 | 0.3% |
| Lithuanian | 3 | 0.2% |
| Peruvian | 34 | 2.5% |
| Polish | 72 | 5.3% |
| Portuguese | 7 | 0.5% |
| Puerto Rican | 18 | 1.3% |
| Russian | 35 | 2.6% |
| South American | 38 | 2.8% |
| Spaniard | 9 | 0.7% |
| Syrian | 2 | 0.2% |
| Thai | 59 | 4.4% |
| Trinidadian and Tobagonian | 4 | 0.3% |
| Turkish | 4 | 0.3% |
| Ukrainian | 60 | 4.4% | View All 37 Rows |
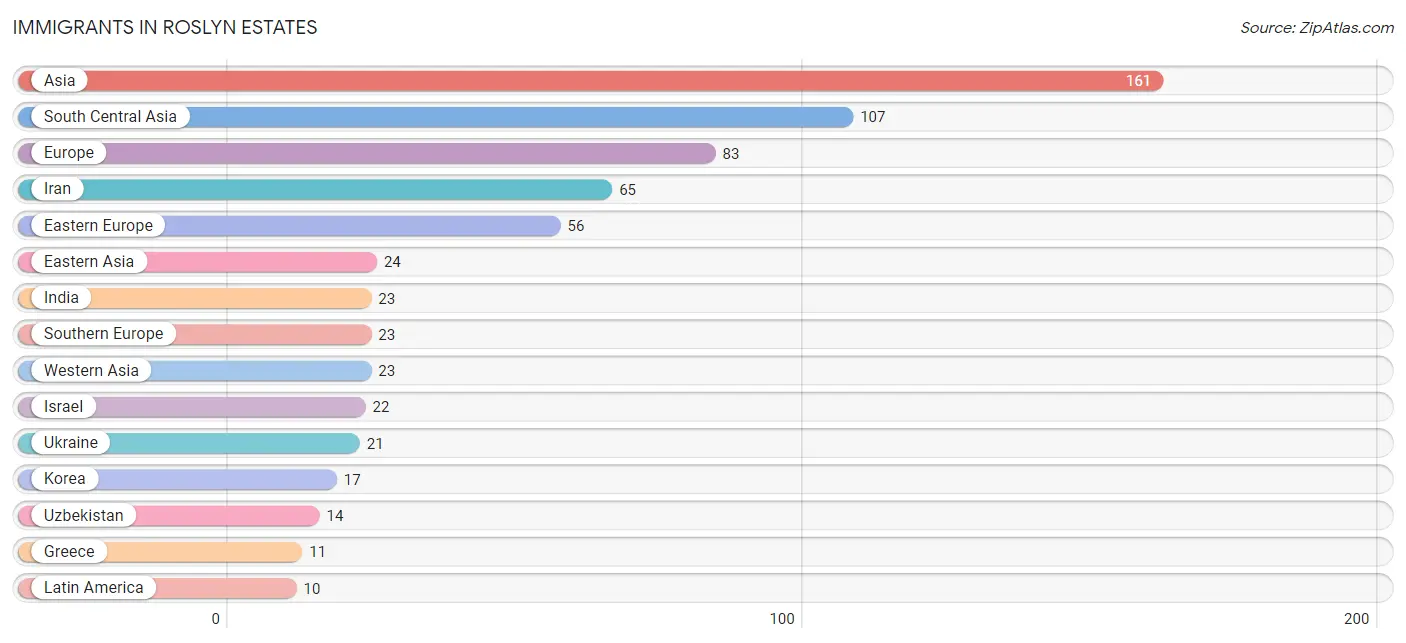
Immigrants in Roslyn Estates
The most numerous immigrant groups reported in Roslyn Estates came from Asia (161 | 11.9%), South Central Asia (107 | 7.9%), Europe (83 | 6.1%), Iran (65 | 4.8%), and Eastern Europe (56 | 4.2%), together accounting for 35.0% of all Roslyn Estates residents.
| Immigration Origin | # Population | % Population |
| Africa | 2 | 0.2% |
| Asia | 161 | 11.9% |
| Bangladesh | 5 | 0.4% |
| Caribbean | 4 | 0.3% |
| China | 5 | 0.4% |
| Colombia | 2 | 0.2% |
| Eastern Asia | 24 | 1.8% |
| Eastern Europe | 56 | 4.2% |
| Egypt | 2 | 0.2% |
| Europe | 83 | 6.1% |
| France | 2 | 0.2% |
| Germany | 2 | 0.2% |
| Greece | 11 | 0.8% |
| Guyana | 1 | 0.1% |
| Hong Kong | 2 | 0.2% |
| India | 23 | 1.7% |
| Iran | 65 | 4.8% |
| Iraq | 1 | 0.1% |
| Israel | 22 | 1.6% |
| Italy | 9 | 0.7% |
| Japan | 2 | 0.2% |
| Korea | 17 | 1.3% |
| Latin America | 10 | 0.7% |
| Northern Africa | 2 | 0.2% |
| Peru | 3 | 0.2% |
| Philippines | 4 | 0.3% |
| Poland | 7 | 0.5% |
| South America | 6 | 0.4% |
| South Central Asia | 107 | 7.9% |
| South Eastern Asia | 7 | 0.5% |
| Southern Europe | 23 | 1.7% |
| Spain | 3 | 0.2% |
| Trinidad and Tobago | 4 | 0.3% |
| Ukraine | 21 | 1.6% |
| Uzbekistan | 14 | 1.0% |
| Vietnam | 1 | 0.1% |
| Western Asia | 23 | 1.7% |
| Western Europe | 4 | 0.3% | View All 38 Rows |
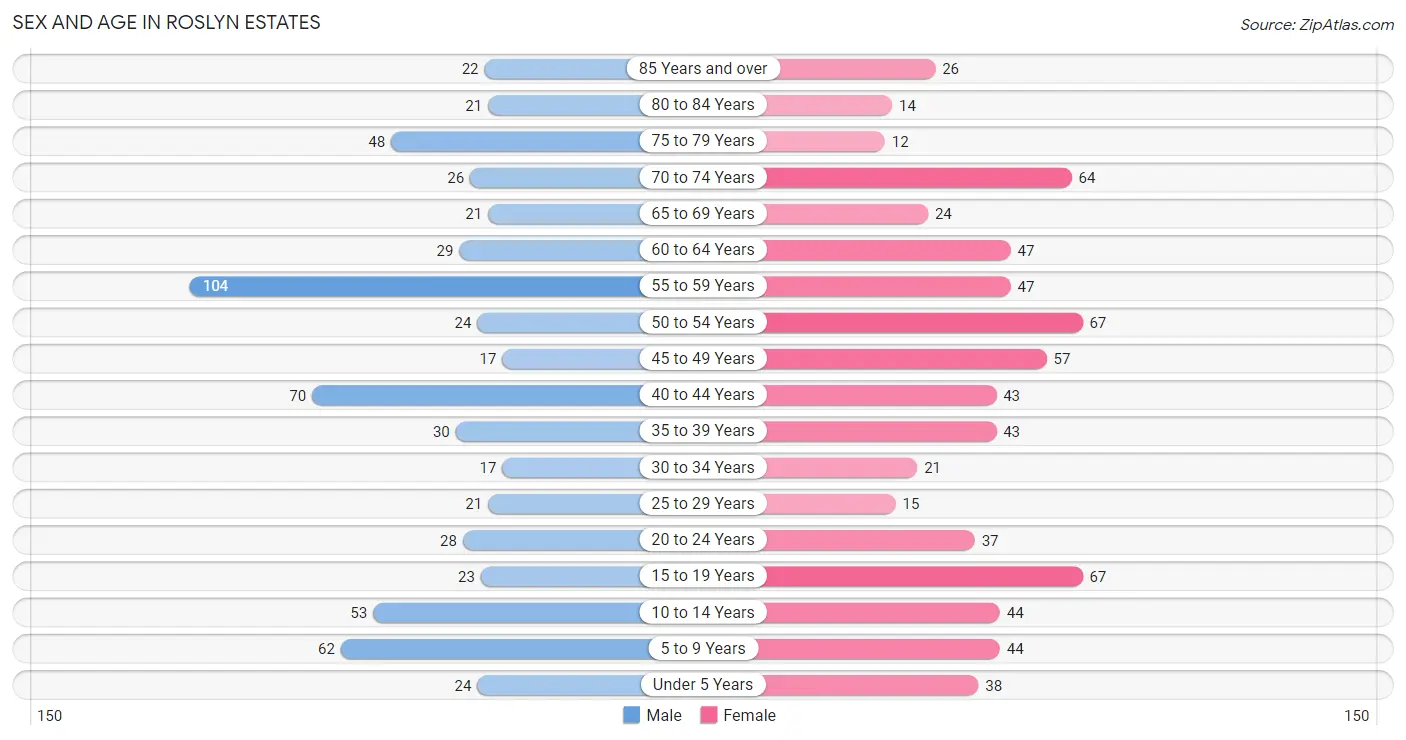
Sex and Age in Roslyn Estates
Sex and Age in Roslyn Estates
The most populous age groups in Roslyn Estates are 55 to 59 Years (104 | 16.3%) for men and 15 to 19 Years (67 | 9.4%) for women.
| Age Bracket | Male | Female |
| Under 5 Years | 24 (3.7%) | 38 (5.3%) |
| 5 to 9 Years | 62 (9.7%) | 44 (6.2%) |
| 10 to 14 Years | 53 (8.3%) | 44 (6.2%) |
| 15 to 19 Years | 23 (3.6%) | 67 (9.4%) |
| 20 to 24 Years | 28 (4.4%) | 37 (5.2%) |
| 25 to 29 Years | 21 (3.3%) | 15 (2.1%) |
| 30 to 34 Years | 17 (2.7%) | 21 (3.0%) |
| 35 to 39 Years | 30 (4.7%) | 43 (6.1%) |
| 40 to 44 Years | 70 (10.9%) | 43 (6.1%) |
| 45 to 49 Years | 17 (2.7%) | 57 (8.0%) |
| 50 to 54 Years | 24 (3.7%) | 67 (9.4%) |
| 55 to 59 Years | 104 (16.3%) | 47 (6.6%) |
| 60 to 64 Years | 29 (4.5%) | 47 (6.6%) |
| 65 to 69 Years | 21 (3.3%) | 24 (3.4%) |
| 70 to 74 Years | 26 (4.1%) | 64 (9.0%) |
| 75 to 79 Years | 48 (7.5%) | 12 (1.7%) |
| 80 to 84 Years | 21 (3.3%) | 14 (2.0%) |
| 85 Years and over | 22 (3.4%) | 26 (3.7%) |
| Total | 640 (100.0%) | 710 (100.0%) |
Families and Households in Roslyn Estates
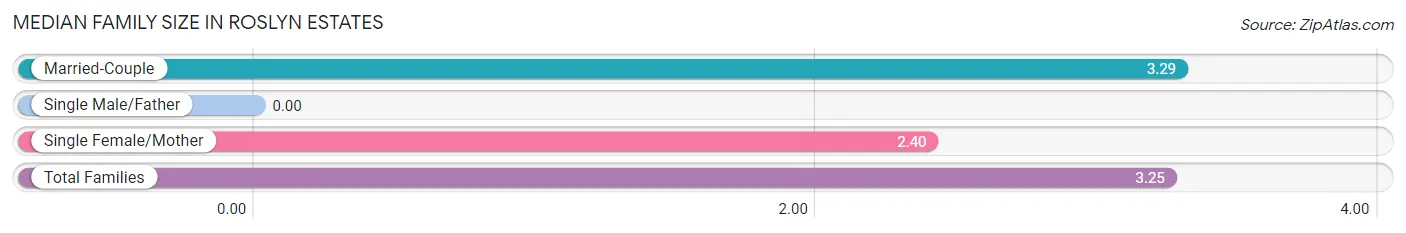
Median Family Size in Roslyn Estates
| Family Type | # Families | Family Size |
| Married-Couple | 376 (95.0%) | 3.29 |
| Single Male/Father | 0 (0.0%) | - |
| Single Female/Mother | 20 (5.1%) | 2.40 |
| Total Families | 396 (100.0%) | 3.25 |
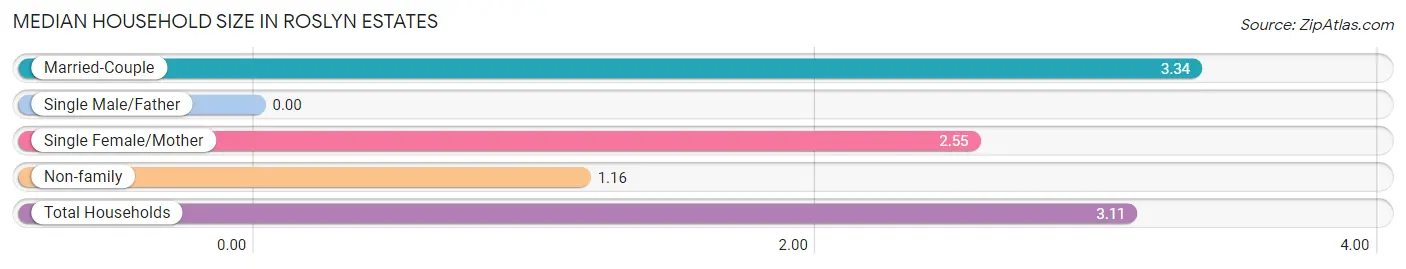
Median Household Size in Roslyn Estates
| Household Type | # Households | Household Size |
| Married-Couple | 376 (86.6%) | 3.34 |
| Single Male/Father | 0 (0.0%) | - |
| Single Female/Mother | 20 (4.6%) | 2.55 |
| Non-family | 38 (8.8%) | 1.16 |
| Total Households | 434 (100.0%) | 3.11 |
Household Size by Marriage Status in Roslyn Estates
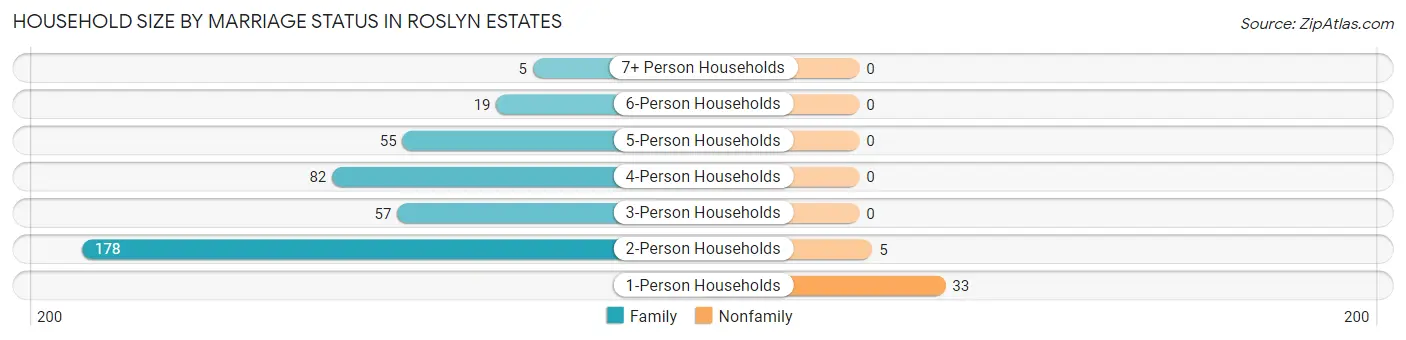
Out of a total of 434 households in Roslyn Estates, 396 (91.2%) are family households, while 38 (8.8%) are nonfamily households. The most numerous type of family households are 2-person households, comprising 178, and the most common type of nonfamily households are 1-person households, comprising 33.
| Household Size | Family Households | Nonfamily Households |
| 1-Person Households | - | 33 (7.6%) |
| 2-Person Households | 178 (41.0%) | 5 (1.1%) |
| 3-Person Households | 57 (13.1%) | 0 (0.0%) |
| 4-Person Households | 82 (18.9%) | 0 (0.0%) |
| 5-Person Households | 55 (12.7%) | 0 (0.0%) |
| 6-Person Households | 19 (4.4%) | 0 (0.0%) |
| 7+ Person Households | 5 (1.1%) | 0 (0.0%) |
| Total | 396 (91.2%) | 38 (8.8%) |
Female Fertility in Roslyn Estates
Fertility by Age in Roslyn Estates
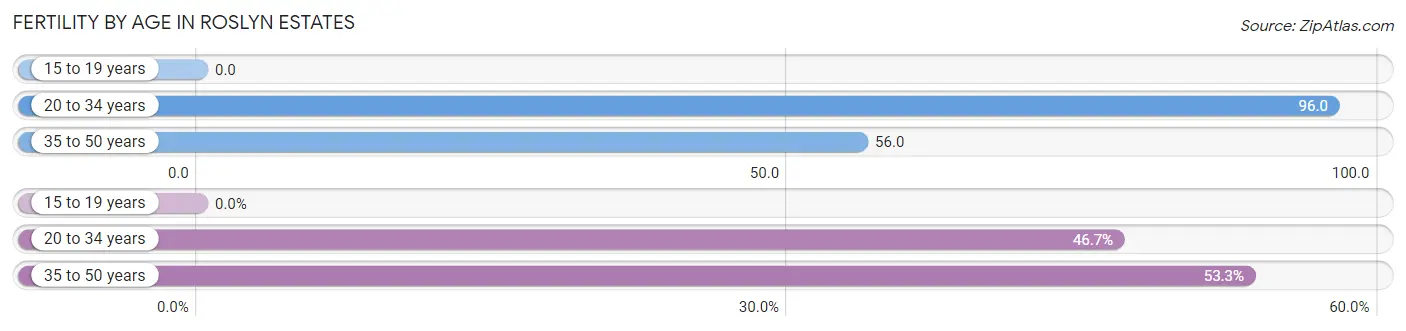
Average fertility rate in Roslyn Estates is 53.0 births per 1,000 women. Women in the age bracket of 20 to 34 years have the highest fertility rate with 96.0 births per 1,000 women. Women in the age bracket of 35 to 50 years acount for 53.3% of all women with births.
| Age Bracket | Women with Births | Births / 1,000 Women |
| 15 to 19 years | 0 (0.0%) | 0.0 |
| 20 to 34 years | 7 (46.7%) | 96.0 |
| 35 to 50 years | 8 (53.3%) | 56.0 |
| Total | 15 (100.0%) | 53.0 |
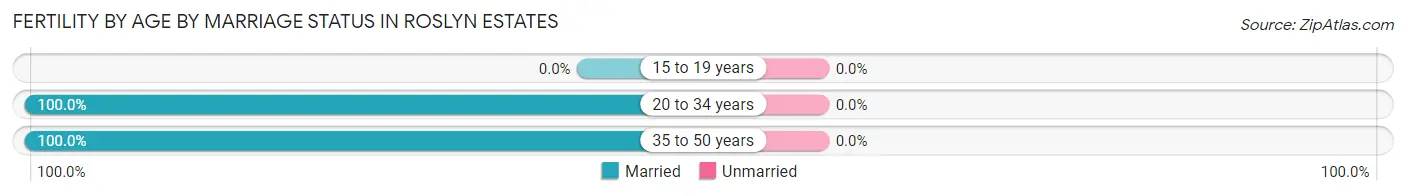
Fertility by Age by Marriage Status in Roslyn Estates
| Age Bracket | Married | Unmarried |
| 15 to 19 years | 0 (0.0%) | 0 (0.0%) |
| 20 to 34 years | 7 (100.0%) | 0 (0.0%) |
| 35 to 50 years | 8 (100.0%) | 0 (0.0%) |
| Total | 15 (100.0%) | 0 (0.0%) |
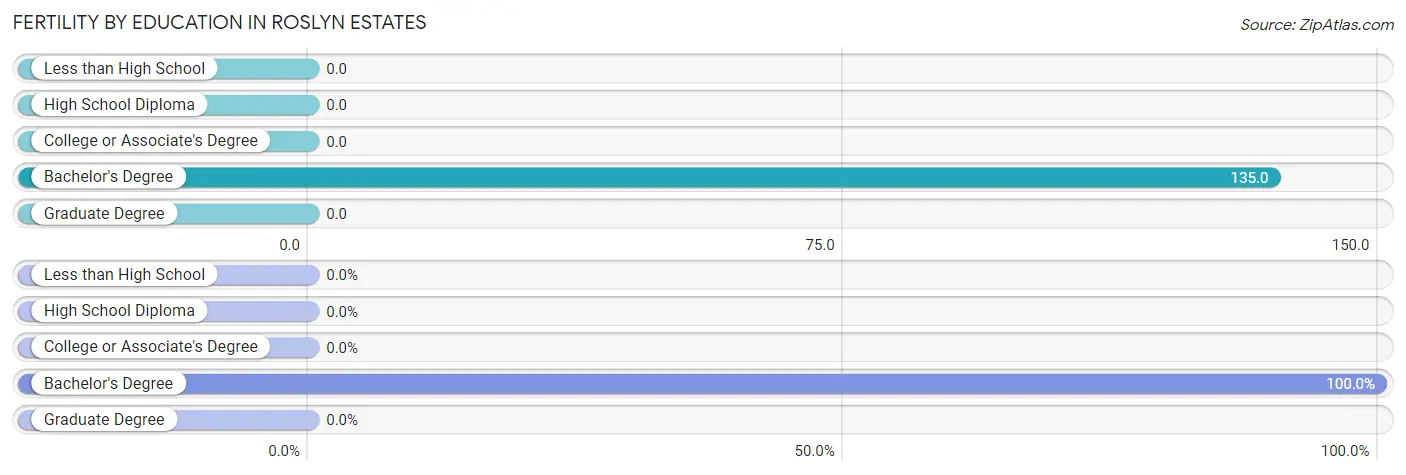
Fertility by Education in Roslyn Estates
| Educational Attainment | Women with Births | Births / 1,000 Women |
| Less than High School | 0 (0.0%) | 0.0 |
| High School Diploma | 0 (0.0%) | 0.0 |
| College or Associate's Degree | 0 (0.0%) | 0.0 |
| Bachelor's Degree | 15 (100.0%) | 135.0 |
| Graduate Degree | 0 (0.0%) | 0.0 |
| Total | 15 (100.0%) | 53.0 |
Fertility by Education by Marriage Status in Roslyn Estates
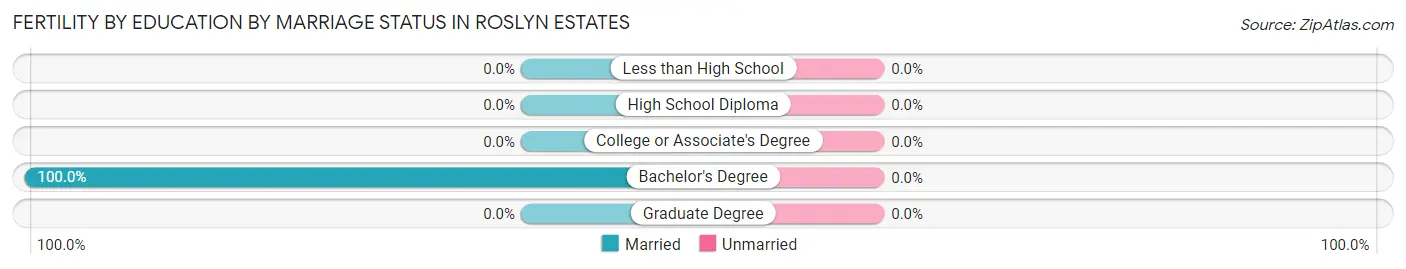
| Educational Attainment | Married | Unmarried |
| Less than High School | 0 (0.0%) | 0 (0.0%) |
| High School Diploma | 0 (0.0%) | 0 (0.0%) |
| College or Associate's Degree | 0 (0.0%) | 0 (0.0%) |
| Bachelor's Degree | 15 (100.0%) | 0 (0.0%) |
| Graduate Degree | 0 (0.0%) | 0 (0.0%) |
| Total | 15 (100.0%) | 0 (0.0%) |
Employment Characteristics in Roslyn Estates
Employment by Class of Employer in Roslyn Estates
Among the 622 employed individuals in Roslyn Estates, private company employees (408 | 65.6%), self-employed (incorporated) (94 | 15.1%), and not-for-profit organizations (45 | 7.2%) make up the most common classes of employment.
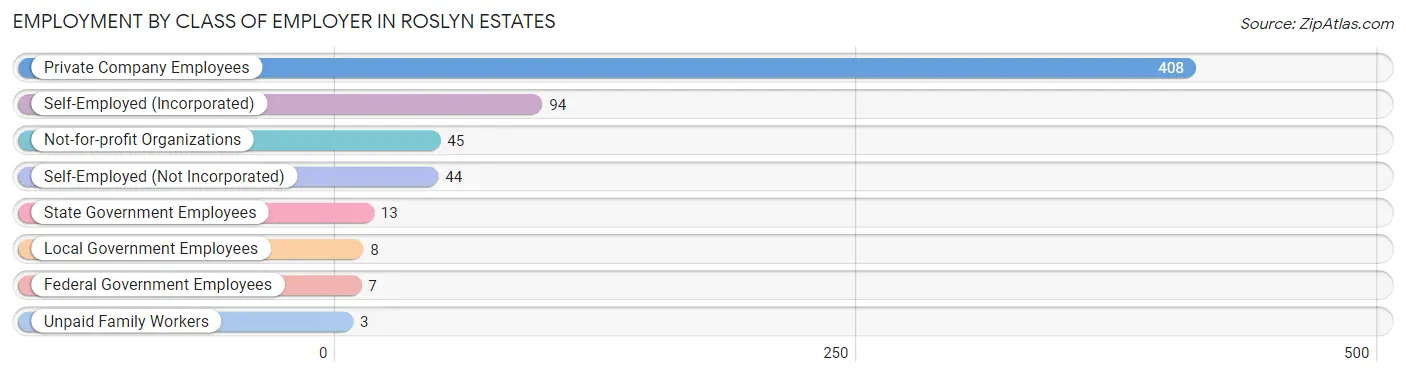
| Employer Class | # Employees | % Employees |
| Private Company Employees | 408 | 65.6% |
| Self-Employed (Incorporated) | 94 | 15.1% |
| Self-Employed (Not Incorporated) | 44 | 7.1% |
| Not-for-profit Organizations | 45 | 7.2% |
| Local Government Employees | 8 | 1.3% |
| State Government Employees | 13 | 2.1% |
| Federal Government Employees | 7 | 1.1% |
| Unpaid Family Workers | 3 | 0.5% |
| Total | 622 | 100.0% |
Employment Status by Age in Roslyn Estates
According to the labor force statistics for Roslyn Estates, out of the total population over 16 years of age (1,072), 59.6% or 639 individuals are in the labor force, with 2.2% or 14 of them unemployed. The age group with the highest labor force participation rate is 25 to 29 years, with 100.0% or 36 individuals in the labor force. Within the labor force, the 16 to 19 years age range has the highest percentage of unemployed individuals, with 50.0% or 3 of them being unemployed.
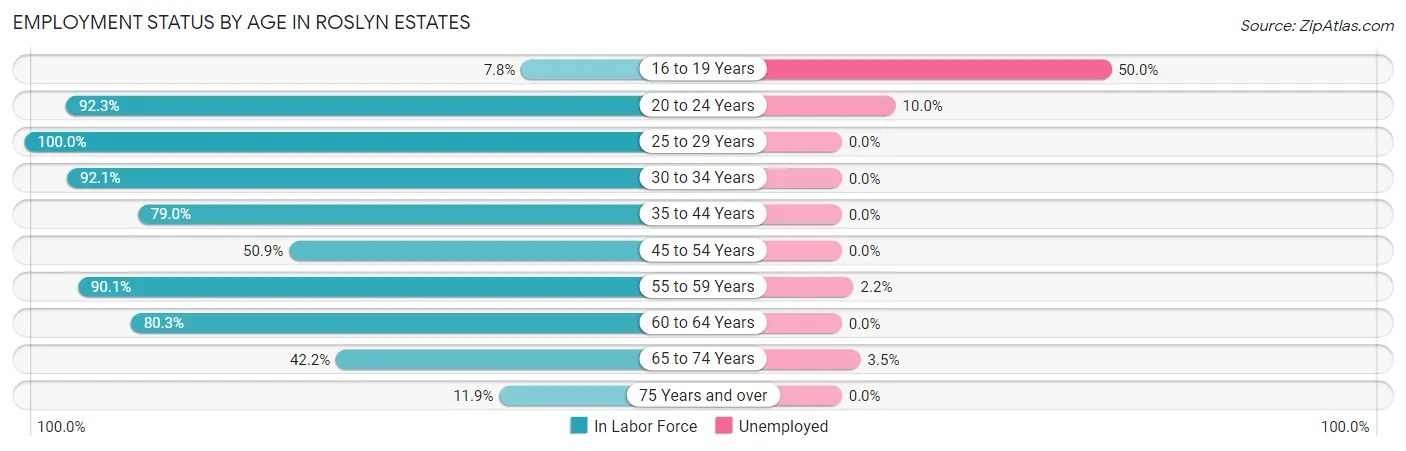
| Age Bracket | In Labor Force | Unemployed |
| 16 to 19 Years | 6 (7.8%) | 3 (50.0%) |
| 20 to 24 Years | 60 (92.3%) | 6 (10.0%) |
| 25 to 29 Years | 36 (100.0%) | 0 (0.0%) |
| 30 to 34 Years | 35 (92.1%) | 0 (0.0%) |
| 35 to 44 Years | 147 (79.0%) | 0 (0.0%) |
| 45 to 54 Years | 84 (50.9%) | 0 (0.0%) |
| 55 to 59 Years | 136 (90.1%) | 3 (2.2%) |
| 60 to 64 Years | 61 (80.3%) | 0 (0.0%) |
| 65 to 74 Years | 57 (42.2%) | 2 (3.5%) |
| 75 Years and over | 17 (11.9%) | 0 (0.0%) |
| Total | 639 (59.6%) | 14 (2.2%) |
Employment Status by Educational Attainment in Roslyn Estates
According to labor force statistics for Roslyn Estates, 76.5% of individuals (499) out of the total population between 25 and 64 years of age (652) are in the labor force, with 0.6% or 3 of them being unemployed. The group with the highest labor force participation rate are those with the educational attainment of high school diploma, with 100.0% or 39 individuals in the labor force. Within the labor force, individuals with bachelor's degree or higher education have the highest percentage of unemployment, with 0.8% or 3 of them being unemployed.
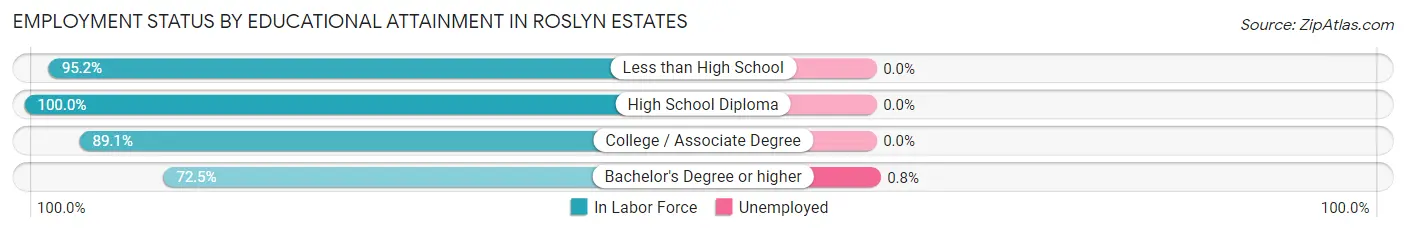
| Educational Attainment | In Labor Force | Unemployed |
| Less than High School | 20 (95.2%) | 0 (0.0%) |
| High School Diploma | 39 (100.0%) | 0 (0.0%) |
| College / Associate Degree | 57 (89.1%) | 0 (0.0%) |
| Bachelor's Degree or higher | 383 (72.5%) | 4 (0.8%) |
| Total | 499 (76.5%) | 4 (0.6%) |
Employment Occupations by Sex in Roslyn Estates
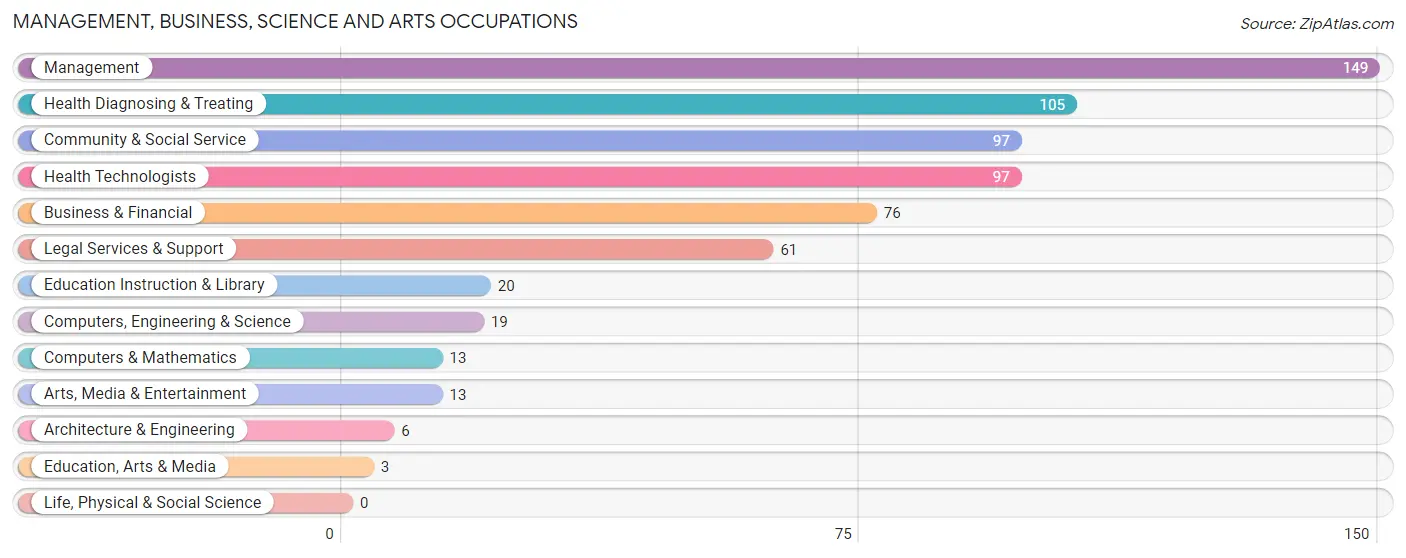
Management, Business, Science and Arts Occupations
The most common Management, Business, Science and Arts occupations in Roslyn Estates are Management (149 | 23.8%), Health Diagnosing & Treating (105 | 16.8%), Community & Social Service (97 | 15.5%), Health Technologists (97 | 15.5%), and Business & Financial (76 | 12.2%).
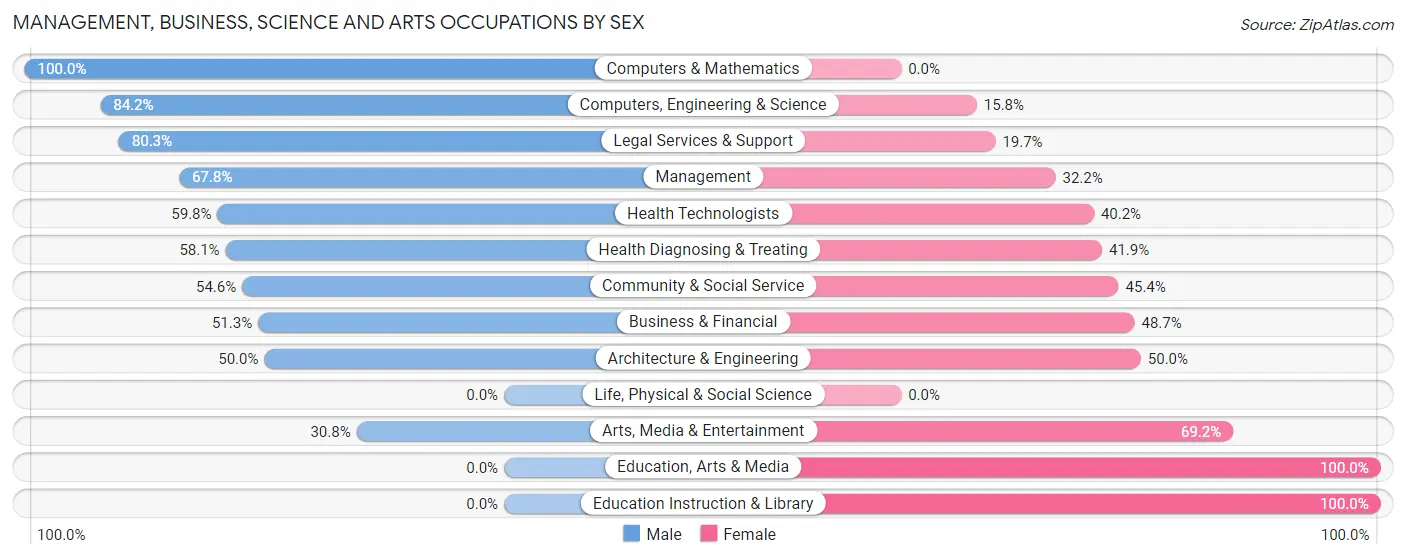
Management, Business, Science and Arts Occupations by Sex
Within the Management, Business, Science and Arts occupations in Roslyn Estates, the most male-oriented occupations are Computers & Mathematics (100.0%), Computers, Engineering & Science (84.2%), and Legal Services & Support (80.3%), while the most female-oriented occupations are Education, Arts & Media (100.0%), Education Instruction & Library (100.0%), and Arts, Media & Entertainment (69.2%).
| Occupation | Male | Female |
| Management | 101 (67.8%) | 48 (32.2%) |
| Business & Financial | 39 (51.3%) | 37 (48.7%) |
| Computers, Engineering & Science | 16 (84.2%) | 3 (15.8%) |
| Computers & Mathematics | 13 (100.0%) | 0 (0.0%) |
| Architecture & Engineering | 3 (50.0%) | 3 (50.0%) |
| Life, Physical & Social Science | 0 (0.0%) | 0 (0.0%) |
| Community & Social Service | 53 (54.6%) | 44 (45.4%) |
| Education, Arts & Media | 0 (0.0%) | 3 (100.0%) |
| Legal Services & Support | 49 (80.3%) | 12 (19.7%) |
| Education Instruction & Library | 0 (0.0%) | 20 (100.0%) |
| Arts, Media & Entertainment | 4 (30.8%) | 9 (69.2%) |
| Health Diagnosing & Treating | 61 (58.1%) | 44 (41.9%) |
| Health Technologists | 58 (59.8%) | 39 (40.2%) |
| Total (Category) | 270 (60.5%) | 176 (39.5%) |
| Total (Overall) | 380 (60.8%) | 245 (39.2%) |
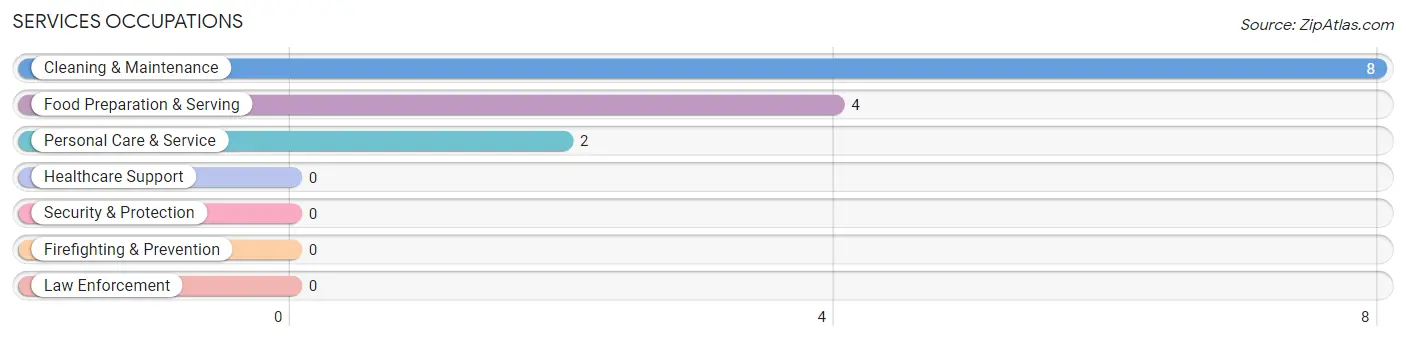
Services Occupations
The most common Services occupations in Roslyn Estates are Cleaning & Maintenance (8 | 1.3%), Food Preparation & Serving (4 | 0.6%), and Personal Care & Service (2 | 0.3%).
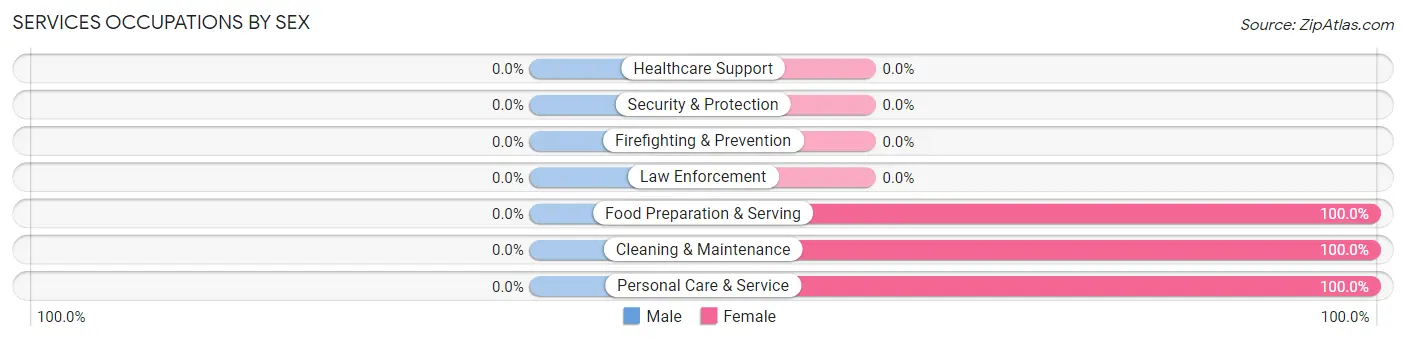
Services Occupations by Sex
| Occupation | Male | Female |
| Healthcare Support | 0 (0.0%) | 0 (0.0%) |
| Security & Protection | 0 (0.0%) | 0 (0.0%) |
| Firefighting & Prevention | 0 (0.0%) | 0 (0.0%) |
| Law Enforcement | 0 (0.0%) | 0 (0.0%) |
| Food Preparation & Serving | 0 (0.0%) | 4 (100.0%) |
| Cleaning & Maintenance | 0 (0.0%) | 8 (100.0%) |
| Personal Care & Service | 0 (0.0%) | 2 (100.0%) |
| Total (Category) | 0 (0.0%) | 14 (100.0%) |
| Total (Overall) | 380 (60.8%) | 245 (39.2%) |
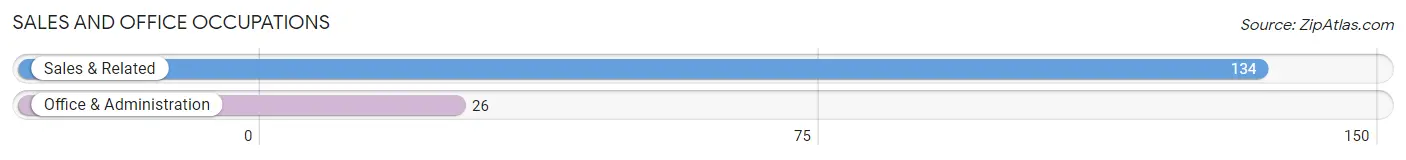
Sales and Office Occupations
The most common Sales and Office occupations in Roslyn Estates are Sales & Related (134 | 21.4%), and Office & Administration (26 | 4.2%).
Sales and Office Occupations by Sex
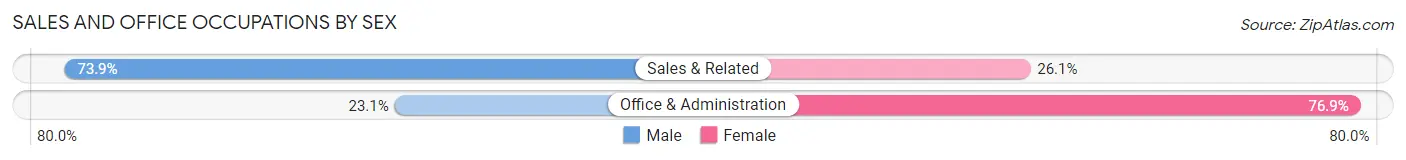
| Occupation | Male | Female |
| Sales & Related | 99 (73.9%) | 35 (26.1%) |
| Office & Administration | 6 (23.1%) | 20 (76.9%) |
| Total (Category) | 105 (65.6%) | 55 (34.4%) |
| Total (Overall) | 380 (60.8%) | 245 (39.2%) |
Natural Resources, Construction and Maintenance Occupations
Natural Resources, Construction and Maintenance Occupations by Sex
| Occupation | Male | Female |
| Farming, Fishing & Forestry | 0 (0.0%) | 0 (0.0%) |
| Construction & Extraction | 0 (0.0%) | 0 (0.0%) |
| Installation, Maintenance & Repair | 0 (0.0%) | 0 (0.0%) |
| Total (Category) | 0 (0.0%) | 0 (0.0%) |
| Total (Overall) | 380 (60.8%) | 245 (39.2%) |
Production, Transportation and Moving Occupations
The most common Production, Transportation and Moving occupations in Roslyn Estates are , and Transportation (5 | 0.8%).
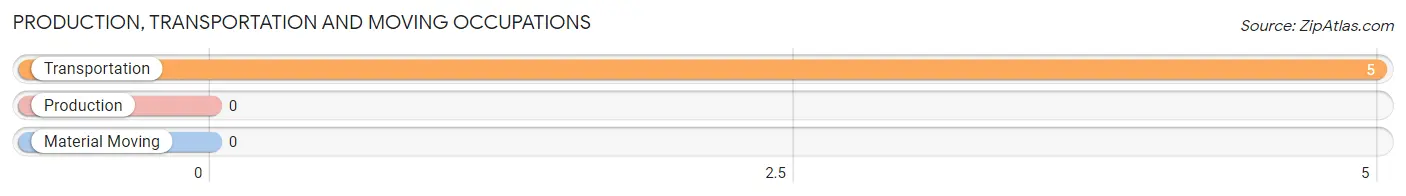
Production, Transportation and Moving Occupations by Sex
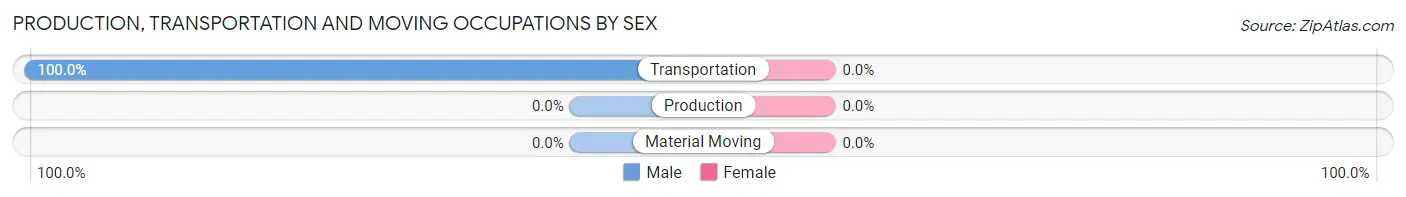
| Occupation | Male | Female |
| Production | 0 (0.0%) | 0 (0.0%) |
| Transportation | 5 (100.0%) | 0 (0.0%) |
| Material Moving | 0 (0.0%) | 0 (0.0%) |
| Total (Category) | 5 (100.0%) | 0 (0.0%) |
| Total (Overall) | 380 (60.8%) | 245 (39.2%) |
Employment Industries by Sex in Roslyn Estates
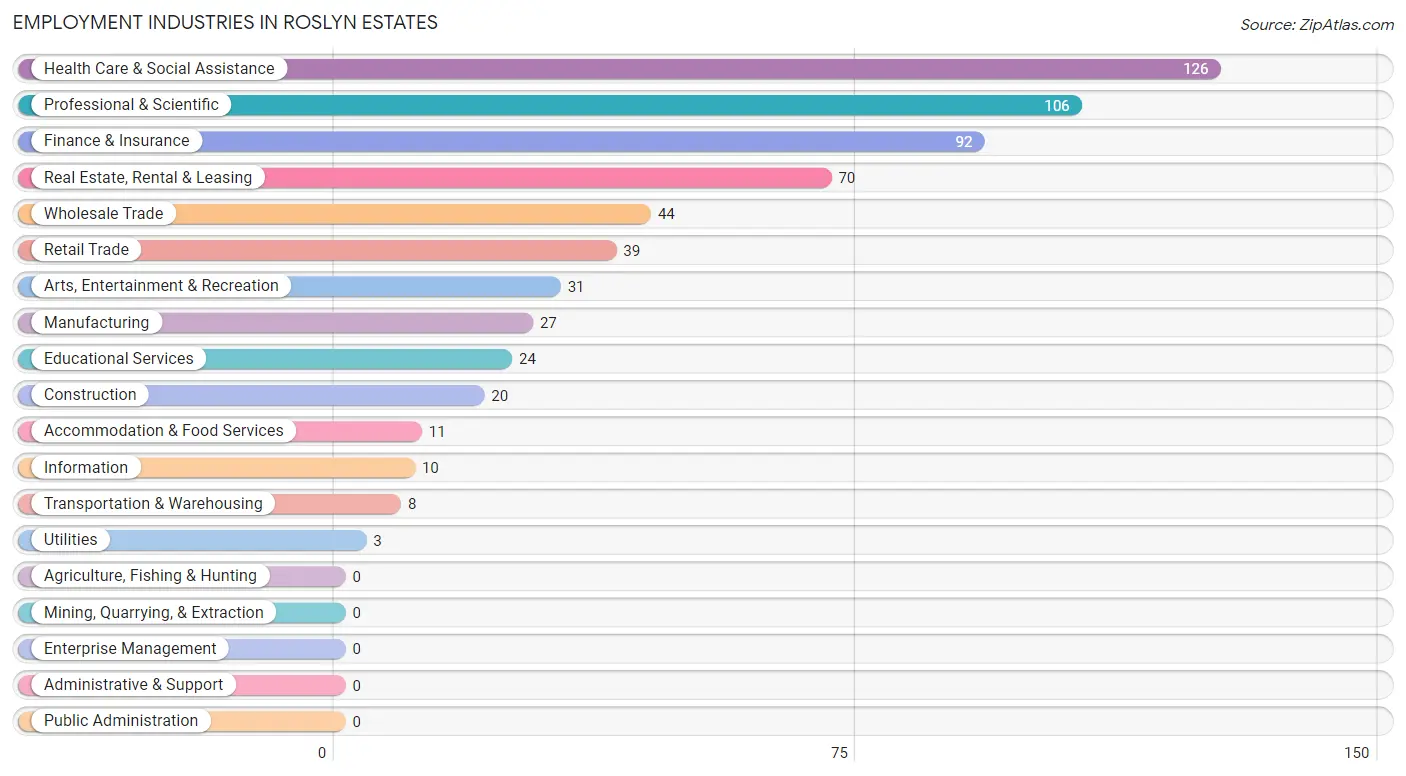
Employment Industries in Roslyn Estates
The major employment industries in Roslyn Estates include Health Care & Social Assistance (126 | 20.2%), Professional & Scientific (106 | 17.0%), Finance & Insurance (92 | 14.7%), Real Estate, Rental & Leasing (70 | 11.2%), and Wholesale Trade (44 | 7.0%).
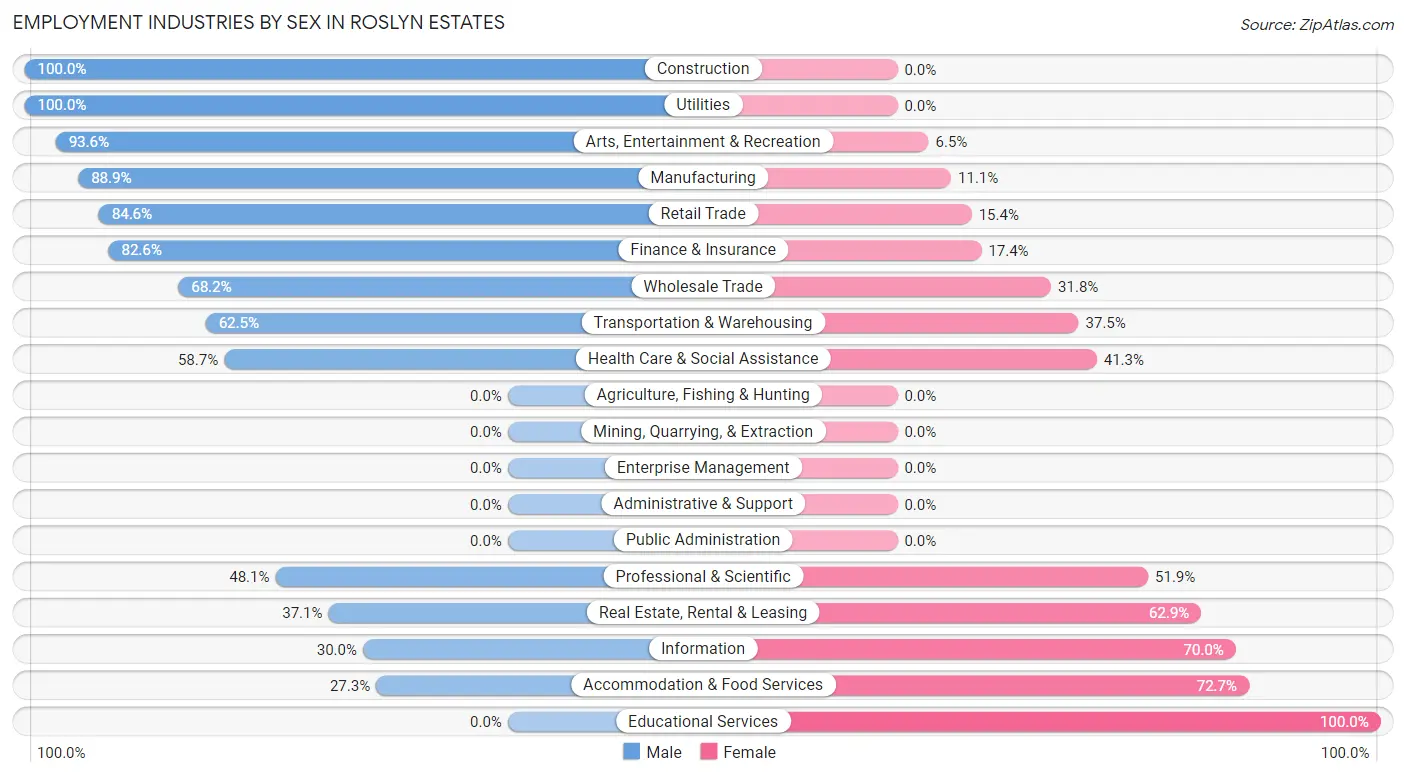
Employment Industries by Sex in Roslyn Estates
The Roslyn Estates industries that see more men than women are Construction (100.0%), Utilities (100.0%), and Arts, Entertainment & Recreation (93.5%), whereas the industries that tend to have a higher number of women are Educational Services (100.0%), Accommodation & Food Services (72.7%), and Information (70.0%).
| Industry | Male | Female |
| Agriculture, Fishing & Hunting | 0 (0.0%) | 0 (0.0%) |
| Mining, Quarrying, & Extraction | 0 (0.0%) | 0 (0.0%) |
| Construction | 20 (100.0%) | 0 (0.0%) |
| Manufacturing | 24 (88.9%) | 3 (11.1%) |
| Wholesale Trade | 30 (68.2%) | 14 (31.8%) |
| Retail Trade | 33 (84.6%) | 6 (15.4%) |
| Transportation & Warehousing | 5 (62.5%) | 3 (37.5%) |
| Utilities | 3 (100.0%) | 0 (0.0%) |
| Information | 3 (30.0%) | 7 (70.0%) |
| Finance & Insurance | 76 (82.6%) | 16 (17.4%) |
| Real Estate, Rental & Leasing | 26 (37.1%) | 44 (62.9%) |
| Professional & Scientific | 51 (48.1%) | 55 (51.9%) |
| Enterprise Management | 0 (0.0%) | 0 (0.0%) |
| Administrative & Support | 0 (0.0%) | 0 (0.0%) |
| Educational Services | 0 (0.0%) | 24 (100.0%) |
| Health Care & Social Assistance | 74 (58.7%) | 52 (41.3%) |
| Arts, Entertainment & Recreation | 29 (93.5%) | 2 (6.5%) |
| Accommodation & Food Services | 3 (27.3%) | 8 (72.7%) |
| Public Administration | 0 (0.0%) | 0 (0.0%) |
| Total | 380 (60.8%) | 245 (39.2%) |
Education in Roslyn Estates
School Enrollment in Roslyn Estates
The most common levels of schooling among the 319 students in Roslyn Estates are middle school (93 | 29.1%), elementary school (70 | 21.9%), and high school (68 | 21.3%).
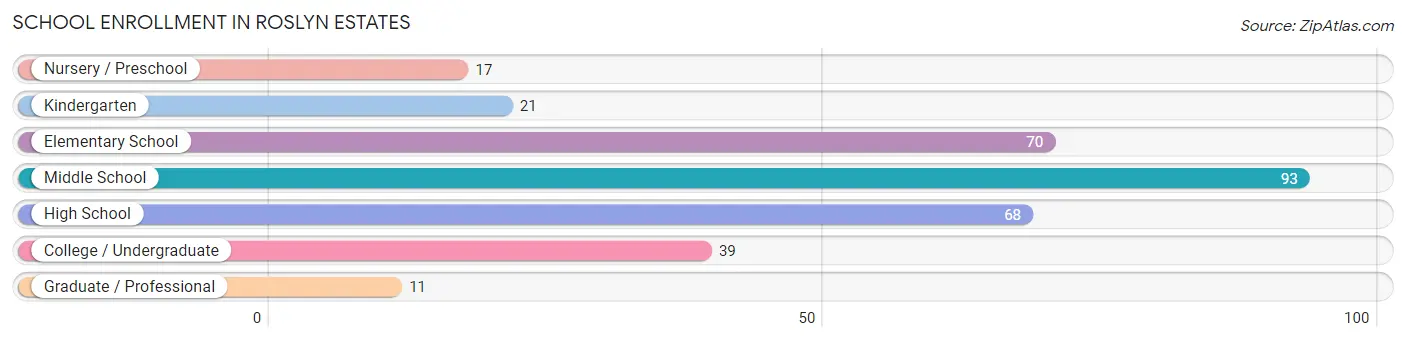
| School Level | # Students | % Students |
| Nursery / Preschool | 17 | 5.3% |
| Kindergarten | 21 | 6.6% |
| Elementary School | 70 | 21.9% |
| Middle School | 93 | 29.1% |
| High School | 68 | 21.3% |
| College / Undergraduate | 39 | 12.2% |
| Graduate / Professional | 11 | 3.5% |
| Total | 319 | 100.0% |
School Enrollment by Age by Funding Source in Roslyn Estates
Out of a total of 319 students who are enrolled in schools in Roslyn Estates, 82 (25.7%) attend a private institution, while the remaining 237 (74.3%) are enrolled in public schools. The age group of 25 to 34 year olds has the highest likelihood of being enrolled in private schools, with 7 (100.0% in the age bracket) enrolled. Conversely, the age group of 15 to 17 year olds has the lowest likelihood of being enrolled in a private school, with 61 (100.0% in the age bracket) attending a public institution.
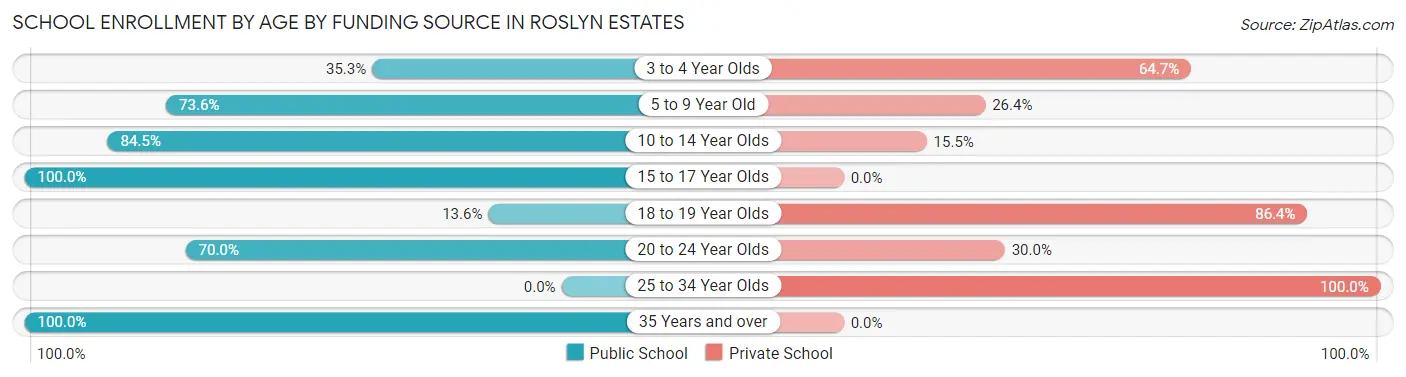
| Age Bracket | Public School | Private School |
| 3 to 4 Year Olds | 6 (35.3%) | 11 (64.7%) |
| 5 to 9 Year Old | 67 (73.6%) | 24 (26.4%) |
| 10 to 14 Year Olds | 82 (84.5%) | 15 (15.5%) |
| 15 to 17 Year Olds | 61 (100.0%) | 0 (0.0%) |
| 18 to 19 Year Olds | 3 (13.6%) | 19 (86.4%) |
| 20 to 24 Year Olds | 14 (70.0%) | 6 (30.0%) |
| 25 to 34 Year Olds | 0 (0.0%) | 7 (100.0%) |
| 35 Years and over | 4 (100.0%) | 0 (0.0%) |
| Total | 237 (74.3%) | 82 (25.7%) |
Educational Attainment by Field of Study in Roslyn Estates
Business (172 | 22.7%), social sciences (138 | 18.2%), education (90 | 11.9%), bio, nature & agricultural (60 | 7.9%), and literature & languages (55 | 7.2%) are the most common fields of study among 759 individuals in Roslyn Estates who have obtained a bachelor's degree or higher.
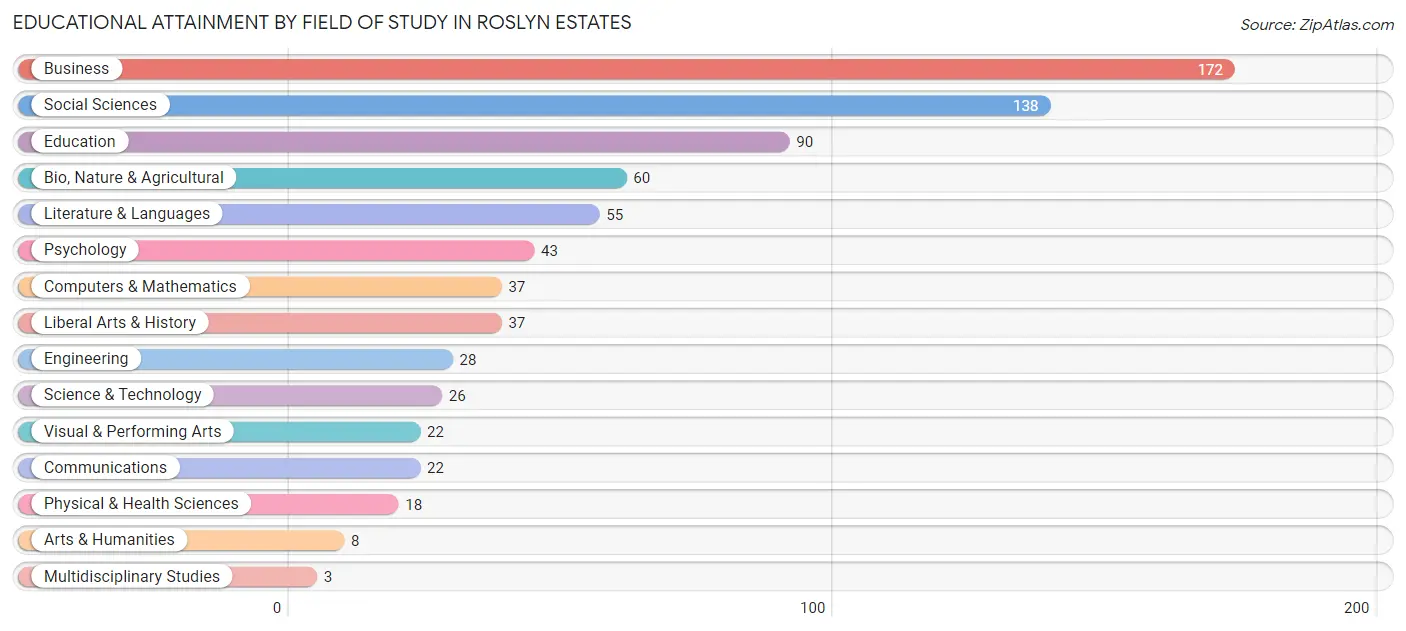
| Field of Study | # Graduates | % Graduates |
| Computers & Mathematics | 37 | 4.9% |
| Bio, Nature & Agricultural | 60 | 7.9% |
| Physical & Health Sciences | 18 | 2.4% |
| Psychology | 43 | 5.7% |
| Social Sciences | 138 | 18.2% |
| Engineering | 28 | 3.7% |
| Multidisciplinary Studies | 3 | 0.4% |
| Science & Technology | 26 | 3.4% |
| Business | 172 | 22.7% |
| Education | 90 | 11.9% |
| Literature & Languages | 55 | 7.2% |
| Liberal Arts & History | 37 | 4.9% |
| Visual & Performing Arts | 22 | 2.9% |
| Communications | 22 | 2.9% |
| Arts & Humanities | 8 | 1.1% |
| Total | 759 | 100.0% |
Transportation & Commute in Roslyn Estates
Vehicle Availability by Sex in Roslyn Estates
The most prevalent vehicle ownership categories in Roslyn Estates are males with 2 vehicles (176, accounting for 46.6%) and females with 2 vehicles (92, making up 72.1%).
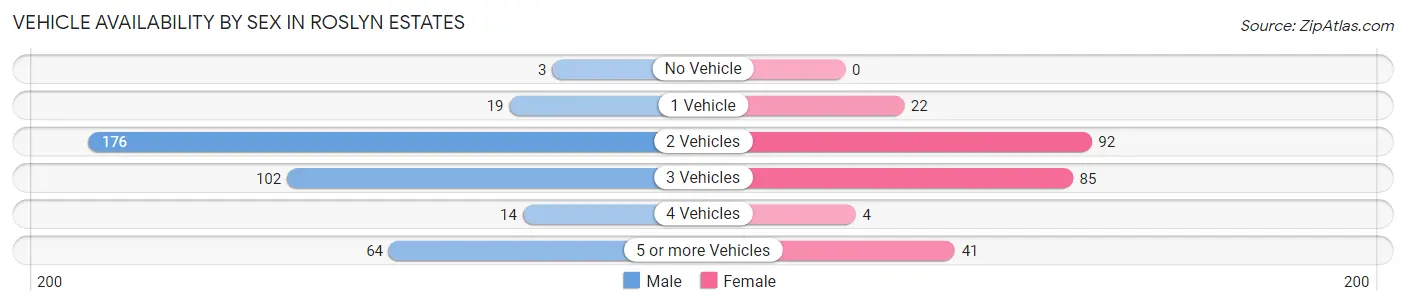
| Vehicles Available | Male | Female |
| No Vehicle | 3 (0.8%) | 0 (0.0%) |
| 1 Vehicle | 19 (5.0%) | 22 (9.0%) |
| 2 Vehicles | 176 (46.6%) | 92 (37.7%) |
| 3 Vehicles | 102 (27.0%) | 85 (34.8%) |
| 4 Vehicles | 14 (3.7%) | 4 (1.6%) |
| 5 or more Vehicles | 64 (16.9%) | 41 (16.8%) |
| Total | 378 (100.0%) | 244 (100.0%) |
Commute Time in Roslyn Estates
The most frequently occuring commute durations in Roslyn Estates are 60 to 89 minutes (120 commuters, 21.5%), 30 to 34 minutes (104 commuters, 18.6%), and 90 or more minutes (85 commuters, 15.2%).
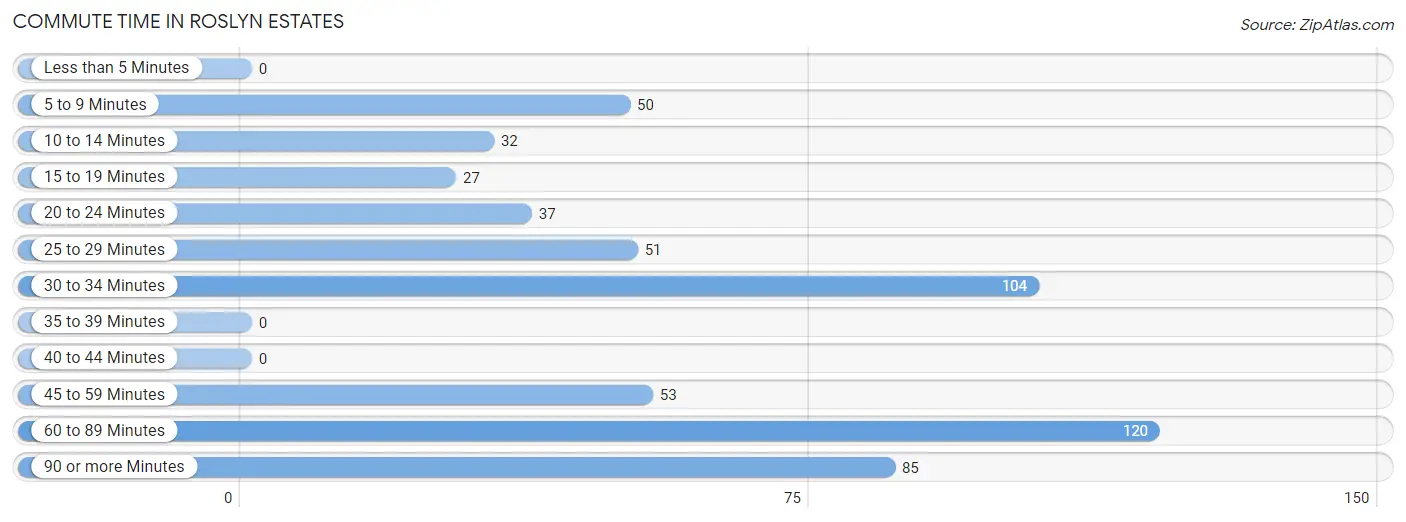
| Commute Time | # Commuters | % Commuters |
| Less than 5 Minutes | 0 | 0.0% |
| 5 to 9 Minutes | 50 | 8.9% |
| 10 to 14 Minutes | 32 | 5.7% |
| 15 to 19 Minutes | 27 | 4.8% |
| 20 to 24 Minutes | 37 | 6.6% |
| 25 to 29 Minutes | 51 | 9.1% |
| 30 to 34 Minutes | 104 | 18.6% |
| 35 to 39 Minutes | 0 | 0.0% |
| 40 to 44 Minutes | 0 | 0.0% |
| 45 to 59 Minutes | 53 | 9.5% |
| 60 to 89 Minutes | 120 | 21.5% |
| 90 or more Minutes | 85 | 15.2% |
Commute Time by Sex in Roslyn Estates
The most common commute times in Roslyn Estates are 60 to 89 minutes (81 commuters, 23.8%) for males and 25 to 29 minutes (43 commuters, 19.6%) for females.
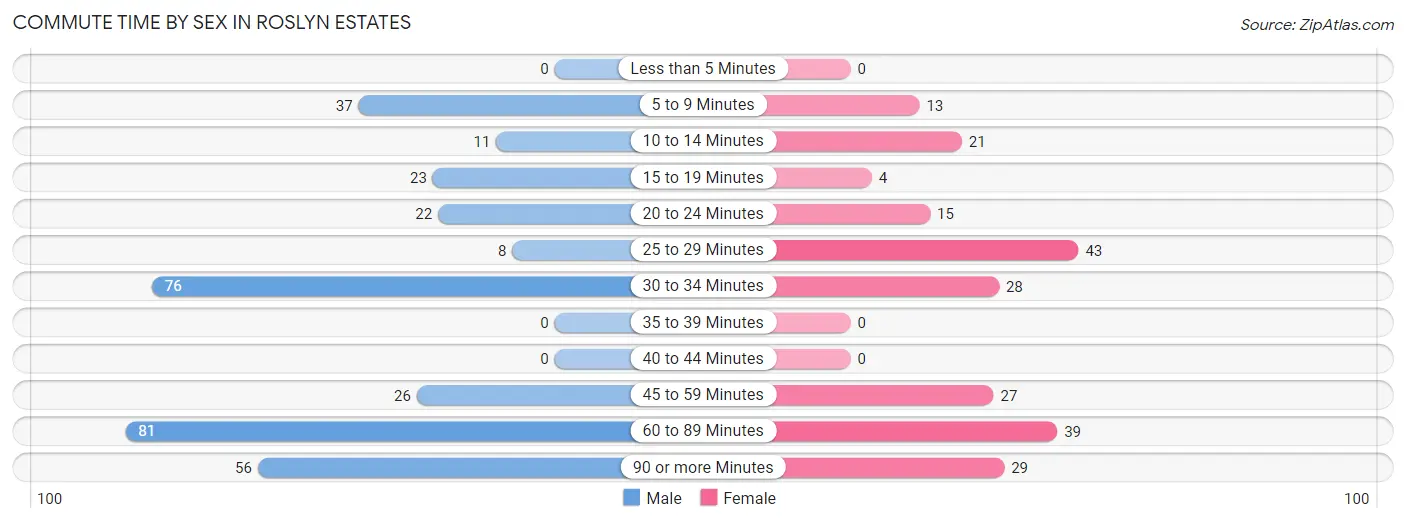
| Commute Time | Male | Female |
| Less than 5 Minutes | 0 (0.0%) | 0 (0.0%) |
| 5 to 9 Minutes | 37 (10.9%) | 13 (5.9%) |
| 10 to 14 Minutes | 11 (3.2%) | 21 (9.6%) |
| 15 to 19 Minutes | 23 (6.8%) | 4 (1.8%) |
| 20 to 24 Minutes | 22 (6.5%) | 15 (6.9%) |
| 25 to 29 Minutes | 8 (2.4%) | 43 (19.6%) |
| 30 to 34 Minutes | 76 (22.4%) | 28 (12.8%) |
| 35 to 39 Minutes | 0 (0.0%) | 0 (0.0%) |
| 40 to 44 Minutes | 0 (0.0%) | 0 (0.0%) |
| 45 to 59 Minutes | 26 (7.6%) | 27 (12.3%) |
| 60 to 89 Minutes | 81 (23.8%) | 39 (17.8%) |
| 90 or more Minutes | 56 (16.5%) | 29 (13.2%) |
Time of Departure to Work by Sex in Roslyn Estates
The most frequent times of departure to work in Roslyn Estates are 8:00 AM to 8:29 AM (82, 24.1%) for males and 9:00 AM to 9:59 AM (59, 26.9%) for females.
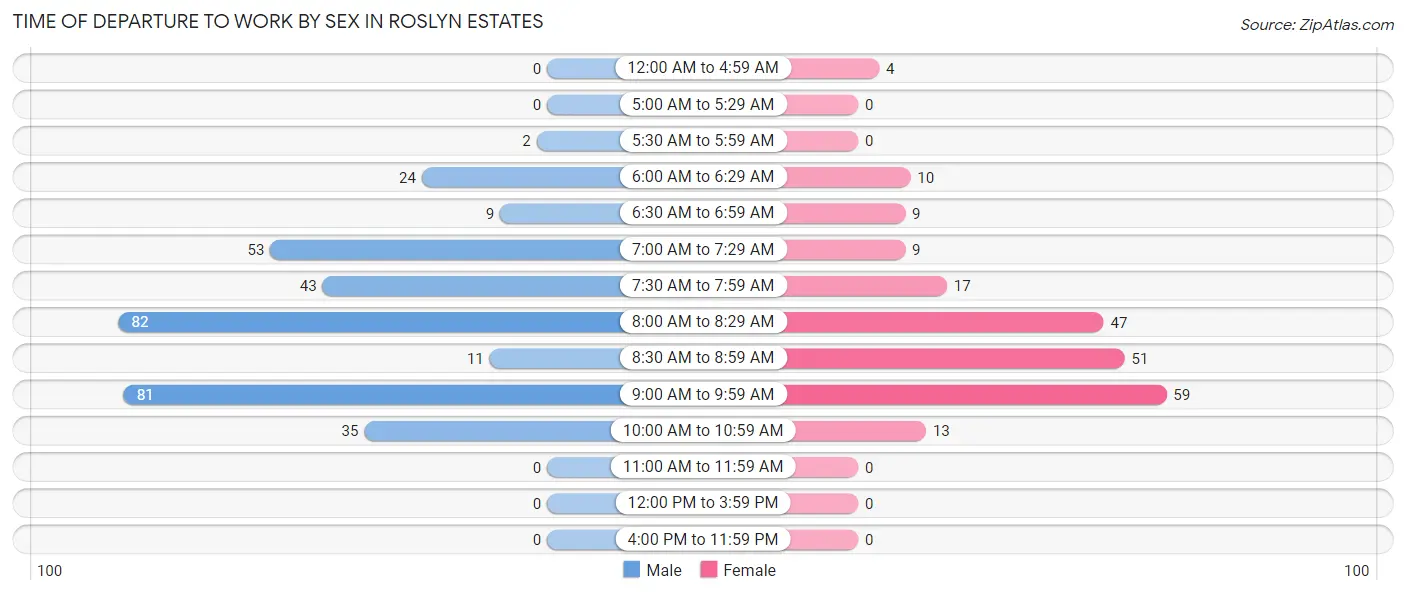
| Time of Departure | Male | Female |
| 12:00 AM to 4:59 AM | 0 (0.0%) | 4 (1.8%) |
| 5:00 AM to 5:29 AM | 0 (0.0%) | 0 (0.0%) |
| 5:30 AM to 5:59 AM | 2 (0.6%) | 0 (0.0%) |
| 6:00 AM to 6:29 AM | 24 (7.1%) | 10 (4.6%) |
| 6:30 AM to 6:59 AM | 9 (2.6%) | 9 (4.1%) |
| 7:00 AM to 7:29 AM | 53 (15.6%) | 9 (4.1%) |
| 7:30 AM to 7:59 AM | 43 (12.7%) | 17 (7.8%) |
| 8:00 AM to 8:29 AM | 82 (24.1%) | 47 (21.5%) |
| 8:30 AM to 8:59 AM | 11 (3.2%) | 51 (23.3%) |
| 9:00 AM to 9:59 AM | 81 (23.8%) | 59 (26.9%) |
| 10:00 AM to 10:59 AM | 35 (10.3%) | 13 (5.9%) |
| 11:00 AM to 11:59 AM | 0 (0.0%) | 0 (0.0%) |
| 12:00 PM to 3:59 PM | 0 (0.0%) | 0 (0.0%) |
| 4:00 PM to 11:59 PM | 0 (0.0%) | 0 (0.0%) |
| Total | 340 (100.0%) | 219 (100.0%) |
Housing Occupancy in Roslyn Estates
Occupancy by Ownership in Roslyn Estates
Of the total 434 dwellings in Roslyn Estates, owner-occupied units account for 431 (99.3%), while renter-occupied units make up 3 (0.7%).
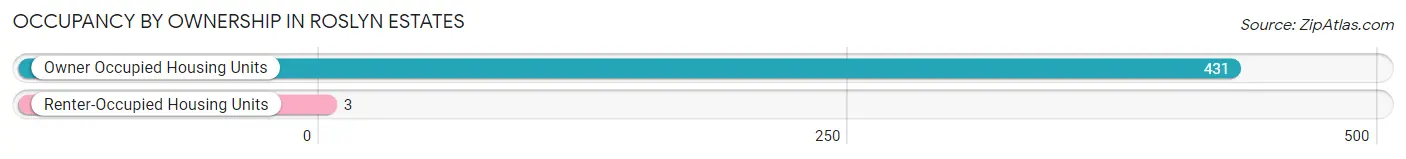
| Occupancy | # Housing Units | % Housing Units |
| Owner Occupied Housing Units | 431 | 99.3% |
| Renter-Occupied Housing Units | 3 | 0.7% |
| Total Occupied Housing Units | 434 | 100.0% |
Occupancy by Household Size in Roslyn Estates
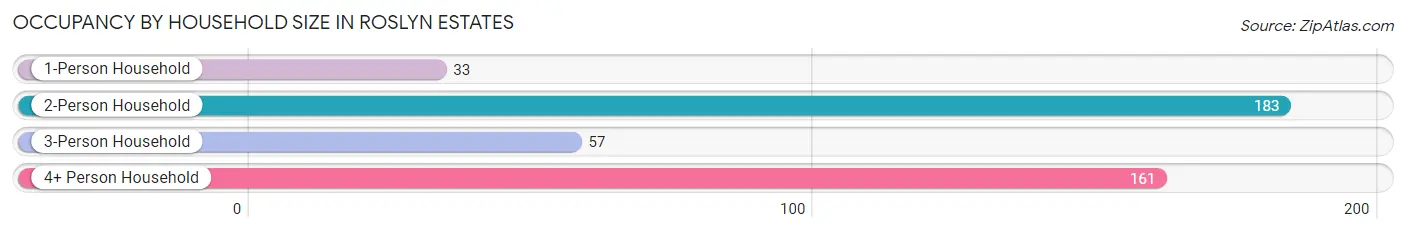
| Household Size | # Housing Units | % Housing Units |
| 1-Person Household | 33 | 7.6% |
| 2-Person Household | 183 | 42.2% |
| 3-Person Household | 57 | 13.1% |
| 4+ Person Household | 161 | 37.1% |
| Total Housing Units | 434 | 100.0% |
Occupancy by Ownership by Household Size in Roslyn Estates
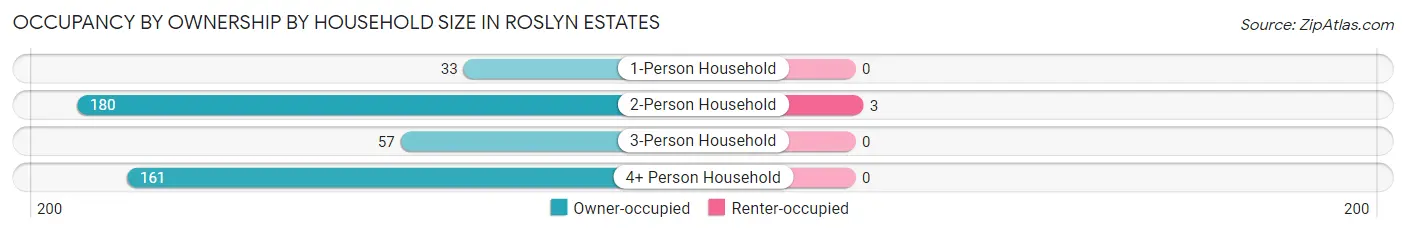
| Household Size | Owner-occupied | Renter-occupied |
| 1-Person Household | 33 (100.0%) | 0 (0.0%) |
| 2-Person Household | 180 (98.4%) | 3 (1.6%) |
| 3-Person Household | 57 (100.0%) | 0 (0.0%) |
| 4+ Person Household | 161 (100.0%) | 0 (0.0%) |
| Total Housing Units | 431 (99.3%) | 3 (0.7%) |
Occupancy by Educational Attainment in Roslyn Estates
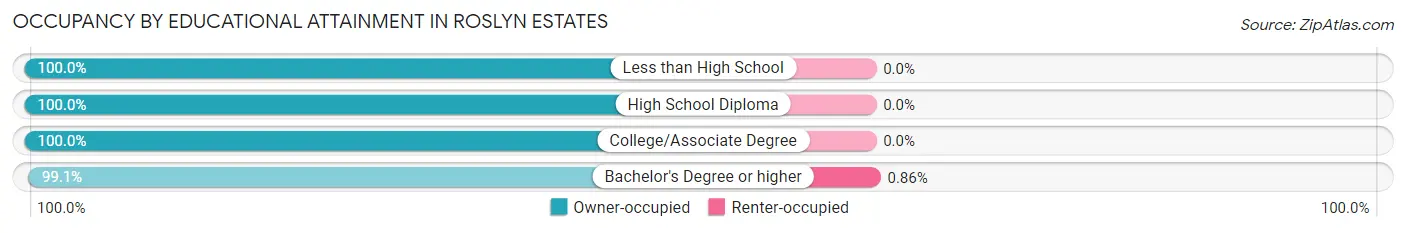
| Household Size | Owner-occupied | Renter-occupied |
| Less than High School | 2 (100.0%) | 0 (0.0%) |
| High School Diploma | 18 (100.0%) | 0 (0.0%) |
| College/Associate Degree | 66 (100.0%) | 0 (0.0%) |
| Bachelor's Degree or higher | 345 (99.1%) | 3 (0.9%) |
Occupancy by Age of Householder in Roslyn Estates
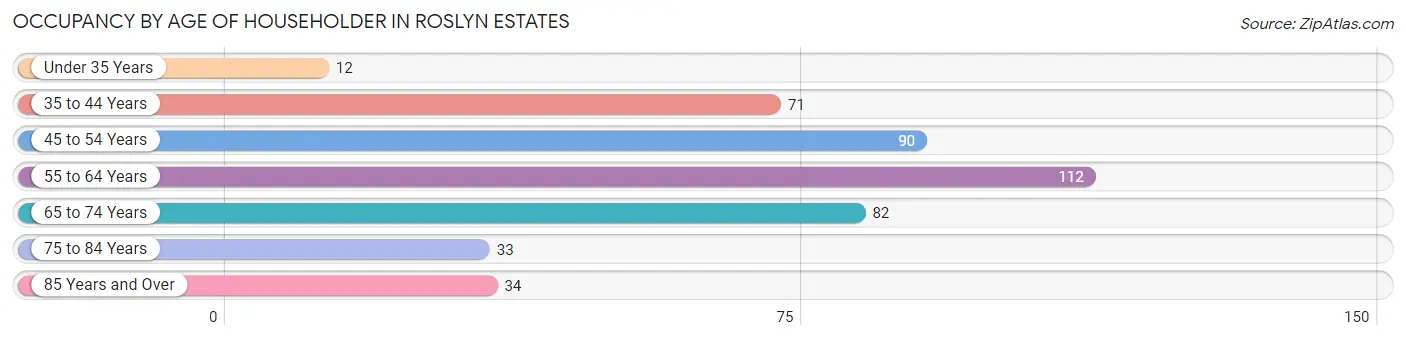
| Age Bracket | # Households | % Households |
| Under 35 Years | 12 | 2.8% |
| 35 to 44 Years | 71 | 16.4% |
| 45 to 54 Years | 90 | 20.7% |
| 55 to 64 Years | 112 | 25.8% |
| 65 to 74 Years | 82 | 18.9% |
| 75 to 84 Years | 33 | 7.6% |
| 85 Years and Over | 34 | 7.8% |
| Total | 434 | 100.0% |
Housing Finances in Roslyn Estates
Median Income by Occupancy in Roslyn Estates
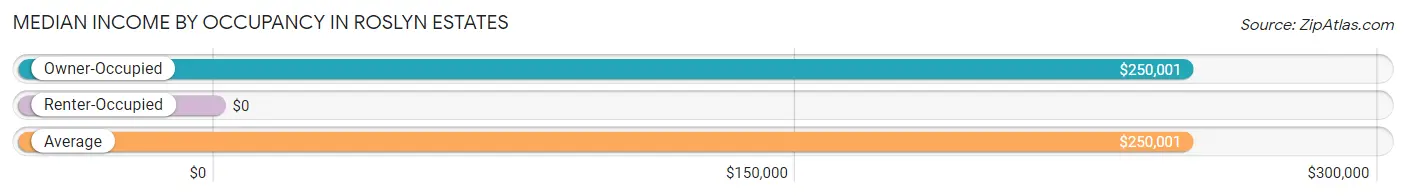
| Occupancy Type | # Households | Median Income |
| Owner-Occupied | 431 (99.3%) | $250,001 |
| Renter-Occupied | 3 (0.7%) | $0 |
| Average | 434 (100.0%) | $250,001 |
Occupancy by Householder Income Bracket in Roslyn Estates
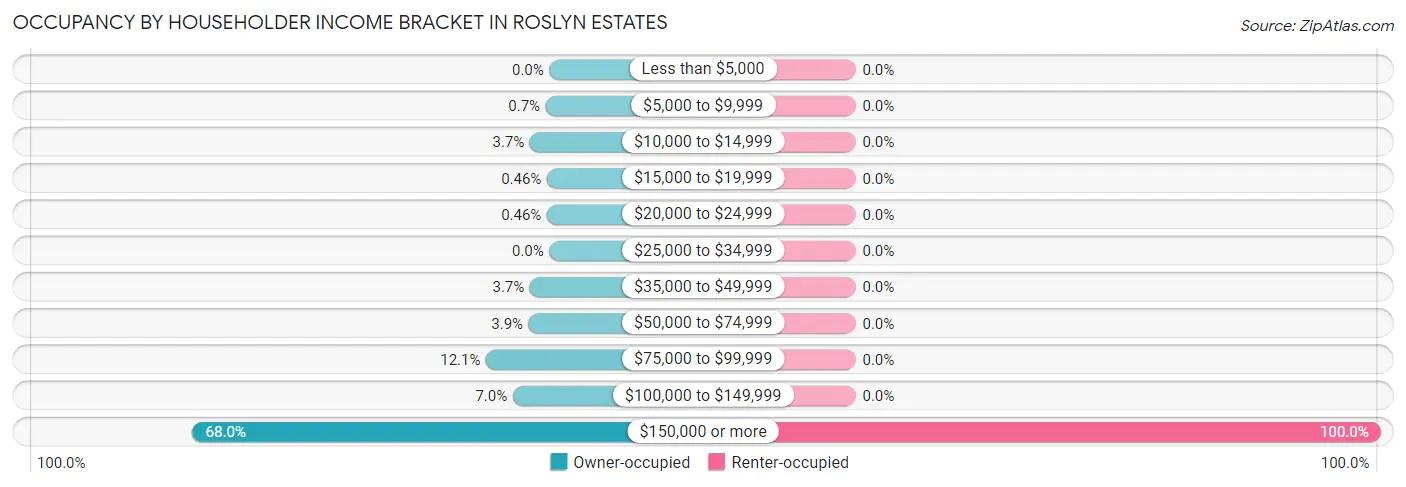
| Income Bracket | Owner-occupied | Renter-occupied |
| Less than $5,000 | 0 (0.0%) | 0 (0.0%) |
| $5,000 to $9,999 | 3 (0.7%) | 0 (0.0%) |
| $10,000 to $14,999 | 16 (3.7%) | 0 (0.0%) |
| $15,000 to $19,999 | 2 (0.5%) | 0 (0.0%) |
| $20,000 to $24,999 | 2 (0.5%) | 0 (0.0%) |
| $25,000 to $34,999 | 0 (0.0%) | 0 (0.0%) |
| $35,000 to $49,999 | 16 (3.7%) | 0 (0.0%) |
| $50,000 to $74,999 | 17 (3.9%) | 0 (0.0%) |
| $75,000 to $99,999 | 52 (12.1%) | 0 (0.0%) |
| $100,000 to $149,999 | 30 (7.0%) | 0 (0.0%) |
| $150,000 or more | 293 (68.0%) | 3 (100.0%) |
| Total | 431 (100.0%) | 3 (100.0%) |
Monthly Housing Cost Tiers in Roslyn Estates
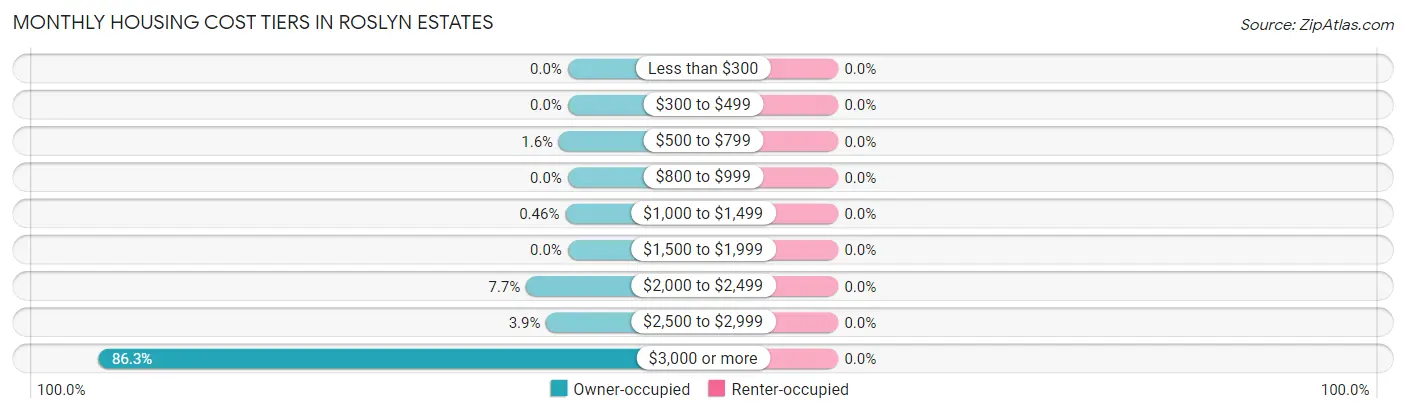
| Monthly Cost | Owner-occupied | Renter-occupied |
| Less than $300 | 0 (0.0%) | 0 (0.0%) |
| $300 to $499 | 0 (0.0%) | 0 (0.0%) |
| $500 to $799 | 7 (1.6%) | 0 (0.0%) |
| $800 to $999 | 0 (0.0%) | 0 (0.0%) |
| $1,000 to $1,499 | 2 (0.5%) | 0 (0.0%) |
| $1,500 to $1,999 | 0 (0.0%) | 0 (0.0%) |
| $2,000 to $2,499 | 33 (7.7%) | 0 (0.0%) |
| $2,500 to $2,999 | 17 (3.9%) | 0 (0.0%) |
| $3,000 or more | 372 (86.3%) | 0 (0.0%) |
| Total | 431 (100.0%) | 3 (100.0%) |
Physical Housing Characteristics in Roslyn Estates
Housing Structures in Roslyn Estates
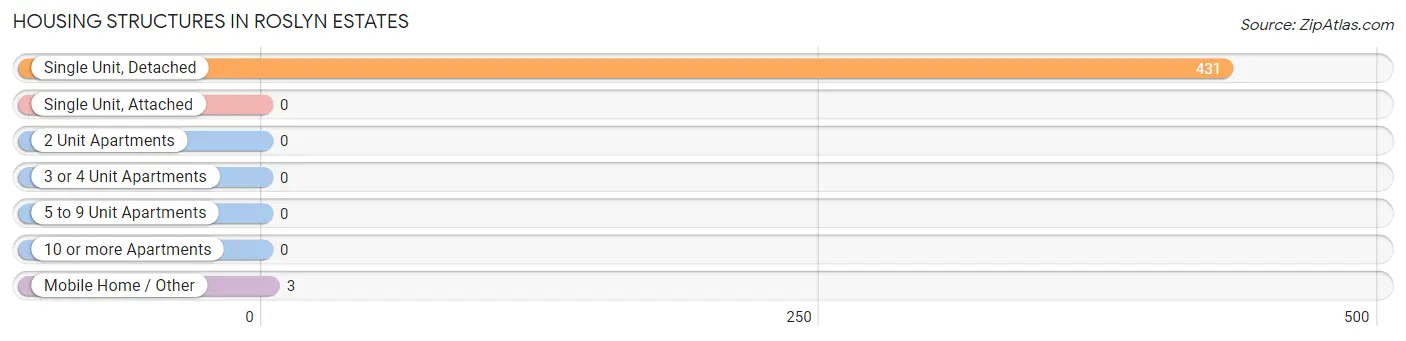
| Structure Type | # Housing Units | % Housing Units |
| Single Unit, Detached | 431 | 99.3% |
| Single Unit, Attached | 0 | 0.0% |
| 2 Unit Apartments | 0 | 0.0% |
| 3 or 4 Unit Apartments | 0 | 0.0% |
| 5 to 9 Unit Apartments | 0 | 0.0% |
| 10 or more Apartments | 0 | 0.0% |
| Mobile Home / Other | 3 | 0.7% |
| Total | 434 | 100.0% |
Housing Structures by Occupancy in Roslyn Estates
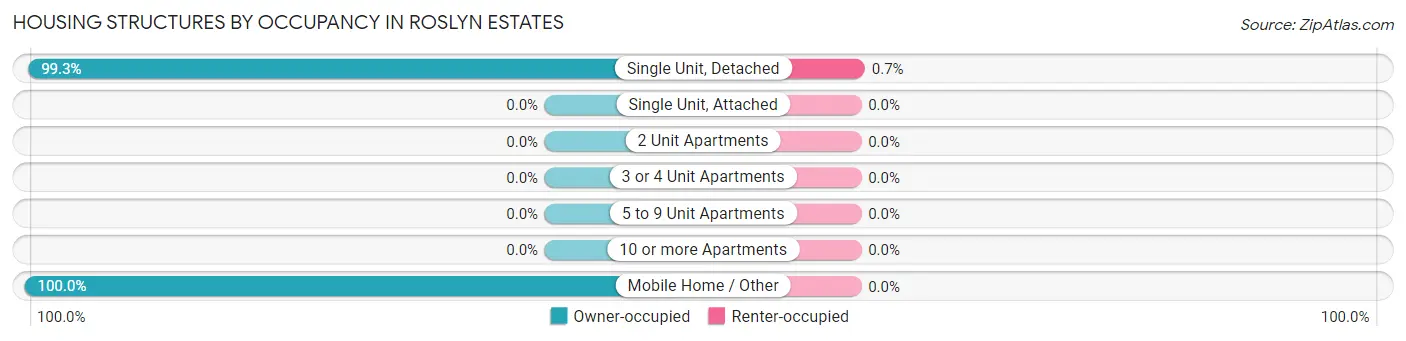
| Structure Type | Owner-occupied | Renter-occupied |
| Single Unit, Detached | 428 (99.3%) | 3 (0.7%) |
| Single Unit, Attached | 0 (0.0%) | 0 (0.0%) |
| 2 Unit Apartments | 0 (0.0%) | 0 (0.0%) |
| 3 or 4 Unit Apartments | 0 (0.0%) | 0 (0.0%) |
| 5 to 9 Unit Apartments | 0 (0.0%) | 0 (0.0%) |
| 10 or more Apartments | 0 (0.0%) | 0 (0.0%) |
| Mobile Home / Other | 3 (100.0%) | 0 (0.0%) |
| Total | 431 (99.3%) | 3 (0.7%) |
Housing Structures by Number of Rooms in Roslyn Estates
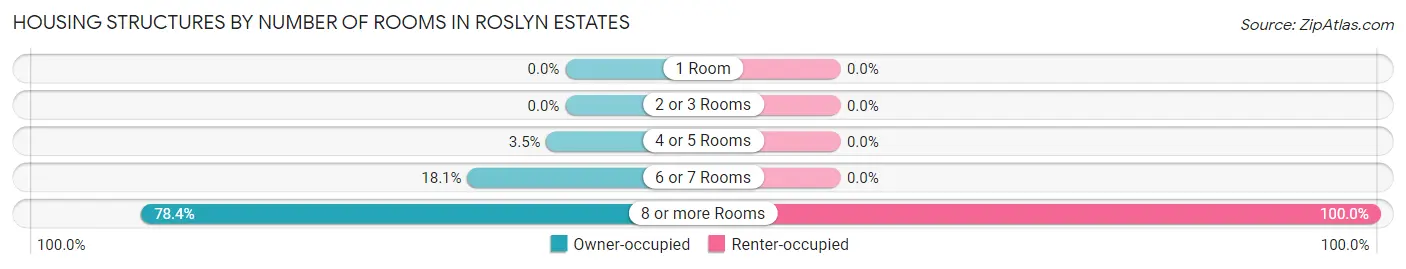
| Number of Rooms | Owner-occupied | Renter-occupied |
| 1 Room | 0 (0.0%) | 0 (0.0%) |
| 2 or 3 Rooms | 0 (0.0%) | 0 (0.0%) |
| 4 or 5 Rooms | 15 (3.5%) | 0 (0.0%) |
| 6 or 7 Rooms | 78 (18.1%) | 0 (0.0%) |
| 8 or more Rooms | 338 (78.4%) | 3 (100.0%) |
| Total | 431 (100.0%) | 3 (100.0%) |
Housing Structure by Heating Type in Roslyn Estates
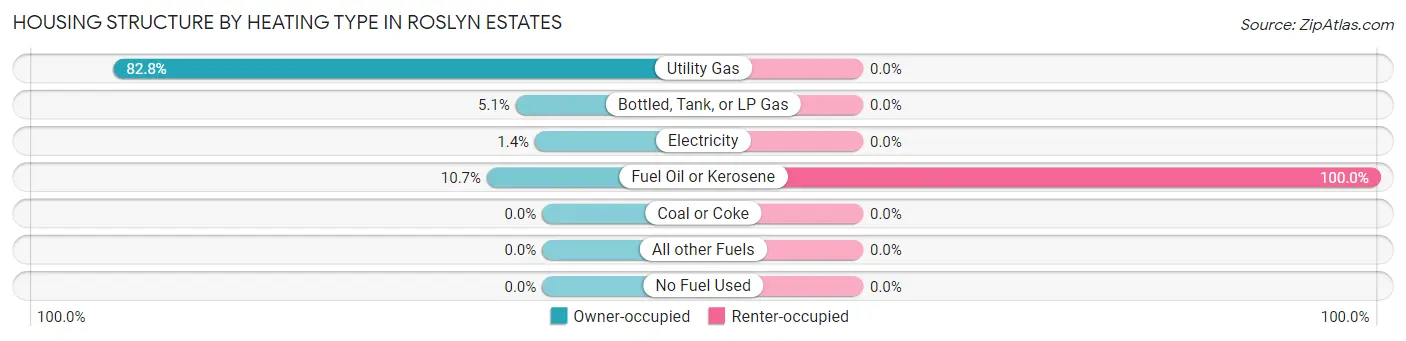
| Heating Type | Owner-occupied | Renter-occupied |
| Utility Gas | 357 (82.8%) | 0 (0.0%) |
| Bottled, Tank, or LP Gas | 22 (5.1%) | 0 (0.0%) |
| Electricity | 6 (1.4%) | 0 (0.0%) |
| Fuel Oil or Kerosene | 46 (10.7%) | 3 (100.0%) |
| Coal or Coke | 0 (0.0%) | 0 (0.0%) |
| All other Fuels | 0 (0.0%) | 0 (0.0%) |
| No Fuel Used | 0 (0.0%) | 0 (0.0%) |
| Total | 431 (100.0%) | 3 (100.0%) |
Household Vehicle Usage in Roslyn Estates
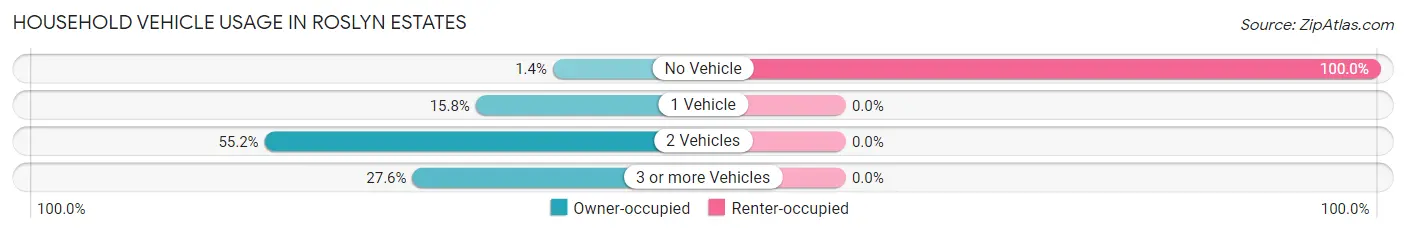
| Vehicles per Household | Owner-occupied | Renter-occupied |
| No Vehicle | 6 (1.4%) | 3 (100.0%) |
| 1 Vehicle | 68 (15.8%) | 0 (0.0%) |
| 2 Vehicles | 238 (55.2%) | 0 (0.0%) |
| 3 or more Vehicles | 119 (27.6%) | 0 (0.0%) |
| Total | 431 (100.0%) | 3 (100.0%) |
Real Estate & Mortgages in Roslyn Estates
Real Estate and Mortgage Overview in Roslyn Estates
| Characteristic | Without Mortgage | With Mortgage |
| Housing Units | 164 | 267 |
| Median Property Value | $1,598,400 | $1,704,700 |
| Median Household Income | - | - |
| Monthly Housing Costs | $1,501 | $249 |
| Real Estate Taxes | $10,001 | $0 |
Property Value by Mortgage Status in Roslyn Estates
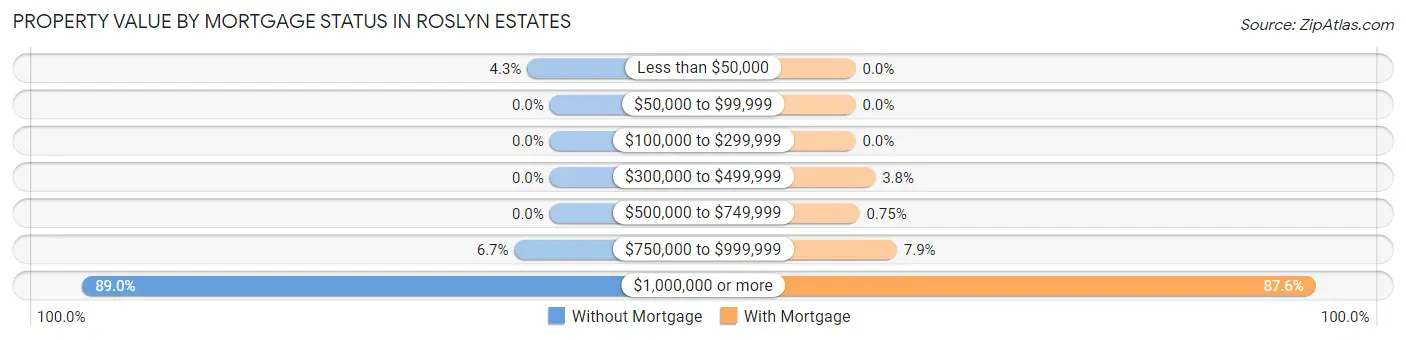
| Property Value | Without Mortgage | With Mortgage |
| Less than $50,000 | 7 (4.3%) | 0 (0.0%) |
| $50,000 to $99,999 | 0 (0.0%) | 0 (0.0%) |
| $100,000 to $299,999 | 0 (0.0%) | 0 (0.0%) |
| $300,000 to $499,999 | 0 (0.0%) | 10 (3.7%) |
| $500,000 to $749,999 | 0 (0.0%) | 2 (0.7%) |
| $750,000 to $999,999 | 11 (6.7%) | 21 (7.9%) |
| $1,000,000 or more | 146 (89.0%) | 234 (87.6%) |
| Total | 164 (100.0%) | 267 (100.0%) |
Household Income by Mortgage Status in Roslyn Estates
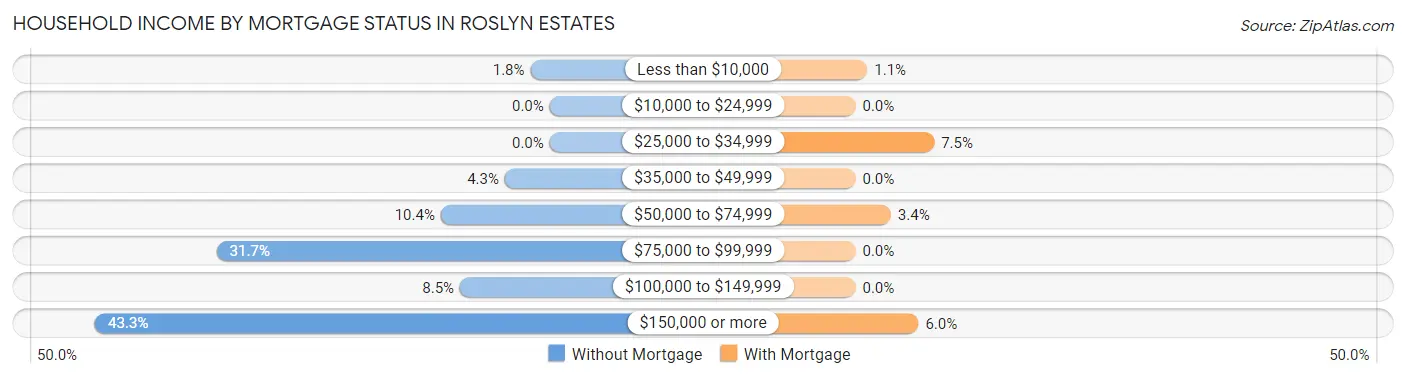
| Household Income | Without Mortgage | With Mortgage |
| Less than $10,000 | 3 (1.8%) | 3 (1.1%) |
| $10,000 to $24,999 | 0 (0.0%) | 0 (0.0%) |
| $25,000 to $34,999 | 0 (0.0%) | 20 (7.5%) |
| $35,000 to $49,999 | 7 (4.3%) | 0 (0.0%) |
| $50,000 to $74,999 | 17 (10.4%) | 9 (3.4%) |
| $75,000 to $99,999 | 52 (31.7%) | 0 (0.0%) |
| $100,000 to $149,999 | 14 (8.5%) | 0 (0.0%) |
| $150,000 or more | 71 (43.3%) | 16 (6.0%) |
| Total | 164 (100.0%) | 267 (100.0%) |
Property Value to Household Income Ratio in Roslyn Estates
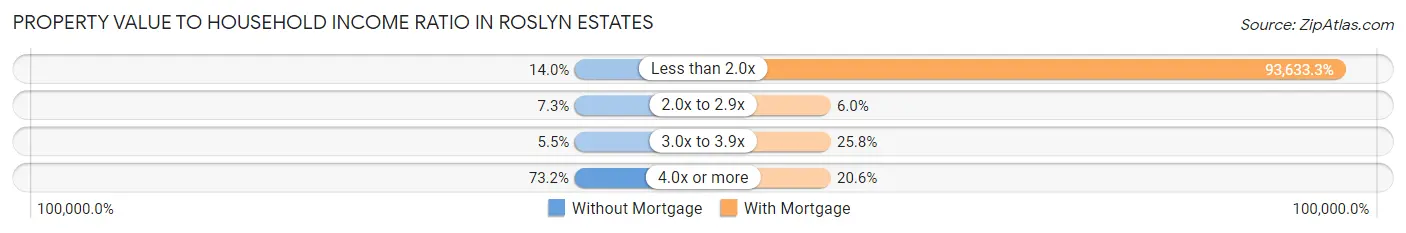
| Value-to-Income Ratio | Without Mortgage | With Mortgage |
| Less than 2.0x | 23 (14.0%) | 250,001 (93,633.3%) |
| 2.0x to 2.9x | 12 (7.3%) | 16 (6.0%) |
| 3.0x to 3.9x | 9 (5.5%) | 69 (25.8%) |
| 4.0x or more | 120 (73.2%) | 55 (20.6%) |
| Total | 164 (100.0%) | 267 (100.0%) |
Real Estate Taxes by Mortgage Status in Roslyn Estates
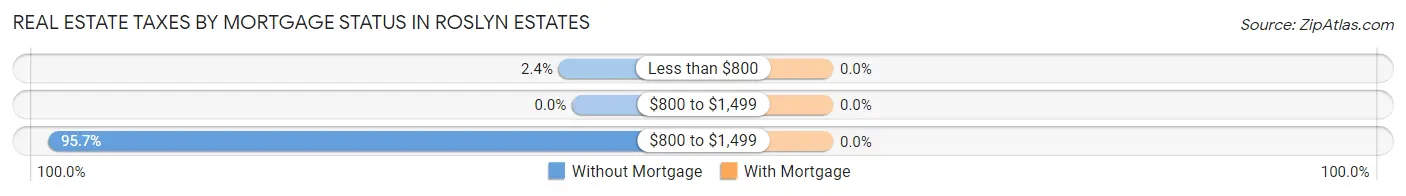
| Property Taxes | Without Mortgage | With Mortgage |
| Less than $800 | 4 (2.4%) | 0 (0.0%) |
| $800 to $1,499 | 0 (0.0%) | 0 (0.0%) |
| $800 to $1,499 | 157 (95.7%) | 0 (0.0%) |
| Total | 164 (100.0%) | 267 (100.0%) |
Health & Disability in Roslyn Estates
Health Insurance Coverage by Age in Roslyn Estates
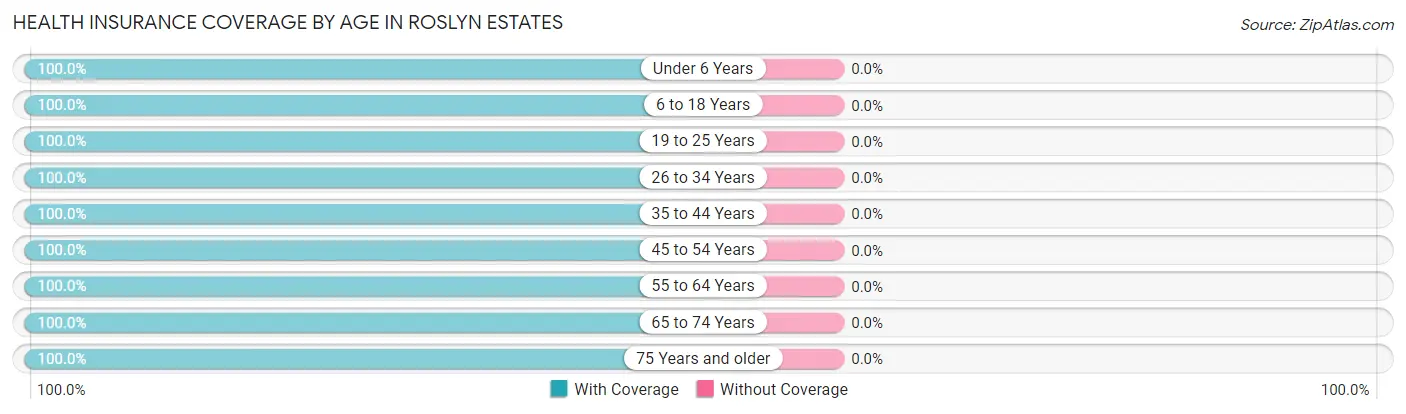
| Age Bracket | With Coverage | Without Coverage |
| Under 6 Years | 85 (100.0%) | 0 (0.0%) |
| 6 to 18 Years | 251 (100.0%) | 0 (0.0%) |
| 19 to 25 Years | 110 (100.0%) | 0 (0.0%) |
| 26 to 34 Years | 48 (100.0%) | 0 (0.0%) |
| 35 to 44 Years | 186 (100.0%) | 0 (0.0%) |
| 45 to 54 Years | 165 (100.0%) | 0 (0.0%) |
| 55 to 64 Years | 227 (100.0%) | 0 (0.0%) |
| 65 to 74 Years | 135 (100.0%) | 0 (0.0%) |
| 75 Years and older | 143 (100.0%) | 0 (0.0%) |
| Total | 1,350 (100.0%) | 0 (0.0%) |
Health Insurance Coverage by Citizenship Status in Roslyn Estates
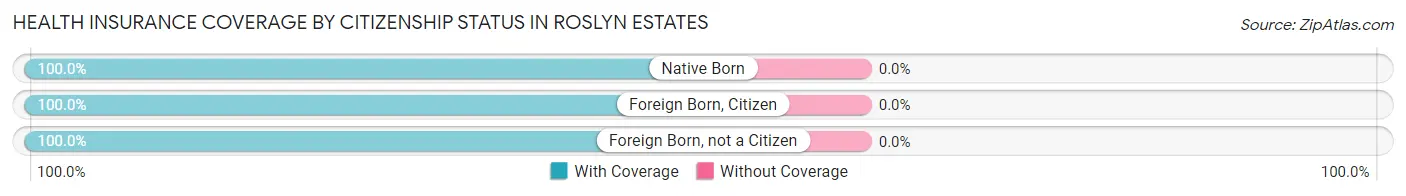
| Citizenship Status | With Coverage | Without Coverage |
| Native Born | 85 (100.0%) | 0 (0.0%) |
| Foreign Born, Citizen | 251 (100.0%) | 0 (0.0%) |
| Foreign Born, not a Citizen | 110 (100.0%) | 0 (0.0%) |
Health Insurance Coverage by Household Income in Roslyn Estates
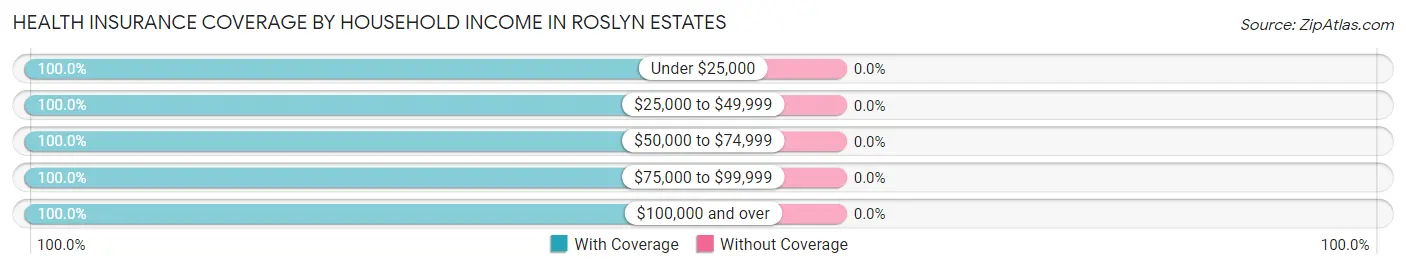
| Household Income | With Coverage | Without Coverage |
| Under $25,000 | 71 (100.0%) | 0 (0.0%) |
| $25,000 to $49,999 | 33 (100.0%) | 0 (0.0%) |
| $50,000 to $74,999 | 33 (100.0%) | 0 (0.0%) |
| $75,000 to $99,999 | 99 (100.0%) | 0 (0.0%) |
| $100,000 and over | 1,114 (100.0%) | 0 (0.0%) |
Public vs Private Health Insurance Coverage by Age in Roslyn Estates
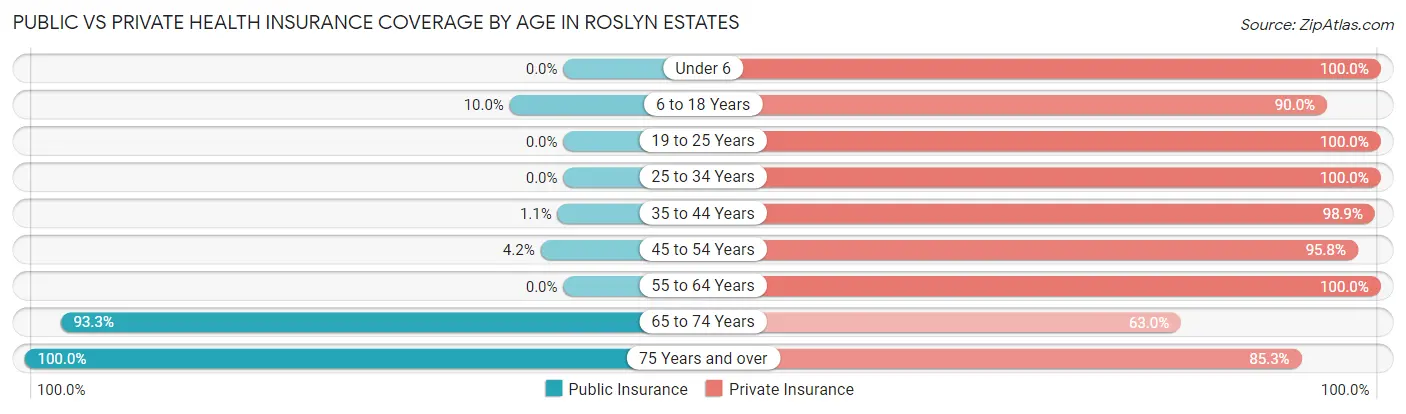
| Age Bracket | Public Insurance | Private Insurance |
| Under 6 | 0 (0.0%) | 85 (100.0%) |
| 6 to 18 Years | 25 (10.0%) | 226 (90.0%) |
| 19 to 25 Years | 0 (0.0%) | 110 (100.0%) |
| 25 to 34 Years | 0 (0.0%) | 48 (100.0%) |
| 35 to 44 Years | 2 (1.1%) | 184 (98.9%) |
| 45 to 54 Years | 7 (4.2%) | 158 (95.8%) |
| 55 to 64 Years | 0 (0.0%) | 227 (100.0%) |
| 65 to 74 Years | 126 (93.3%) | 85 (63.0%) |
| 75 Years and over | 143 (100.0%) | 122 (85.3%) |
| Total | 303 (22.4%) | 1,245 (92.2%) |
Disability Status by Sex by Age in Roslyn Estates
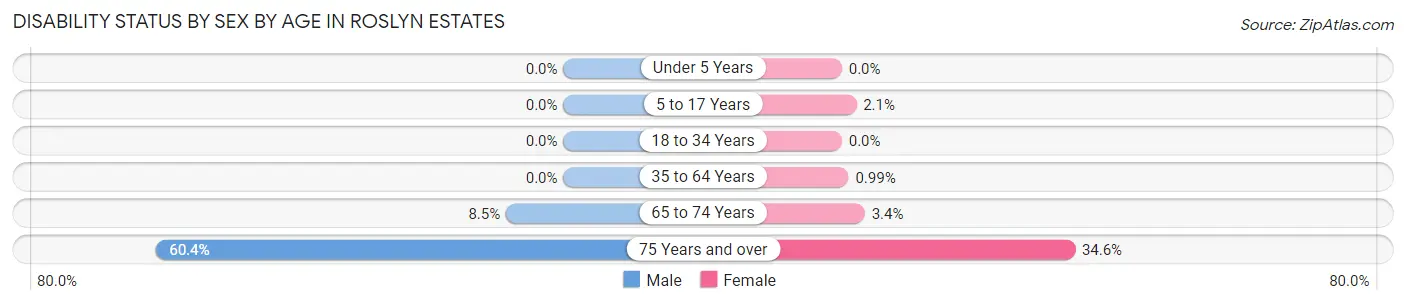
| Age Bracket | Male | Female |
| Under 5 Years | 0 (0.0%) | 0 (0.0%) |
| 5 to 17 Years | 0 (0.0%) | 3 (2.1%) |
| 18 to 34 Years | 0 (0.0%) | 0 (0.0%) |
| 35 to 64 Years | 0 (0.0%) | 3 (1.0%) |
| 65 to 74 Years | 4 (8.5%) | 3 (3.4%) |
| 75 Years and over | 55 (60.4%) | 18 (34.6%) |
Disability Class by Sex by Age in Roslyn Estates
Disability Class: Hearing Difficulty
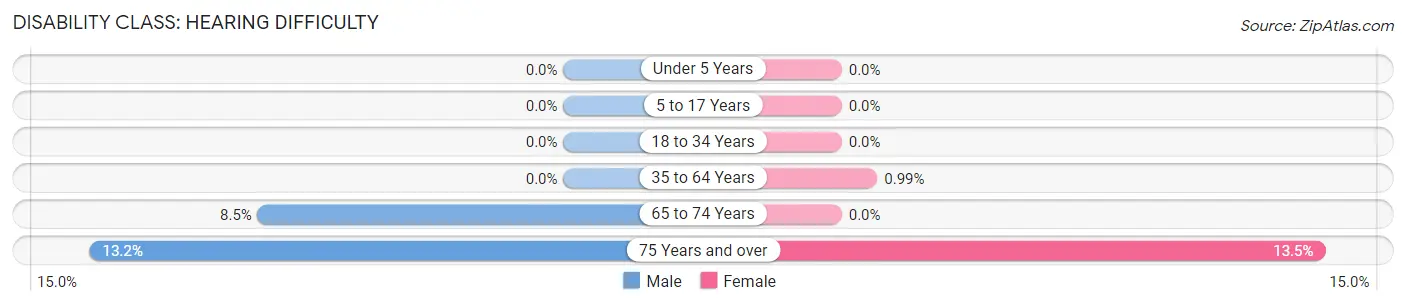
| Age Bracket | Male | Female |
| Under 5 Years | 0 (0.0%) | 0 (0.0%) |
| 5 to 17 Years | 0 (0.0%) | 0 (0.0%) |
| 18 to 34 Years | 0 (0.0%) | 0 (0.0%) |
| 35 to 64 Years | 0 (0.0%) | 3 (1.0%) |
| 65 to 74 Years | 4 (8.5%) | 0 (0.0%) |
| 75 Years and over | 12 (13.2%) | 7 (13.5%) |
Disability Class: Vision Difficulty
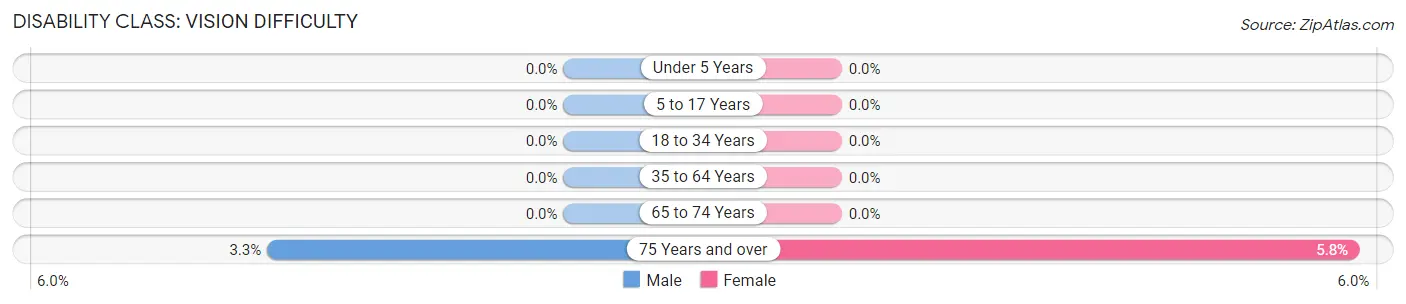
| Age Bracket | Male | Female |
| Under 5 Years | 0 (0.0%) | 0 (0.0%) |
| 5 to 17 Years | 0 (0.0%) | 0 (0.0%) |
| 18 to 34 Years | 0 (0.0%) | 0 (0.0%) |
| 35 to 64 Years | 0 (0.0%) | 0 (0.0%) |
| 65 to 74 Years | 0 (0.0%) | 0 (0.0%) |
| 75 Years and over | 3 (3.3%) | 3 (5.8%) |
Disability Class: Cognitive Difficulty
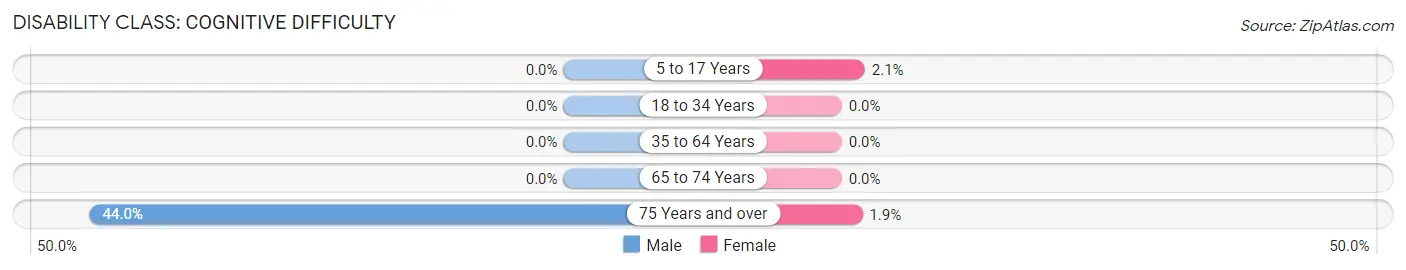
| Age Bracket | Male | Female |
| 5 to 17 Years | 0 (0.0%) | 3 (2.1%) |
| 18 to 34 Years | 0 (0.0%) | 0 (0.0%) |
| 35 to 64 Years | 0 (0.0%) | 0 (0.0%) |
| 65 to 74 Years | 0 (0.0%) | 0 (0.0%) |
| 75 Years and over | 40 (44.0%) | 1 (1.9%) |
Disability Class: Ambulatory Difficulty
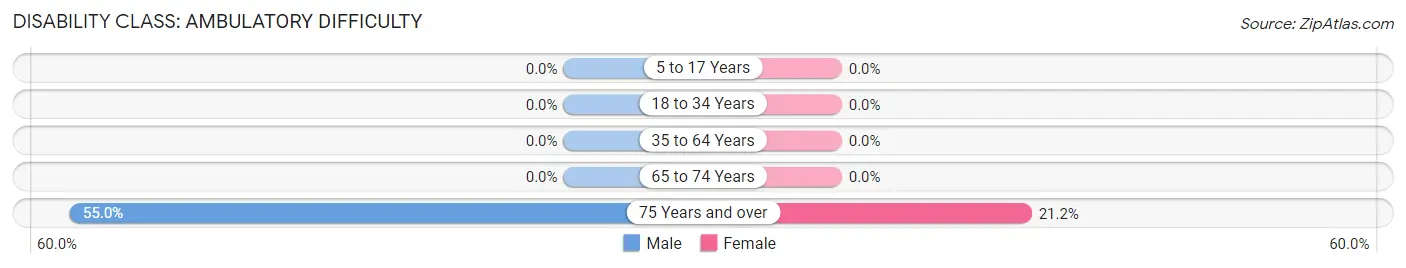
| Age Bracket | Male | Female |
| 5 to 17 Years | 0 (0.0%) | 0 (0.0%) |
| 18 to 34 Years | 0 (0.0%) | 0 (0.0%) |
| 35 to 64 Years | 0 (0.0%) | 0 (0.0%) |
| 65 to 74 Years | 0 (0.0%) | 0 (0.0%) |
| 75 Years and over | 50 (54.9%) | 11 (21.1%) |
Disability Class: Self-Care Difficulty
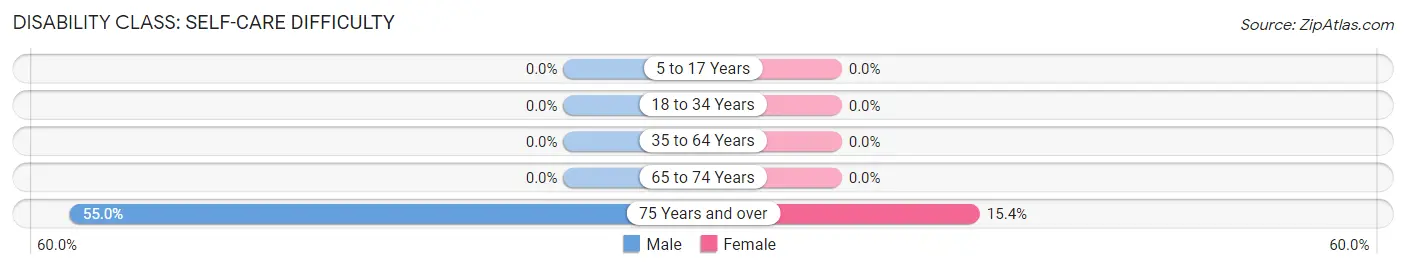
| Age Bracket | Male | Female |
| 5 to 17 Years | 0 (0.0%) | 0 (0.0%) |
| 18 to 34 Years | 0 (0.0%) | 0 (0.0%) |
| 35 to 64 Years | 0 (0.0%) | 0 (0.0%) |
| 65 to 74 Years | 0 (0.0%) | 0 (0.0%) |
| 75 Years and over | 50 (54.9%) | 8 (15.4%) |
Technology Access in Roslyn Estates
Computing Device Access in Roslyn Estates
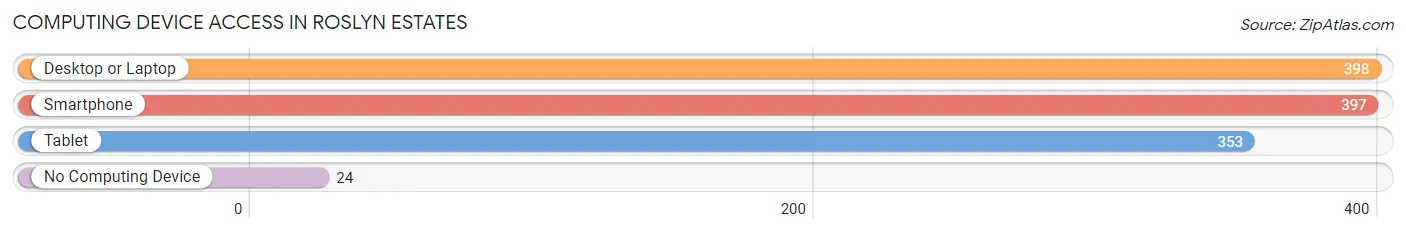
| Device Type | # Households | % Households |
| Desktop or Laptop | 398 | 91.7% |
| Smartphone | 397 | 91.5% |
| Tablet | 353 | 81.3% |
| No Computing Device | 24 | 5.5% |
| Total | 434 | 100.0% |
Internet Access in Roslyn Estates
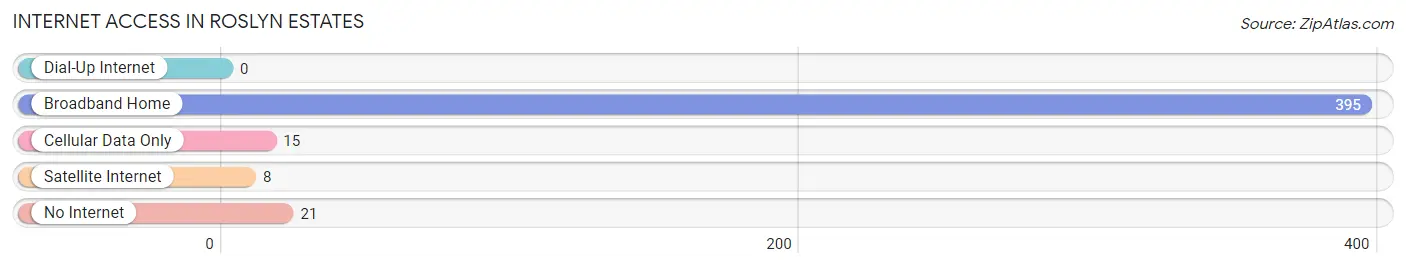
| Internet Type | # Households | % Households |
| Dial-Up Internet | 0 | 0.0% |
| Broadband Home | 395 | 91.0% |
| Cellular Data Only | 15 | 3.5% |
| Satellite Internet | 8 | 1.8% |
| No Internet | 21 | 4.8% |
| Total | 434 | 100.0% |
Roslyn Estates Summary
Roslyn Estates is a village located in Nassau County, New York, United States. It is located in the Town of North Hempstead, and is part of the Greater Roslyn area. The village was incorporated in 1931, and has a population of 1,717 as of the 2010 census.
Geography
Roslyn Estates is located at 40°48'17" North, 73°41'17" West (40.804722, -73.688056). It is located in the Town of North Hempstead, and is part of the Greater Roslyn area. The village is bordered by the villages of Roslyn Harbor to the north, East Hills to the east, and Roslyn to the south. The village is located on the north shore of Long Island, and is approximately 25 miles east of Manhattan.
The village has a total area of 0.3 square miles, all of which is land. The terrain is mostly flat, with some hills in the northern part of the village. The village is located in the Peconic Bay watershed.
Demographics
As of the 2010 census, there were 1,717 people, 645 households, and 486 families residing in the village. The population density was 5,723.3 people per square mile. There were 672 housing units at an average density of 2,240.0 per square mile. The racial makeup of the village was 94.2% White, 0.9% African American, 0.1% Native American, 2.7% Asian, 0.1% Pacific Islander, 0.7% from other races, and 1.3% from two or more races. Hispanic or Latino of any race were 3.7% of the population.
There were 645 households, out of which 33.2% had children under the age of 18 living with them, 63.2% were married couples living together, 7.3% had a female householder with no husband present, and 26.2% were non-families. 22.2% of all households were made up of individuals, and 11.2% had someone living alone who was 65 years of age or older. The average household size was 2.67 and the average family size was 3.14.
In the village, the population was spread out, with 24.2% under the age of 18, 4.2% from 18 to 24, 22.2% from 25 to 44, 32.2% from 45 to 64, and 17.2% who were 65 years of age or older. The median age was 44 years. For every 100 females, there were 94.2 males. For every 100 females age 18 and over, there were 91.2 males.
The median income for a household in the village was $125,000, and the median income for a family was $150,000. Males had a median income of $100,000 versus $50,000 for females. The per capita income for the village was $68,000. About 1.2% of families and 2.2% of the population were below the poverty line, including 0.9% of those under age 18 and 0.0% of those age 65 or over.
Economy
The economy of Roslyn Estates is largely based on the service industry. The village is home to a variety of restaurants, retail stores, and professional services. The village is also home to a number of financial services firms, including banks, investment firms, and insurance companies.
The village is also home to a number of educational institutions, including the Roslyn Estates School District, which serves students in grades K-12. The district is comprised of three elementary schools, one middle school, and one high school.
The village is also home to a number of parks and recreational facilities, including the Roslyn Estates Park, which features a playground, basketball court, and tennis courts. The village also has a number of public and private golf courses.
Conclusion
Roslyn Estates is a village located in Nassau County, New York, United States. It is located in the Town of North Hempstead, and is part of the Greater Roslyn area. The village was incorporated in 1931, and has a population of 1,717 as of the 2010 census. The village has a total area of 0.3 square miles, all of which is land. The terrain is mostly flat, with some hills in the northern part of the village. The village is located in the Peconic Bay watershed. The economy of Roslyn Estates is largely based on the service industry. The village is home to a variety of restaurants, retail stores, and professional services. The village is also home to a number of financial services firms, including banks, investment firms, and insurance companies. The village is also home to a number of educational institutions, including the Roslyn Estates School District, which serves students in grades K-12. The village is also home to a number of parks and recreational facilities.
Common Questions
What is Per Capita Income in Roslyn Estates?
Per Capita income in Roslyn Estates is $133,703.
What is the Median Family Income in Roslyn Estates?
Median Family Income in Roslyn Estates is $250,001.
What is the Median Household income in Roslyn Estates?
Median Household Income in Roslyn Estates is $250,001.
What is Income or Wage Gap in Roslyn Estates?
Income or Wage Gap in Roslyn Estates is 67.5%.
Women in Roslyn Estates earn 32.5 cents for every dollar earned by a man.
What is Inequality or Gini Index in Roslyn Estates?
Inequality or Gini Index in Roslyn Estates is 0.47.
What is the Total Population of Roslyn Estates?
Total Population of Roslyn Estates is 1,350.
What is the Total Male Population of Roslyn Estates?
Total Male Population of Roslyn Estates is 640.
What is the Total Female Population of Roslyn Estates?
Total Female Population of Roslyn Estates is 710.
What is the Ratio of Males per 100 Females in Roslyn Estates?
There are 90.14 Males per 100 Females in Roslyn Estates.
What is the Ratio of Females per 100 Males in Roslyn Estates?
There are 110.94 Females per 100 Males in Roslyn Estates.
What is the Median Population Age in Roslyn Estates?
Median Population Age in Roslyn Estates is 43.8 Years.
What is the Average Family Size in Roslyn Estates
Average Family Size in Roslyn Estates is 3.2 People.
What is the Average Household Size in Roslyn Estates
Average Household Size in Roslyn Estates is 3.1 People.
How Large is the Labor Force in Roslyn Estates?
There are 639 People in the Labor Forcein in Roslyn Estates.
What is the Percentage of People in the Labor Force in Roslyn Estates?
59.6% of People are in the Labor Force in Roslyn Estates.
What is the Unemployment Rate in Roslyn Estates?
Unemployment Rate in Roslyn Estates is 2.2%.