Lido Beach, NY Map & Demographics
Lido Beach Map
Lido Beach Overview
$87,967
PER CAPITA INCOME
$197,321
AVG FAMILY INCOME
$172,857
AVG HOUSEHOLD INCOME
66.8%
WAGE / INCOME GAP [ % ]
33.2¢/ $1
WAGE / INCOME GAP [ $ ]
$14,495
FAMILY INCOME DEFICIT
0.41
INEQUALITY / GINI INDEX
2,615
TOTAL POPULATION
1,362
MALE POPULATION
1,253
FEMALE POPULATION
108.70
MALES / 100 FEMALES
92.00
FEMALES / 100 MALES
53.1
MEDIAN AGE
2.8
AVG FAMILY SIZE
2.2
AVG HOUSEHOLD SIZE
1,385
LABOR FORCE [ PEOPLE ]
61.9%
PERCENT IN LABOR FORCE
5.3%
UNEMPLOYMENT RATE
Lido Beach Area Codes
Income in Lido Beach
Income Overview in Lido Beach
Per Capita Income in Lido Beach is $87,967, while median incomes of families and households are $197,321 and $172,857 respectively.
| Characteristic | Number | Measure |
| Per Capita Income | 2,615 | $87,967 |
| Median Family Income | 691 | $197,321 |
| Mean Family Income | 691 | $227,552 |
| Median Household Income | 1,182 | $172,857 |
| Mean Household Income | 1,182 | $192,143 |
| Income Deficit | 691 | $14,495 |
| Wage / Income Gap (%) | 2,615 | 66.84% |
| Wage / Income Gap ($) | 2,615 | 33.16¢ per $1 |
| Gini / Inequality Index | 2,615 | 0.41 |
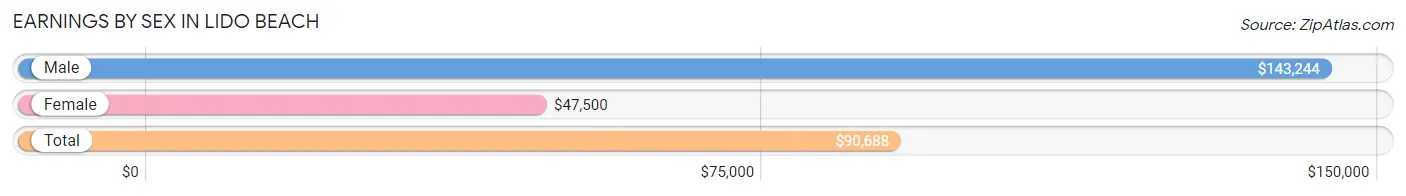
Earnings by Sex in Lido Beach
Average Earnings in Lido Beach are $90,688, $143,244 for men and $47,500 for women, a difference of 66.8%.
| Sex | Number | Average Earnings |
| Male | 861 (58.1%) | $143,244 |
| Female | 620 (41.9%) | $47,500 |
| Total | 1,481 (100.0%) | $90,688 |
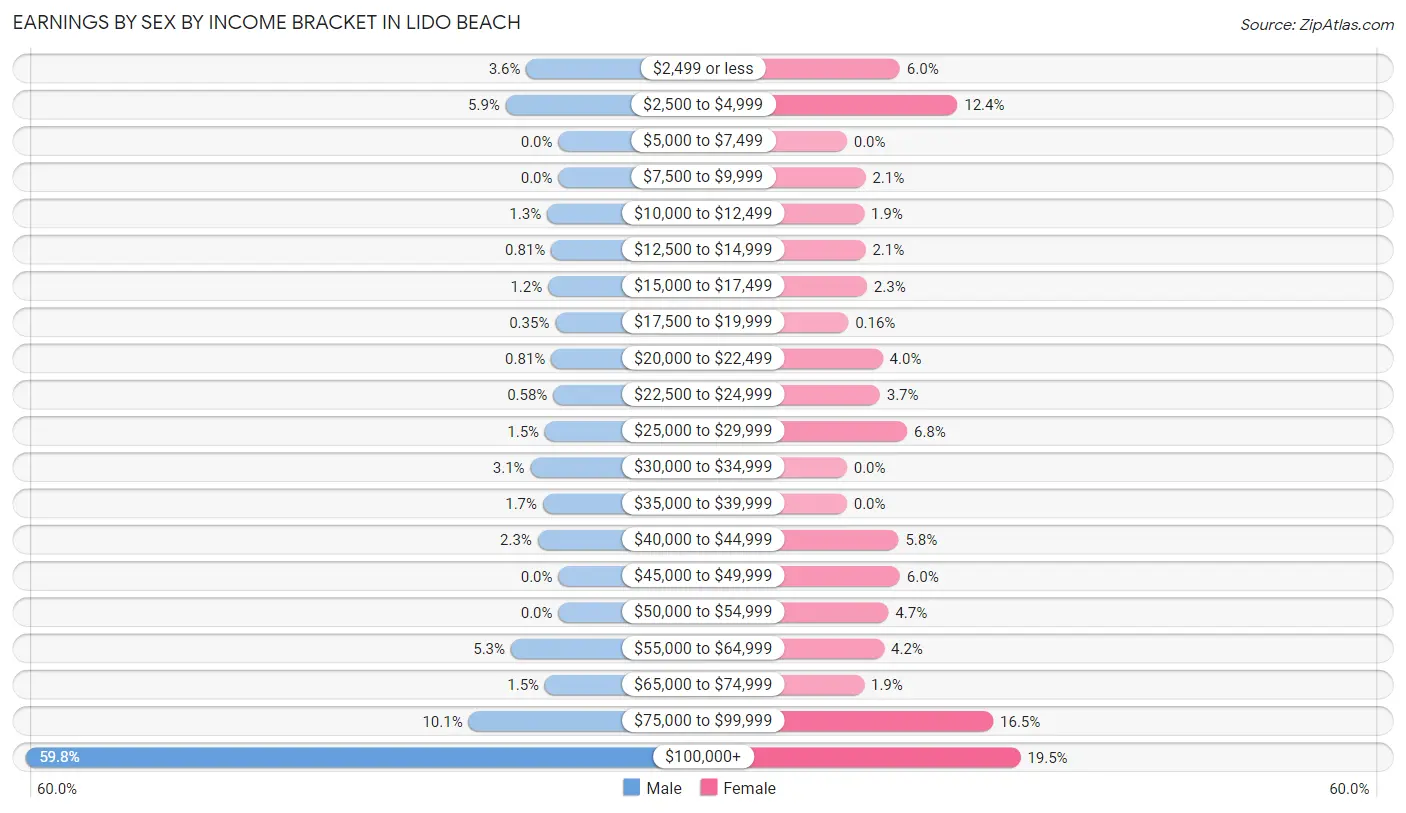
Earnings by Sex by Income Bracket in Lido Beach
The most common earnings brackets in Lido Beach are $100,000+ for men (515 | 59.8%) and $100,000+ for women (121 | 19.5%).
| Income | Male | Female |
| $2,499 or less | 31 (3.6%) | 37 (6.0%) |
| $2,500 to $4,999 | 51 (5.9%) | 77 (12.4%) |
| $5,000 to $7,499 | 0 (0.0%) | 0 (0.0%) |
| $7,500 to $9,999 | 0 (0.0%) | 13 (2.1%) |
| $10,000 to $12,499 | 11 (1.3%) | 12 (1.9%) |
| $12,500 to $14,999 | 7 (0.8%) | 13 (2.1%) |
| $15,000 to $17,499 | 10 (1.2%) | 14 (2.3%) |
| $17,500 to $19,999 | 3 (0.4%) | 1 (0.2%) |
| $20,000 to $22,499 | 7 (0.8%) | 25 (4.0%) |
| $22,500 to $24,999 | 5 (0.6%) | 23 (3.7%) |
| $25,000 to $29,999 | 13 (1.5%) | 42 (6.8%) |
| $30,000 to $34,999 | 27 (3.1%) | 0 (0.0%) |
| $35,000 to $39,999 | 15 (1.7%) | 0 (0.0%) |
| $40,000 to $44,999 | 20 (2.3%) | 36 (5.8%) |
| $45,000 to $49,999 | 0 (0.0%) | 37 (6.0%) |
| $50,000 to $54,999 | 0 (0.0%) | 29 (4.7%) |
| $55,000 to $64,999 | 46 (5.3%) | 26 (4.2%) |
| $65,000 to $74,999 | 13 (1.5%) | 12 (1.9%) |
| $75,000 to $99,999 | 87 (10.1%) | 102 (16.5%) |
| $100,000+ | 515 (59.8%) | 121 (19.5%) |
| Total | 861 (100.0%) | 620 (100.0%) |
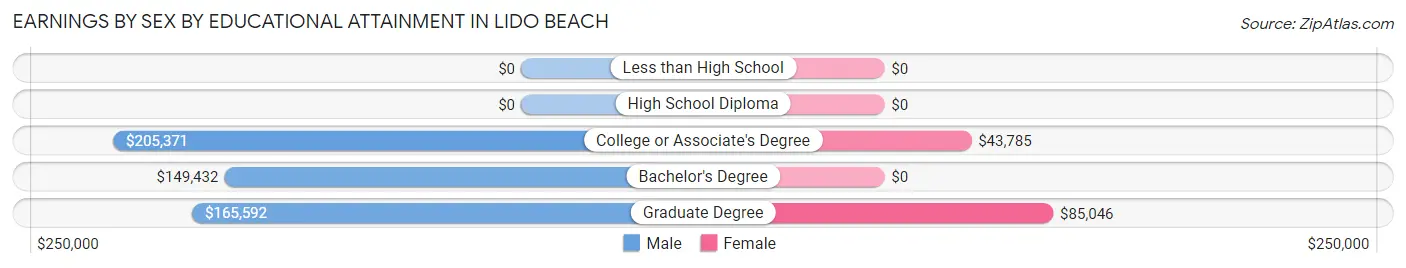
Earnings by Sex by Educational Attainment in Lido Beach
Average earnings in Lido Beach are $159,375 for men and $58,500 for women, a difference of 63.3%. Men with an educational attainment of college or associate's degree enjoy the highest average annual earnings of $205,371, while those with bachelor's degree education earn the least with $149,432. Women with an educational attainment of graduate degree earn the most with the average annual earnings of $85,046, while those with college or associate's degree education have the smallest earnings of $43,785.
| Educational Attainment | Male Income | Female Income |
| Less than High School | - | - |
| High School Diploma | - | - |
| College or Associate's Degree | $205,371 | $43,785 |
| Bachelor's Degree | $149,432 | $0 |
| Graduate Degree | $165,592 | $85,046 |
| Total | $159,375 | $58,500 |
Family Income in Lido Beach
Family Income Brackets in Lido Beach
According to the Lido Beach family income data, there are 345 families falling into the $200,000+ income range, which is the most common income bracket and makes up 49.9% of all families.
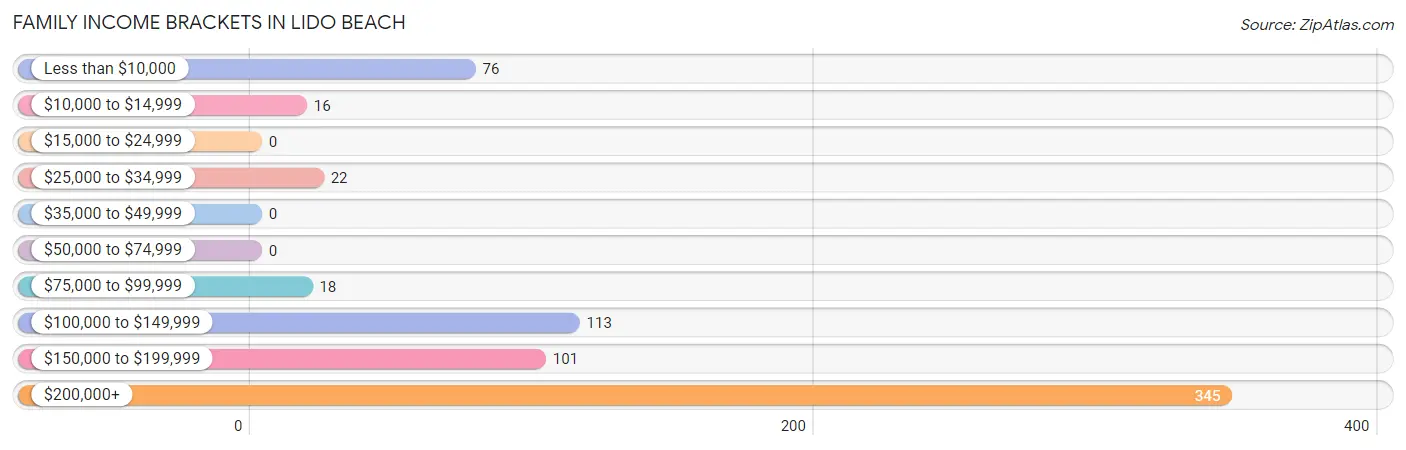
| Income Bracket | # Families | % Families |
| Less than $10,000 | 76 | 11.0% |
| $10,000 to $14,999 | 16 | 2.3% |
| $15,000 to $24,999 | 0 | 0.0% |
| $25,000 to $34,999 | 22 | 3.2% |
| $35,000 to $49,999 | 0 | 0.0% |
| $50,000 to $74,999 | 0 | 0.0% |
| $75,000 to $99,999 | 18 | 2.6% |
| $100,000 to $149,999 | 113 | 16.4% |
| $150,000 to $199,999 | 101 | 14.6% |
| $200,000+ | 345 | 49.9% |
Family Income by Famaliy Size in Lido Beach
4-person families (77 | 11.1%) account for the highest median family income in Lido Beach with $250,001 per family, while 2-person families (410 | 59.3%) have the highest median income of $94,412 per family member.
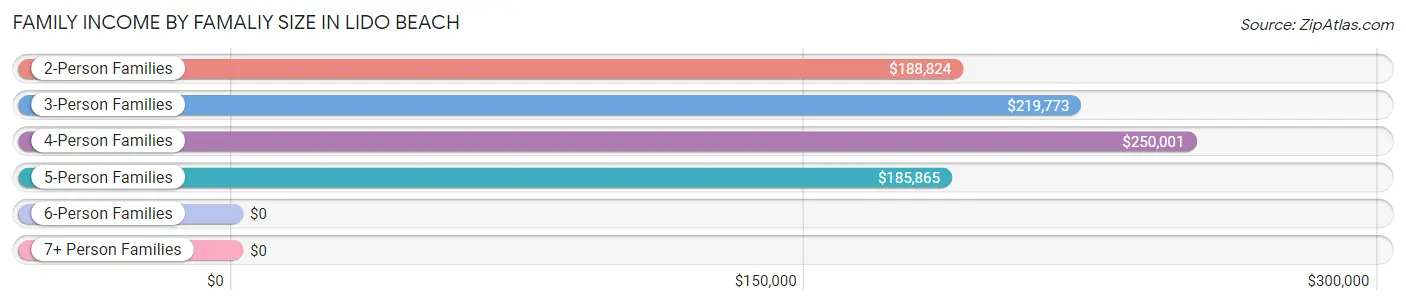
| Income Bracket | # Families | Median Income |
| 2-Person Families | 410 (59.3%) | $188,824 |
| 3-Person Families | 140 (20.3%) | $219,773 |
| 4-Person Families | 77 (11.1%) | $250,001 |
| 5-Person Families | 37 (5.3%) | $185,865 |
| 6-Person Families | 27 (3.9%) | $0 |
| 7+ Person Families | 0 (0.0%) | $0 |
| Total | 691 (100.0%) | $197,321 |
Family Income by Number of Earners in Lido Beach
The median family income in Lido Beach is $197,321, with families comprising 2 earners (247) having the highest median family income of $250,001, while families with no earners (99) have the lowest median family income of $2,499, accounting for 35.7% and 14.3% of families, respectively.
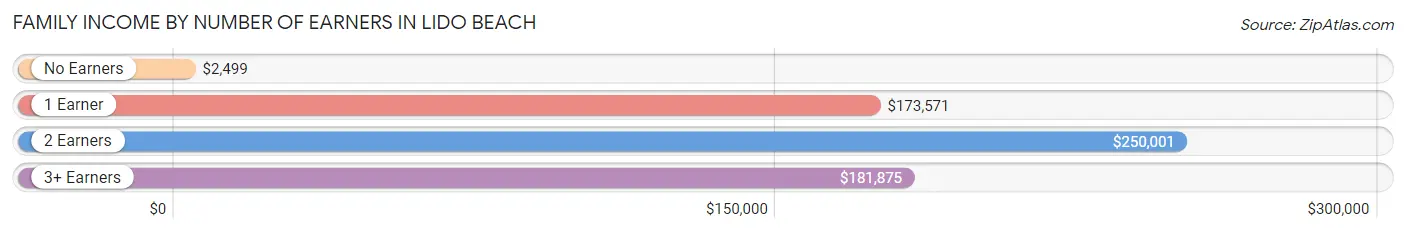
| Number of Earners | # Families | Median Income |
| No Earners | 99 (14.3%) | $2,499 |
| 1 Earner | 272 (39.4%) | $173,571 |
| 2 Earners | 247 (35.7%) | $250,001 |
| 3+ Earners | 73 (10.6%) | $181,875 |
| Total | 691 (100.0%) | $197,321 |
Household Income in Lido Beach
Household Income Brackets in Lido Beach
With 506 households falling in the category, the $200,000+ income range is the most frequent in Lido Beach, accounting for 42.8% of all households. In contrast, only 7 households (0.6%) fall into the $15,000 to $24,999 income bracket, making it the least populous group.
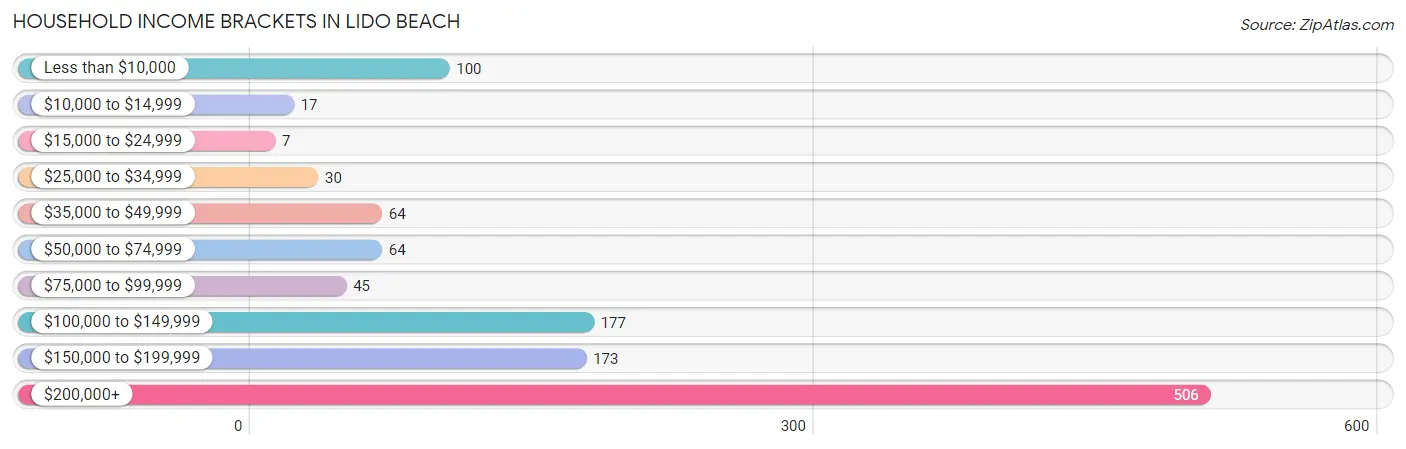
| Income Bracket | # Households | % Households |
| Less than $10,000 | 100 | 8.5% |
| $10,000 to $14,999 | 17 | 1.4% |
| $15,000 to $24,999 | 7 | 0.6% |
| $25,000 to $34,999 | 30 | 2.5% |
| $35,000 to $49,999 | 64 | 5.4% |
| $50,000 to $74,999 | 64 | 5.4% |
| $75,000 to $99,999 | 45 | 3.8% |
| $100,000 to $149,999 | 177 | 15.0% |
| $150,000 to $199,999 | 173 | 14.6% |
| $200,000+ | 506 | 42.8% |
Household Income by Householder Age in Lido Beach
The median household income in Lido Beach is $172,857, with the highest median household income of $191,458 found in the 65+ years age bracket for the primary householder. A total of 523 households (44.3%) fall into this category.
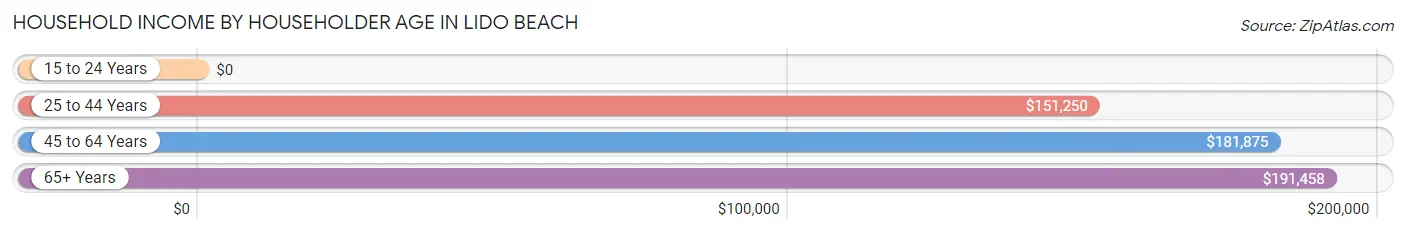
| Income Bracket | # Households | Median Income |
| 15 to 24 Years | 0 (0.0%) | $0 |
| 25 to 44 Years | 188 (15.9%) | $151,250 |
| 45 to 64 Years | 471 (39.9%) | $181,875 |
| 65+ Years | 523 (44.3%) | $191,458 |
| Total | 1,182 (100.0%) | $172,857 |
Poverty in Lido Beach
Income Below Poverty by Sex and Age in Lido Beach
With 7.0% poverty level for males and 16.3% for females among the residents of Lido Beach, 55 to 64 year old males and 16 and 17 year old females are the most vulnerable to poverty, with 64 males (25.6%) and 12 females (100.0%) in their respective age groups living below the poverty level.
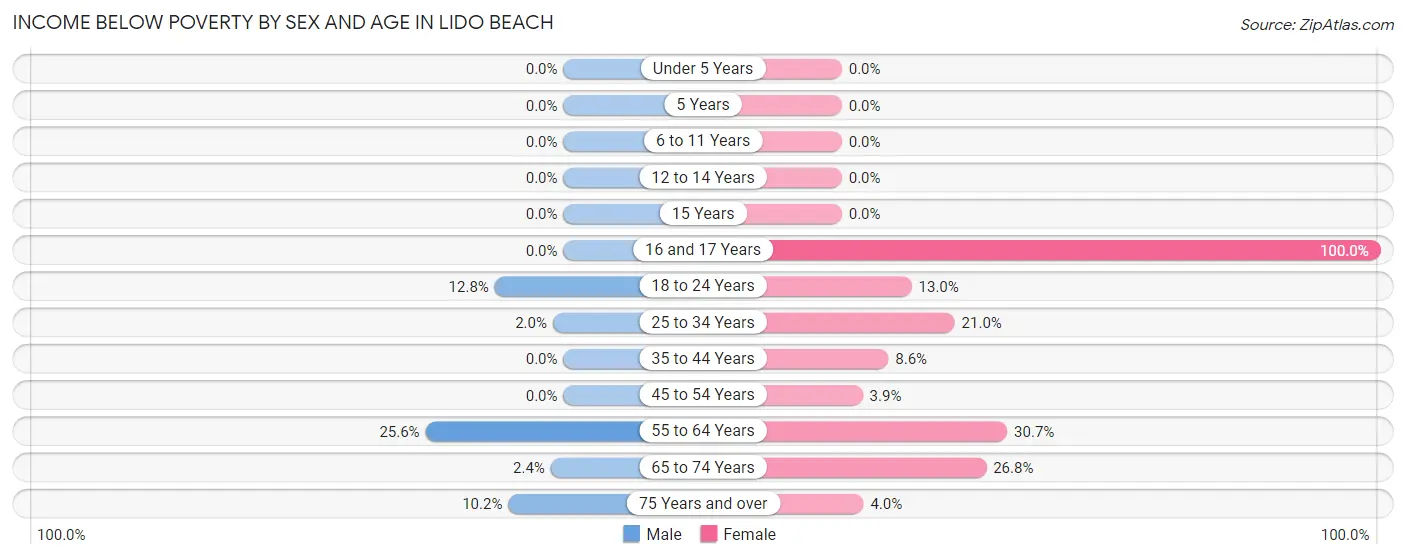
| Age Bracket | Male | Female |
| Under 5 Years | 0 (0.0%) | 0 (0.0%) |
| 5 Years | 0 (0.0%) | 0 (0.0%) |
| 6 to 11 Years | 0 (0.0%) | 0 (0.0%) |
| 12 to 14 Years | 0 (0.0%) | 0 (0.0%) |
| 15 Years | 0 (0.0%) | 0 (0.0%) |
| 16 and 17 Years | 0 (0.0%) | 12 (100.0%) |
| 18 to 24 Years | 13 (12.8%) | 14 (13.0%) |
| 25 to 34 Years | 2 (2.0%) | 31 (20.9%) |
| 35 to 44 Years | 0 (0.0%) | 7 (8.6%) |
| 45 to 54 Years | 0 (0.0%) | 6 (3.9%) |
| 55 to 64 Years | 64 (25.6%) | 89 (30.7%) |
| 65 to 74 Years | 7 (2.4%) | 37 (26.8%) |
| 75 Years and over | 9 (10.2%) | 8 (4.0%) |
| Total | 95 (7.0%) | 204 (16.3%) |
Income Above Poverty by Sex and Age in Lido Beach
According to the poverty statistics in Lido Beach, males aged under 5 years and females aged 5 years are the age groups that are most secure financially, with 100.0% of males and 100.0% of females in these age groups living above the poverty line.
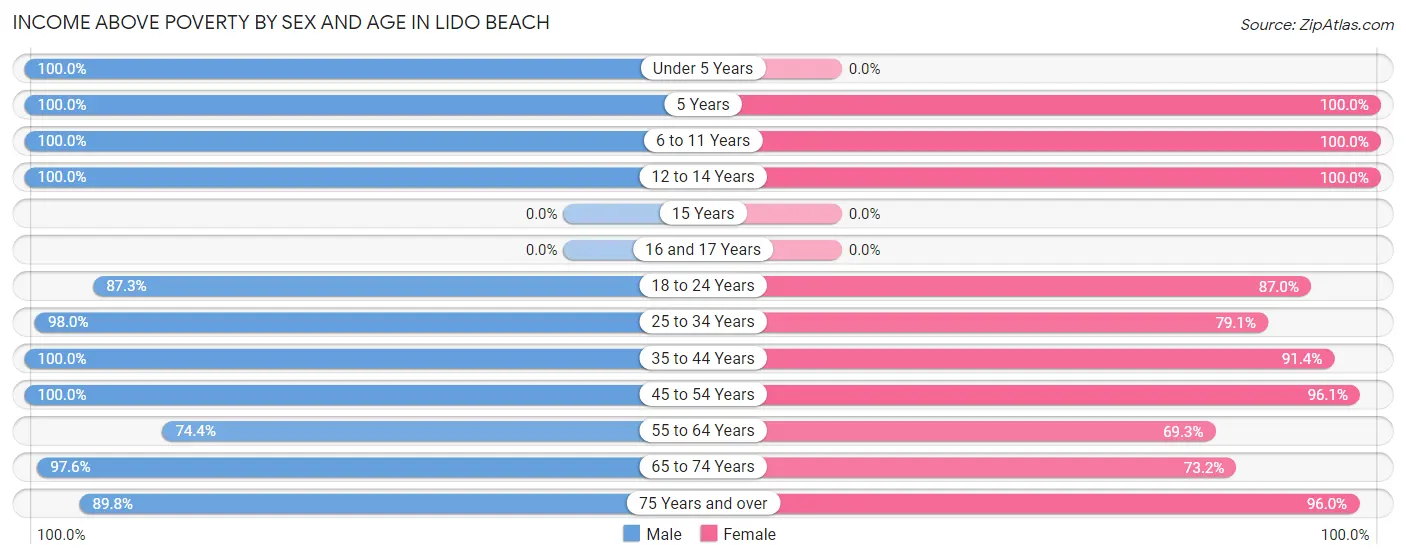
| Age Bracket | Male | Female |
| Under 5 Years | 86 (100.0%) | 0 (0.0%) |
| 5 Years | 12 (100.0%) | 20 (100.0%) |
| 6 to 11 Years | 88 (100.0%) | 83 (100.0%) |
| 12 to 14 Years | 66 (100.0%) | 19 (100.0%) |
| 15 Years | 0 (0.0%) | 0 (0.0%) |
| 16 and 17 Years | 0 (0.0%) | 0 (0.0%) |
| 18 to 24 Years | 89 (87.3%) | 94 (87.0%) |
| 25 to 34 Years | 100 (98.0%) | 117 (79.0%) |
| 35 to 44 Years | 129 (100.0%) | 74 (91.4%) |
| 45 to 54 Years | 128 (100.0%) | 149 (96.1%) |
| 55 to 64 Years | 186 (74.4%) | 201 (69.3%) |
| 65 to 74 Years | 290 (97.6%) | 101 (73.2%) |
| 75 Years and over | 79 (89.8%) | 191 (96.0%) |
| Total | 1,253 (92.9%) | 1,049 (83.7%) |
Income Below Poverty Among Married-Couple Families in Lido Beach
The poverty statistics for married-couple families in Lido Beach show that 15.8% or 92 of the total 582 families live below the poverty line. Families with no children have the highest poverty rate of 19.6%, comprising of 83 families. On the other hand, families with 3 or 4 children have the lowest poverty rate of 0.0%, which includes 0 families.
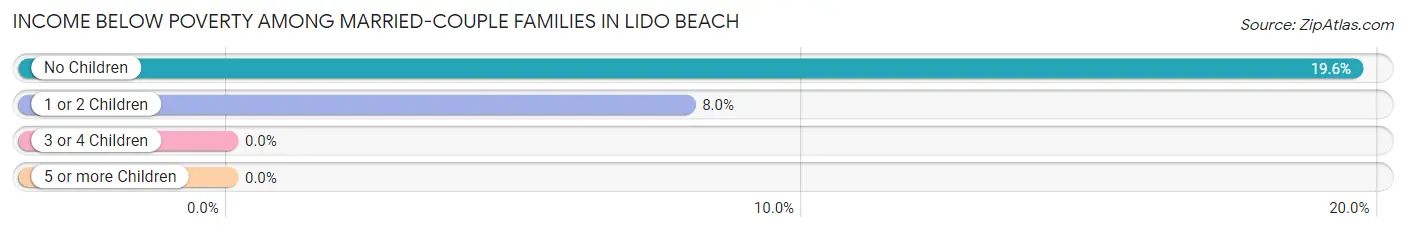
| Children | Above Poverty | Below Poverty |
| No Children | 341 (80.4%) | 83 (19.6%) |
| 1 or 2 Children | 104 (92.0%) | 9 (8.0%) |
| 3 or 4 Children | 45 (100.0%) | 0 (0.0%) |
| 5 or more Children | 0 (0.0%) | 0 (0.0%) |
| Total | 490 (84.2%) | 92 (15.8%) |
Income Below Poverty Among Single-Parent Households in Lido Beach
| Children | Single Father | Single Mother |
| No Children | 0 (0.0%) | 0 (0.0%) |
| 1 or 2 Children | 0 (0.0%) | 0 (0.0%) |
| 3 or 4 Children | 0 (0.0%) | 0 (0.0%) |
| 5 or more Children | 0 (0.0%) | 0 (0.0%) |
| Total | 0 (0.0%) | 0 (0.0%) |
Income Below Poverty Among Married-Couple vs Single-Parent Households in Lido Beach
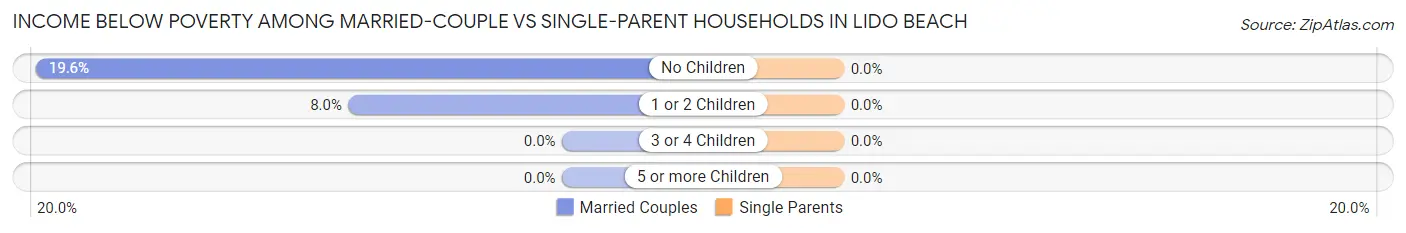
| Children | Married-Couple Families | Single-Parent Households |
| No Children | 83 (19.6%) | 0 (0.0%) |
| 1 or 2 Children | 9 (8.0%) | 0 (0.0%) |
| 3 or 4 Children | 0 (0.0%) | 0 (0.0%) |
| 5 or more Children | 0 (0.0%) | 0 (0.0%) |
| Total | 92 (15.8%) | 0 (0.0%) |
Race in Lido Beach
The most populous races in Lido Beach are White / Caucasian (2,391 | 91.4%), Hispanic or Latino (348 | 13.3%), and Two or more Races (143 | 5.5%).
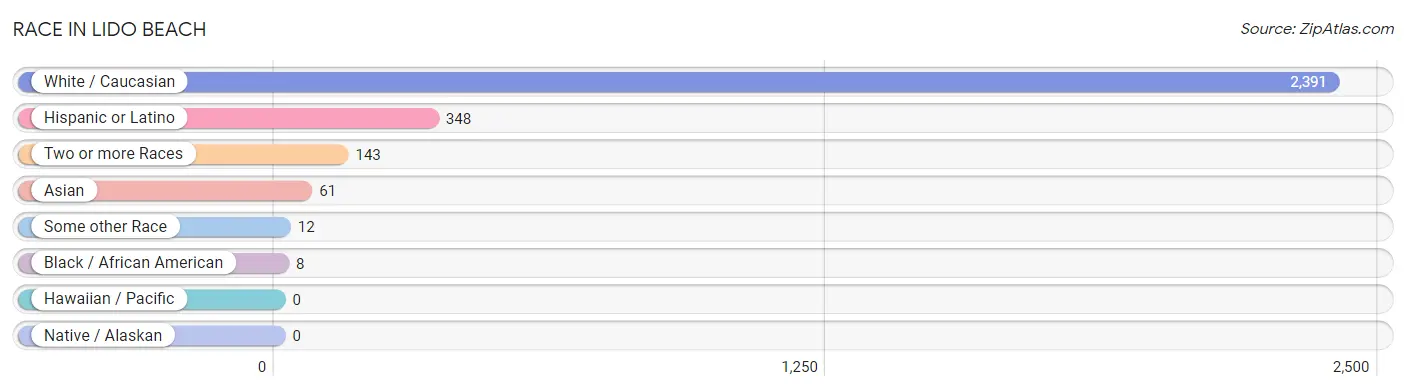
| Race | # Population | % Population |
| Asian | 61 | 2.3% |
| Black / African American | 8 | 0.3% |
| Hawaiian / Pacific | 0 | 0.0% |
| Hispanic or Latino | 348 | 13.3% |
| Native / Alaskan | 0 | 0.0% |
| White / Caucasian | 2,391 | 91.4% |
| Two or more Races | 143 | 5.5% |
| Some other Race | 12 | 0.5% |
| Total | 2,615 | 100.0% |
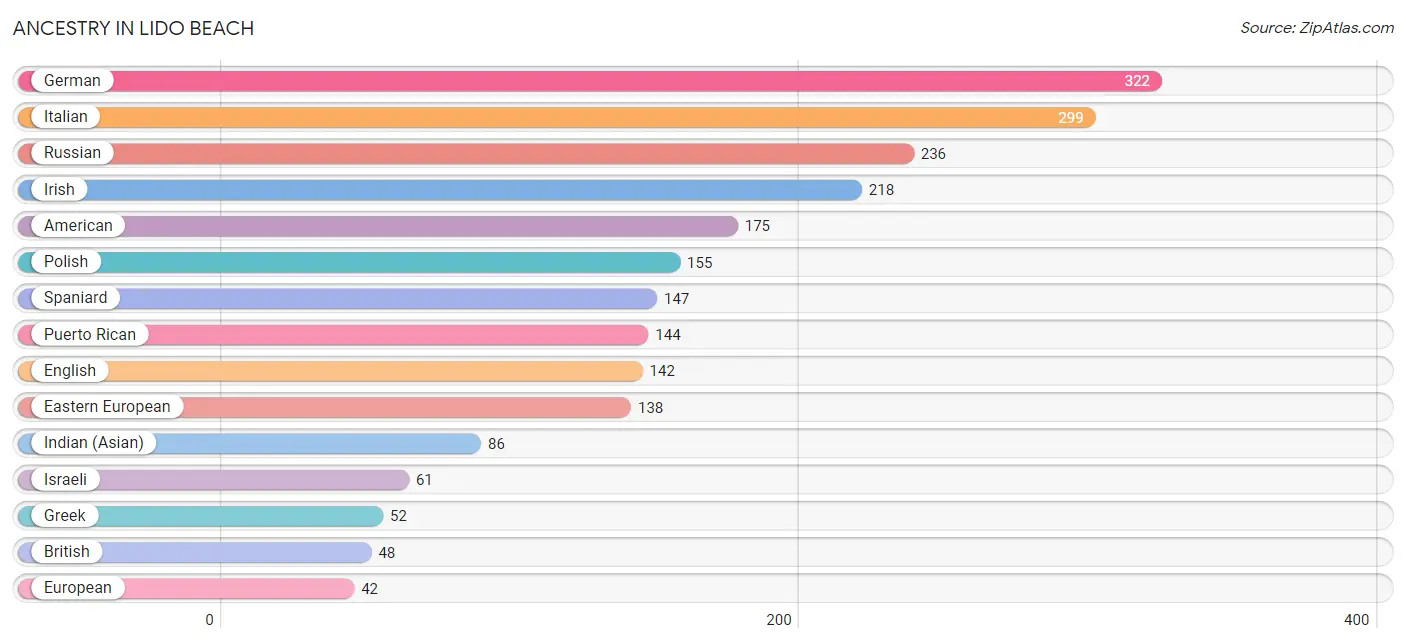
Ancestry in Lido Beach
The most populous ancestries reported in Lido Beach are German (322 | 12.3%), Italian (299 | 11.4%), Russian (236 | 9.0%), Irish (218 | 8.3%), and American (175 | 6.7%), together accounting for 47.8% of all Lido Beach residents.
| Ancestry | # Population | % Population |
| American | 175 | 6.7% |
| Arab | 7 | 0.3% |
| Armenian | 6 | 0.2% |
| Austrian | 22 | 0.8% |
| British | 48 | 1.8% |
| Central American | 24 | 0.9% |
| Czech | 9 | 0.3% |
| Danish | 15 | 0.6% |
| Dominican | 3 | 0.1% |
| Eastern European | 138 | 5.3% |
| Ecuadorian | 11 | 0.4% |
| English | 142 | 5.4% |
| European | 42 | 1.6% |
| French Canadian | 9 | 0.3% |
| German | 322 | 12.3% |
| Greek | 52 | 2.0% |
| Hungarian | 16 | 0.6% |
| Indian (Asian) | 86 | 3.3% |
| Iranian | 19 | 0.7% |
| Irish | 218 | 8.3% |
| Israeli | 61 | 2.3% |
| Italian | 299 | 11.4% |
| Korean | 25 | 1.0% |
| Lithuanian | 23 | 0.9% |
| Mexican | 12 | 0.5% |
| Norwegian | 7 | 0.3% |
| Polish | 155 | 5.9% |
| Puerto Rican | 144 | 5.5% |
| Romanian | 9 | 0.3% |
| Russian | 236 | 9.0% |
| Salvadoran | 24 | 0.9% |
| Slovak | 10 | 0.4% |
| South American | 11 | 0.4% |
| Spaniard | 147 | 5.6% |
| Spanish | 7 | 0.3% |
| Swedish | 42 | 1.6% |
| Swiss | 7 | 0.3% |
| Thai | 40 | 1.5% |
| Turkish | 8 | 0.3% |
| Welsh | 10 | 0.4% | View All 40 Rows |
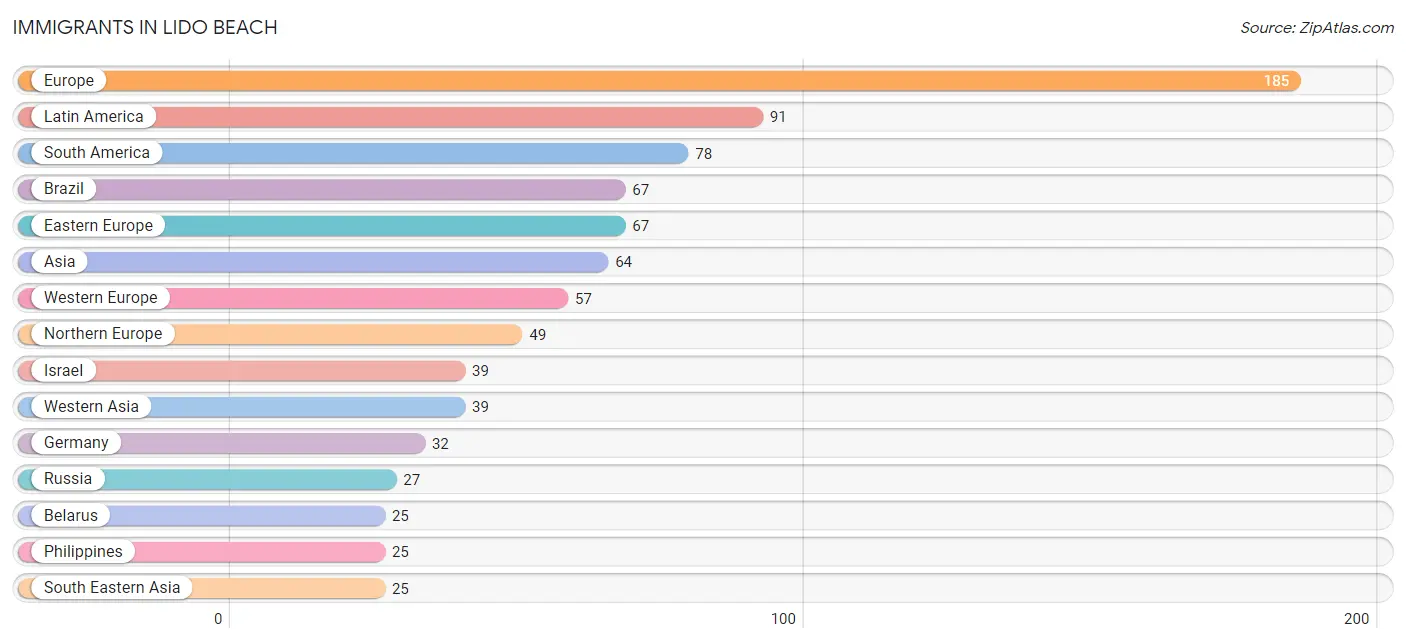
Immigrants in Lido Beach
The most numerous immigrant groups reported in Lido Beach came from Europe (185 | 7.1%), Latin America (91 | 3.5%), South America (78 | 3.0%), Brazil (67 | 2.6%), and Eastern Europe (67 | 2.6%), together accounting for 18.7% of all Lido Beach residents.
| Immigration Origin | # Population | % Population |
| Asia | 64 | 2.5% |
| Belarus | 25 | 1.0% |
| Belgium | 9 | 0.3% |
| Brazil | 67 | 2.6% |
| Caribbean | 1 | 0.0% |
| Central America | 12 | 0.5% |
| Denmark | 15 | 0.6% |
| Eastern Europe | 67 | 2.6% |
| Ecuador | 11 | 0.4% |
| England | 14 | 0.5% |
| Europe | 185 | 7.1% |
| Germany | 32 | 1.2% |
| Greece | 12 | 0.5% |
| Hungary | 1 | 0.0% |
| Ireland | 12 | 0.5% |
| Israel | 39 | 1.5% |
| Latin America | 91 | 3.5% |
| Lithuania | 14 | 0.5% |
| Mexico | 12 | 0.5% |
| Netherlands | 9 | 0.3% |
| Northern Europe | 49 | 1.9% |
| Philippines | 25 | 1.0% |
| Russia | 27 | 1.0% |
| South America | 78 | 3.0% |
| South Eastern Asia | 25 | 1.0% |
| Southern Europe | 12 | 0.5% |
| St. Vincent and the Grenadines | 1 | 0.0% |
| Switzerland | 7 | 0.3% |
| Western Asia | 39 | 1.5% |
| Western Europe | 57 | 2.2% | View All 30 Rows |
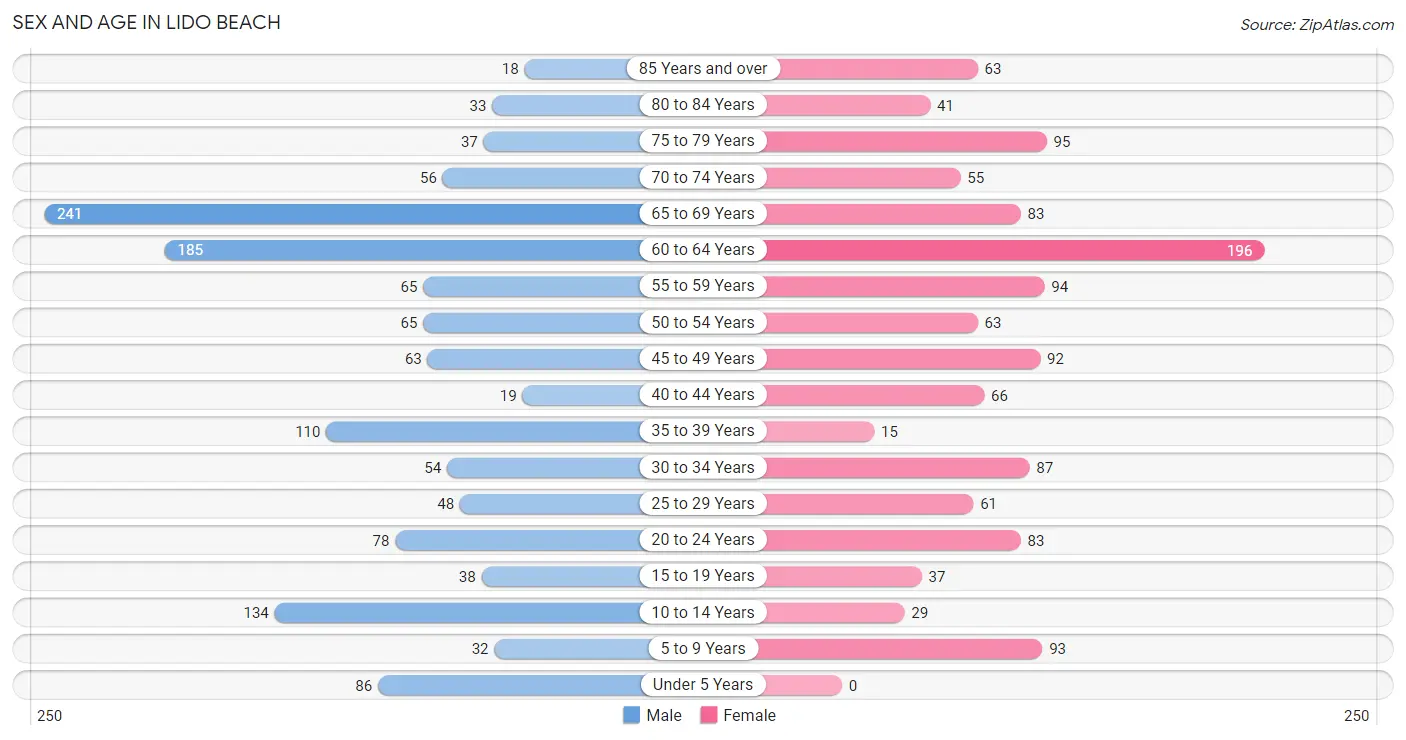
Sex and Age in Lido Beach
Sex and Age in Lido Beach
The most populous age groups in Lido Beach are 65 to 69 Years (241 | 17.7%) for men and 60 to 64 Years (196 | 15.6%) for women.
| Age Bracket | Male | Female |
| Under 5 Years | 86 (6.3%) | 0 (0.0%) |
| 5 to 9 Years | 32 (2.4%) | 93 (7.4%) |
| 10 to 14 Years | 134 (9.8%) | 29 (2.3%) |
| 15 to 19 Years | 38 (2.8%) | 37 (2.9%) |
| 20 to 24 Years | 78 (5.7%) | 83 (6.6%) |
| 25 to 29 Years | 48 (3.5%) | 61 (4.9%) |
| 30 to 34 Years | 54 (4.0%) | 87 (6.9%) |
| 35 to 39 Years | 110 (8.1%) | 15 (1.2%) |
| 40 to 44 Years | 19 (1.4%) | 66 (5.3%) |
| 45 to 49 Years | 63 (4.6%) | 92 (7.3%) |
| 50 to 54 Years | 65 (4.8%) | 63 (5.0%) |
| 55 to 59 Years | 65 (4.8%) | 94 (7.5%) |
| 60 to 64 Years | 185 (13.6%) | 196 (15.6%) |
| 65 to 69 Years | 241 (17.7%) | 83 (6.6%) |
| 70 to 74 Years | 56 (4.1%) | 55 (4.4%) |
| 75 to 79 Years | 37 (2.7%) | 95 (7.6%) |
| 80 to 84 Years | 33 (2.4%) | 41 (3.3%) |
| 85 Years and over | 18 (1.3%) | 63 (5.0%) |
| Total | 1,362 (100.0%) | 1,253 (100.0%) |
Families and Households in Lido Beach
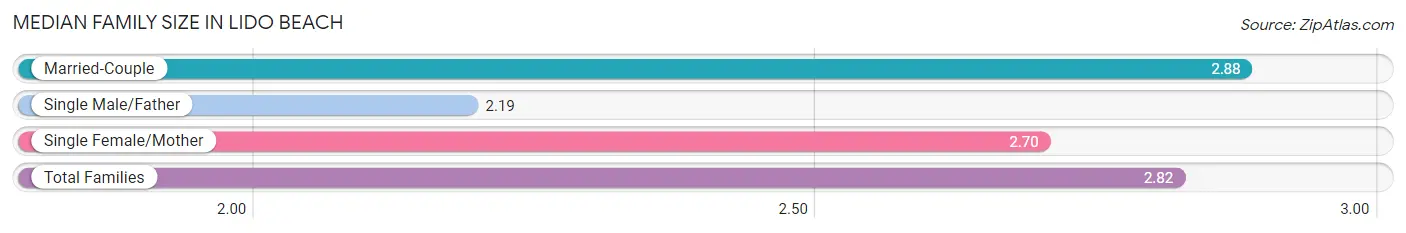
Median Family Size in Lido Beach
The median family size in Lido Beach is 2.82 persons per family, with married-couple families (582 | 84.2%) accounting for the largest median family size of 2.88 persons per family. On the other hand, single male/father families (36 | 5.2%) represent the smallest median family size with 2.19 persons per family.
| Family Type | # Families | Family Size |
| Married-Couple | 582 (84.2%) | 2.88 |
| Single Male/Father | 36 (5.2%) | 2.19 |
| Single Female/Mother | 73 (10.6%) | 2.70 |
| Total Families | 691 (100.0%) | 2.82 |
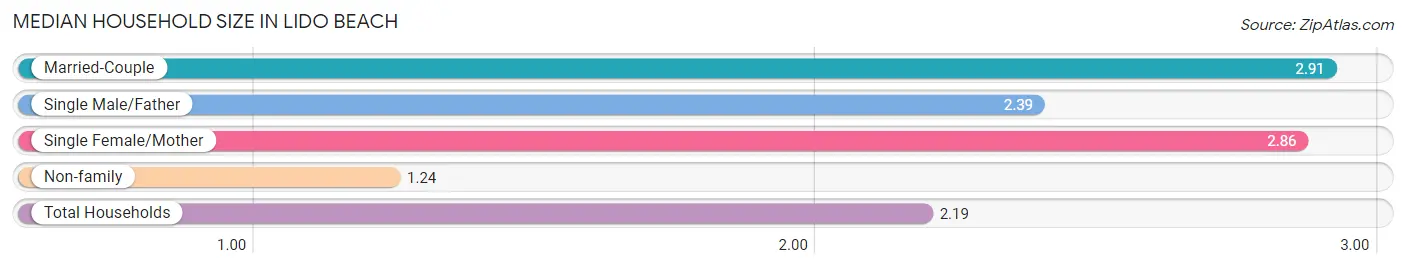
Median Household Size in Lido Beach
The median household size in Lido Beach is 2.19 persons per household, with married-couple households (582 | 49.2%) accounting for the largest median household size of 2.91 persons per household. non-family households (491 | 41.5%) represent the smallest median household size with 1.24 persons per household.
| Household Type | # Households | Household Size |
| Married-Couple | 582 (49.2%) | 2.91 |
| Single Male/Father | 36 (3.0%) | 2.39 |
| Single Female/Mother | 73 (6.2%) | 2.86 |
| Non-family | 491 (41.5%) | 1.24 |
| Total Households | 1,182 (100.0%) | 2.19 |
Household Size by Marriage Status in Lido Beach
Out of a total of 1,182 households in Lido Beach, 691 (58.5%) are family households, while 491 (41.5%) are nonfamily households. The most numerous type of family households are 2-person households, comprising 389, and the most common type of nonfamily households are 1-person households, comprising 373.
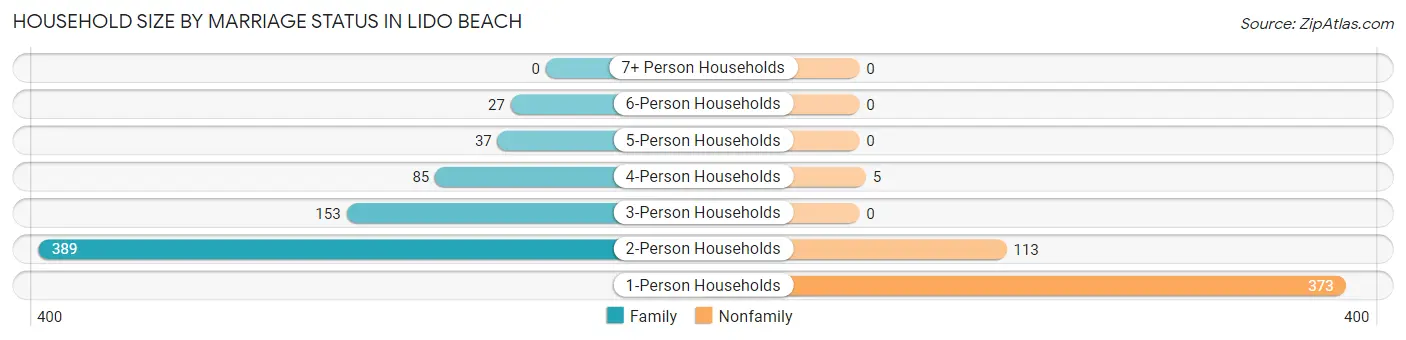
| Household Size | Family Households | Nonfamily Households |
| 1-Person Households | - | 373 (31.6%) |
| 2-Person Households | 389 (32.9%) | 113 (9.6%) |
| 3-Person Households | 153 (12.9%) | 0 (0.0%) |
| 4-Person Households | 85 (7.2%) | 5 (0.4%) |
| 5-Person Households | 37 (3.1%) | 0 (0.0%) |
| 6-Person Households | 27 (2.3%) | 0 (0.0%) |
| 7+ Person Households | 0 (0.0%) | 0 (0.0%) |
| Total | 691 (58.5%) | 491 (41.5%) |
Female Fertility in Lido Beach
Fertility by Age in Lido Beach
| Age Bracket | Women with Births | Births / 1,000 Women |
| 15 to 19 years | 0 (0.0%) | 0.0 |
| 20 to 34 years | 0 (0.0%) | 0.0 |
| 35 to 50 years | 0 (0.0%) | 0.0 |
| Total | 0 (0.0%) | 0.0 |
Fertility by Age by Marriage Status in Lido Beach
| Age Bracket | Married | Unmarried |
| 15 to 19 years | 0 (0.0%) | 0 (0.0%) |
| 20 to 34 years | 0 (0.0%) | 0 (0.0%) |
| 35 to 50 years | 0 (0.0%) | 0 (0.0%) |
| Total | 0 (0.0%) | 0 (0.0%) |
Fertility by Education in Lido Beach
| Educational Attainment | Women with Births | Births / 1,000 Women |
| Less than High School | 0 (0.0%) | 0.0 |
| High School Diploma | 0 (0.0%) | 0.0 |
| College or Associate's Degree | 0 (0.0%) | 0.0 |
| Bachelor's Degree | 0 (0.0%) | 0.0 |
| Graduate Degree | 0 (0.0%) | 0.0 |
| Total | 0 (0.0%) | 0.0 |
Fertility by Education by Marriage Status in Lido Beach
| Educational Attainment | Married | Unmarried |
| Less than High School | 0 (0.0%) | 0 (0.0%) |
| High School Diploma | 0 (0.0%) | 0 (0.0%) |
| College or Associate's Degree | 0 (0.0%) | 0 (0.0%) |
| Bachelor's Degree | 0 (0.0%) | 0 (0.0%) |
| Graduate Degree | 0 (0.0%) | 0 (0.0%) |
| Total | 0 (0.0%) | 0 (0.0%) |
Employment Characteristics in Lido Beach
Employment by Class of Employer in Lido Beach
Among the 1,295 employed individuals in Lido Beach, private company employees (690 | 53.3%), local government employees (183 | 14.1%), and self-employed (incorporated) (181 | 14.0%) make up the most common classes of employment.
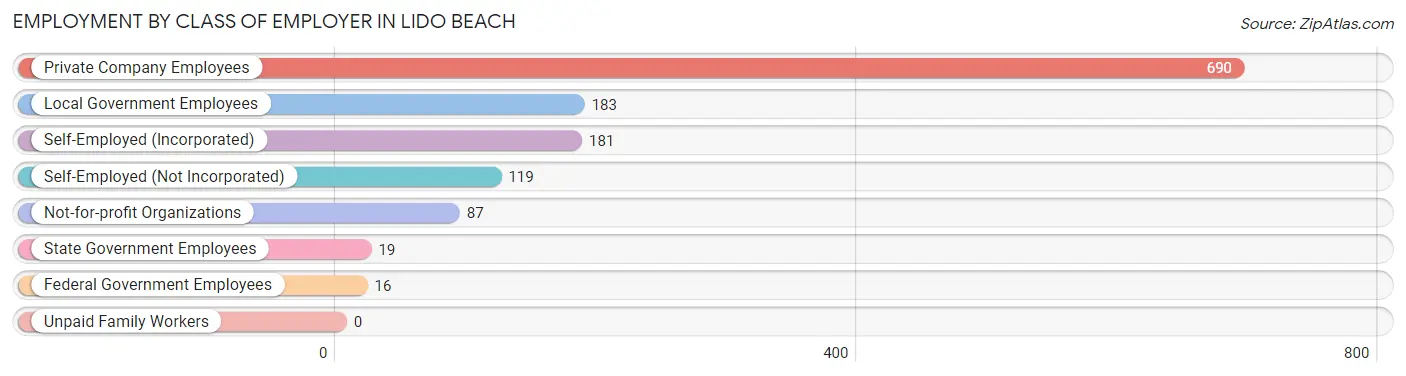
| Employer Class | # Employees | % Employees |
| Private Company Employees | 690 | 53.3% |
| Self-Employed (Incorporated) | 181 | 14.0% |
| Self-Employed (Not Incorporated) | 119 | 9.2% |
| Not-for-profit Organizations | 87 | 6.7% |
| Local Government Employees | 183 | 14.1% |
| State Government Employees | 19 | 1.5% |
| Federal Government Employees | 16 | 1.2% |
| Unpaid Family Workers | 0 | 0.0% |
| Total | 1,295 | 100.0% |
Employment Status by Age in Lido Beach
According to the labor force statistics for Lido Beach, out of the total population over 16 years of age (2,237), 61.9% or 1,385 individuals are in the labor force, with 5.3% or 73 of them unemployed. The age group with the highest labor force participation rate is 20 to 24 years, with 94.4% or 152 individuals in the labor force. Within the labor force, the 75 years and over age range has the highest percentage of unemployed individuals, with 36.0% or 9 of them being unemployed.
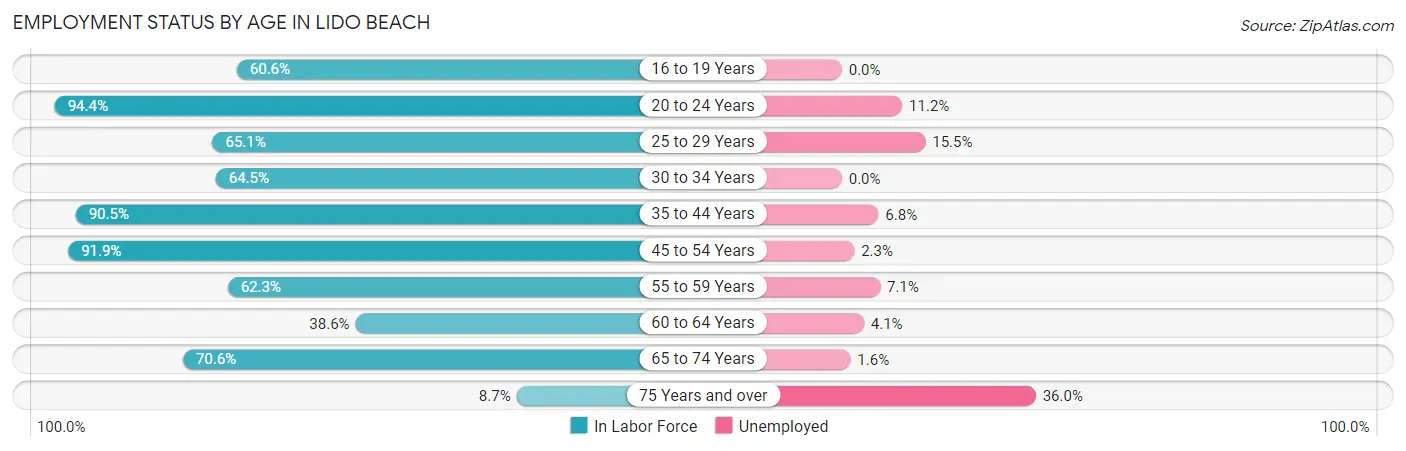
| Age Bracket | In Labor Force | Unemployed |
| 16 to 19 Years | 43 (60.6%) | 0 (0.0%) |
| 20 to 24 Years | 152 (94.4%) | 17 (11.2%) |
| 25 to 29 Years | 71 (65.1%) | 11 (15.5%) |
| 30 to 34 Years | 91 (64.5%) | 0 (0.0%) |
| 35 to 44 Years | 190 (90.5%) | 13 (6.8%) |
| 45 to 54 Years | 260 (91.9%) | 6 (2.3%) |
| 55 to 59 Years | 99 (62.3%) | 7 (7.1%) |
| 60 to 64 Years | 147 (38.6%) | 6 (4.1%) |
| 65 to 74 Years | 307 (70.6%) | 5 (1.6%) |
| 75 Years and over | 25 (8.7%) | 9 (36.0%) |
| Total | 1,385 (61.9%) | 73 (5.3%) |
Employment Status by Educational Attainment in Lido Beach
According to labor force statistics for Lido Beach, 66.9% of individuals (858) out of the total population between 25 and 64 years of age (1,283) are in the labor force, with 5.0% or 43 of them being unemployed. The group with the highest labor force participation rate are those with the educational attainment of college / associate degree, with 72.3% or 191 individuals in the labor force. Within the labor force, individuals with college / associate degree education have the highest percentage of unemployment, with 5.8% or 11 of them being unemployed.
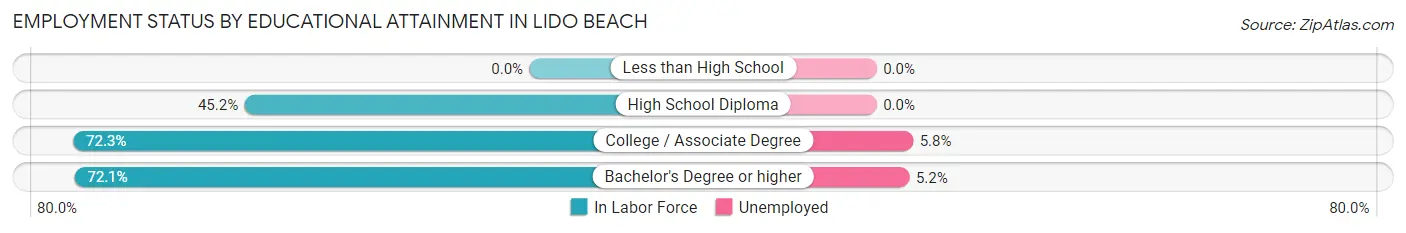
| Educational Attainment | In Labor Force | Unemployed |
| Less than High School | 0 (0.0%) | 0 (0.0%) |
| High School Diploma | 47 (45.2%) | 0 (0.0%) |
| College / Associate Degree | 191 (72.3%) | 15 (5.8%) |
| Bachelor's Degree or higher | 620 (72.1%) | 45 (5.2%) |
| Total | 858 (66.9%) | 64 (5.0%) |
Employment Occupations by Sex in Lido Beach
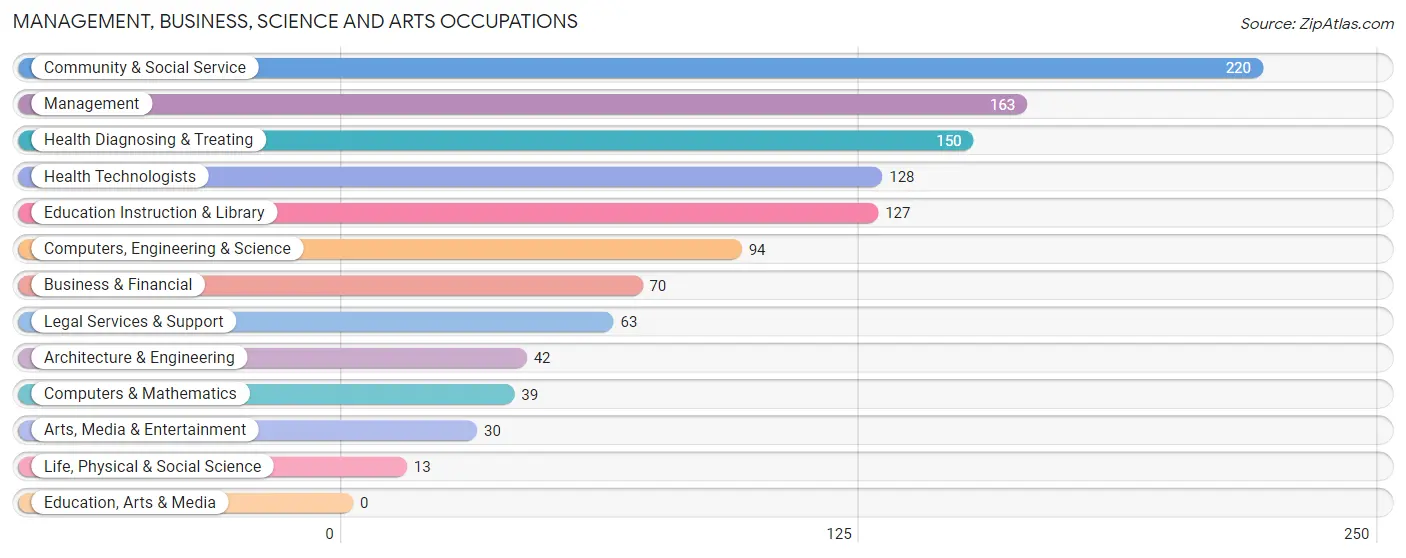
Management, Business, Science and Arts Occupations
The most common Management, Business, Science and Arts occupations in Lido Beach are Community & Social Service (220 | 16.8%), Management (163 | 12.4%), Health Diagnosing & Treating (150 | 11.4%), Health Technologists (128 | 9.8%), and Education Instruction & Library (127 | 9.7%).
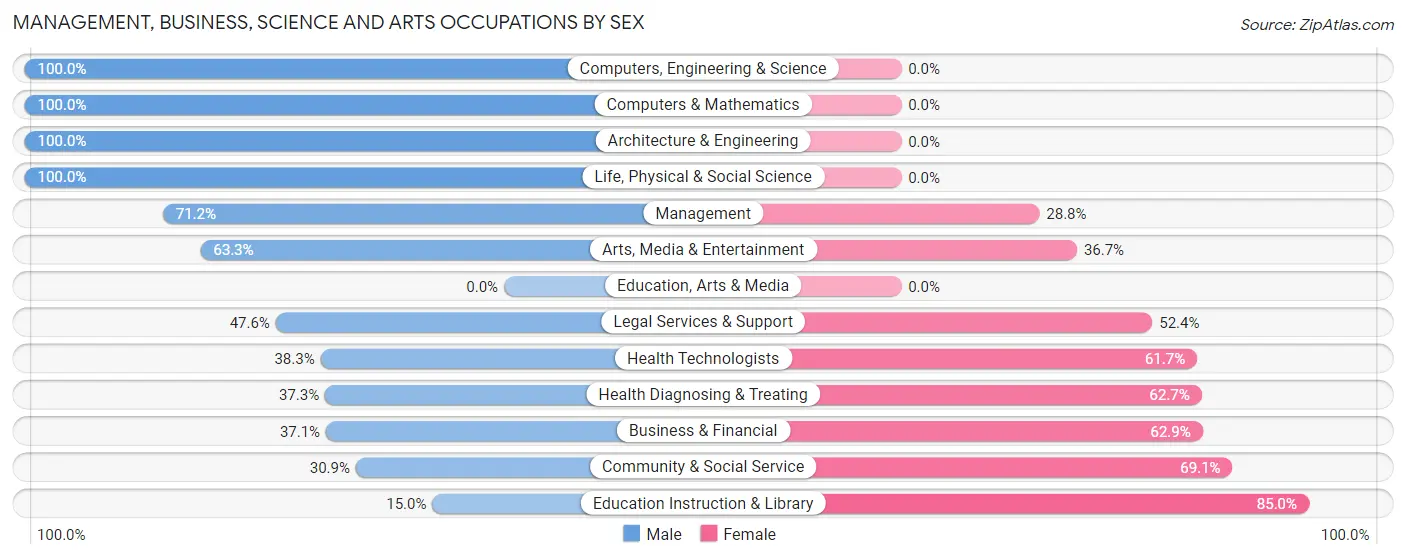
Management, Business, Science and Arts Occupations by Sex
Within the Management, Business, Science and Arts occupations in Lido Beach, the most male-oriented occupations are Computers, Engineering & Science (100.0%), Computers & Mathematics (100.0%), and Architecture & Engineering (100.0%), while the most female-oriented occupations are Education Instruction & Library (85.0%), Community & Social Service (69.1%), and Business & Financial (62.9%).
| Occupation | Male | Female |
| Management | 116 (71.2%) | 47 (28.8%) |
| Business & Financial | 26 (37.1%) | 44 (62.9%) |
| Computers, Engineering & Science | 94 (100.0%) | 0 (0.0%) |
| Computers & Mathematics | 39 (100.0%) | 0 (0.0%) |
| Architecture & Engineering | 42 (100.0%) | 0 (0.0%) |
| Life, Physical & Social Science | 13 (100.0%) | 0 (0.0%) |
| Community & Social Service | 68 (30.9%) | 152 (69.1%) |
| Education, Arts & Media | 0 (0.0%) | 0 (0.0%) |
| Legal Services & Support | 30 (47.6%) | 33 (52.4%) |
| Education Instruction & Library | 19 (15.0%) | 108 (85.0%) |
| Arts, Media & Entertainment | 19 (63.3%) | 11 (36.7%) |
| Health Diagnosing & Treating | 56 (37.3%) | 94 (62.7%) |
| Health Technologists | 49 (38.3%) | 79 (61.7%) |
| Total (Category) | 360 (51.6%) | 337 (48.3%) |
| Total (Overall) | 794 (60.6%) | 517 (39.4%) |
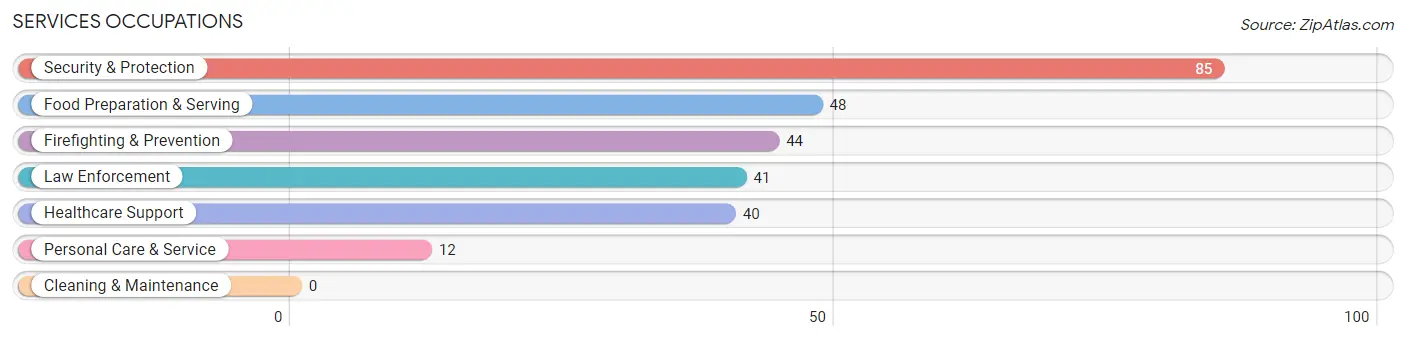
Services Occupations
The most common Services occupations in Lido Beach are Security & Protection (85 | 6.5%), Food Preparation & Serving (48 | 3.7%), Firefighting & Prevention (44 | 3.4%), Law Enforcement (41 | 3.1%), and Healthcare Support (40 | 3.0%).
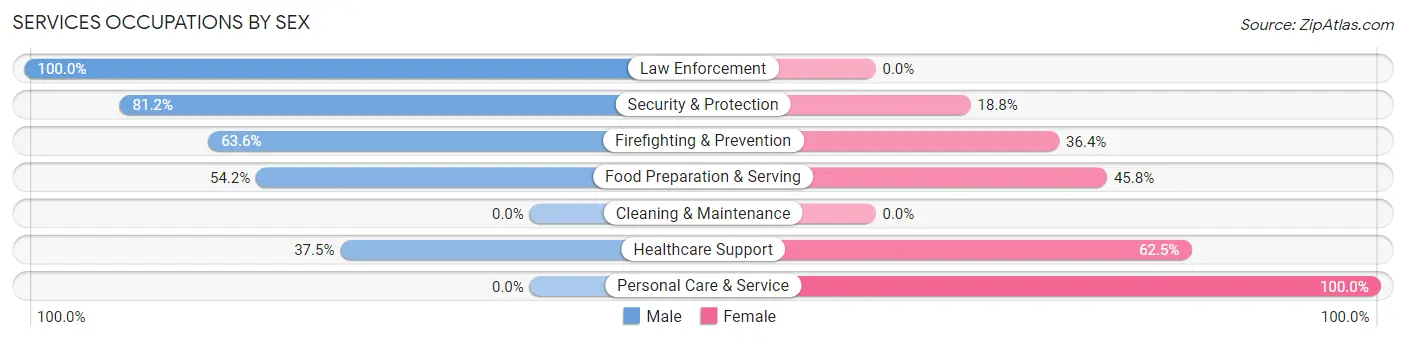
Services Occupations by Sex
Within the Services occupations in Lido Beach, the most male-oriented occupations are Law Enforcement (100.0%), Security & Protection (81.2%), and Firefighting & Prevention (63.6%), while the most female-oriented occupations are Personal Care & Service (100.0%), Healthcare Support (62.5%), and Food Preparation & Serving (45.8%).
| Occupation | Male | Female |
| Healthcare Support | 15 (37.5%) | 25 (62.5%) |
| Security & Protection | 69 (81.2%) | 16 (18.8%) |
| Firefighting & Prevention | 28 (63.6%) | 16 (36.4%) |
| Law Enforcement | 41 (100.0%) | 0 (0.0%) |
| Food Preparation & Serving | 26 (54.2%) | 22 (45.8%) |
| Cleaning & Maintenance | 0 (0.0%) | 0 (0.0%) |
| Personal Care & Service | 0 (0.0%) | 12 (100.0%) |
| Total (Category) | 110 (59.5%) | 75 (40.5%) |
| Total (Overall) | 794 (60.6%) | 517 (39.4%) |
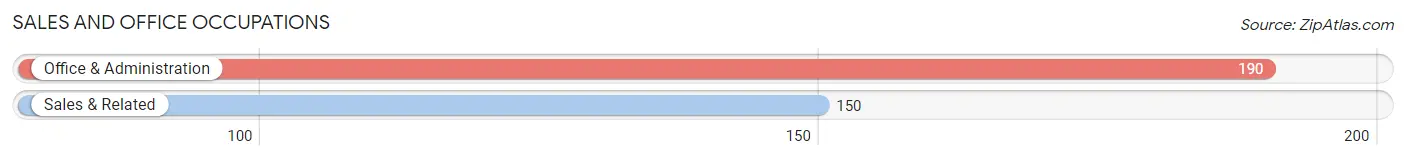
Sales and Office Occupations
The most common Sales and Office occupations in Lido Beach are Office & Administration (190 | 14.5%), and Sales & Related (150 | 11.4%).
Sales and Office Occupations by Sex
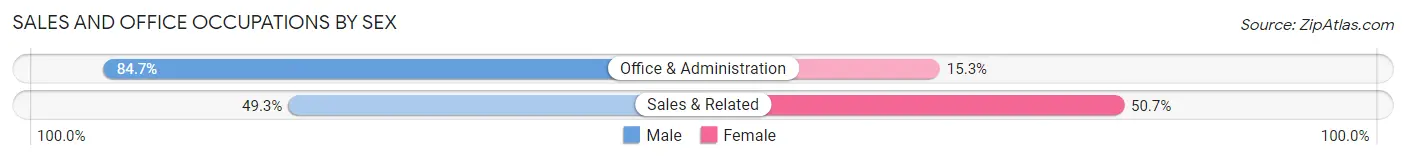
| Occupation | Male | Female |
| Sales & Related | 74 (49.3%) | 76 (50.7%) |
| Office & Administration | 161 (84.7%) | 29 (15.3%) |
| Total (Category) | 235 (69.1%) | 105 (30.9%) |
| Total (Overall) | 794 (60.6%) | 517 (39.4%) |
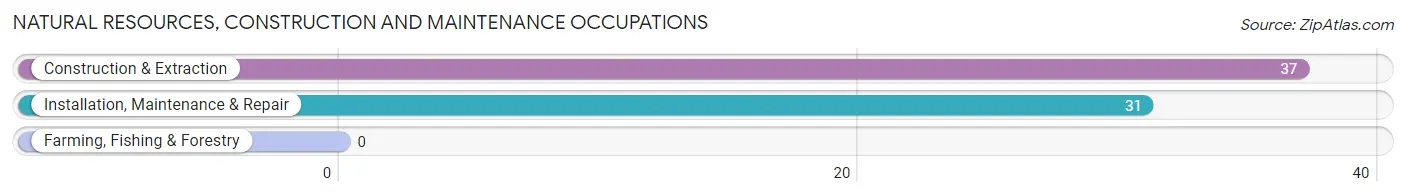
Natural Resources, Construction and Maintenance Occupations
The most common Natural Resources, Construction and Maintenance occupations in Lido Beach are Construction & Extraction (37 | 2.8%), and Installation, Maintenance & Repair (31 | 2.4%).
Natural Resources, Construction and Maintenance Occupations by Sex
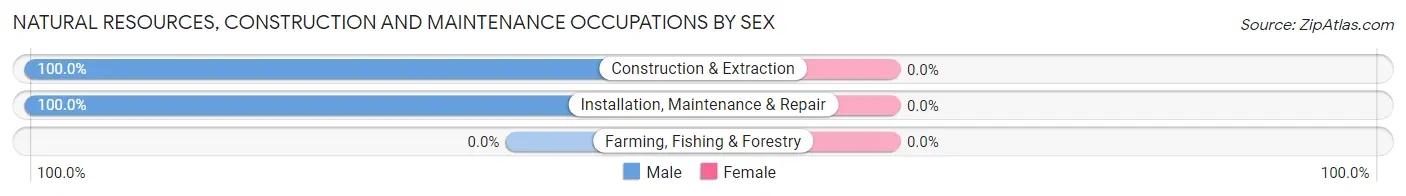
| Occupation | Male | Female |
| Farming, Fishing & Forestry | 0 (0.0%) | 0 (0.0%) |
| Construction & Extraction | 37 (100.0%) | 0 (0.0%) |
| Installation, Maintenance & Repair | 31 (100.0%) | 0 (0.0%) |
| Total (Category) | 68 (100.0%) | 0 (0.0%) |
| Total (Overall) | 794 (60.6%) | 517 (39.4%) |
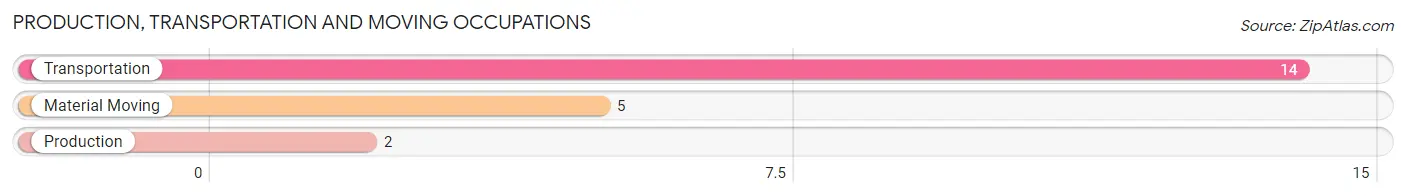
Production, Transportation and Moving Occupations
The most common Production, Transportation and Moving occupations in Lido Beach are Transportation (14 | 1.1%), Material Moving (5 | 0.4%), and Production (2 | 0.2%).
Production, Transportation and Moving Occupations by Sex
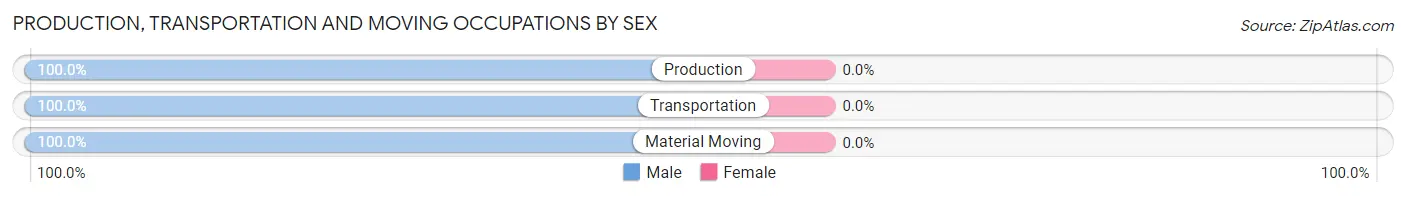
| Occupation | Male | Female |
| Production | 2 (100.0%) | 0 (0.0%) |
| Transportation | 14 (100.0%) | 0 (0.0%) |
| Material Moving | 5 (100.0%) | 0 (0.0%) |
| Total (Category) | 21 (100.0%) | 0 (0.0%) |
| Total (Overall) | 794 (60.6%) | 517 (39.4%) |
Employment Industries by Sex in Lido Beach
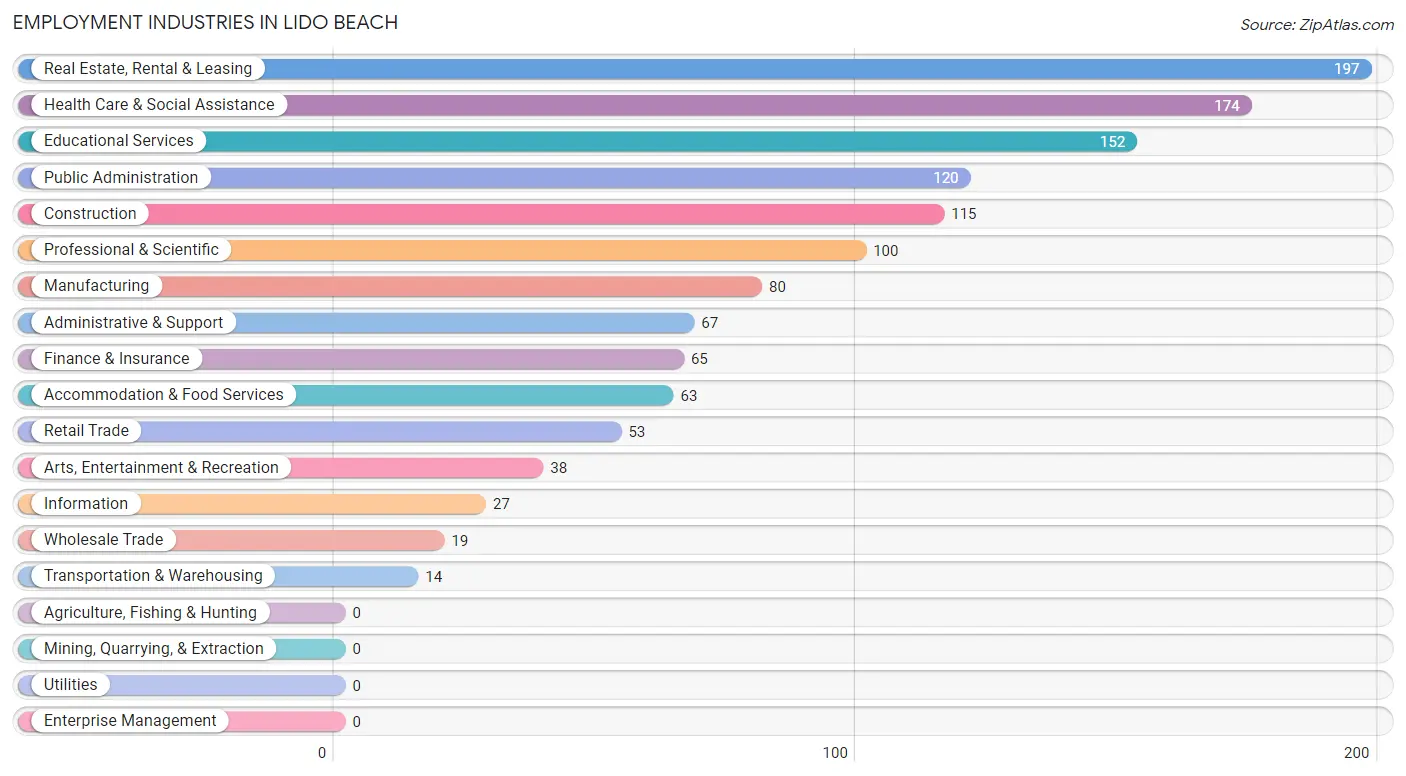
Employment Industries in Lido Beach
The major employment industries in Lido Beach include Real Estate, Rental & Leasing (197 | 15.0%), Health Care & Social Assistance (174 | 13.3%), Educational Services (152 | 11.6%), Public Administration (120 | 9.1%), and Construction (115 | 8.8%).
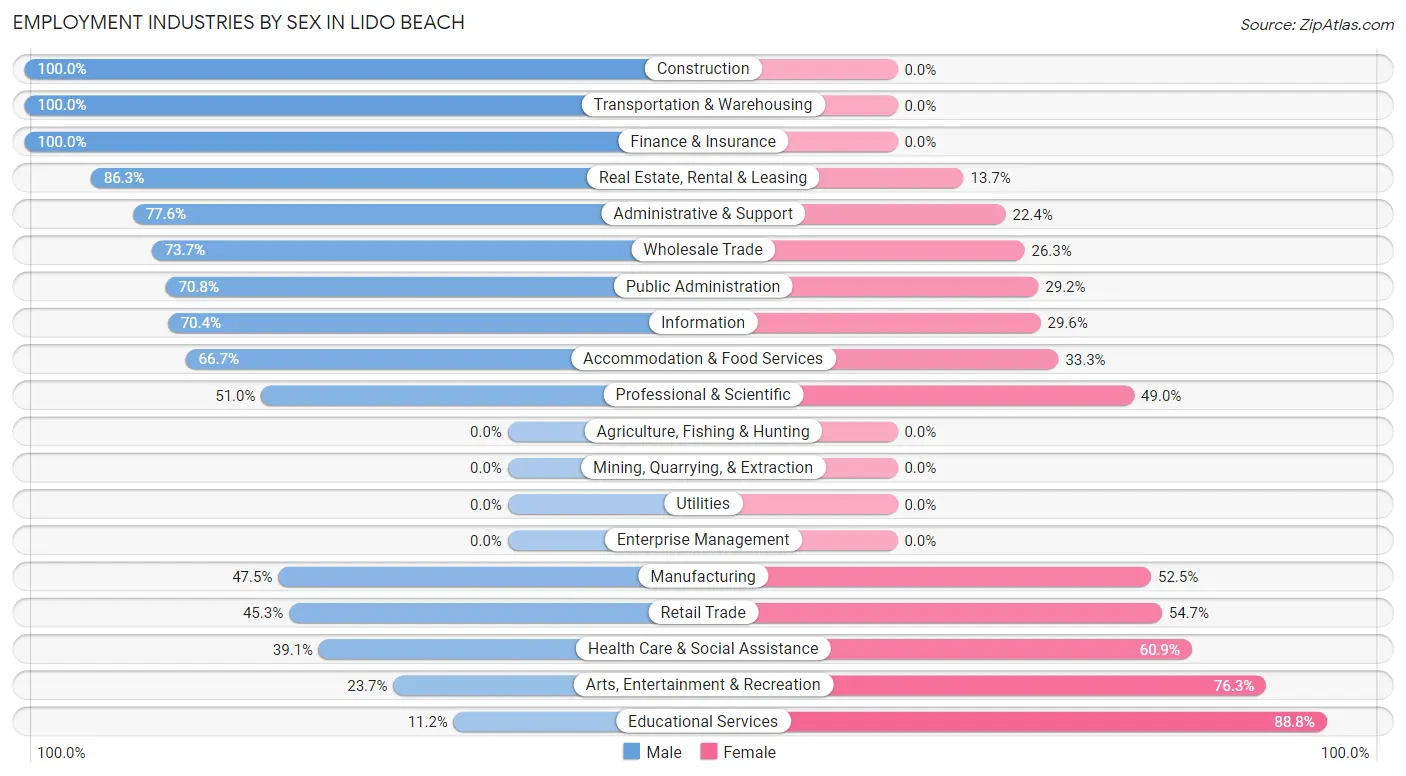
Employment Industries by Sex in Lido Beach
The Lido Beach industries that see more men than women are Construction (100.0%), Transportation & Warehousing (100.0%), and Finance & Insurance (100.0%), whereas the industries that tend to have a higher number of women are Educational Services (88.8%), Arts, Entertainment & Recreation (76.3%), and Health Care & Social Assistance (60.9%).
| Industry | Male | Female |
| Agriculture, Fishing & Hunting | 0 (0.0%) | 0 (0.0%) |
| Mining, Quarrying, & Extraction | 0 (0.0%) | 0 (0.0%) |
| Construction | 115 (100.0%) | 0 (0.0%) |
| Manufacturing | 38 (47.5%) | 42 (52.5%) |
| Wholesale Trade | 14 (73.7%) | 5 (26.3%) |
| Retail Trade | 24 (45.3%) | 29 (54.7%) |
| Transportation & Warehousing | 14 (100.0%) | 0 (0.0%) |
| Utilities | 0 (0.0%) | 0 (0.0%) |
| Information | 19 (70.4%) | 8 (29.6%) |
| Finance & Insurance | 65 (100.0%) | 0 (0.0%) |
| Real Estate, Rental & Leasing | 170 (86.3%) | 27 (13.7%) |
| Professional & Scientific | 51 (51.0%) | 49 (49.0%) |
| Enterprise Management | 0 (0.0%) | 0 (0.0%) |
| Administrative & Support | 52 (77.6%) | 15 (22.4%) |
| Educational Services | 17 (11.2%) | 135 (88.8%) |
| Health Care & Social Assistance | 68 (39.1%) | 106 (60.9%) |
| Arts, Entertainment & Recreation | 9 (23.7%) | 29 (76.3%) |
| Accommodation & Food Services | 42 (66.7%) | 21 (33.3%) |
| Public Administration | 85 (70.8%) | 35 (29.2%) |
| Total | 794 (60.6%) | 517 (39.4%) |
Education in Lido Beach
School Enrollment in Lido Beach
The most common levels of schooling among the 496 students in Lido Beach are middle school (128 | 25.8%), elementary school (115 | 23.2%), and college / undergraduate (88 | 17.7%).
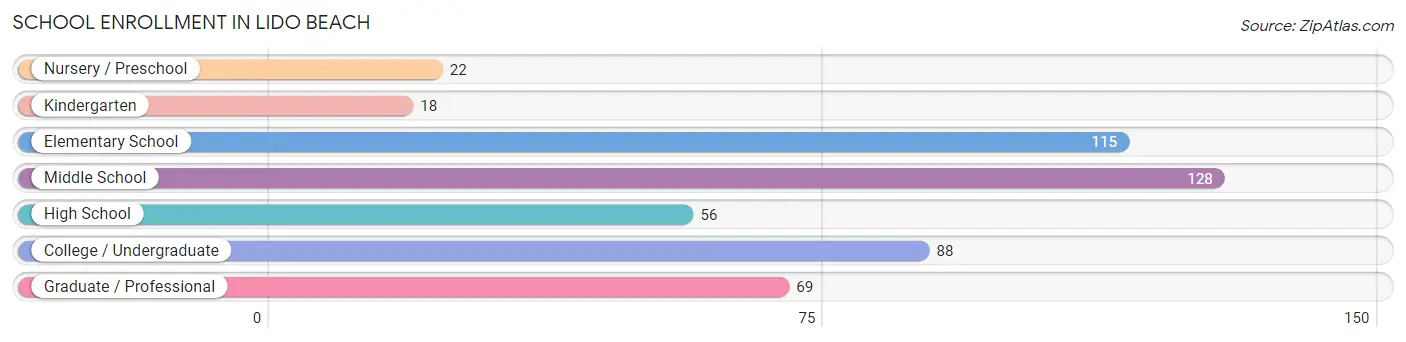
| School Level | # Students | % Students |
| Nursery / Preschool | 22 | 4.4% |
| Kindergarten | 18 | 3.6% |
| Elementary School | 115 | 23.2% |
| Middle School | 128 | 25.8% |
| High School | 56 | 11.3% |
| College / Undergraduate | 88 | 17.7% |
| Graduate / Professional | 69 | 13.9% |
| Total | 496 | 100.0% |
School Enrollment by Age by Funding Source in Lido Beach
Out of a total of 496 students who are enrolled in schools in Lido Beach, 233 (47.0%) attend a private institution, while the remaining 263 (53.0%) are enrolled in public schools. The age group of 3 to 4 year olds has the highest likelihood of being enrolled in private schools, with 8 (100.0% in the age bracket) enrolled. Conversely, the age group of 10 to 14 year olds has the lowest likelihood of being enrolled in a private school, with 132 (81.0% in the age bracket) attending a public institution.
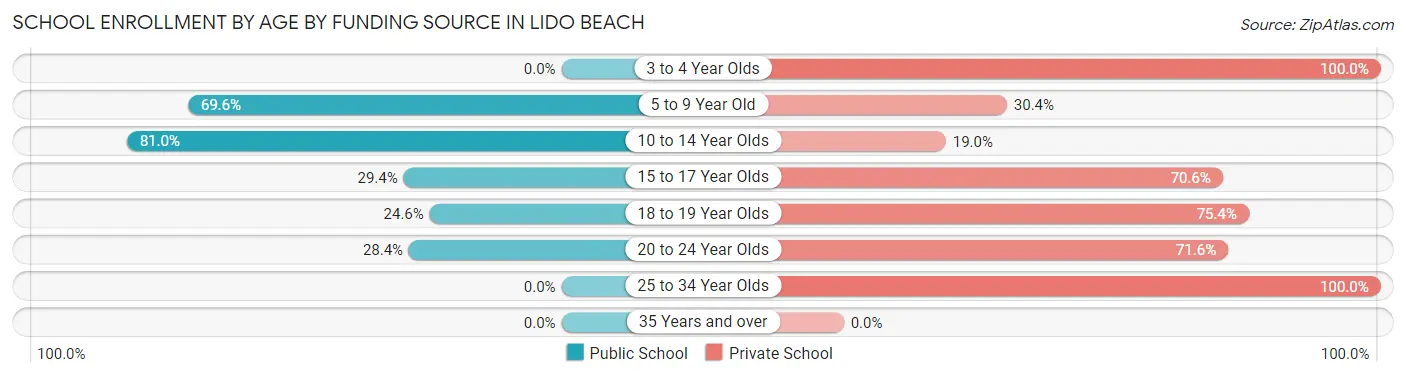
| Age Bracket | Public School | Private School |
| 3 to 4 Year Olds | 0 (0.0%) | 8 (100.0%) |
| 5 to 9 Year Old | 87 (69.6%) | 38 (30.4%) |
| 10 to 14 Year Olds | 132 (81.0%) | 31 (19.0%) |
| 15 to 17 Year Olds | 5 (29.4%) | 12 (70.6%) |
| 18 to 19 Year Olds | 14 (24.6%) | 43 (75.4%) |
| 20 to 24 Year Olds | 25 (28.4%) | 63 (71.6%) |
| 25 to 34 Year Olds | 0 (0.0%) | 38 (100.0%) |
| 35 Years and over | 0 (0.0%) | 0 (0.0%) |
| Total | 263 (53.0%) | 233 (47.0%) |
Educational Attainment by Field of Study in Lido Beach
Business (281 | 20.7%), social sciences (246 | 18.1%), science & technology (154 | 11.4%), education (136 | 10.0%), and literature & languages (90 | 6.6%) are the most common fields of study among 1,356 individuals in Lido Beach who have obtained a bachelor's degree or higher.
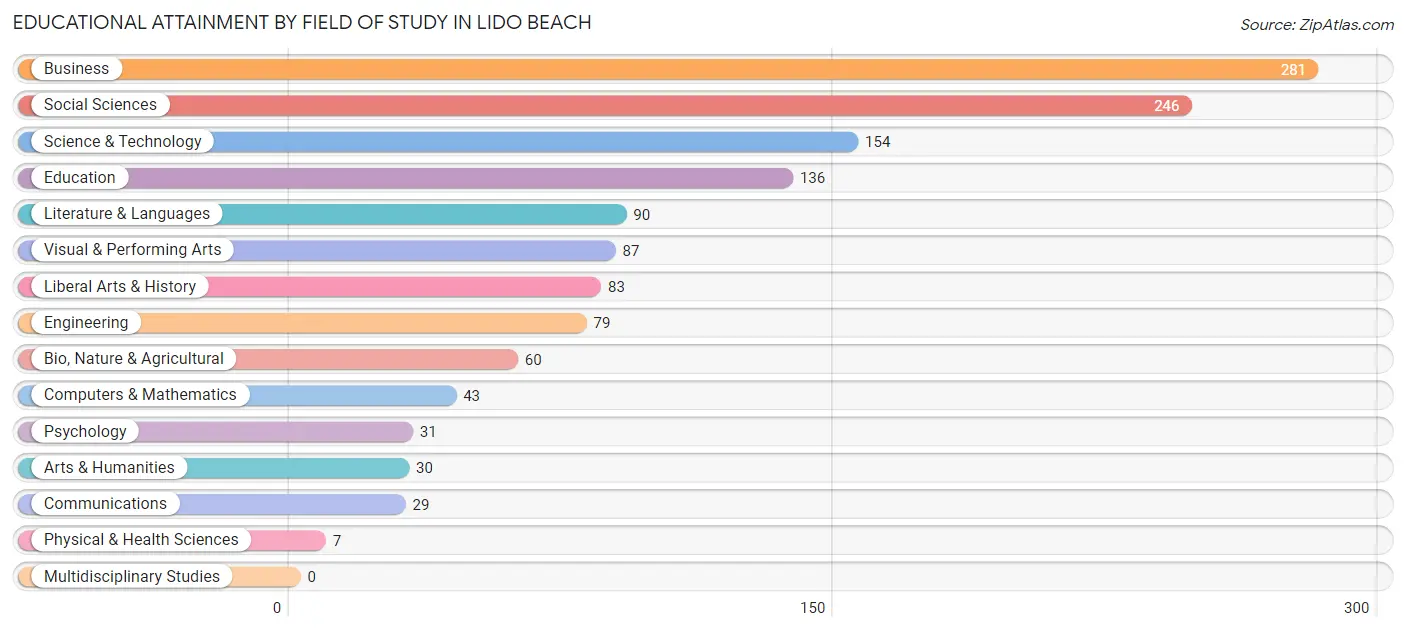
| Field of Study | # Graduates | % Graduates |
| Computers & Mathematics | 43 | 3.2% |
| Bio, Nature & Agricultural | 60 | 4.4% |
| Physical & Health Sciences | 7 | 0.5% |
| Psychology | 31 | 2.3% |
| Social Sciences | 246 | 18.1% |
| Engineering | 79 | 5.8% |
| Multidisciplinary Studies | 0 | 0.0% |
| Science & Technology | 154 | 11.4% |
| Business | 281 | 20.7% |
| Education | 136 | 10.0% |
| Literature & Languages | 90 | 6.6% |
| Liberal Arts & History | 83 | 6.1% |
| Visual & Performing Arts | 87 | 6.4% |
| Communications | 29 | 2.1% |
| Arts & Humanities | 30 | 2.2% |
| Total | 1,356 | 100.0% |
Transportation & Commute in Lido Beach
Vehicle Availability by Sex in Lido Beach
The most prevalent vehicle ownership categories in Lido Beach are males with 2 vehicles (322, accounting for 41.2%) and females with 2 vehicles (226, making up 63.0%).
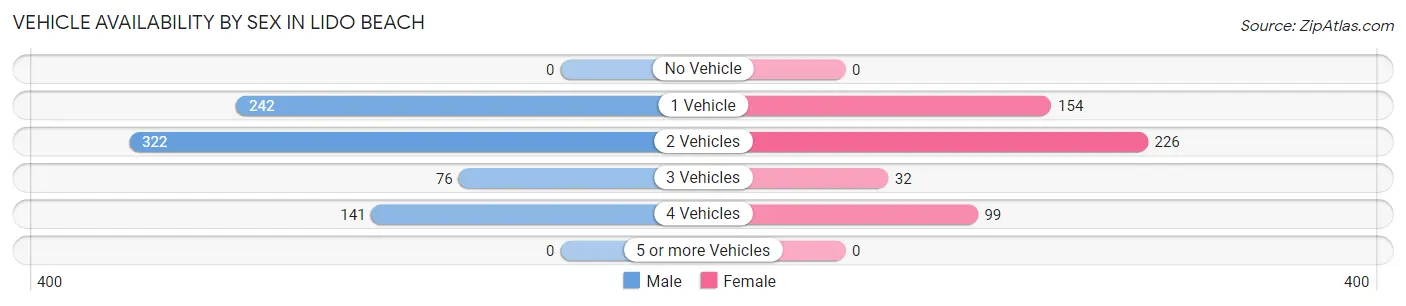
| Vehicles Available | Male | Female |
| No Vehicle | 0 (0.0%) | 0 (0.0%) |
| 1 Vehicle | 242 (31.0%) | 154 (30.1%) |
| 2 Vehicles | 322 (41.2%) | 226 (44.2%) |
| 3 Vehicles | 76 (9.7%) | 32 (6.3%) |
| 4 Vehicles | 141 (18.0%) | 99 (19.4%) |
| 5 or more Vehicles | 0 (0.0%) | 0 (0.0%) |
| Total | 781 (100.0%) | 511 (100.0%) |
Commute Time in Lido Beach
The most frequently occuring commute durations in Lido Beach are 60 to 89 minutes (207 commuters, 20.7%), 45 to 59 minutes (161 commuters, 16.1%), and 30 to 34 minutes (118 commuters, 11.8%).
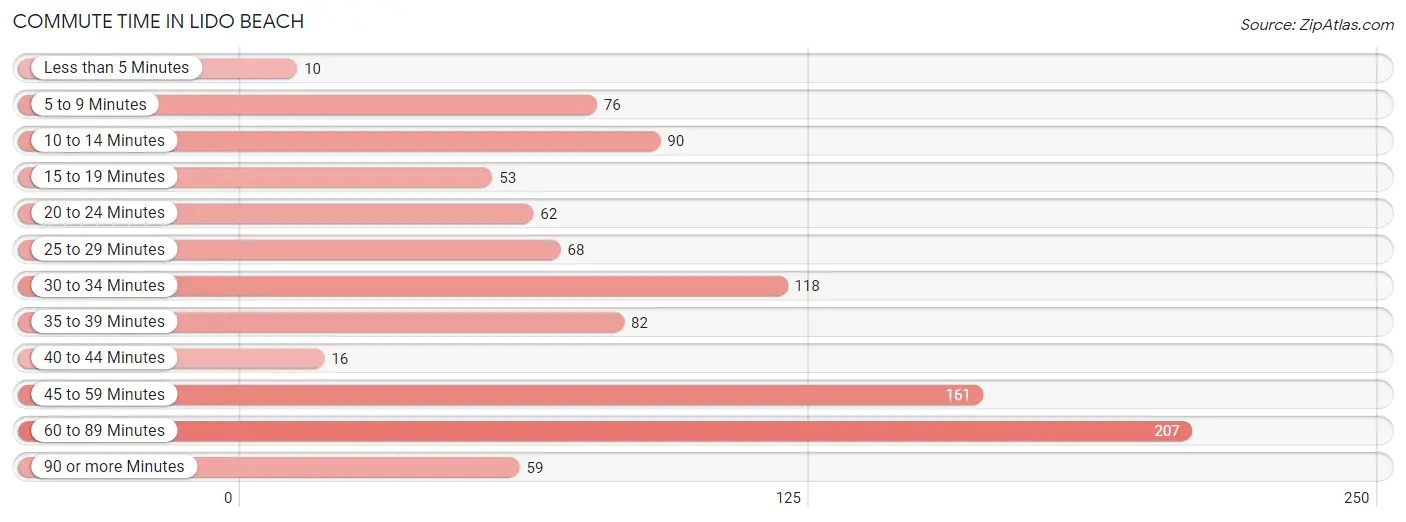
| Commute Time | # Commuters | % Commuters |
| Less than 5 Minutes | 10 | 1.0% |
| 5 to 9 Minutes | 76 | 7.6% |
| 10 to 14 Minutes | 90 | 9.0% |
| 15 to 19 Minutes | 53 | 5.3% |
| 20 to 24 Minutes | 62 | 6.2% |
| 25 to 29 Minutes | 68 | 6.8% |
| 30 to 34 Minutes | 118 | 11.8% |
| 35 to 39 Minutes | 82 | 8.2% |
| 40 to 44 Minutes | 16 | 1.6% |
| 45 to 59 Minutes | 161 | 16.1% |
| 60 to 89 Minutes | 207 | 20.7% |
| 90 or more Minutes | 59 | 5.9% |
Commute Time by Sex in Lido Beach
The most common commute times in Lido Beach are 60 to 89 minutes (185 commuters, 29.4%) for males and 45 to 59 minutes (76 commuters, 20.4%) for females.
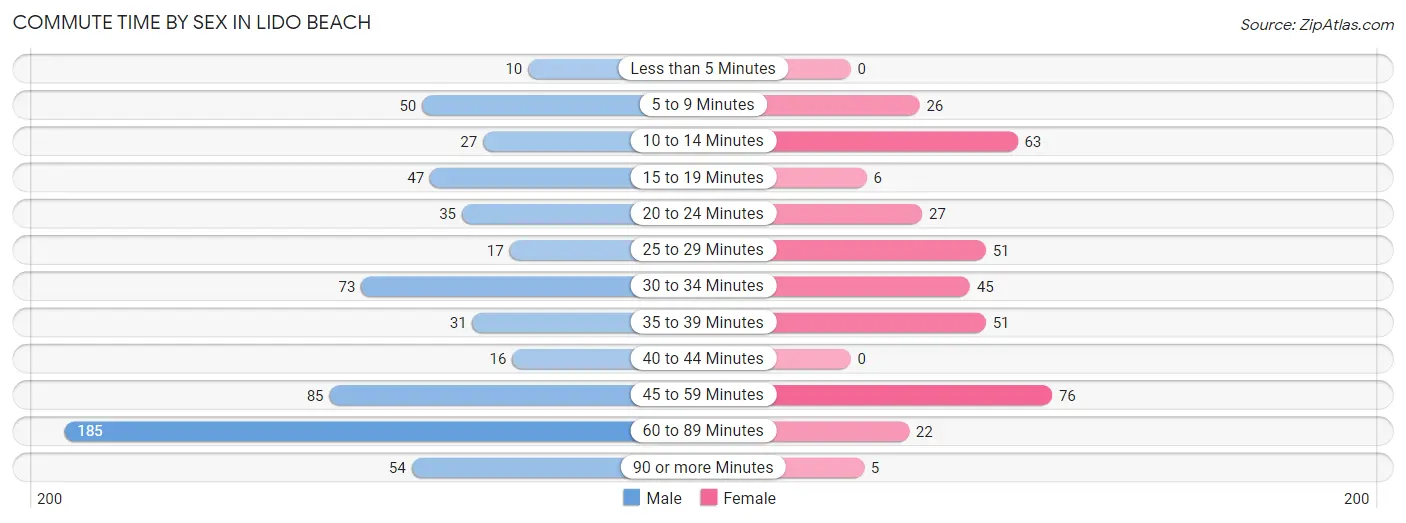
| Commute Time | Male | Female |
| Less than 5 Minutes | 10 (1.6%) | 0 (0.0%) |
| 5 to 9 Minutes | 50 (7.9%) | 26 (7.0%) |
| 10 to 14 Minutes | 27 (4.3%) | 63 (16.9%) |
| 15 to 19 Minutes | 47 (7.5%) | 6 (1.6%) |
| 20 to 24 Minutes | 35 (5.6%) | 27 (7.3%) |
| 25 to 29 Minutes | 17 (2.7%) | 51 (13.7%) |
| 30 to 34 Minutes | 73 (11.6%) | 45 (12.1%) |
| 35 to 39 Minutes | 31 (4.9%) | 51 (13.7%) |
| 40 to 44 Minutes | 16 (2.5%) | 0 (0.0%) |
| 45 to 59 Minutes | 85 (13.5%) | 76 (20.4%) |
| 60 to 89 Minutes | 185 (29.4%) | 22 (5.9%) |
| 90 or more Minutes | 54 (8.6%) | 5 (1.3%) |
Time of Departure to Work by Sex in Lido Beach
The most frequent times of departure to work in Lido Beach are 5:30 AM to 5:59 AM (139, 22.1%) for males and 8:30 AM to 8:59 AM (94, 25.3%) for females.
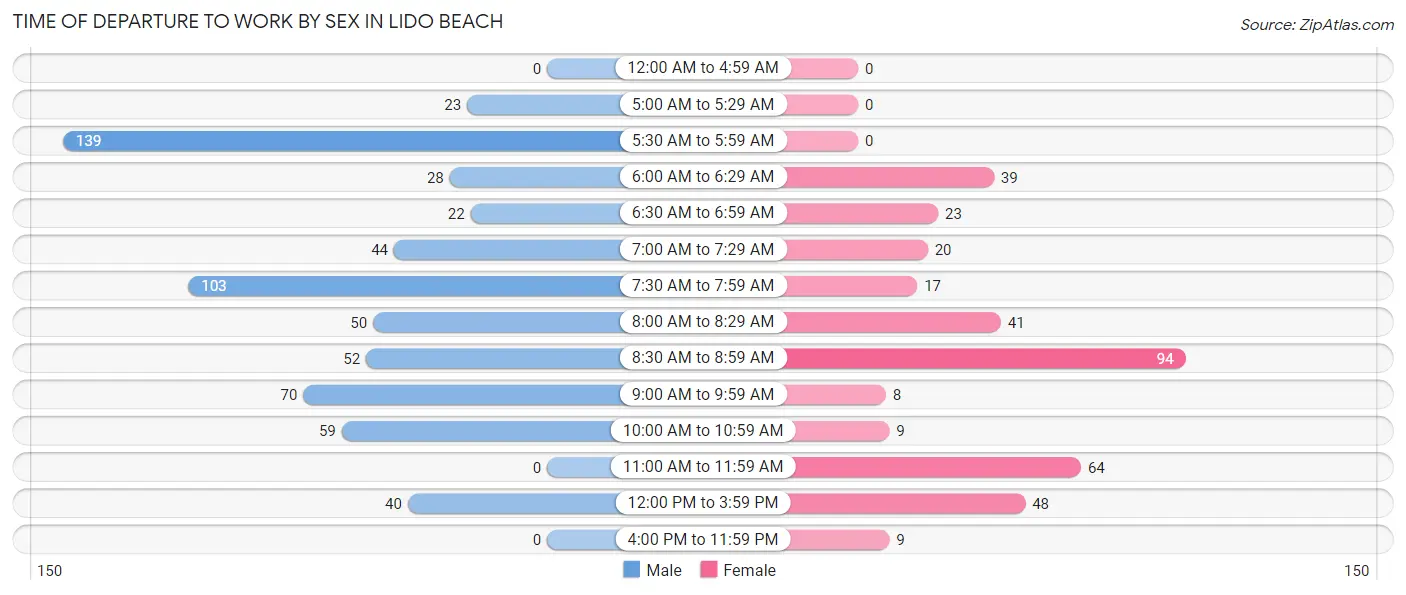
| Time of Departure | Male | Female |
| 12:00 AM to 4:59 AM | 0 (0.0%) | 0 (0.0%) |
| 5:00 AM to 5:29 AM | 23 (3.6%) | 0 (0.0%) |
| 5:30 AM to 5:59 AM | 139 (22.1%) | 0 (0.0%) |
| 6:00 AM to 6:29 AM | 28 (4.4%) | 39 (10.5%) |
| 6:30 AM to 6:59 AM | 22 (3.5%) | 23 (6.2%) |
| 7:00 AM to 7:29 AM | 44 (7.0%) | 20 (5.4%) |
| 7:30 AM to 7:59 AM | 103 (16.4%) | 17 (4.6%) |
| 8:00 AM to 8:29 AM | 50 (7.9%) | 41 (11.0%) |
| 8:30 AM to 8:59 AM | 52 (8.3%) | 94 (25.3%) |
| 9:00 AM to 9:59 AM | 70 (11.1%) | 8 (2.1%) |
| 10:00 AM to 10:59 AM | 59 (9.4%) | 9 (2.4%) |
| 11:00 AM to 11:59 AM | 0 (0.0%) | 64 (17.2%) |
| 12:00 PM to 3:59 PM | 40 (6.4%) | 48 (12.9%) |
| 4:00 PM to 11:59 PM | 0 (0.0%) | 9 (2.4%) |
| Total | 630 (100.0%) | 372 (100.0%) |
Housing Occupancy in Lido Beach
Occupancy by Ownership in Lido Beach
Of the total 1,182 dwellings in Lido Beach, owner-occupied units account for 824 (69.7%), while renter-occupied units make up 358 (30.3%).
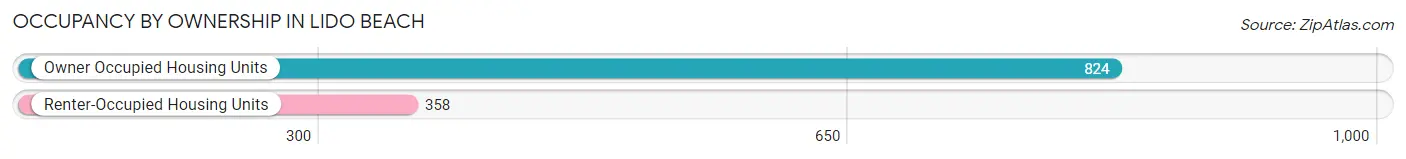
| Occupancy | # Housing Units | % Housing Units |
| Owner Occupied Housing Units | 824 | 69.7% |
| Renter-Occupied Housing Units | 358 | 30.3% |
| Total Occupied Housing Units | 1,182 | 100.0% |
Occupancy by Household Size in Lido Beach
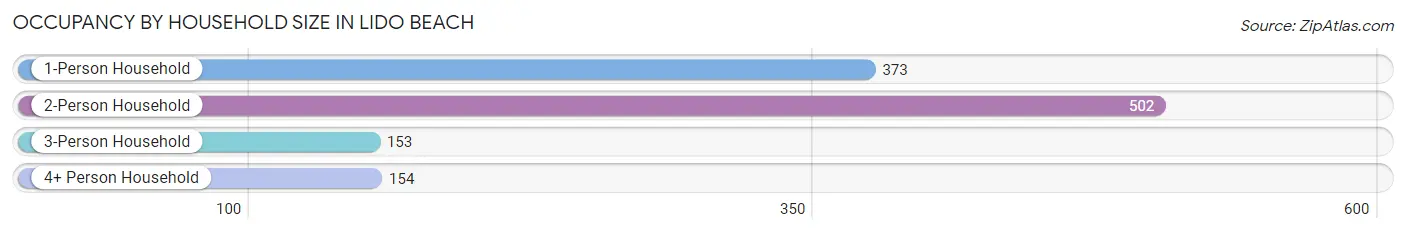
| Household Size | # Housing Units | % Housing Units |
| 1-Person Household | 373 | 31.6% |
| 2-Person Household | 502 | 42.5% |
| 3-Person Household | 153 | 12.9% |
| 4+ Person Household | 154 | 13.0% |
| Total Housing Units | 1,182 | 100.0% |
Occupancy by Ownership by Household Size in Lido Beach
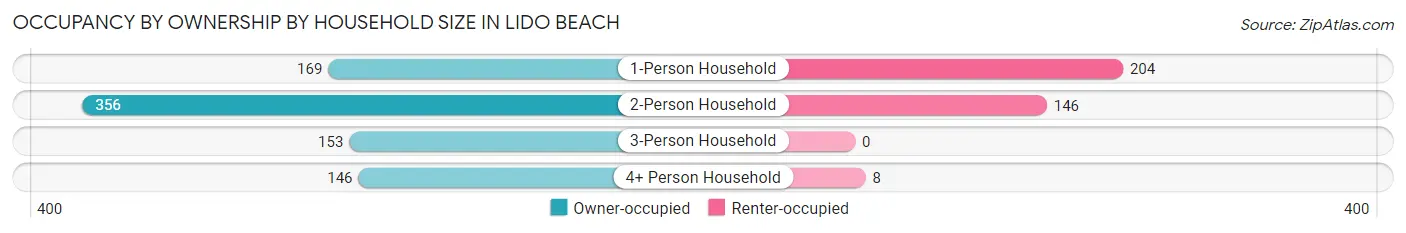
| Household Size | Owner-occupied | Renter-occupied |
| 1-Person Household | 169 (45.3%) | 204 (54.7%) |
| 2-Person Household | 356 (70.9%) | 146 (29.1%) |
| 3-Person Household | 153 (100.0%) | 0 (0.0%) |
| 4+ Person Household | 146 (94.8%) | 8 (5.2%) |
| Total Housing Units | 824 (69.7%) | 358 (30.3%) |
Occupancy by Educational Attainment in Lido Beach
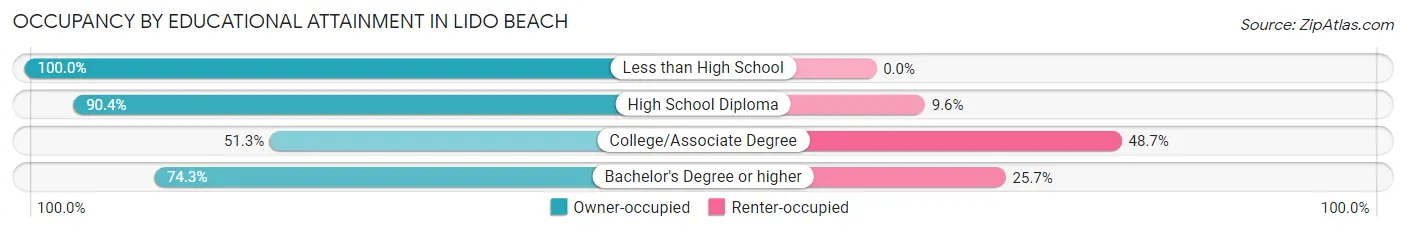
| Household Size | Owner-occupied | Renter-occupied |
| Less than High School | 2 (100.0%) | 0 (0.0%) |
| High School Diploma | 75 (90.4%) | 8 (9.6%) |
| College/Associate Degree | 153 (51.3%) | 145 (48.7%) |
| Bachelor's Degree or higher | 594 (74.3%) | 205 (25.7%) |
Occupancy by Age of Householder in Lido Beach
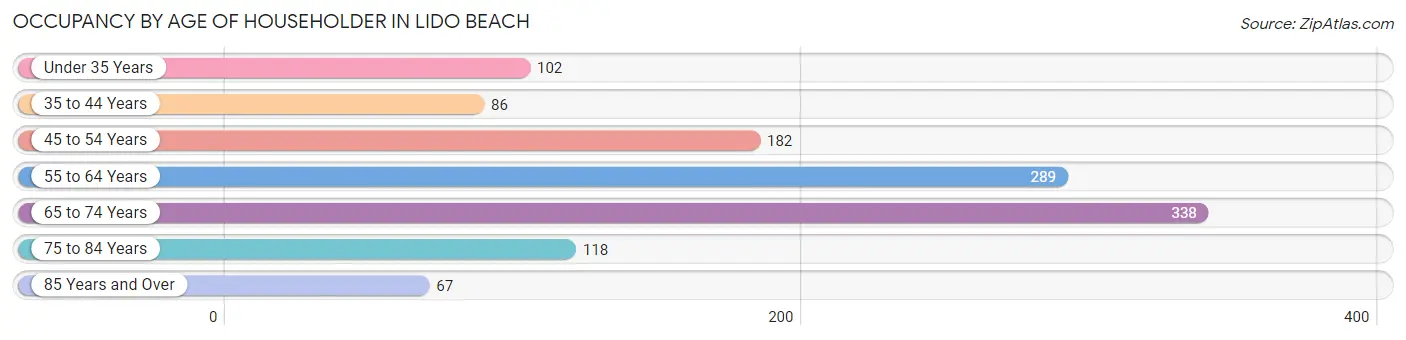
| Age Bracket | # Households | % Households |
| Under 35 Years | 102 | 8.6% |
| 35 to 44 Years | 86 | 7.3% |
| 45 to 54 Years | 182 | 15.4% |
| 55 to 64 Years | 289 | 24.4% |
| 65 to 74 Years | 338 | 28.6% |
| 75 to 84 Years | 118 | 10.0% |
| 85 Years and Over | 67 | 5.7% |
| Total | 1,182 | 100.0% |
Housing Finances in Lido Beach
Median Income by Occupancy in Lido Beach
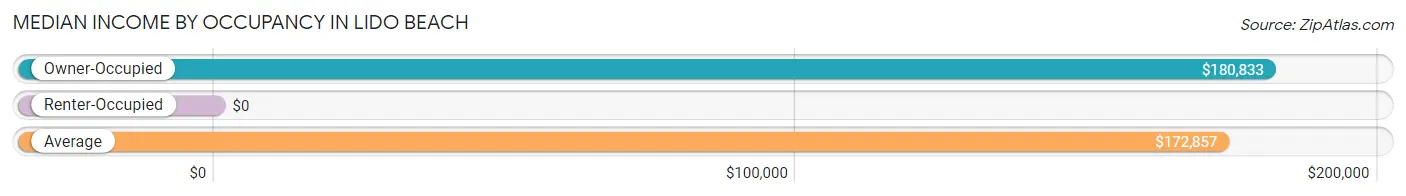
| Occupancy Type | # Households | Median Income |
| Owner-Occupied | 824 (69.7%) | $180,833 |
| Renter-Occupied | 358 (30.3%) | $0 |
| Average | 1,182 (100.0%) | $172,857 |
Occupancy by Householder Income Bracket in Lido Beach
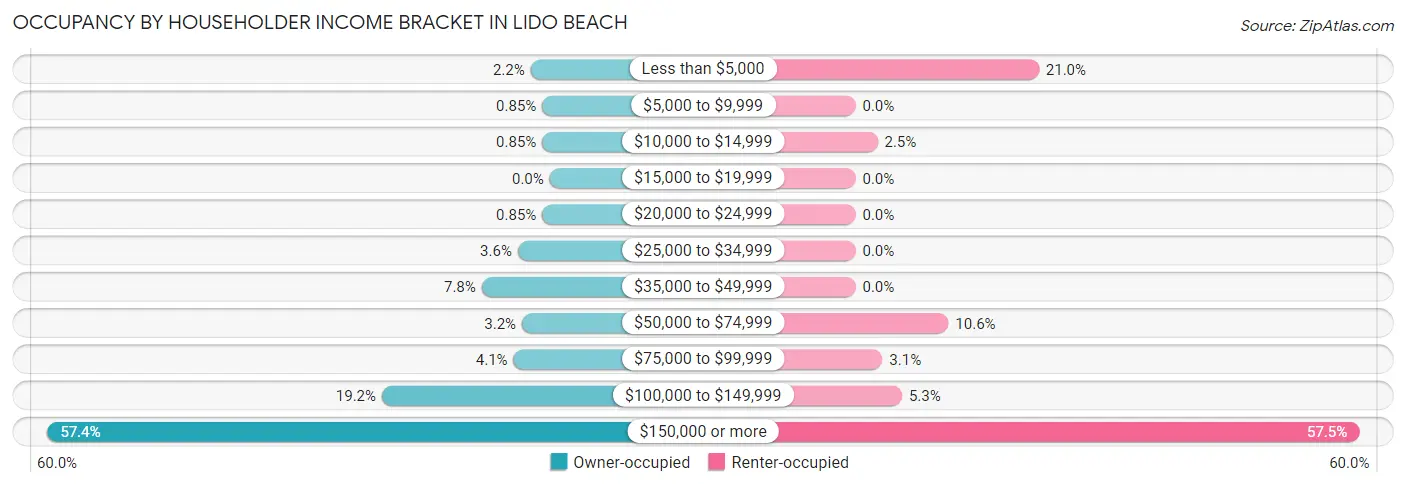
| Income Bracket | Owner-occupied | Renter-occupied |
| Less than $5,000 | 18 (2.2%) | 75 (20.9%) |
| $5,000 to $9,999 | 7 (0.9%) | 0 (0.0%) |
| $10,000 to $14,999 | 7 (0.9%) | 9 (2.5%) |
| $15,000 to $19,999 | 0 (0.0%) | 0 (0.0%) |
| $20,000 to $24,999 | 7 (0.9%) | 0 (0.0%) |
| $25,000 to $34,999 | 30 (3.6%) | 0 (0.0%) |
| $35,000 to $49,999 | 64 (7.8%) | 0 (0.0%) |
| $50,000 to $74,999 | 26 (3.2%) | 38 (10.6%) |
| $75,000 to $99,999 | 34 (4.1%) | 11 (3.1%) |
| $100,000 to $149,999 | 158 (19.2%) | 19 (5.3%) |
| $150,000 or more | 473 (57.4%) | 206 (57.5%) |
| Total | 824 (100.0%) | 358 (100.0%) |
Monthly Housing Cost Tiers in Lido Beach
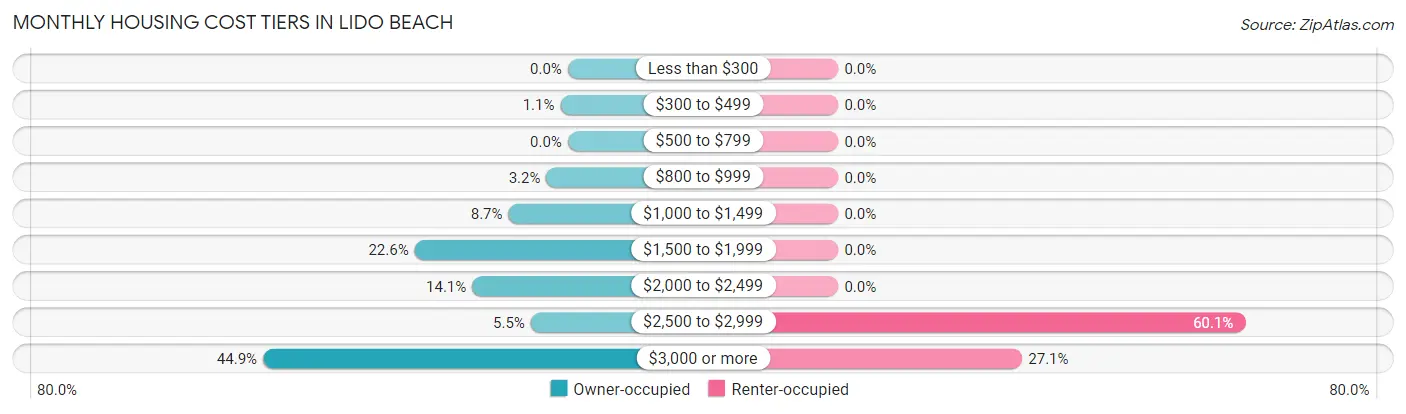
| Monthly Cost | Owner-occupied | Renter-occupied |
| Less than $300 | 0 (0.0%) | 0 (0.0%) |
| $300 to $499 | 9 (1.1%) | 0 (0.0%) |
| $500 to $799 | 0 (0.0%) | 0 (0.0%) |
| $800 to $999 | 26 (3.2%) | 0 (0.0%) |
| $1,000 to $1,499 | 72 (8.7%) | 0 (0.0%) |
| $1,500 to $1,999 | 186 (22.6%) | 0 (0.0%) |
| $2,000 to $2,499 | 116 (14.1%) | 0 (0.0%) |
| $2,500 to $2,999 | 45 (5.5%) | 215 (60.1%) |
| $3,000 or more | 370 (44.9%) | 97 (27.1%) |
| Total | 824 (100.0%) | 358 (100.0%) |
Physical Housing Characteristics in Lido Beach
Housing Structures in Lido Beach
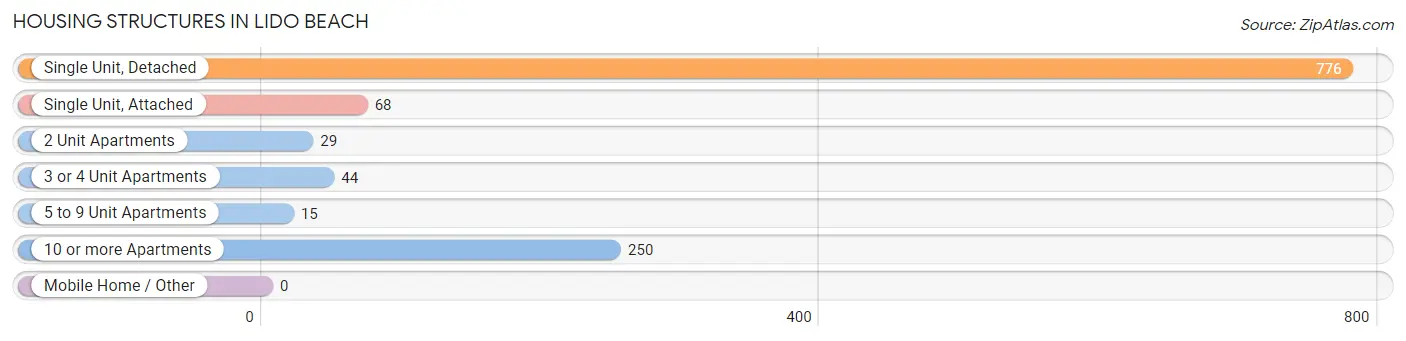
| Structure Type | # Housing Units | % Housing Units |
| Single Unit, Detached | 776 | 65.6% |
| Single Unit, Attached | 68 | 5.8% |
| 2 Unit Apartments | 29 | 2.5% |
| 3 or 4 Unit Apartments | 44 | 3.7% |
| 5 to 9 Unit Apartments | 15 | 1.3% |
| 10 or more Apartments | 250 | 21.1% |
| Mobile Home / Other | 0 | 0.0% |
| Total | 1,182 | 100.0% |
Housing Structures by Occupancy in Lido Beach
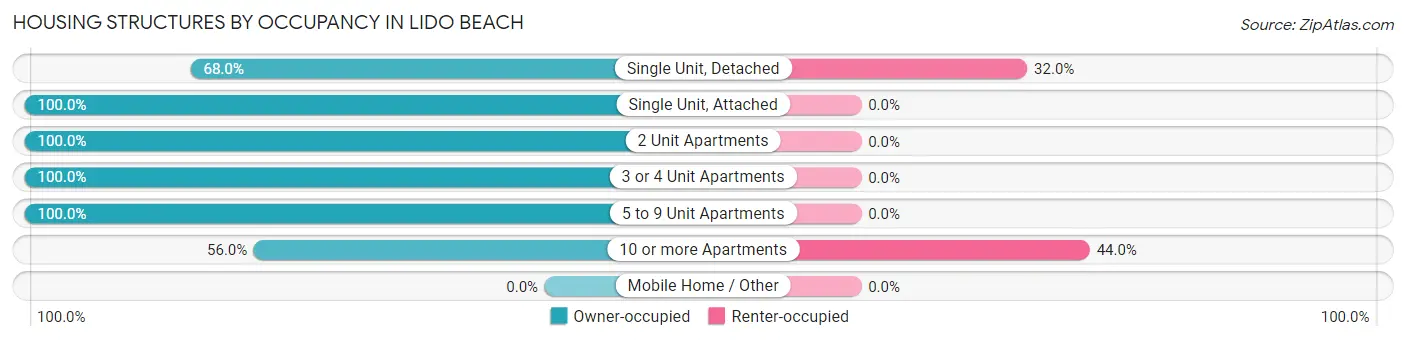
| Structure Type | Owner-occupied | Renter-occupied |
| Single Unit, Detached | 528 (68.0%) | 248 (32.0%) |
| Single Unit, Attached | 68 (100.0%) | 0 (0.0%) |
| 2 Unit Apartments | 29 (100.0%) | 0 (0.0%) |
| 3 or 4 Unit Apartments | 44 (100.0%) | 0 (0.0%) |
| 5 to 9 Unit Apartments | 15 (100.0%) | 0 (0.0%) |
| 10 or more Apartments | 140 (56.0%) | 110 (44.0%) |
| Mobile Home / Other | 0 (0.0%) | 0 (0.0%) |
| Total | 824 (69.7%) | 358 (30.3%) |
Housing Structures by Number of Rooms in Lido Beach
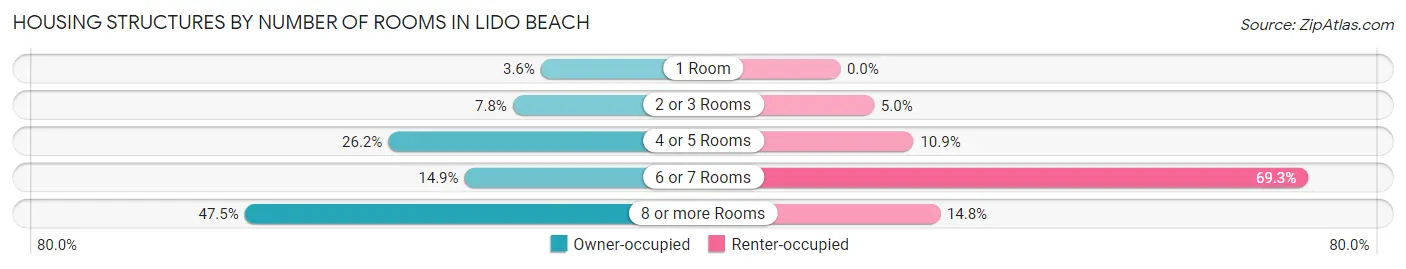
| Number of Rooms | Owner-occupied | Renter-occupied |
| 1 Room | 30 (3.6%) | 0 (0.0%) |
| 2 or 3 Rooms | 64 (7.8%) | 18 (5.0%) |
| 4 or 5 Rooms | 216 (26.2%) | 39 (10.9%) |
| 6 or 7 Rooms | 123 (14.9%) | 248 (69.3%) |
| 8 or more Rooms | 391 (47.4%) | 53 (14.8%) |
| Total | 824 (100.0%) | 358 (100.0%) |
Housing Structure by Heating Type in Lido Beach
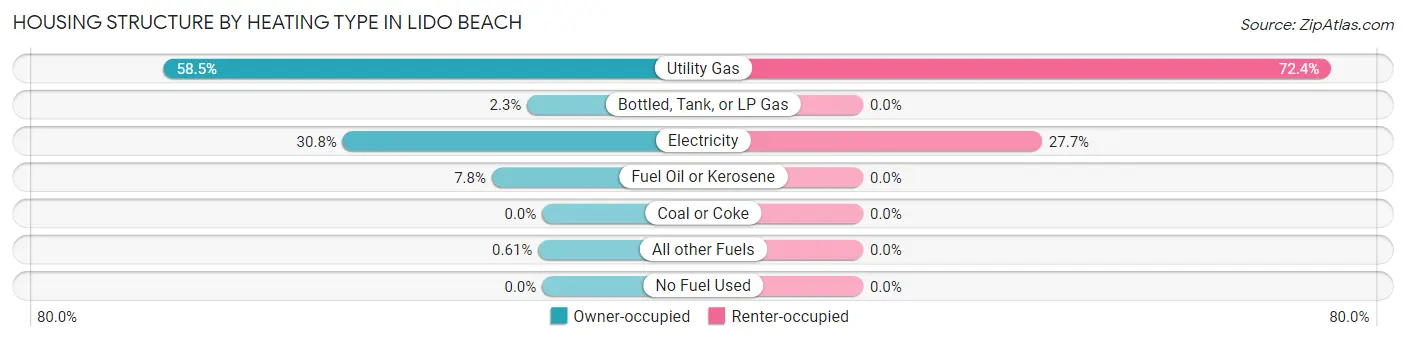
| Heating Type | Owner-occupied | Renter-occupied |
| Utility Gas | 482 (58.5%) | 259 (72.4%) |
| Bottled, Tank, or LP Gas | 19 (2.3%) | 0 (0.0%) |
| Electricity | 254 (30.8%) | 99 (27.7%) |
| Fuel Oil or Kerosene | 64 (7.8%) | 0 (0.0%) |
| Coal or Coke | 0 (0.0%) | 0 (0.0%) |
| All other Fuels | 5 (0.6%) | 0 (0.0%) |
| No Fuel Used | 0 (0.0%) | 0 (0.0%) |
| Total | 824 (100.0%) | 358 (100.0%) |
Household Vehicle Usage in Lido Beach
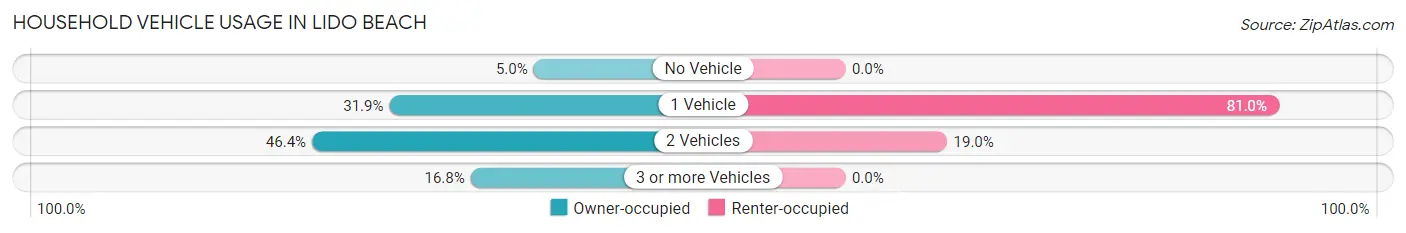
| Vehicles per Household | Owner-occupied | Renter-occupied |
| No Vehicle | 41 (5.0%) | 0 (0.0%) |
| 1 Vehicle | 263 (31.9%) | 290 (81.0%) |
| 2 Vehicles | 382 (46.4%) | 68 (19.0%) |
| 3 or more Vehicles | 138 (16.8%) | 0 (0.0%) |
| Total | 824 (100.0%) | 358 (100.0%) |
Real Estate & Mortgages in Lido Beach
Real Estate and Mortgage Overview in Lido Beach
| Characteristic | Without Mortgage | With Mortgage |
| Housing Units | 437 | 387 |
| Median Property Value | $665,100 | $810,100 |
| Median Household Income | $151,635 | $246 |
| Monthly Housing Costs | $1,501 | $326 |
| Real Estate Taxes | $10,001 | $19 |
Property Value by Mortgage Status in Lido Beach
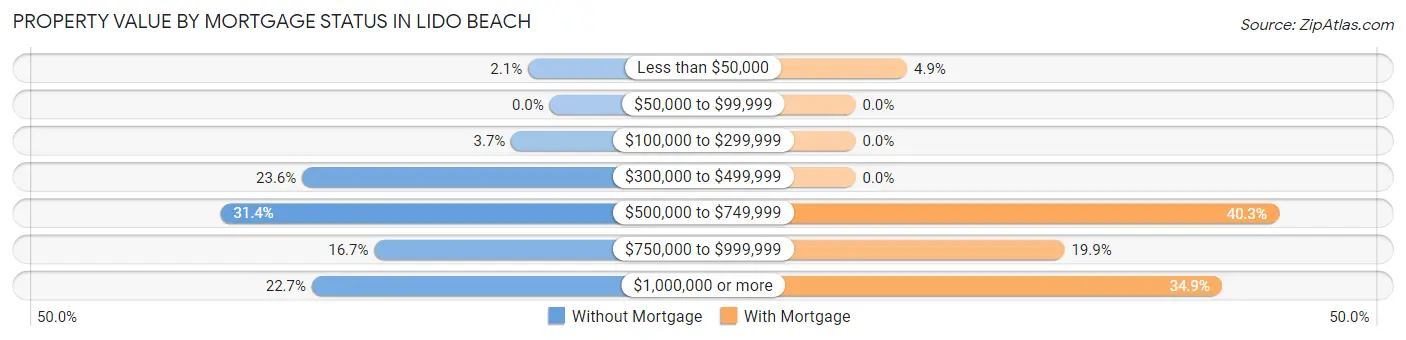
| Property Value | Without Mortgage | With Mortgage |
| Less than $50,000 | 9 (2.1%) | 19 (4.9%) |
| $50,000 to $99,999 | 0 (0.0%) | 0 (0.0%) |
| $100,000 to $299,999 | 16 (3.7%) | 0 (0.0%) |
| $300,000 to $499,999 | 103 (23.6%) | 0 (0.0%) |
| $500,000 to $749,999 | 137 (31.4%) | 156 (40.3%) |
| $750,000 to $999,999 | 73 (16.7%) | 77 (19.9%) |
| $1,000,000 or more | 99 (22.7%) | 135 (34.9%) |
| Total | 437 (100.0%) | 387 (100.0%) |
Household Income by Mortgage Status in Lido Beach
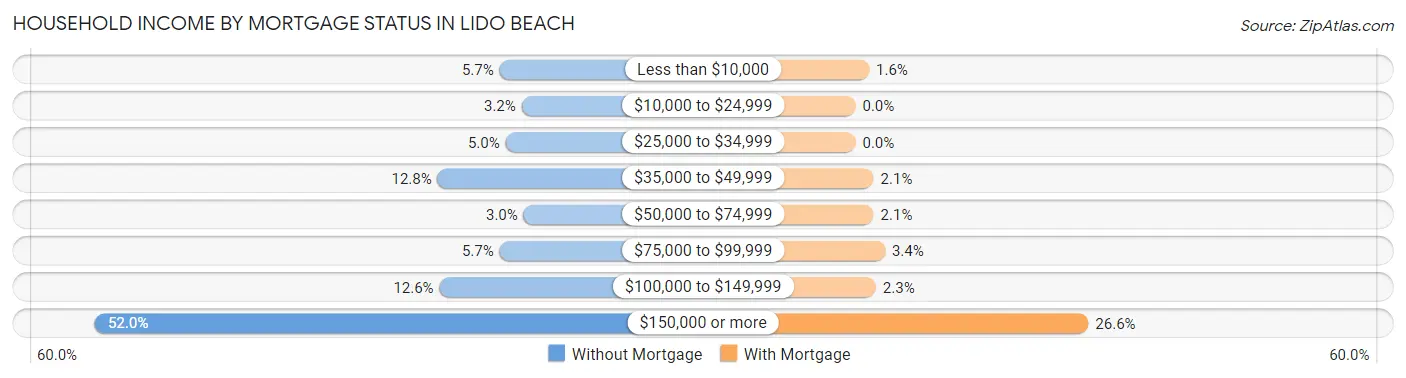
| Household Income | Without Mortgage | With Mortgage |
| Less than $10,000 | 25 (5.7%) | 6 (1.5%) |
| $10,000 to $24,999 | 14 (3.2%) | 0 (0.0%) |
| $25,000 to $34,999 | 22 (5.0%) | 0 (0.0%) |
| $35,000 to $49,999 | 56 (12.8%) | 8 (2.1%) |
| $50,000 to $74,999 | 13 (3.0%) | 8 (2.1%) |
| $75,000 to $99,999 | 25 (5.7%) | 13 (3.4%) |
| $100,000 to $149,999 | 55 (12.6%) | 9 (2.3%) |
| $150,000 or more | 227 (51.9%) | 103 (26.6%) |
| Total | 437 (100.0%) | 387 (100.0%) |
Property Value to Household Income Ratio in Lido Beach
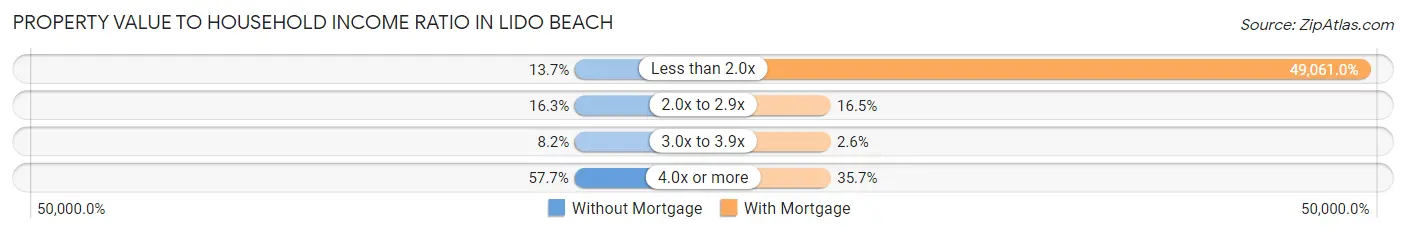
| Value-to-Income Ratio | Without Mortgage | With Mortgage |
| Less than 2.0x | 60 (13.7%) | 189,866 (49,061.0%) |
| 2.0x to 2.9x | 71 (16.3%) | 64 (16.5%) |
| 3.0x to 3.9x | 36 (8.2%) | 10 (2.6%) |
| 4.0x or more | 252 (57.7%) | 138 (35.7%) |
| Total | 437 (100.0%) | 387 (100.0%) |
Real Estate Taxes by Mortgage Status in Lido Beach
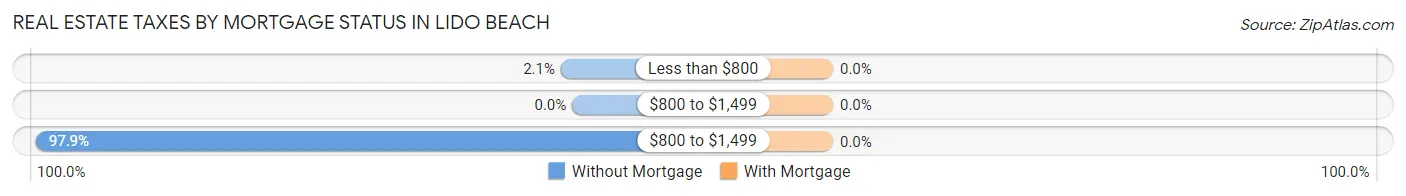
| Property Taxes | Without Mortgage | With Mortgage |
| Less than $800 | 9 (2.1%) | 0 (0.0%) |
| $800 to $1,499 | 0 (0.0%) | 0 (0.0%) |
| $800 to $1,499 | 428 (97.9%) | 0 (0.0%) |
| Total | 437 (100.0%) | 387 (100.0%) |
Health & Disability in Lido Beach
Health Insurance Coverage by Age in Lido Beach
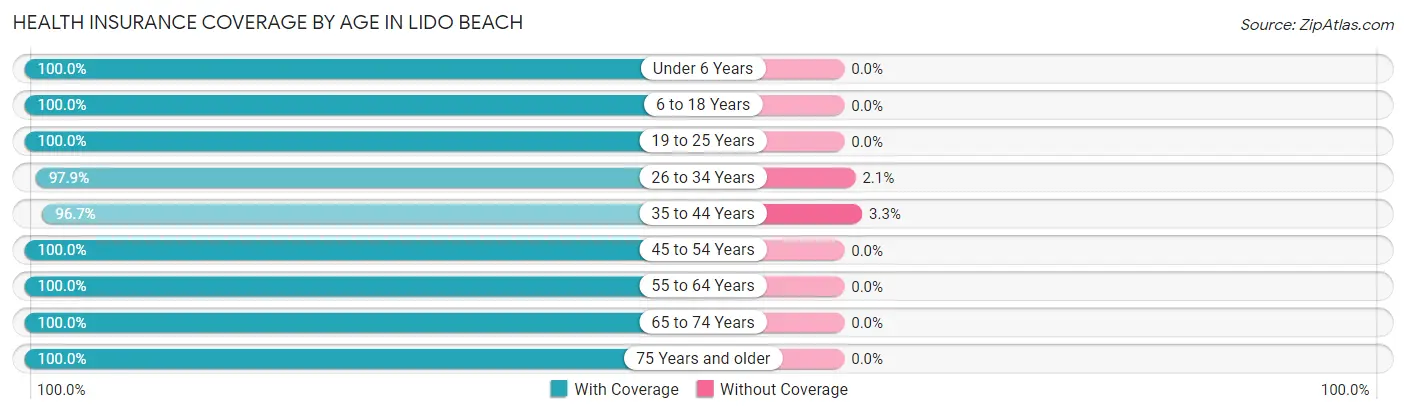
| Age Bracket | With Coverage | Without Coverage |
| Under 6 Years | 118 (100.0%) | 0 (0.0%) |
| 6 to 18 Years | 306 (100.0%) | 0 (0.0%) |
| 19 to 25 Years | 182 (100.0%) | 0 (0.0%) |
| 26 to 34 Years | 235 (97.9%) | 5 (2.1%) |
| 35 to 44 Years | 203 (96.7%) | 7 (3.3%) |
| 45 to 54 Years | 283 (100.0%) | 0 (0.0%) |
| 55 to 64 Years | 540 (100.0%) | 0 (0.0%) |
| 65 to 74 Years | 435 (100.0%) | 0 (0.0%) |
| 75 Years and older | 287 (100.0%) | 0 (0.0%) |
| Total | 2,589 (99.5%) | 12 (0.5%) |
Health Insurance Coverage by Citizenship Status in Lido Beach
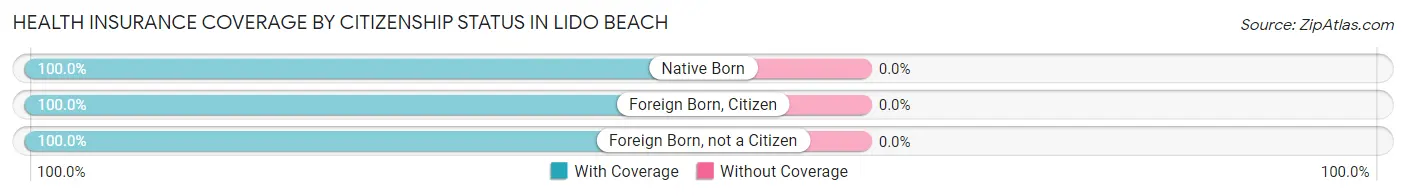
| Citizenship Status | With Coverage | Without Coverage |
| Native Born | 118 (100.0%) | 0 (0.0%) |
| Foreign Born, Citizen | 306 (100.0%) | 0 (0.0%) |
| Foreign Born, not a Citizen | 182 (100.0%) | 0 (0.0%) |
Health Insurance Coverage by Household Income in Lido Beach
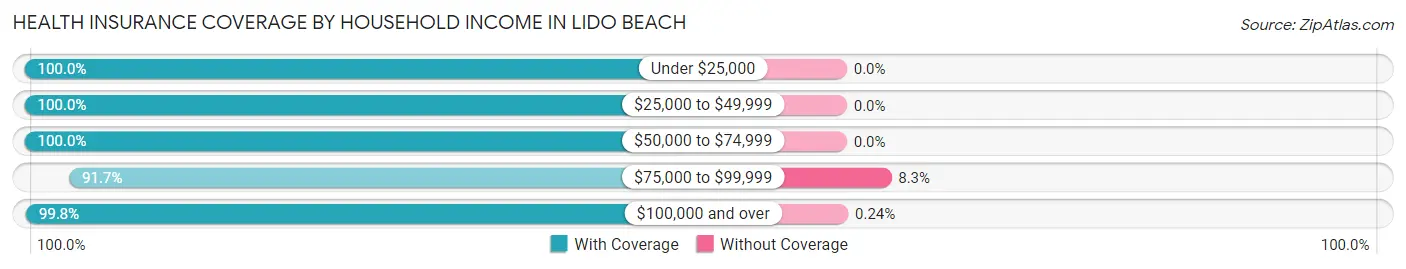
| Household Income | With Coverage | Without Coverage |
| Under $25,000 | 226 (100.0%) | 0 (0.0%) |
| $25,000 to $49,999 | 123 (100.0%) | 0 (0.0%) |
| $50,000 to $74,999 | 77 (100.0%) | 0 (0.0%) |
| $75,000 to $99,999 | 77 (91.7%) | 7 (8.3%) |
| $100,000 and over | 2,079 (99.8%) | 5 (0.2%) |
Public vs Private Health Insurance Coverage by Age in Lido Beach
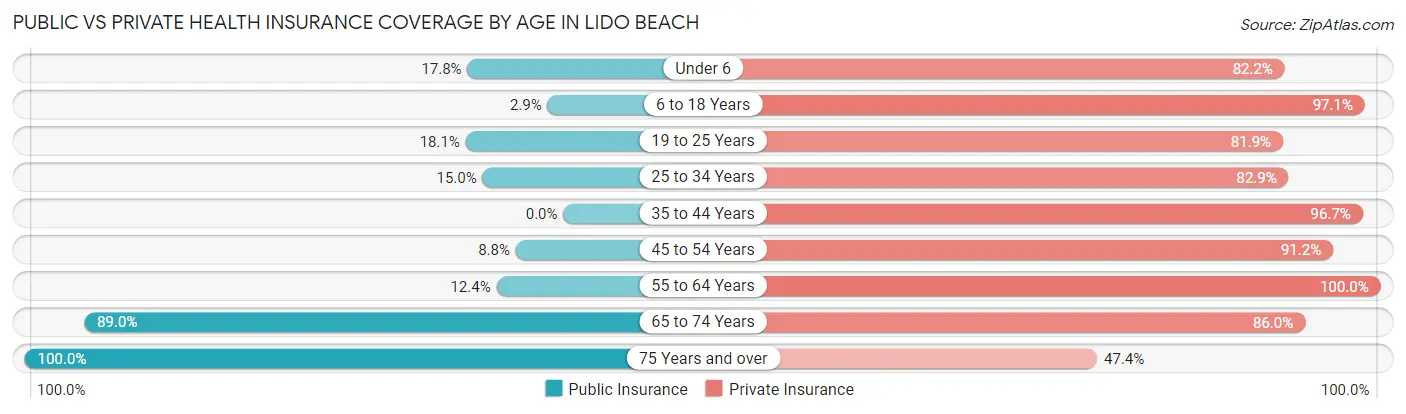
| Age Bracket | Public Insurance | Private Insurance |
| Under 6 | 21 (17.8%) | 97 (82.2%) |
| 6 to 18 Years | 9 (2.9%) | 297 (97.1%) |
| 19 to 25 Years | 33 (18.1%) | 149 (81.9%) |
| 25 to 34 Years | 36 (15.0%) | 199 (82.9%) |
| 35 to 44 Years | 0 (0.0%) | 203 (96.7%) |
| 45 to 54 Years | 25 (8.8%) | 258 (91.2%) |
| 55 to 64 Years | 67 (12.4%) | 540 (100.0%) |
| 65 to 74 Years | 387 (89.0%) | 374 (86.0%) |
| 75 Years and over | 287 (100.0%) | 136 (47.4%) |
| Total | 865 (33.3%) | 2,253 (86.6%) |
Disability Status by Sex by Age in Lido Beach
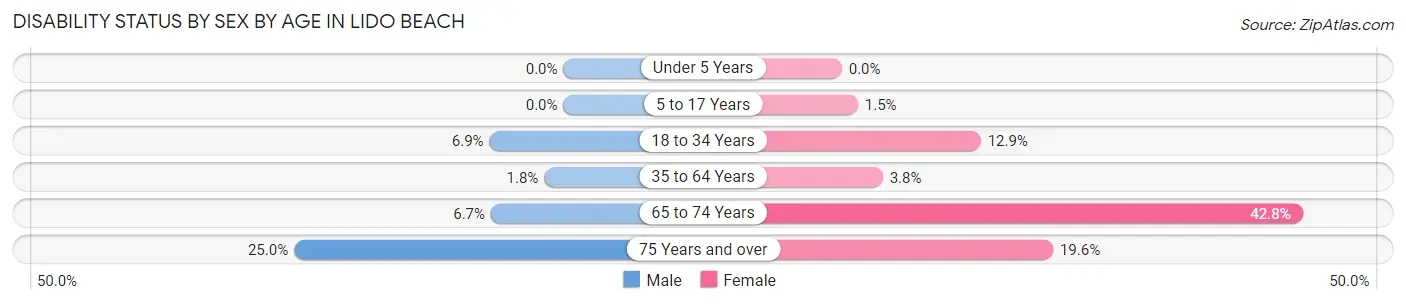
| Age Bracket | Male | Female |
| Under 5 Years | 0 (0.0%) | 0 (0.0%) |
| 5 to 17 Years | 0 (0.0%) | 2 (1.5%) |
| 18 to 34 Years | 14 (6.9%) | 33 (12.9%) |
| 35 to 64 Years | 9 (1.8%) | 20 (3.8%) |
| 65 to 74 Years | 20 (6.7%) | 59 (42.7%) |
| 75 Years and over | 22 (25.0%) | 39 (19.6%) |
Disability Class by Sex by Age in Lido Beach
Disability Class: Hearing Difficulty
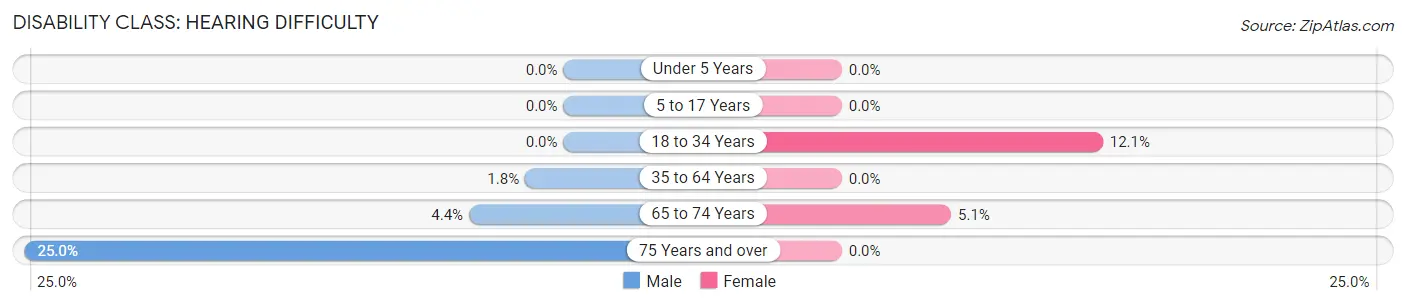
| Age Bracket | Male | Female |
| Under 5 Years | 0 (0.0%) | 0 (0.0%) |
| 5 to 17 Years | 0 (0.0%) | 0 (0.0%) |
| 18 to 34 Years | 0 (0.0%) | 31 (12.1%) |
| 35 to 64 Years | 9 (1.8%) | 0 (0.0%) |
| 65 to 74 Years | 13 (4.4%) | 7 (5.1%) |
| 75 Years and over | 22 (25.0%) | 0 (0.0%) |
Disability Class: Vision Difficulty
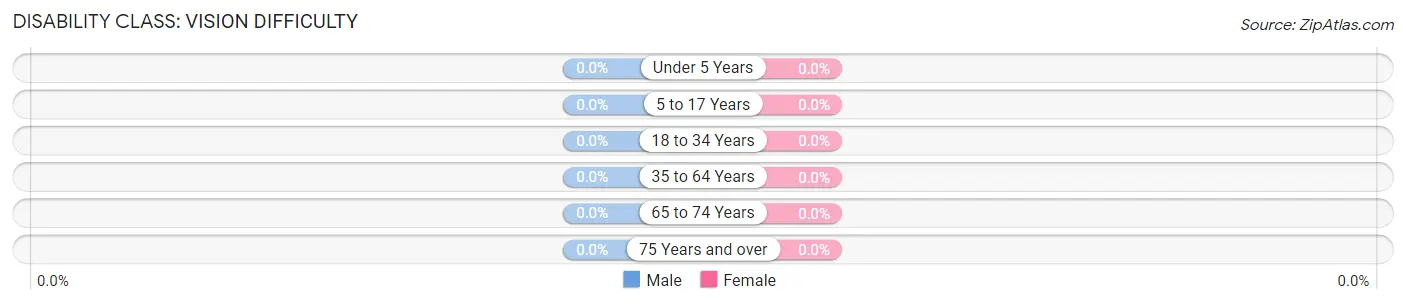
| Age Bracket | Male | Female |
| Under 5 Years | 0 (0.0%) | 0 (0.0%) |
| 5 to 17 Years | 0 (0.0%) | 0 (0.0%) |
| 18 to 34 Years | 0 (0.0%) | 0 (0.0%) |
| 35 to 64 Years | 0 (0.0%) | 0 (0.0%) |
| 65 to 74 Years | 0 (0.0%) | 0 (0.0%) |
| 75 Years and over | 0 (0.0%) | 0 (0.0%) |
Disability Class: Cognitive Difficulty
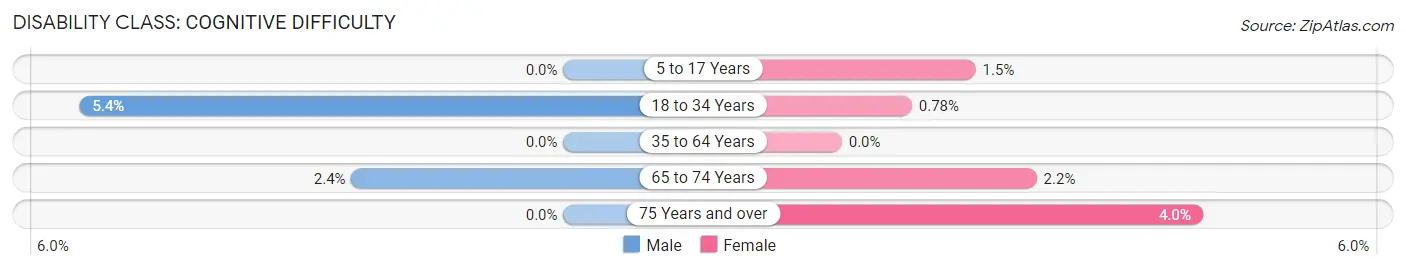
| Age Bracket | Male | Female |
| 5 to 17 Years | 0 (0.0%) | 2 (1.5%) |
| 18 to 34 Years | 11 (5.4%) | 2 (0.8%) |
| 35 to 64 Years | 0 (0.0%) | 0 (0.0%) |
| 65 to 74 Years | 7 (2.4%) | 3 (2.2%) |
| 75 Years and over | 0 (0.0%) | 8 (4.0%) |
Disability Class: Ambulatory Difficulty
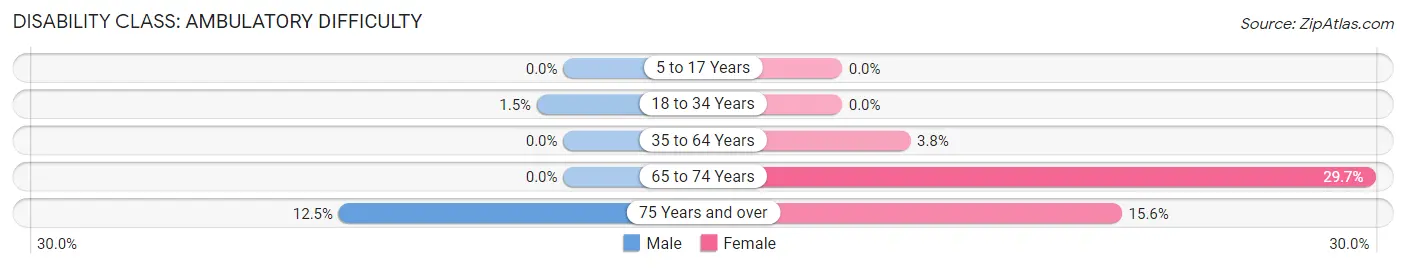
| Age Bracket | Male | Female |
| 5 to 17 Years | 0 (0.0%) | 0 (0.0%) |
| 18 to 34 Years | 3 (1.5%) | 0 (0.0%) |
| 35 to 64 Years | 0 (0.0%) | 20 (3.8%) |
| 65 to 74 Years | 0 (0.0%) | 41 (29.7%) |
| 75 Years and over | 11 (12.5%) | 31 (15.6%) |
Disability Class: Self-Care Difficulty
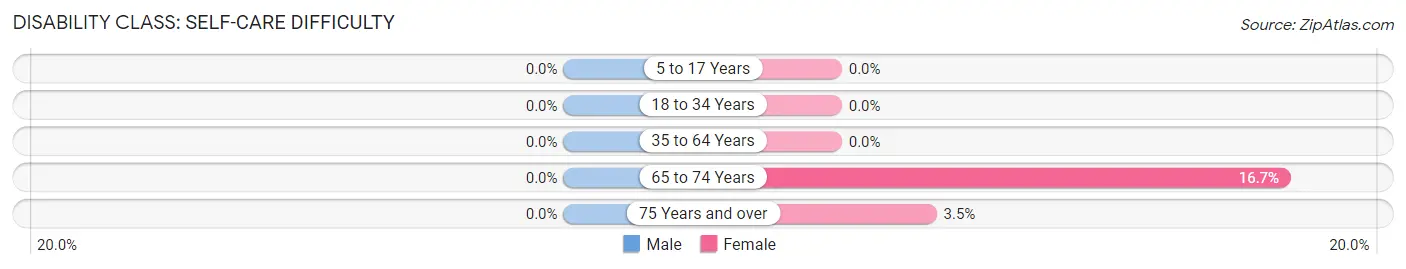
| Age Bracket | Male | Female |
| 5 to 17 Years | 0 (0.0%) | 0 (0.0%) |
| 18 to 34 Years | 0 (0.0%) | 0 (0.0%) |
| 35 to 64 Years | 0 (0.0%) | 0 (0.0%) |
| 65 to 74 Years | 0 (0.0%) | 23 (16.7%) |
| 75 Years and over | 0 (0.0%) | 7 (3.5%) |
Technology Access in Lido Beach
Computing Device Access in Lido Beach
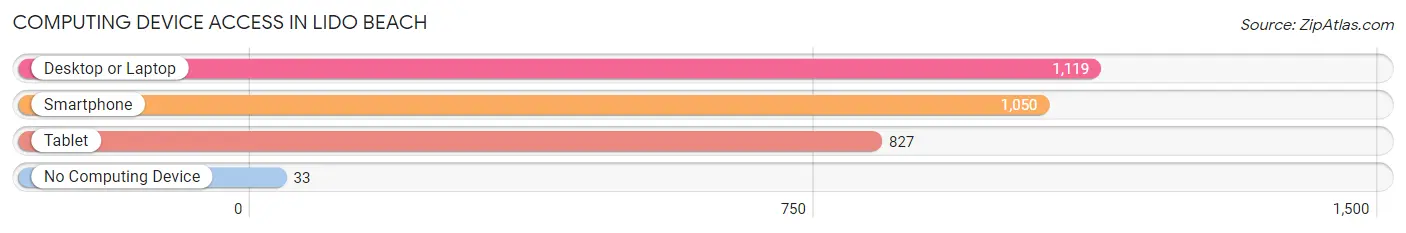
| Device Type | # Households | % Households |
| Desktop or Laptop | 1,119 | 94.7% |
| Smartphone | 1,050 | 88.8% |
| Tablet | 827 | 70.0% |
| No Computing Device | 33 | 2.8% |
| Total | 1,182 | 100.0% |
Internet Access in Lido Beach
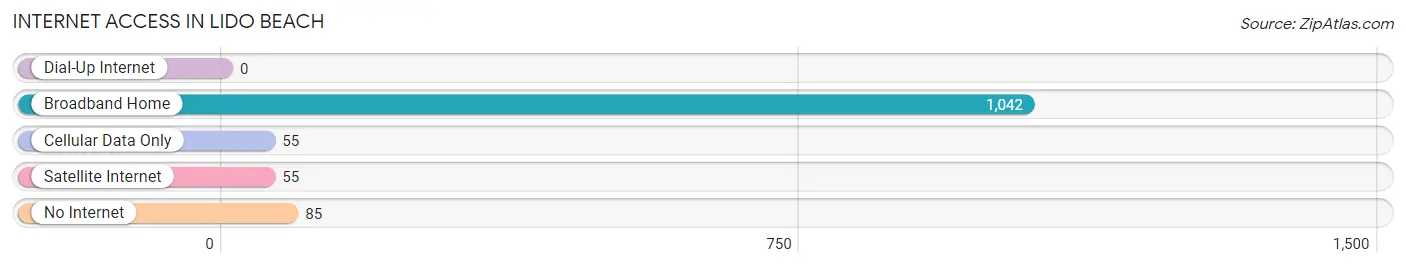
| Internet Type | # Households | % Households |
| Dial-Up Internet | 0 | 0.0% |
| Broadband Home | 1,042 | 88.2% |
| Cellular Data Only | 55 | 4.6% |
| Satellite Internet | 55 | 4.6% |
| No Internet | 85 | 7.2% |
| Total | 1,182 | 100.0% |
Lido Beach Summary
Lido Beach is a hamlet located in the Town of Hempstead in Nassau County, New York. It is situated on the south shore of Long Island, approximately 25 miles east of Manhattan. The hamlet is bordered by Point Lookout to the east, Long Beach to the south, and Atlantic Beach to the west.
History
Lido Beach was originally part of the Town of Hempstead, which was established in 1644. The area was first settled by Europeans in the late 17th century, and the first recorded land purchase in the area was in 1703. The area was known as “Lido” by the mid-19th century, and the name was officially adopted in 1883.
In the early 20th century, Lido Beach was a popular summer destination for New Yorkers. The area was home to several large hotels, including the Lido Beach Hotel, which opened in 1907. The hotel was a popular destination for celebrities, including the Marx Brothers, who performed at the hotel in the 1920s.
In the 1950s, the area began to decline as a tourist destination, and the hotel was eventually demolished in the 1970s. In the late 20th century, the area began to experience a resurgence as a residential community.
Geography
Lido Beach is located on the south shore of Long Island, approximately 25 miles east of Manhattan. The hamlet is bordered by Point Lookout to the east, Long Beach to the south, and Atlantic Beach to the west. The area is characterized by its sandy beaches and rolling dunes.
The area is home to several parks, including Lido Beach State Park, which offers swimming, fishing, and other recreational activities. The park is also home to a nature preserve, which is home to a variety of wildlife, including ospreys, herons, and egrets.
Economy
Lido Beach is primarily a residential community, and the local economy is largely driven by tourism. The area is home to several hotels and resorts, as well as restaurants, bars, and other businesses catering to tourists.
The area is also home to several marinas, which offer boat rentals and other services. The local economy is also supported by the fishing industry, which is centered around the nearby Jones Inlet.
Demographics
As of the 2010 census, the population of Lido Beach was 4,619. The population is primarily white (90.2%), with smaller percentages of African American (3.3%), Asian (2.7%), and Hispanic (2.2%) residents. The median household income is $77,917, and the median home value is $619,000.
Conclusion
Lido Beach is a hamlet located in the Town of Hempstead in Nassau County, New York. It is situated on the south shore of Long Island, approximately 25 miles east of Manhattan. The area is characterized by its sandy beaches and rolling dunes, and is a popular destination for tourists and residents alike. The local economy is largely driven by tourism, and the area is home to several hotels, restaurants, and other businesses catering to tourists. The population of Lido Beach is primarily white, with smaller percentages of African American, Asian, and Hispanic residents. The median household income is $77,917, and the median home value is $619,000.
Common Questions
What is Per Capita Income in Lido Beach?
Per Capita income in Lido Beach is $87,967.
What is the Median Family Income in Lido Beach?
Median Family Income in Lido Beach is $197,321.
What is the Median Household income in Lido Beach?
Median Household Income in Lido Beach is $172,857.
What is Income or Wage Gap in Lido Beach?
Income or Wage Gap in Lido Beach is 66.8%.
Women in Lido Beach earn 33.2 cents for every dollar earned by a man.
What is Family Income Deficit in Lido Beach?
Family Income Deficit in Lido Beach is $14,495.
Families that are below poverty line in Lido Beach earn $14,495 less on average than the poverty threshold level.
What is Inequality or Gini Index in Lido Beach?
Inequality or Gini Index in Lido Beach is 0.41.
What is the Total Population of Lido Beach?
Total Population of Lido Beach is 2,615.
What is the Total Male Population of Lido Beach?
Total Male Population of Lido Beach is 1,362.
What is the Total Female Population of Lido Beach?
Total Female Population of Lido Beach is 1,253.
What is the Ratio of Males per 100 Females in Lido Beach?
There are 108.70 Males per 100 Females in Lido Beach.
What is the Ratio of Females per 100 Males in Lido Beach?
There are 92.00 Females per 100 Males in Lido Beach.
What is the Median Population Age in Lido Beach?
Median Population Age in Lido Beach is 53.1 Years.
What is the Average Family Size in Lido Beach
Average Family Size in Lido Beach is 2.8 People.
What is the Average Household Size in Lido Beach
Average Household Size in Lido Beach is 2.2 People.
How Large is the Labor Force in Lido Beach?
There are 1,385 People in the Labor Forcein in Lido Beach.
What is the Percentage of People in the Labor Force in Lido Beach?
61.9% of People are in the Labor Force in Lido Beach.
What is the Unemployment Rate in Lido Beach?
Unemployment Rate in Lido Beach is 5.3%.