Washington Mills, NY Map & Demographics
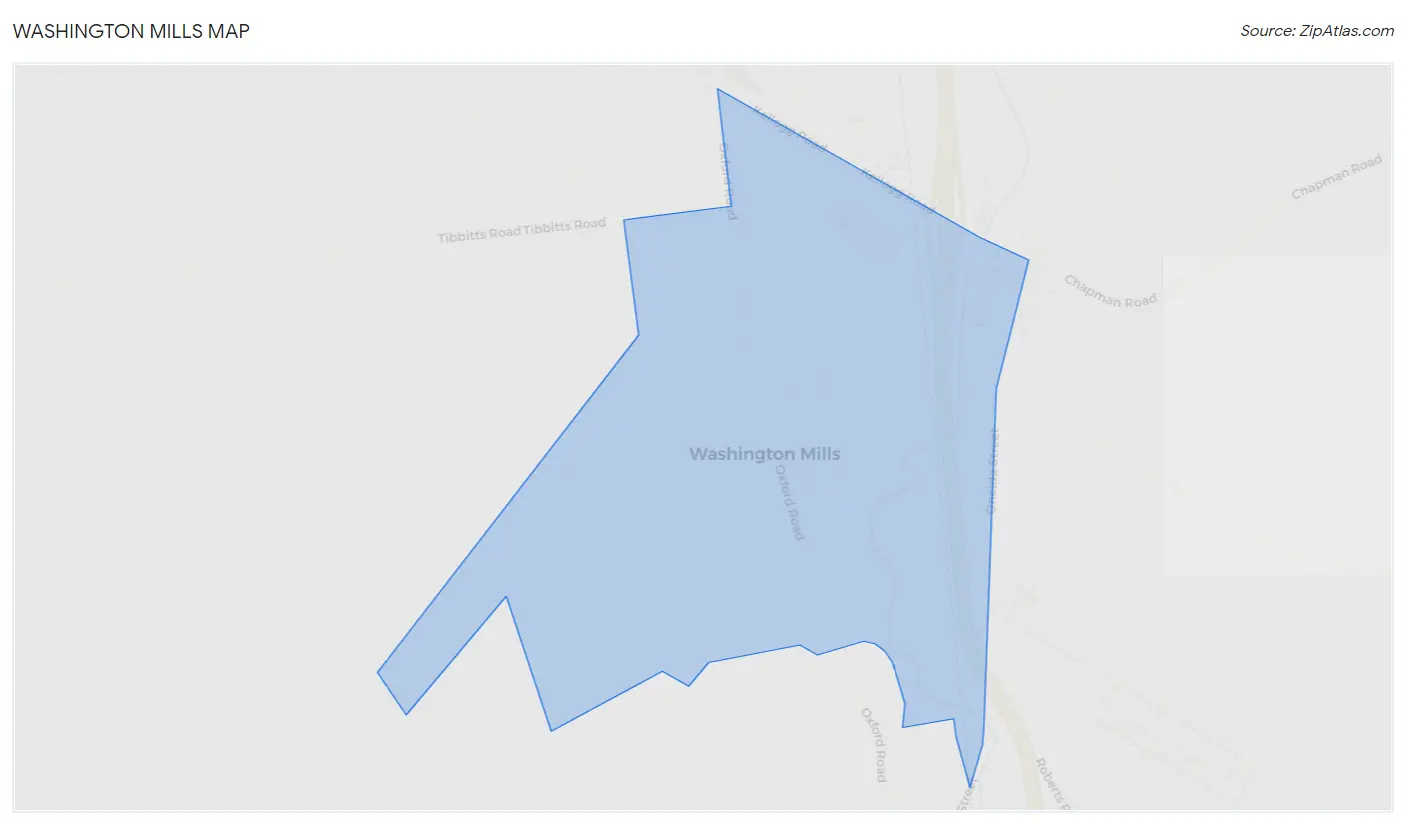
Washington Mills Map
Washington Mills Overview
$44,926
PER CAPITA INCOME
$130,349
AVG FAMILY INCOME
$110,658
AVG HOUSEHOLD INCOME
60.0%
WAGE / INCOME GAP [ % ]
40.0¢/ $1
WAGE / INCOME GAP [ $ ]
0.42
INEQUALITY / GINI INDEX
1,910
TOTAL POPULATION
919
MALE POPULATION
991
FEMALE POPULATION
92.73
MALES / 100 FEMALES
107.83
FEMALES / 100 MALES
41.5
MEDIAN AGE
2.5
AVG FAMILY SIZE
2.1
AVG HOUSEHOLD SIZE
1,288
LABOR FORCE [ PEOPLE ]
82.8%
PERCENT IN LABOR FORCE
1.1%
UNEMPLOYMENT RATE
Washington Mills Area Codes
Income in Washington Mills
Income Overview in Washington Mills
Per Capita Income in Washington Mills is $44,926, while median incomes of families and households are $130,349 and $110,658 respectively.
| Characteristic | Number | Measure |
| Per Capita Income | 1,910 | $44,926 |
| Median Family Income | 663 | $130,349 |
| Mean Family Income | 663 | $137,708 |
| Median Household Income | 888 | $110,658 |
| Mean Household Income | 888 | $112,541 |
| Income Deficit | 663 | $0 |
| Wage / Income Gap (%) | 1,910 | 60.02% |
| Wage / Income Gap ($) | 1,910 | 39.98¢ per $1 |
| Gini / Inequality Index | 1,910 | 0.42 |
Earnings by Sex in Washington Mills
Average Earnings in Washington Mills are $53,265, $74,750 for men and $29,886 for women, a difference of 60.0%.
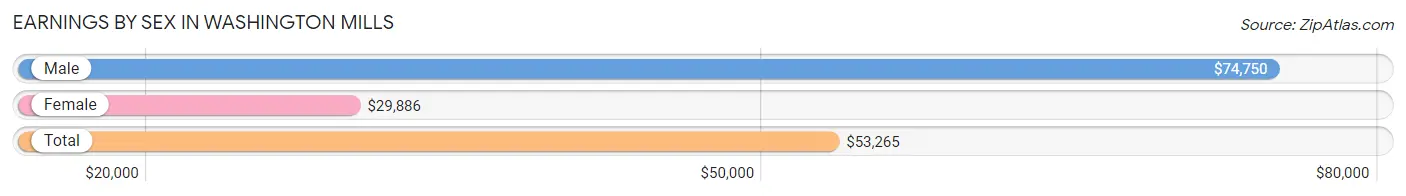
| Sex | Number | Average Earnings |
| Male | 618 (46.7%) | $74,750 |
| Female | 705 (53.3%) | $29,886 |
| Total | 1,323 (100.0%) | $53,265 |
Earnings by Sex by Income Bracket in Washington Mills
The most common earnings brackets in Washington Mills are $100,000+ for men (252 | 40.8%) and $75,000 to $99,999 for women (149 | 21.1%).
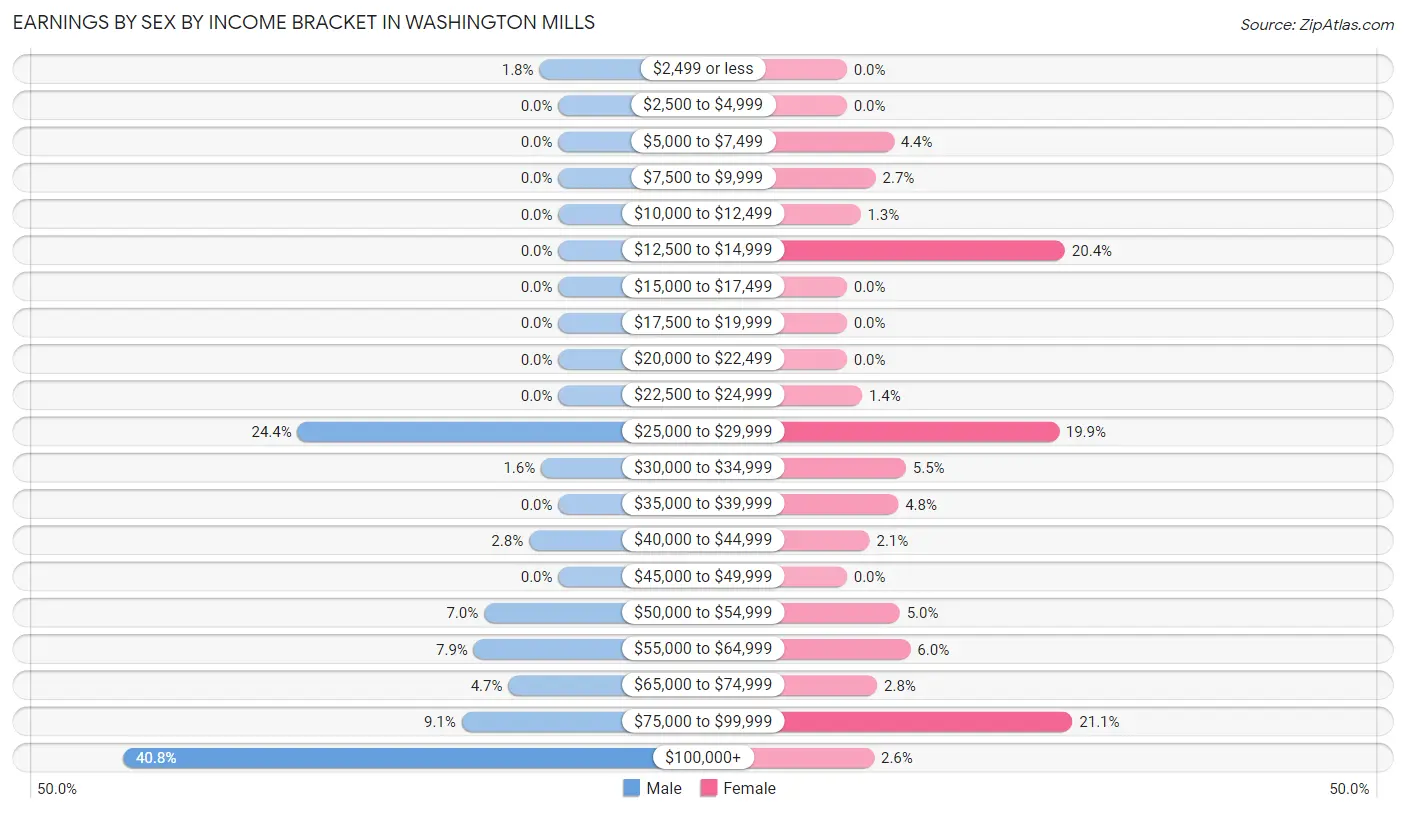
| Income | Male | Female |
| $2,499 or less | 11 (1.8%) | 0 (0.0%) |
| $2,500 to $4,999 | 0 (0.0%) | 0 (0.0%) |
| $5,000 to $7,499 | 0 (0.0%) | 31 (4.4%) |
| $7,500 to $9,999 | 0 (0.0%) | 19 (2.7%) |
| $10,000 to $12,499 | 0 (0.0%) | 9 (1.3%) |
| $12,500 to $14,999 | 0 (0.0%) | 144 (20.4%) |
| $15,000 to $17,499 | 0 (0.0%) | 0 (0.0%) |
| $17,500 to $19,999 | 0 (0.0%) | 0 (0.0%) |
| $20,000 to $22,499 | 0 (0.0%) | 0 (0.0%) |
| $22,500 to $24,999 | 0 (0.0%) | 10 (1.4%) |
| $25,000 to $29,999 | 151 (24.4%) | 140 (19.9%) |
| $30,000 to $34,999 | 10 (1.6%) | 39 (5.5%) |
| $35,000 to $39,999 | 0 (0.0%) | 34 (4.8%) |
| $40,000 to $44,999 | 17 (2.8%) | 15 (2.1%) |
| $45,000 to $49,999 | 0 (0.0%) | 0 (0.0%) |
| $50,000 to $54,999 | 43 (7.0%) | 35 (5.0%) |
| $55,000 to $64,999 | 49 (7.9%) | 42 (6.0%) |
| $65,000 to $74,999 | 29 (4.7%) | 20 (2.8%) |
| $75,000 to $99,999 | 56 (9.1%) | 149 (21.1%) |
| $100,000+ | 252 (40.8%) | 18 (2.5%) |
| Total | 618 (100.0%) | 705 (100.0%) |
Earnings by Sex by Educational Attainment in Washington Mills
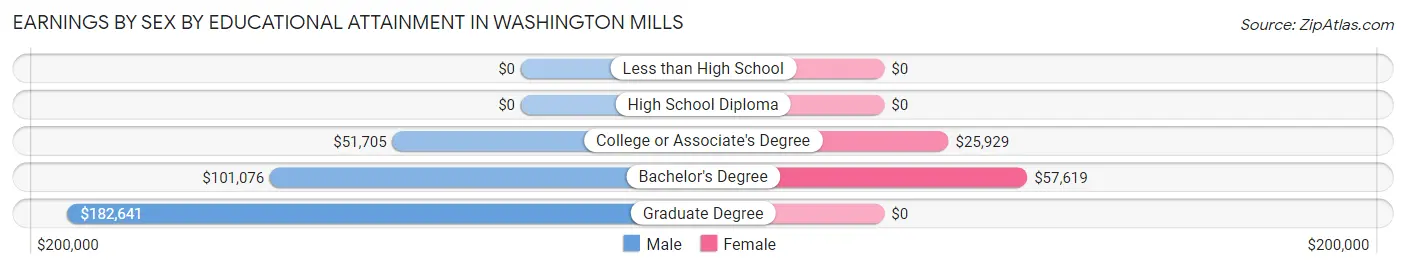
| Educational Attainment | Male Income | Female Income |
| Less than High School | - | - |
| High School Diploma | - | - |
| College or Associate's Degree | $51,705 | $25,929 |
| Bachelor's Degree | $101,076 | $57,619 |
| Graduate Degree | $182,641 | $0 |
| Total | $80,703 | $0 |
Family Income in Washington Mills
Family Income Brackets in Washington Mills
According to the Washington Mills family income data, there are 268 families falling into the $100,000 to $149,999 income range, which is the most common income bracket and makes up 40.4% of all families.
| Income Bracket | # Families | % Families |
| Less than $10,000 | 0 | 0.0% |
| $10,000 to $14,999 | 0 | 0.0% |
| $15,000 to $24,999 | 0 | 0.0% |
| $25,000 to $34,999 | 0 | 0.0% |
| $35,000 to $49,999 | 144 | 21.7% |
| $50,000 to $74,999 | 36 | 5.4% |
| $75,000 to $99,999 | 37 | 5.6% |
| $100,000 to $149,999 | 268 | 40.4% |
| $150,000 to $199,999 | 27 | 4.1% |
| $200,000+ | 151 | 22.8% |
Family Income by Famaliy Size in Washington Mills
3-person families (50 | 7.5%) account for the highest median family income in Washington Mills with $148,667 per family, while 2-person families (416 | 62.7%) have the highest median income of $53,304 per family member.
| Income Bracket | # Families | Median Income |
| 2-Person Families | 416 (62.7%) | $106,607 |
| 3-Person Families | 50 (7.5%) | $148,667 |
| 4-Person Families | 197 (29.7%) | $131,234 |
| 5-Person Families | 0 (0.0%) | $0 |
| 6-Person Families | 0 (0.0%) | $0 |
| 7+ Person Families | 0 (0.0%) | $0 |
| Total | 663 (100.0%) | $130,349 |
Family Income by Number of Earners in Washington Mills
| Number of Earners | # Families | Median Income |
| No Earners | 26 (3.9%) | $0 |
| 1 Earner | 51 (7.7%) | $106,339 |
| 2 Earners | 552 (83.3%) | $130,683 |
| 3+ Earners | 34 (5.1%) | $182,500 |
| Total | 663 (100.0%) | $130,349 |
Household Income in Washington Mills
Household Income Brackets in Washington Mills
With 285 households falling in the category, the $100,000 to $149,999 income range is the most frequent in Washington Mills, accounting for 32.1% of all households.
| Income Bracket | # Households | % Households |
| Less than $10,000 | 68 | 7.7% |
| $10,000 to $14,999 | 0 | 0.0% |
| $15,000 to $24,999 | 19 | 2.1% |
| $25,000 to $34,999 | 18 | 2.0% |
| $35,000 to $49,999 | 178 | 20.0% |
| $50,000 to $74,999 | 105 | 11.8% |
| $75,000 to $99,999 | 37 | 4.2% |
| $100,000 to $149,999 | 285 | 32.1% |
| $150,000 to $199,999 | 27 | 3.0% |
| $200,000+ | 151 | 17.0% |
Household Income by Householder Age in Washington Mills
The median household income in Washington Mills is $110,658, with the highest median household income of $131,530 found in the 25 to 44 years age bracket for the primary householder. A total of 423 households (47.6%) fall into this category. Meanwhile, the 15 to 24 years age bracket for the primary householder has the lowest median household income of $0, with 30 households (3.4%) in this group.
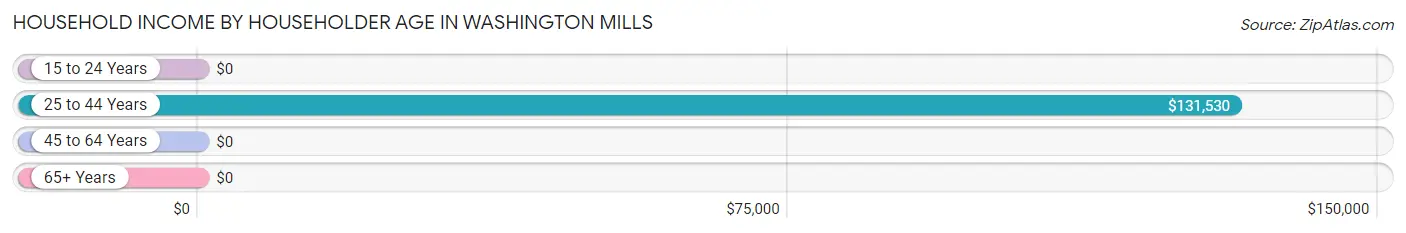
| Income Bracket | # Households | Median Income |
| 15 to 24 Years | 30 (3.4%) | $0 |
| 25 to 44 Years | 423 (47.6%) | $131,530 |
| 45 to 64 Years | 336 (37.8%) | $0 |
| 65+ Years | 99 (11.2%) | $0 |
| Total | 888 (100.0%) | $110,658 |
Poverty in Washington Mills
Income Below Poverty by Sex and Age in Washington Mills
With 3.8% poverty level for males and 5.3% for females among the residents of Washington Mills, 75 year old and over males and 65 to 74 year old females are the most vulnerable to poverty, with 15 males (25.0%) and 2 females (50.0%) in their respective age groups living below the poverty level.
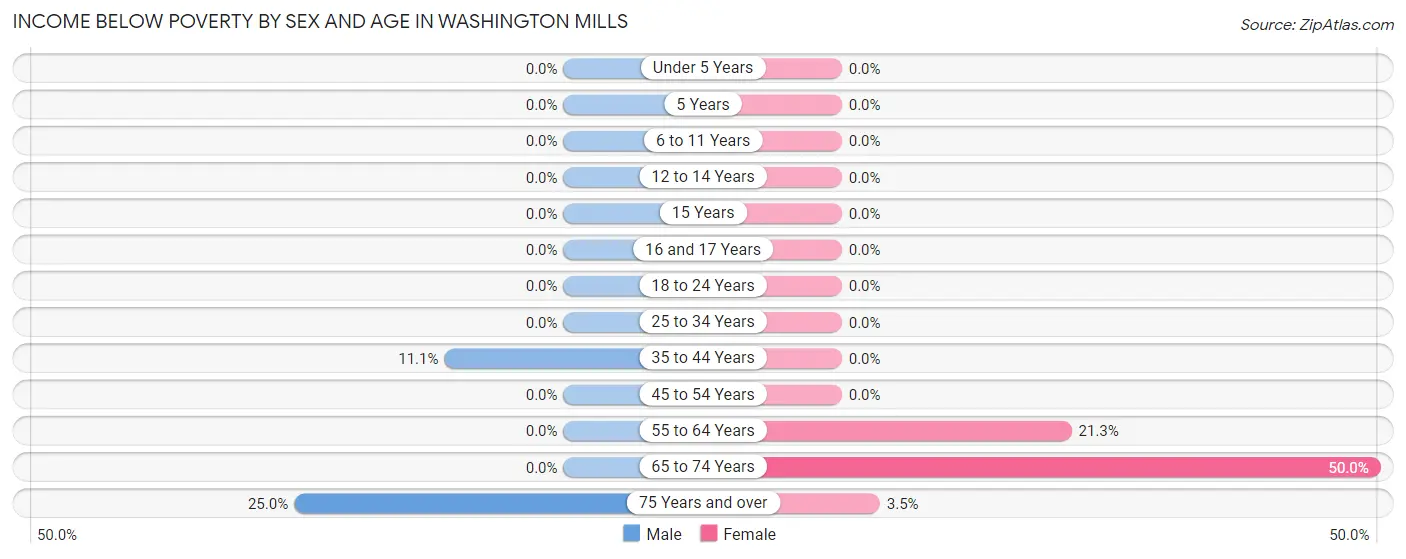
| Age Bracket | Male | Female |
| Under 5 Years | 0 (0.0%) | 0 (0.0%) |
| 5 Years | 0 (0.0%) | 0 (0.0%) |
| 6 to 11 Years | 0 (0.0%) | 0 (0.0%) |
| 12 to 14 Years | 0 (0.0%) | 0 (0.0%) |
| 15 Years | 0 (0.0%) | 0 (0.0%) |
| 16 and 17 Years | 0 (0.0%) | 0 (0.0%) |
| 18 to 24 Years | 0 (0.0%) | 0 (0.0%) |
| 25 to 34 Years | 0 (0.0%) | 0 (0.0%) |
| 35 to 44 Years | 20 (11.1%) | 0 (0.0%) |
| 45 to 54 Years | 0 (0.0%) | 0 (0.0%) |
| 55 to 64 Years | 0 (0.0%) | 48 (21.3%) |
| 65 to 74 Years | 0 (0.0%) | 2 (50.0%) |
| 75 Years and over | 15 (25.0%) | 3 (3.5%) |
| Total | 35 (3.8%) | 53 (5.3%) |
Income Above Poverty by Sex and Age in Washington Mills
According to the poverty statistics in Washington Mills, males aged 6 to 11 years and females aged under 5 years are the age groups that are most secure financially, with 100.0% of males and 100.0% of females in these age groups living above the poverty line.
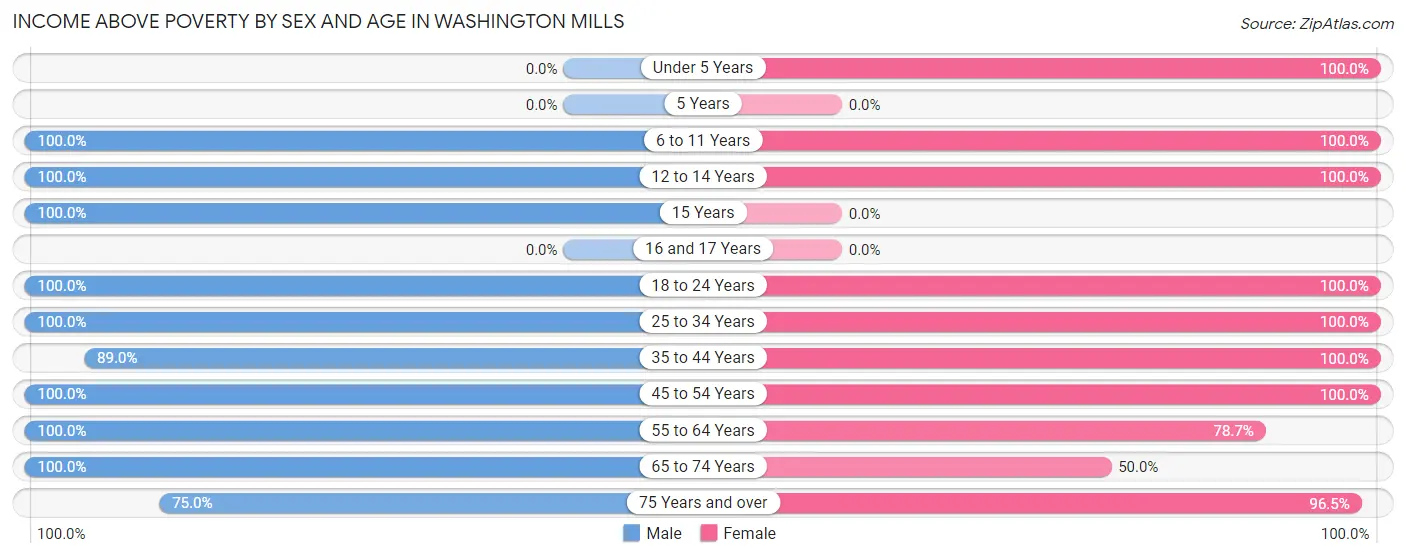
| Age Bracket | Male | Female |
| Under 5 Years | 0 (0.0%) | 16 (100.0%) |
| 5 Years | 0 (0.0%) | 0 (0.0%) |
| 6 to 11 Years | 53 (100.0%) | 107 (100.0%) |
| 12 to 14 Years | 144 (100.0%) | 18 (100.0%) |
| 15 Years | 17 (100.0%) | 0 (0.0%) |
| 16 and 17 Years | 0 (0.0%) | 0 (0.0%) |
| 18 to 24 Years | 49 (100.0%) | 83 (100.0%) |
| 25 to 34 Years | 144 (100.0%) | 211 (100.0%) |
| 35 to 44 Years | 161 (88.9%) | 167 (100.0%) |
| 45 to 54 Years | 66 (100.0%) | 75 (100.0%) |
| 55 to 64 Years | 183 (100.0%) | 177 (78.7%) |
| 65 to 74 Years | 22 (100.0%) | 2 (50.0%) |
| 75 Years and over | 45 (75.0%) | 82 (96.5%) |
| Total | 884 (96.2%) | 938 (94.7%) |
Income Below Poverty Among Married-Couple Families in Washington Mills
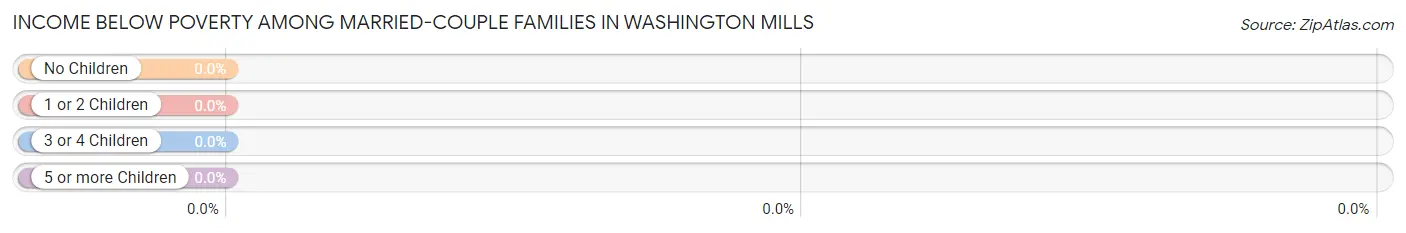
| Children | Above Poverty | Below Poverty |
| No Children | 465 (100.0%) | 0 (0.0%) |
| 1 or 2 Children | 180 (100.0%) | 0 (0.0%) |
| 3 or 4 Children | 0 (0.0%) | 0 (0.0%) |
| 5 or more Children | 0 (0.0%) | 0 (0.0%) |
| Total | 645 (100.0%) | 0 (0.0%) |
Income Below Poverty Among Single-Parent Households in Washington Mills
| Children | Single Father | Single Mother |
| No Children | 0 (0.0%) | 0 (0.0%) |
| 1 or 2 Children | 0 (0.0%) | 0 (0.0%) |
| 3 or 4 Children | 0 (0.0%) | 0 (0.0%) |
| 5 or more Children | 0 (0.0%) | 0 (0.0%) |
| Total | 0 (0.0%) | 0 (0.0%) |
Income Below Poverty Among Married-Couple vs Single-Parent Households in Washington Mills
| Children | Married-Couple Families | Single-Parent Households |
| No Children | 0 (0.0%) | 0 (0.0%) |
| 1 or 2 Children | 0 (0.0%) | 0 (0.0%) |
| 3 or 4 Children | 0 (0.0%) | 0 (0.0%) |
| 5 or more Children | 0 (0.0%) | 0 (0.0%) |
| Total | 0 (0.0%) | 0 (0.0%) |
Race in Washington Mills
The most populous races in Washington Mills are White / Caucasian (1,676 | 87.7%), Asian (213 | 11.2%), and Hispanic or Latino (81 | 4.2%).
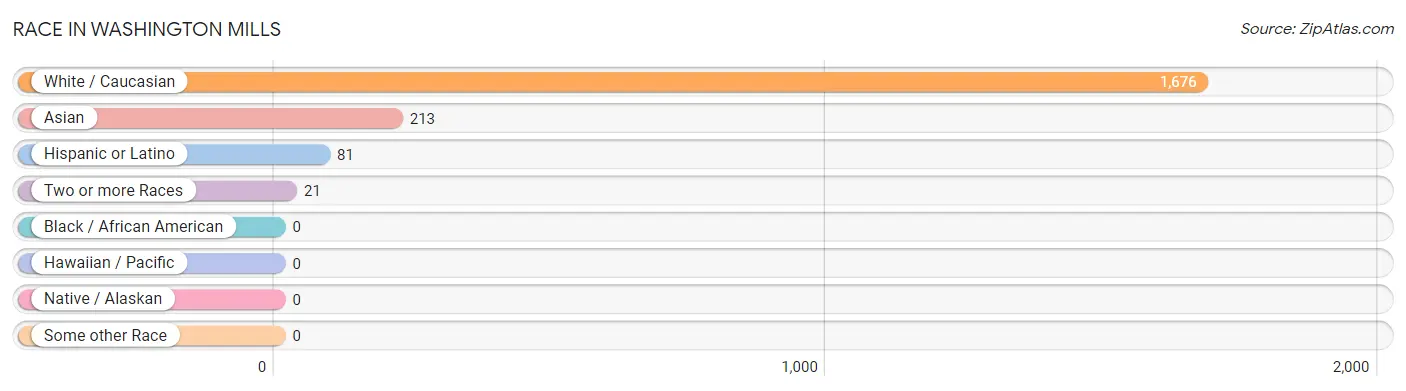
| Race | # Population | % Population |
| Asian | 213 | 11.2% |
| Black / African American | 0 | 0.0% |
| Hawaiian / Pacific | 0 | 0.0% |
| Hispanic or Latino | 81 | 4.2% |
| Native / Alaskan | 0 | 0.0% |
| White / Caucasian | 1,676 | 87.7% |
| Two or more Races | 21 | 1.1% |
| Some other Race | 0 | 0.0% |
| Total | 1,910 | 100.0% |
Ancestry in Washington Mills
The most populous ancestries reported in Washington Mills are Italian (911 | 47.7%), Irish (363 | 19.0%), German (241 | 12.6%), English (138 | 7.2%), and Polish (135 | 7.1%), together accounting for 93.6% of all Washington Mills residents.
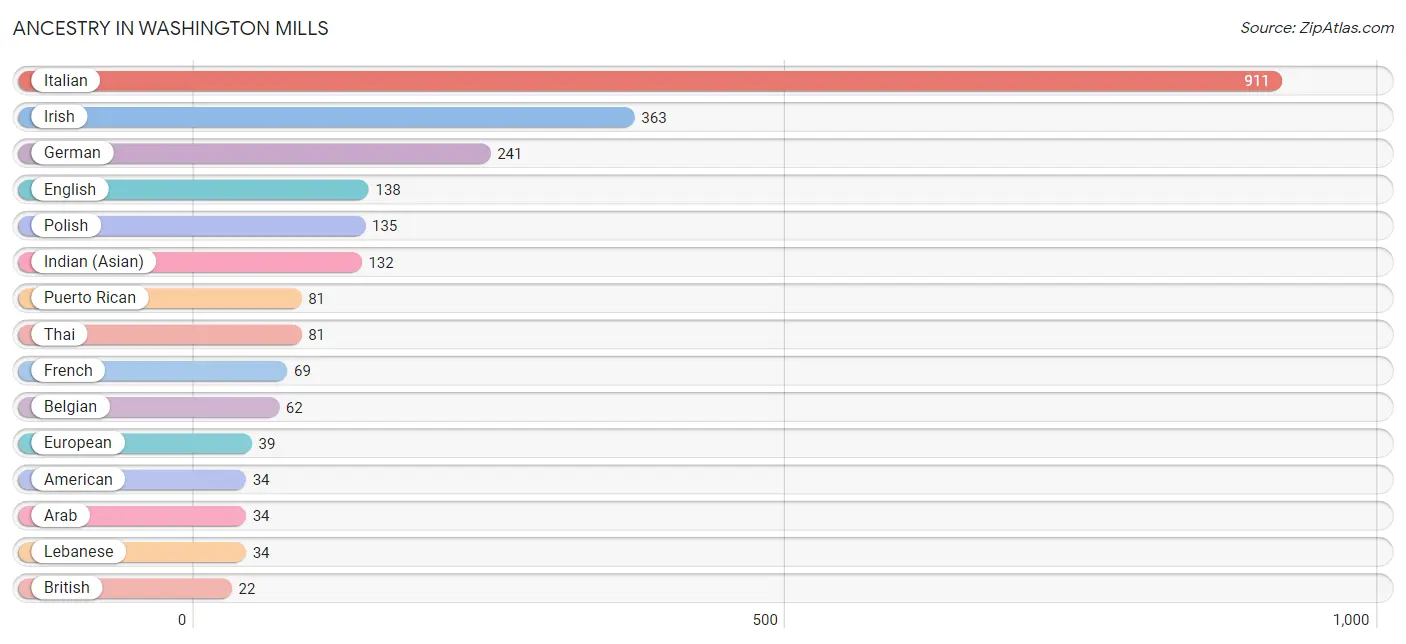
| Ancestry | # Population | % Population |
| American | 34 | 1.8% |
| Arab | 34 | 1.8% |
| Armenian | 19 | 1.0% |
| Belgian | 62 | 3.3% |
| British | 22 | 1.1% |
| Cherokee | 11 | 0.6% |
| Czech | 16 | 0.8% |
| English | 138 | 7.2% |
| European | 39 | 2.0% |
| French | 69 | 3.6% |
| German | 241 | 12.6% |
| Indian (Asian) | 132 | 6.9% |
| Irish | 363 | 19.0% |
| Italian | 911 | 47.7% |
| Lebanese | 34 | 1.8% |
| Polish | 135 | 7.1% |
| Puerto Rican | 81 | 4.2% |
| Scandinavian | 22 | 1.1% |
| Scotch-Irish | 10 | 0.5% |
| Thai | 81 | 4.2% | View All 20 Rows |
Immigrants in Washington Mills
The most numerous immigrant groups reported in Washington Mills came from Europe (213 | 11.2%), Italy (151 | 7.9%), Southern Europe (151 | 7.9%), Asia (77 | 4.0%), and Belgium (62 | 3.3%), together accounting for 34.3% of all Washington Mills residents.
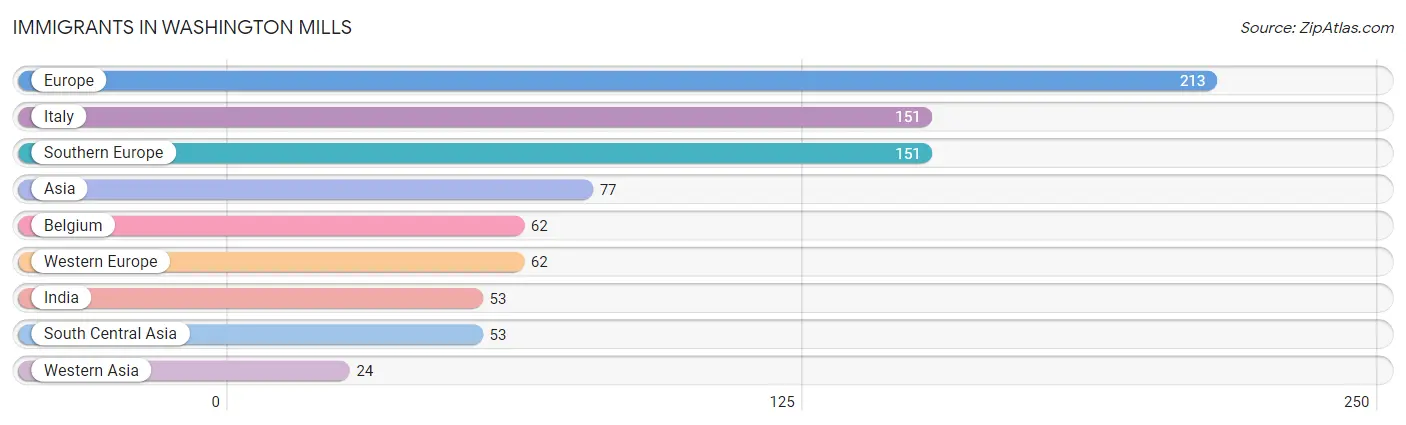
| Immigration Origin | # Population | % Population |
| Asia | 77 | 4.0% |
| Belgium | 62 | 3.3% |
| Europe | 213 | 11.2% |
| India | 53 | 2.8% |
| Italy | 151 | 7.9% |
| South Central Asia | 53 | 2.8% |
| Southern Europe | 151 | 7.9% |
| Western Asia | 24 | 1.3% |
| Western Europe | 62 | 3.3% | View All 9 Rows |
Sex and Age in Washington Mills
Sex and Age in Washington Mills
The most populous age groups in Washington Mills are 55 to 59 Years (183 | 19.9%) for men and 60 to 64 Years (151 | 15.2%) for women.
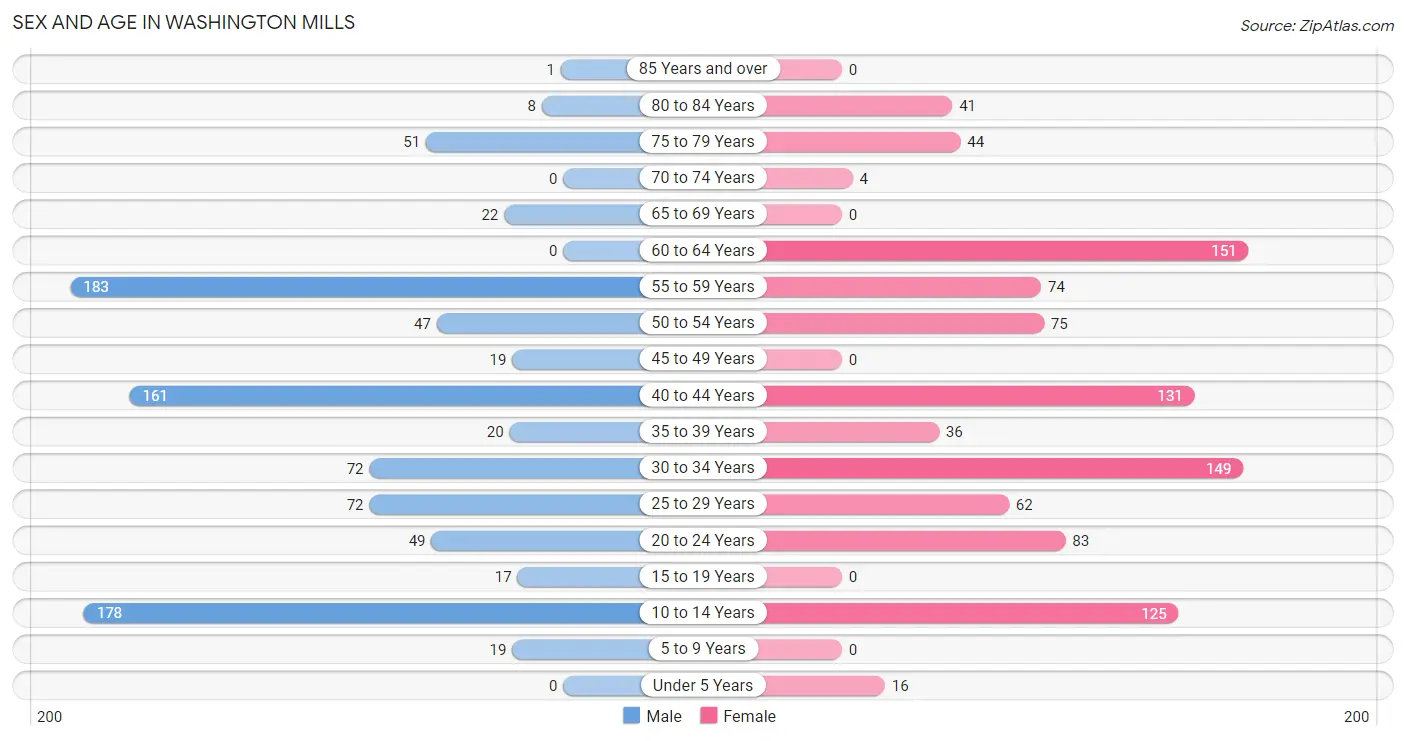
| Age Bracket | Male | Female |
| Under 5 Years | 0 (0.0%) | 16 (1.6%) |
| 5 to 9 Years | 19 (2.1%) | 0 (0.0%) |
| 10 to 14 Years | 178 (19.4%) | 125 (12.6%) |
| 15 to 19 Years | 17 (1.8%) | 0 (0.0%) |
| 20 to 24 Years | 49 (5.3%) | 83 (8.4%) |
| 25 to 29 Years | 72 (7.8%) | 62 (6.3%) |
| 30 to 34 Years | 72 (7.8%) | 149 (15.0%) |
| 35 to 39 Years | 20 (2.2%) | 36 (3.6%) |
| 40 to 44 Years | 161 (17.5%) | 131 (13.2%) |
| 45 to 49 Years | 19 (2.1%) | 0 (0.0%) |
| 50 to 54 Years | 47 (5.1%) | 75 (7.6%) |
| 55 to 59 Years | 183 (19.9%) | 74 (7.5%) |
| 60 to 64 Years | 0 (0.0%) | 151 (15.2%) |
| 65 to 69 Years | 22 (2.4%) | 0 (0.0%) |
| 70 to 74 Years | 0 (0.0%) | 4 (0.4%) |
| 75 to 79 Years | 51 (5.6%) | 44 (4.4%) |
| 80 to 84 Years | 8 (0.9%) | 41 (4.1%) |
| 85 Years and over | 1 (0.1%) | 0 (0.0%) |
| Total | 919 (100.0%) | 991 (100.0%) |
Families and Households in Washington Mills
Median Family Size in Washington Mills
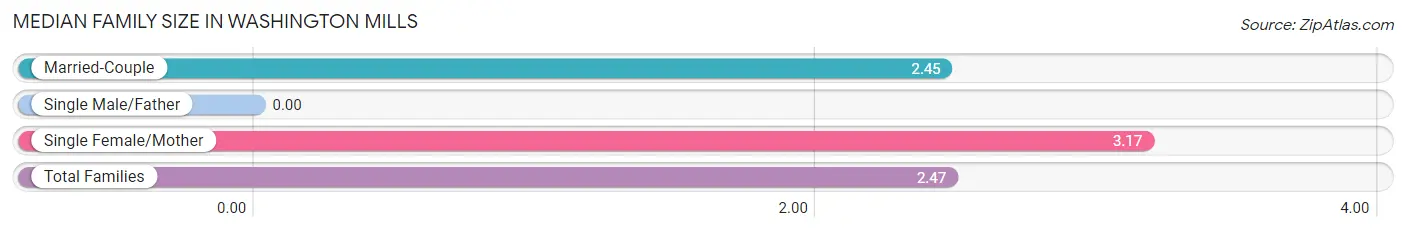
| Family Type | # Families | Family Size |
| Married-Couple | 645 (97.3%) | 2.45 |
| Single Male/Father | 0 (0.0%) | - |
| Single Female/Mother | 18 (2.7%) | 3.17 |
| Total Families | 663 (100.0%) | 2.47 |
Median Household Size in Washington Mills
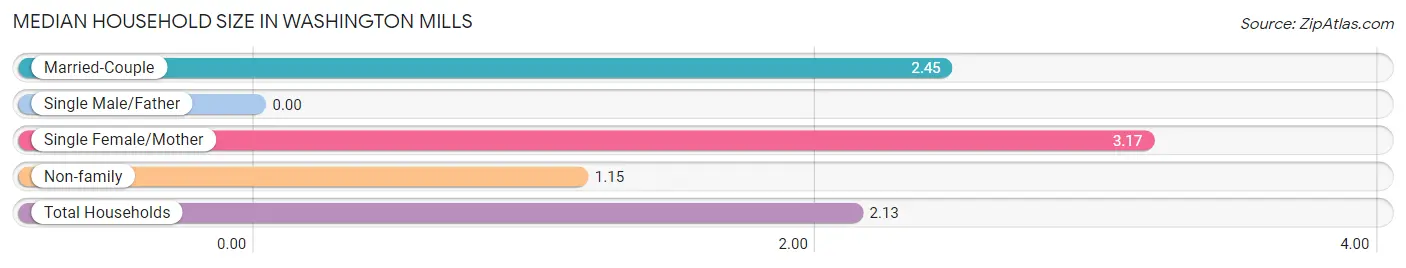
| Household Type | # Households | Household Size |
| Married-Couple | 645 (72.6%) | 2.45 |
| Single Male/Father | 0 (0.0%) | - |
| Single Female/Mother | 18 (2.0%) | 3.17 |
| Non-family | 225 (25.3%) | 1.15 |
| Total Households | 888 (100.0%) | 2.13 |
Household Size by Marriage Status in Washington Mills
Out of a total of 888 households in Washington Mills, 663 (74.7%) are family households, while 225 (25.3%) are nonfamily households. The most numerous type of family households are 2-person households, comprising 416, and the most common type of nonfamily households are 1-person households, comprising 193.
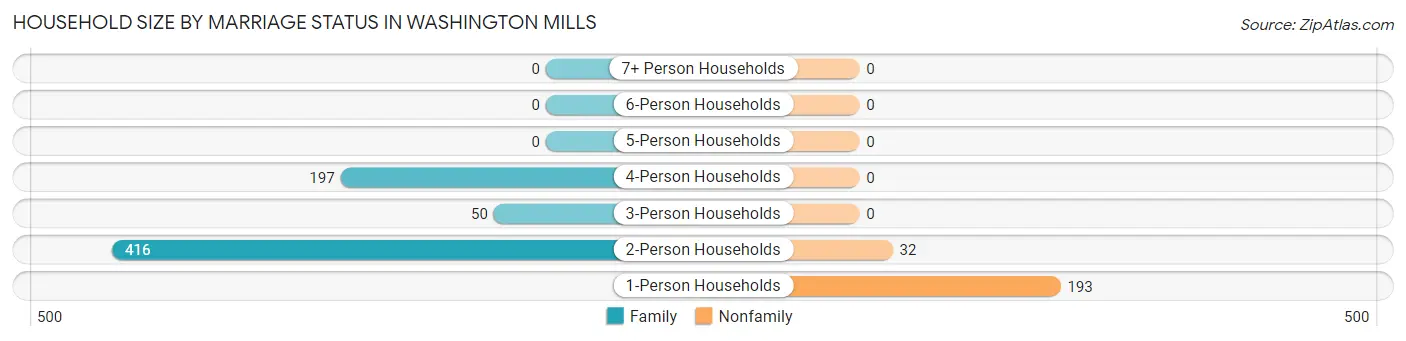
| Household Size | Family Households | Nonfamily Households |
| 1-Person Households | - | 193 (21.7%) |
| 2-Person Households | 416 (46.9%) | 32 (3.6%) |
| 3-Person Households | 50 (5.6%) | 0 (0.0%) |
| 4-Person Households | 197 (22.2%) | 0 (0.0%) |
| 5-Person Households | 0 (0.0%) | 0 (0.0%) |
| 6-Person Households | 0 (0.0%) | 0 (0.0%) |
| 7+ Person Households | 0 (0.0%) | 0 (0.0%) |
| Total | 663 (74.7%) | 225 (25.3%) |
Female Fertility in Washington Mills
Fertility by Age in Washington Mills
| Age Bracket | Women with Births | Births / 1,000 Women |
| 15 to 19 years | 0 (0.0%) | 0.0 |
| 20 to 34 years | 0 (0.0%) | 0.0 |
| 35 to 50 years | 0 (0.0%) | 0.0 |
| Total | 0 (0.0%) | 0.0 |
Fertility by Age by Marriage Status in Washington Mills
| Age Bracket | Married | Unmarried |
| 15 to 19 years | 0 (0.0%) | 0 (0.0%) |
| 20 to 34 years | 0 (0.0%) | 0 (0.0%) |
| 35 to 50 years | 0 (0.0%) | 0 (0.0%) |
| Total | 0 (0.0%) | 0 (0.0%) |
Fertility by Education in Washington Mills
| Educational Attainment | Women with Births | Births / 1,000 Women |
| Less than High School | 0 (0.0%) | 0.0 |
| High School Diploma | 0 (0.0%) | 0.0 |
| College or Associate's Degree | 0 (0.0%) | 0.0 |
| Bachelor's Degree | 0 (0.0%) | 0.0 |
| Graduate Degree | 0 (0.0%) | 0.0 |
| Total | 0 (0.0%) | 0.0 |
Fertility by Education by Marriage Status in Washington Mills
| Educational Attainment | Married | Unmarried |
| Less than High School | 0 (0.0%) | 0 (0.0%) |
| High School Diploma | 0 (0.0%) | 0 (0.0%) |
| College or Associate's Degree | 0 (0.0%) | 0 (0.0%) |
| Bachelor's Degree | 0 (0.0%) | 0 (0.0%) |
| Graduate Degree | 0 (0.0%) | 0 (0.0%) |
| Total | 0 (0.0%) | 0 (0.0%) |
Employment Characteristics in Washington Mills
Employment by Class of Employer in Washington Mills
Among the 1,256 employed individuals in Washington Mills, private company employees (891 | 70.9%), state government employees (169 | 13.5%), and not-for-profit organizations (124 | 9.9%) make up the most common classes of employment.
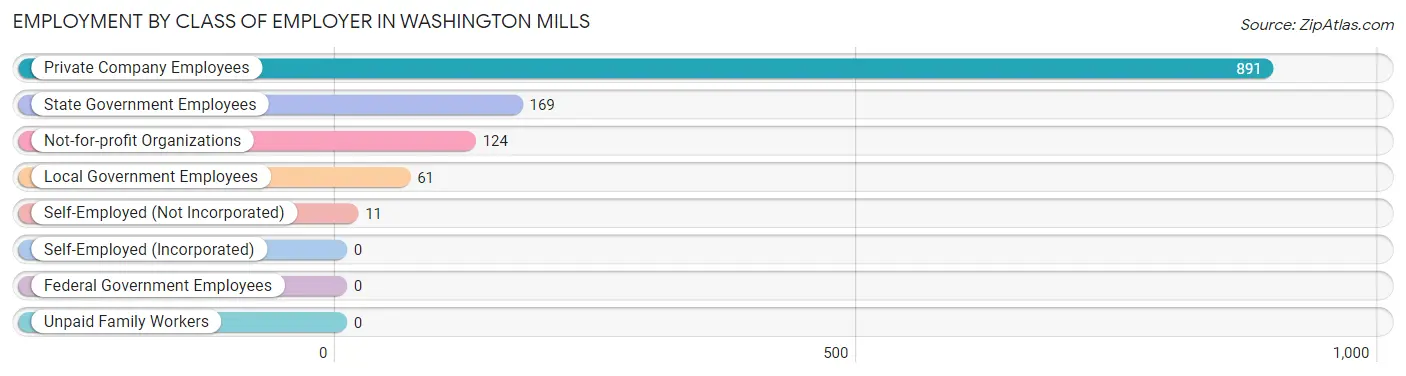
| Employer Class | # Employees | % Employees |
| Private Company Employees | 891 | 70.9% |
| Self-Employed (Incorporated) | 0 | 0.0% |
| Self-Employed (Not Incorporated) | 11 | 0.9% |
| Not-for-profit Organizations | 124 | 9.9% |
| Local Government Employees | 61 | 4.9% |
| State Government Employees | 169 | 13.5% |
| Federal Government Employees | 0 | 0.0% |
| Unpaid Family Workers | 0 | 0.0% |
| Total | 1,256 | 100.0% |
Employment Status by Age in Washington Mills
According to the labor force statistics for Washington Mills, out of the total population over 16 years of age (1,555), 82.8% or 1,288 individuals are in the labor force, with 1.1% or 14 of them unemployed. The age group with the highest labor force participation rate is 20 to 24 years, with 100.0% or 132 individuals in the labor force. Within the labor force, the 25 to 29 years age range has the highest percentage of unemployed individuals, with 10.4% or 14 of them being unemployed.
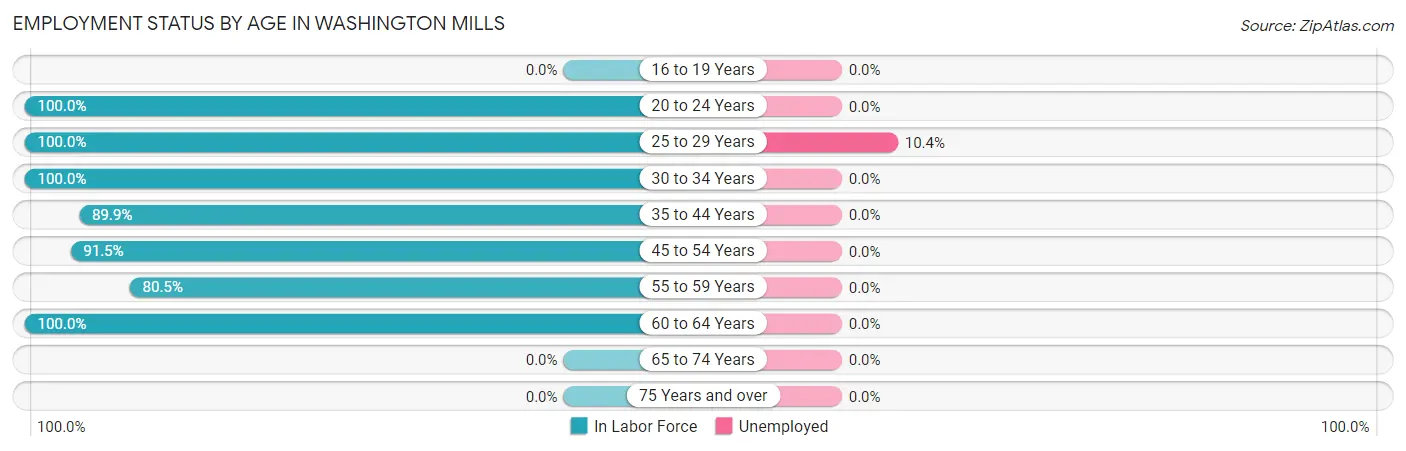
| Age Bracket | In Labor Force | Unemployed |
| 16 to 19 Years | 0 (0.0%) | 0 (0.0%) |
| 20 to 24 Years | 132 (100.0%) | 0 (0.0%) |
| 25 to 29 Years | 134 (100.0%) | 14 (10.4%) |
| 30 to 34 Years | 221 (100.0%) | 0 (0.0%) |
| 35 to 44 Years | 313 (89.9%) | 0 (0.0%) |
| 45 to 54 Years | 129 (91.5%) | 0 (0.0%) |
| 55 to 59 Years | 207 (80.5%) | 0 (0.0%) |
| 60 to 64 Years | 151 (100.0%) | 0 (0.0%) |
| 65 to 74 Years | 0 (0.0%) | 0 (0.0%) |
| 75 Years and over | 0 (0.0%) | 0 (0.0%) |
| Total | 1,288 (82.8%) | 14 (1.1%) |
Employment Status by Educational Attainment in Washington Mills
According to labor force statistics for Washington Mills, 92.3% of individuals (1,156) out of the total population between 25 and 64 years of age (1,252) are in the labor force, with 1.2% or 14 of them being unemployed. The group with the highest labor force participation rate are those with the educational attainment of bachelor's degree or higher, with 97.7% or 640 individuals in the labor force. Within the labor force, individuals with bachelor's degree or higher education have the highest percentage of unemployment, with 2.2% or 14 of them being unemployed.
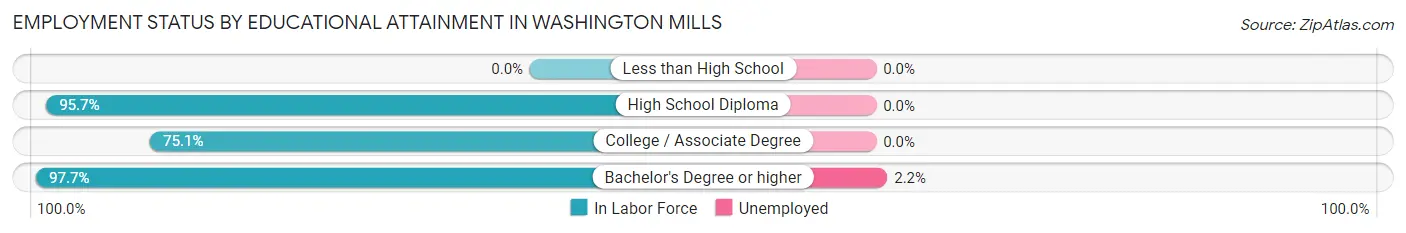
| Educational Attainment | In Labor Force | Unemployed |
| Less than High School | 0 (0.0%) | 0 (0.0%) |
| High School Diploma | 310 (95.7%) | 0 (0.0%) |
| College / Associate Degree | 205 (75.1%) | 0 (0.0%) |
| Bachelor's Degree or higher | 640 (97.7%) | 14 (2.2%) |
| Total | 1,156 (92.3%) | 15 (1.2%) |
Employment Occupations by Sex in Washington Mills
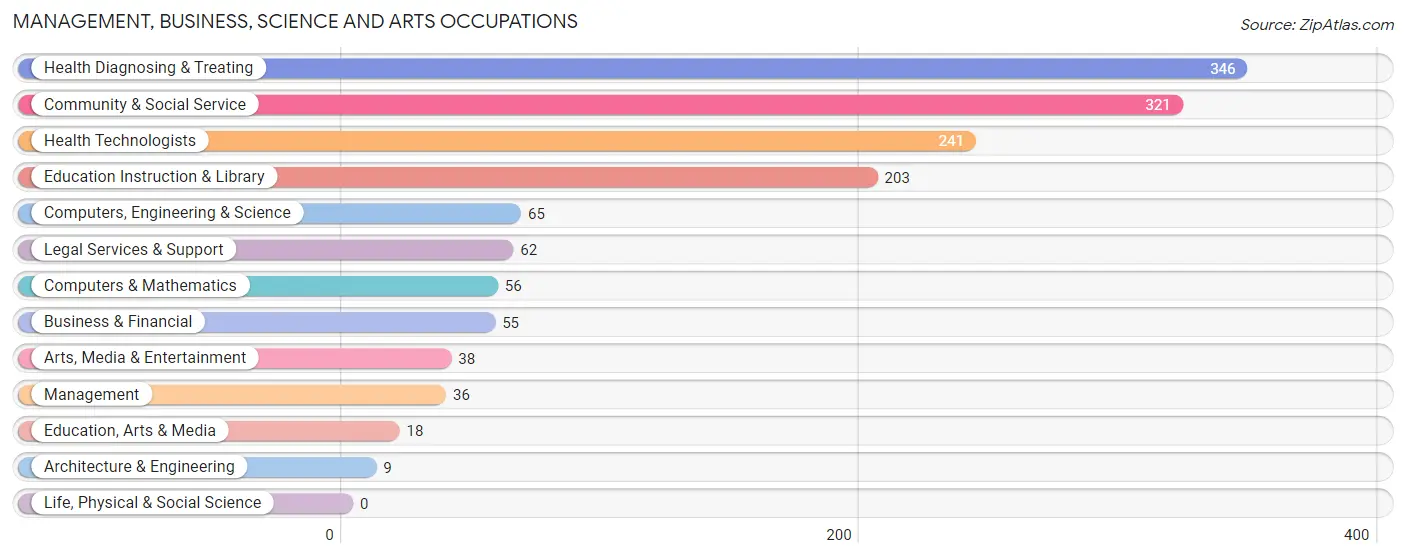
Management, Business, Science and Arts Occupations
The most common Management, Business, Science and Arts occupations in Washington Mills are Health Diagnosing & Treating (346 | 27.2%), Community & Social Service (321 | 25.2%), Health Technologists (241 | 18.9%), Education Instruction & Library (203 | 16.0%), and Computers, Engineering & Science (65 | 5.1%).
Management, Business, Science and Arts Occupations by Sex
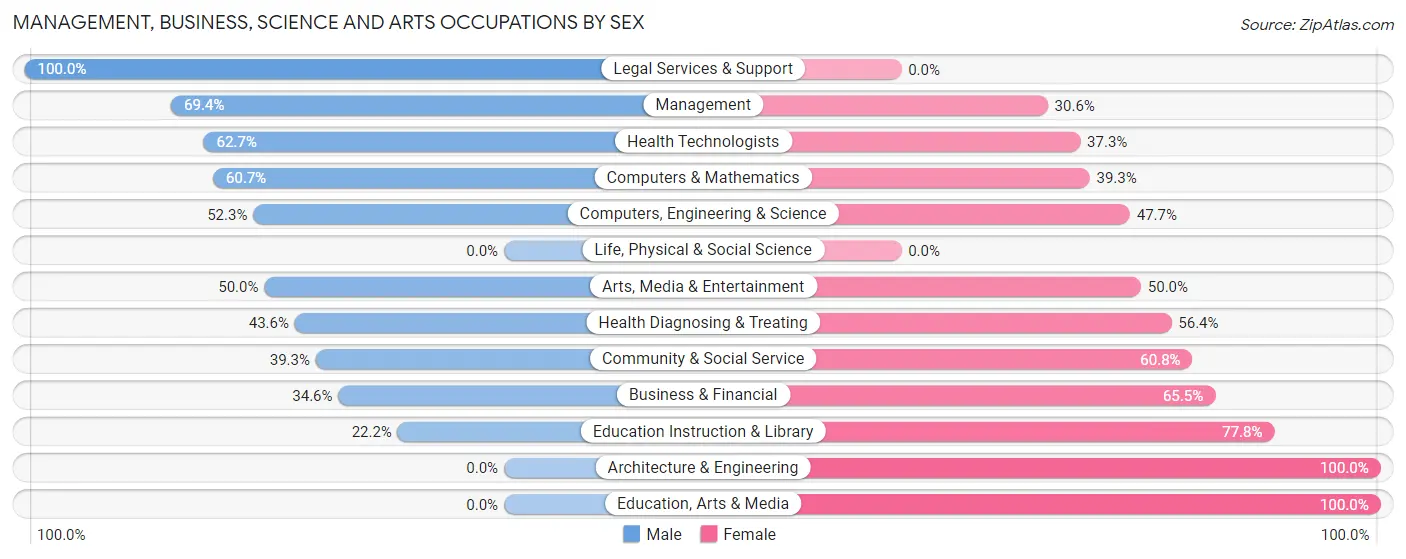
Within the Management, Business, Science and Arts occupations in Washington Mills, the most male-oriented occupations are Legal Services & Support (100.0%), Management (69.4%), and Health Technologists (62.7%), while the most female-oriented occupations are Architecture & Engineering (100.0%), Education, Arts & Media (100.0%), and Education Instruction & Library (77.8%).
| Occupation | Male | Female |
| Management | 25 (69.4%) | 11 (30.6%) |
| Business & Financial | 19 (34.5%) | 36 (65.4%) |
| Computers, Engineering & Science | 34 (52.3%) | 31 (47.7%) |
| Computers & Mathematics | 34 (60.7%) | 22 (39.3%) |
| Architecture & Engineering | 0 (0.0%) | 9 (100.0%) |
| Life, Physical & Social Science | 0 (0.0%) | 0 (0.0%) |
| Community & Social Service | 126 (39.3%) | 195 (60.8%) |
| Education, Arts & Media | 0 (0.0%) | 18 (100.0%) |
| Legal Services & Support | 62 (100.0%) | 0 (0.0%) |
| Education Instruction & Library | 45 (22.2%) | 158 (77.8%) |
| Arts, Media & Entertainment | 19 (50.0%) | 19 (50.0%) |
| Health Diagnosing & Treating | 151 (43.6%) | 195 (56.4%) |
| Health Technologists | 151 (62.7%) | 90 (37.3%) |
| Total (Category) | 355 (43.1%) | 468 (56.9%) |
| Total (Overall) | 601 (47.2%) | 672 (52.8%) |
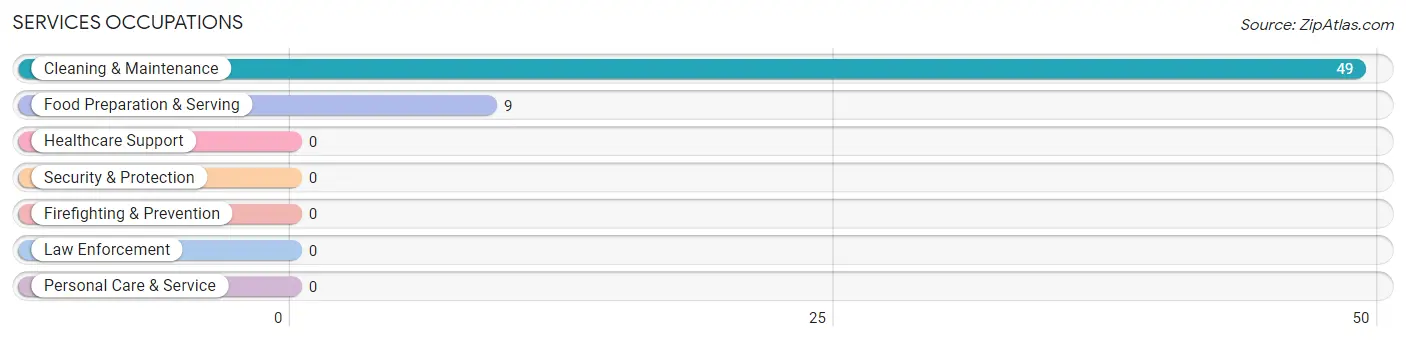
Services Occupations
The most common Services occupations in Washington Mills are Cleaning & Maintenance (49 | 3.8%), and Food Preparation & Serving (9 | 0.7%).
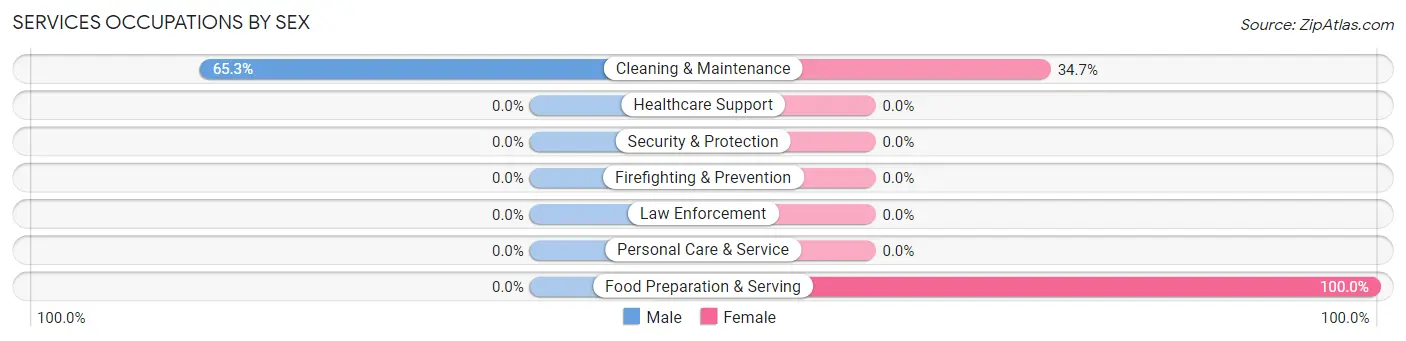
Services Occupations by Sex
| Occupation | Male | Female |
| Healthcare Support | 0 (0.0%) | 0 (0.0%) |
| Security & Protection | 0 (0.0%) | 0 (0.0%) |
| Firefighting & Prevention | 0 (0.0%) | 0 (0.0%) |
| Law Enforcement | 0 (0.0%) | 0 (0.0%) |
| Food Preparation & Serving | 0 (0.0%) | 9 (100.0%) |
| Cleaning & Maintenance | 32 (65.3%) | 17 (34.7%) |
| Personal Care & Service | 0 (0.0%) | 0 (0.0%) |
| Total (Category) | 32 (55.2%) | 26 (44.8%) |
| Total (Overall) | 601 (47.2%) | 672 (52.8%) |
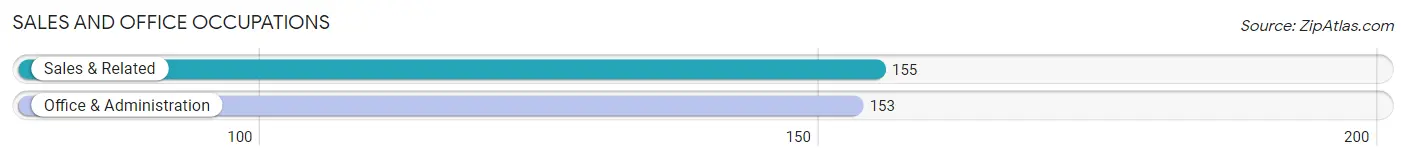
Sales and Office Occupations
The most common Sales and Office occupations in Washington Mills are Sales & Related (155 | 12.2%), and Office & Administration (153 | 12.0%).
Sales and Office Occupations by Sex
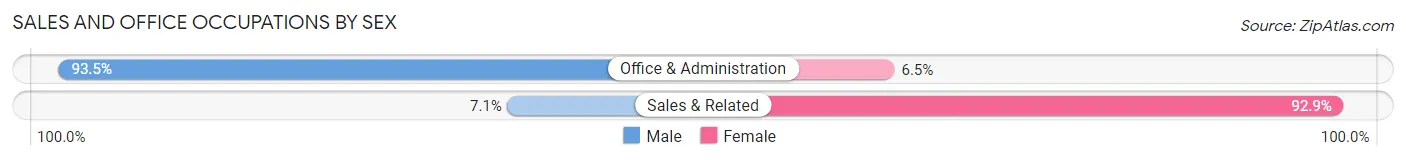
| Occupation | Male | Female |
| Sales & Related | 11 (7.1%) | 144 (92.9%) |
| Office & Administration | 143 (93.5%) | 10 (6.5%) |
| Total (Category) | 154 (50.0%) | 154 (50.0%) |
| Total (Overall) | 601 (47.2%) | 672 (52.8%) |
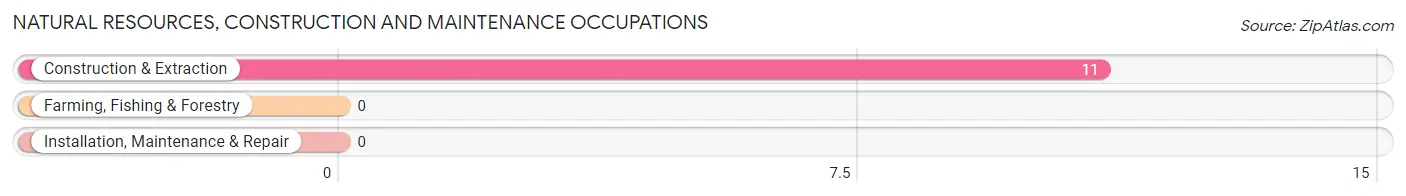
Natural Resources, Construction and Maintenance Occupations
The most common Natural Resources, Construction and Maintenance occupations in Washington Mills are , and Construction & Extraction (11 | 0.9%).
Natural Resources, Construction and Maintenance Occupations by Sex
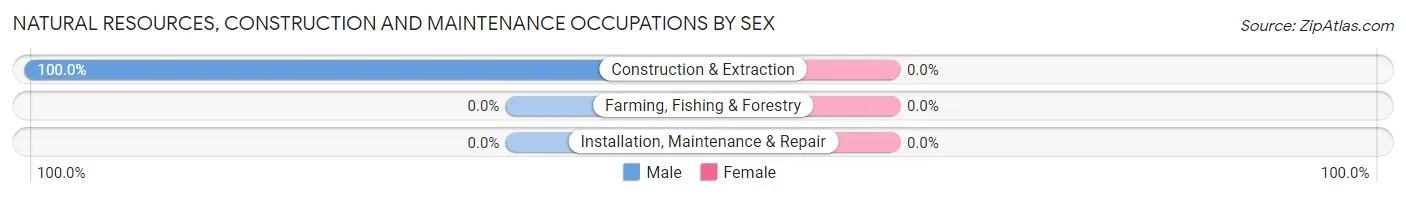
| Occupation | Male | Female |
| Farming, Fishing & Forestry | 0 (0.0%) | 0 (0.0%) |
| Construction & Extraction | 11 (100.0%) | 0 (0.0%) |
| Installation, Maintenance & Repair | 0 (0.0%) | 0 (0.0%) |
| Total (Category) | 11 (100.0%) | 0 (0.0%) |
| Total (Overall) | 601 (47.2%) | 672 (52.8%) |
Production, Transportation and Moving Occupations
The most common Production, Transportation and Moving occupations in Washington Mills are Production (56 | 4.4%), and Material Moving (17 | 1.3%).
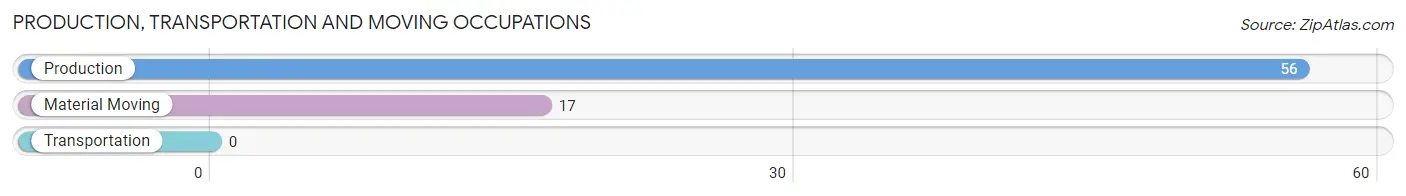
Production, Transportation and Moving Occupations by Sex
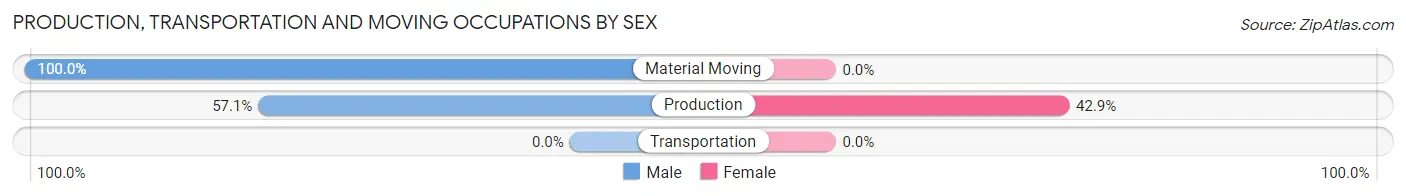
| Occupation | Male | Female |
| Production | 32 (57.1%) | 24 (42.9%) |
| Transportation | 0 (0.0%) | 0 (0.0%) |
| Material Moving | 17 (100.0%) | 0 (0.0%) |
| Total (Category) | 49 (67.1%) | 24 (32.9%) |
| Total (Overall) | 601 (47.2%) | 672 (52.8%) |
Employment Industries by Sex in Washington Mills
Employment Industries in Washington Mills
The major employment industries in Washington Mills include Health Care & Social Assistance (329 | 25.8%), Retail Trade (289 | 22.7%), Educational Services (203 | 16.0%), Professional & Scientific (92 | 7.2%), and Finance & Insurance (86 | 6.8%).
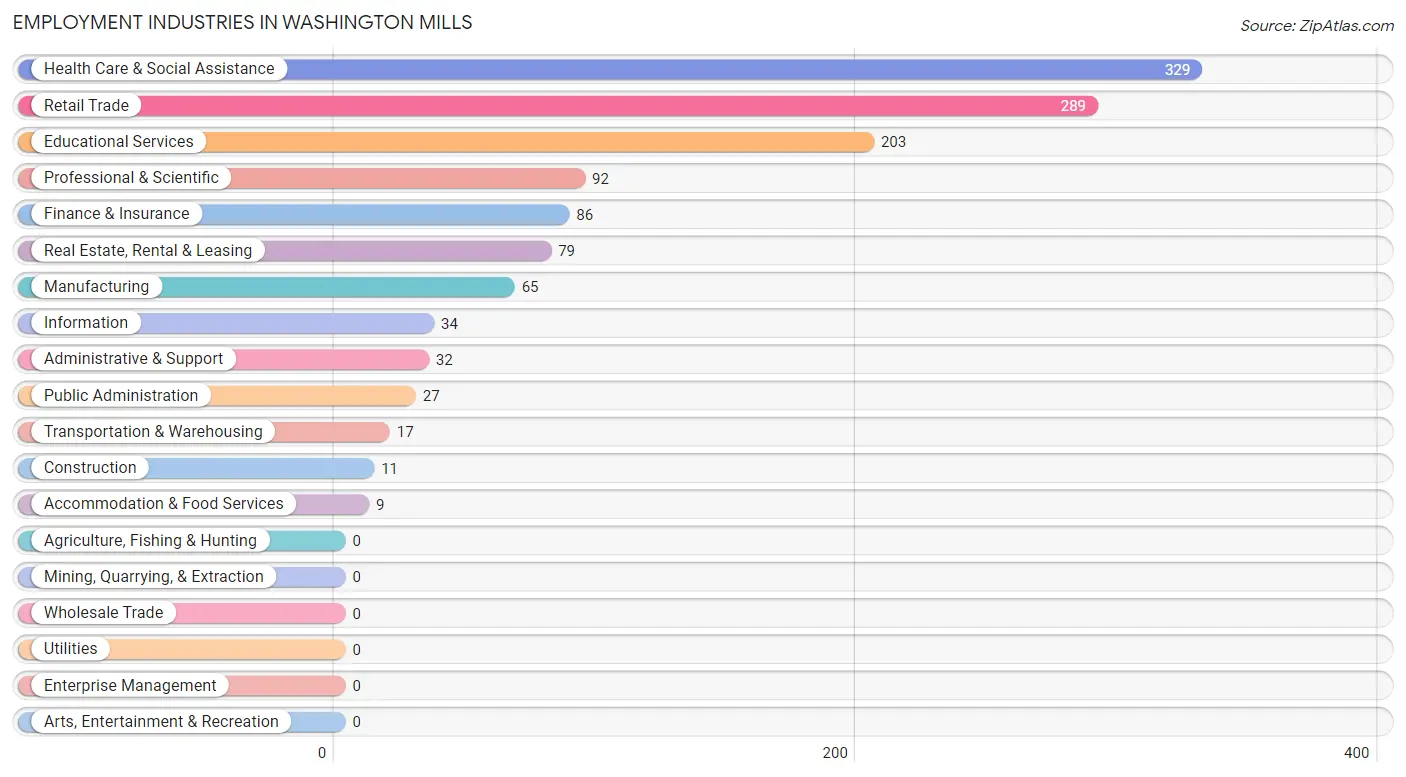
Employment Industries by Sex in Washington Mills
The Washington Mills industries that see more men than women are Construction (100.0%), Transportation & Warehousing (100.0%), and Information (100.0%), whereas the industries that tend to have a higher number of women are Finance & Insurance (100.0%), Accommodation & Food Services (100.0%), and Educational Services (77.8%).
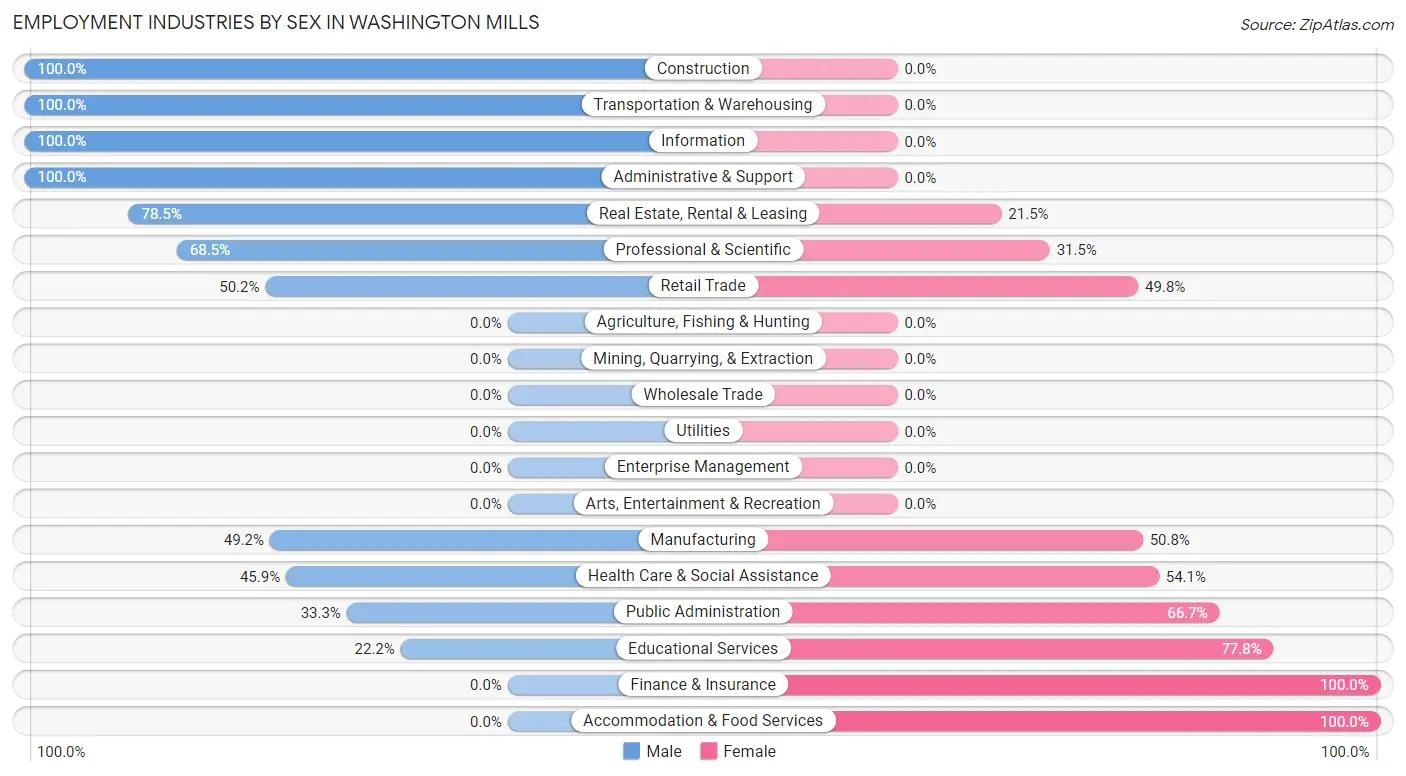
| Industry | Male | Female |
| Agriculture, Fishing & Hunting | 0 (0.0%) | 0 (0.0%) |
| Mining, Quarrying, & Extraction | 0 (0.0%) | 0 (0.0%) |
| Construction | 11 (100.0%) | 0 (0.0%) |
| Manufacturing | 32 (49.2%) | 33 (50.8%) |
| Wholesale Trade | 0 (0.0%) | 0 (0.0%) |
| Retail Trade | 145 (50.2%) | 144 (49.8%) |
| Transportation & Warehousing | 17 (100.0%) | 0 (0.0%) |
| Utilities | 0 (0.0%) | 0 (0.0%) |
| Information | 34 (100.0%) | 0 (0.0%) |
| Finance & Insurance | 0 (0.0%) | 86 (100.0%) |
| Real Estate, Rental & Leasing | 62 (78.5%) | 17 (21.5%) |
| Professional & Scientific | 63 (68.5%) | 29 (31.5%) |
| Enterprise Management | 0 (0.0%) | 0 (0.0%) |
| Administrative & Support | 32 (100.0%) | 0 (0.0%) |
| Educational Services | 45 (22.2%) | 158 (77.8%) |
| Health Care & Social Assistance | 151 (45.9%) | 178 (54.1%) |
| Arts, Entertainment & Recreation | 0 (0.0%) | 0 (0.0%) |
| Accommodation & Food Services | 0 (0.0%) | 9 (100.0%) |
| Public Administration | 9 (33.3%) | 18 (66.7%) |
| Total | 601 (47.2%) | 672 (52.8%) |
Education in Washington Mills
School Enrollment in Washington Mills
The most common levels of schooling among the 415 students in Washington Mills are high school (161 | 38.8%), middle school (159 | 38.3%), and graduate / professional (39 | 9.4%).
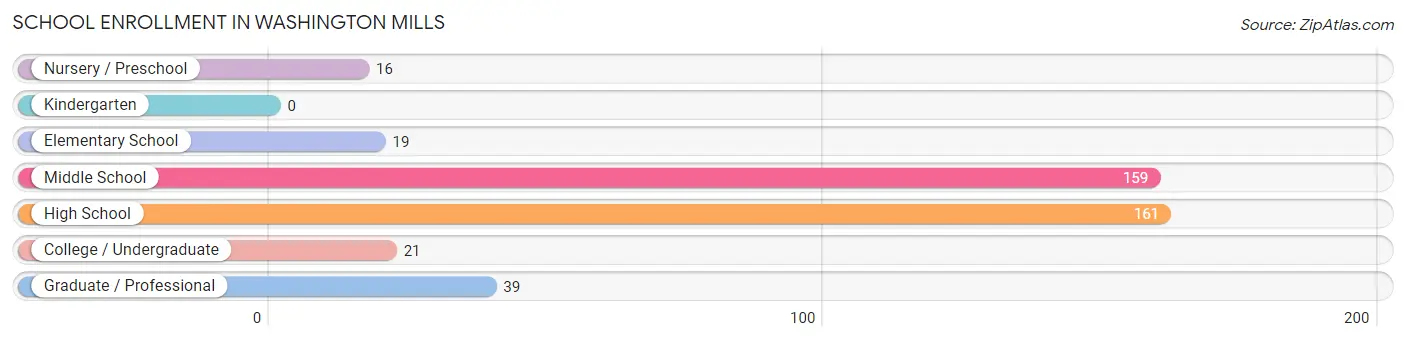
| School Level | # Students | % Students |
| Nursery / Preschool | 16 | 3.9% |
| Kindergarten | 0 | 0.0% |
| Elementary School | 19 | 4.6% |
| Middle School | 159 | 38.3% |
| High School | 161 | 38.8% |
| College / Undergraduate | 21 | 5.1% |
| Graduate / Professional | 39 | 9.4% |
| Total | 415 | 100.0% |
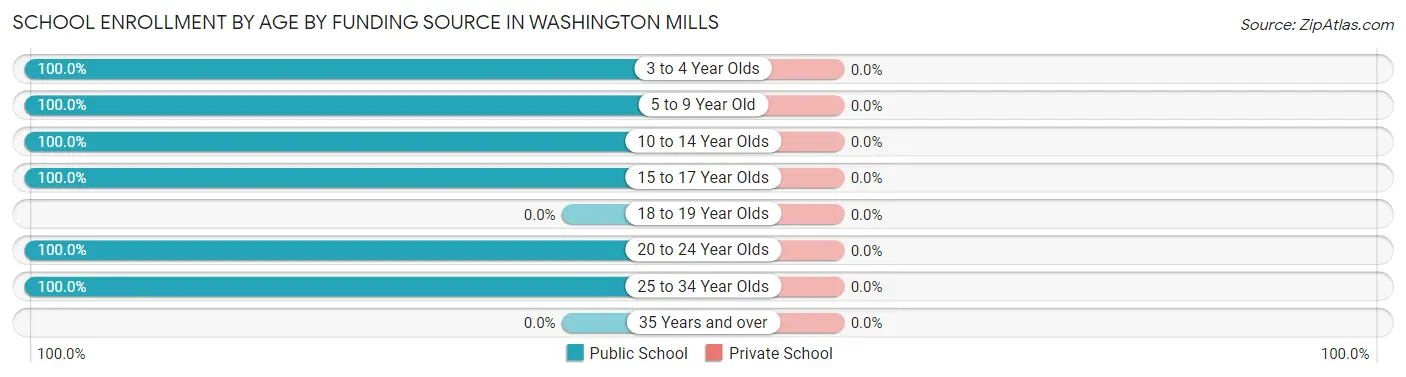
School Enrollment by Age by Funding Source in Washington Mills
| Age Bracket | Public School | Private School |
| 3 to 4 Year Olds | 16 (100.0%) | 0 (0.0%) |
| 5 to 9 Year Old | 19 (100.0%) | 0 (0.0%) |
| 10 to 14 Year Olds | 303 (100.0%) | 0 (0.0%) |
| 15 to 17 Year Olds | 17 (100.0%) | 0 (0.0%) |
| 18 to 19 Year Olds | 0 (0.0%) | 0 (0.0%) |
| 20 to 24 Year Olds | 36 (100.0%) | 0 (0.0%) |
| 25 to 34 Year Olds | 24 (100.0%) | 0 (0.0%) |
| 35 Years and over | 0 (0.0%) | 0 (0.0%) |
| Total | 415 (100.0%) | 0 (0.0%) |
Educational Attainment by Field of Study in Washington Mills
Science & technology (232 | 32.9%), social sciences (150 | 21.2%), literature & languages (103 | 14.6%), bio, nature & agricultural (46 | 6.5%), and psychology (41 | 5.8%) are the most common fields of study among 706 individuals in Washington Mills who have obtained a bachelor's degree or higher.
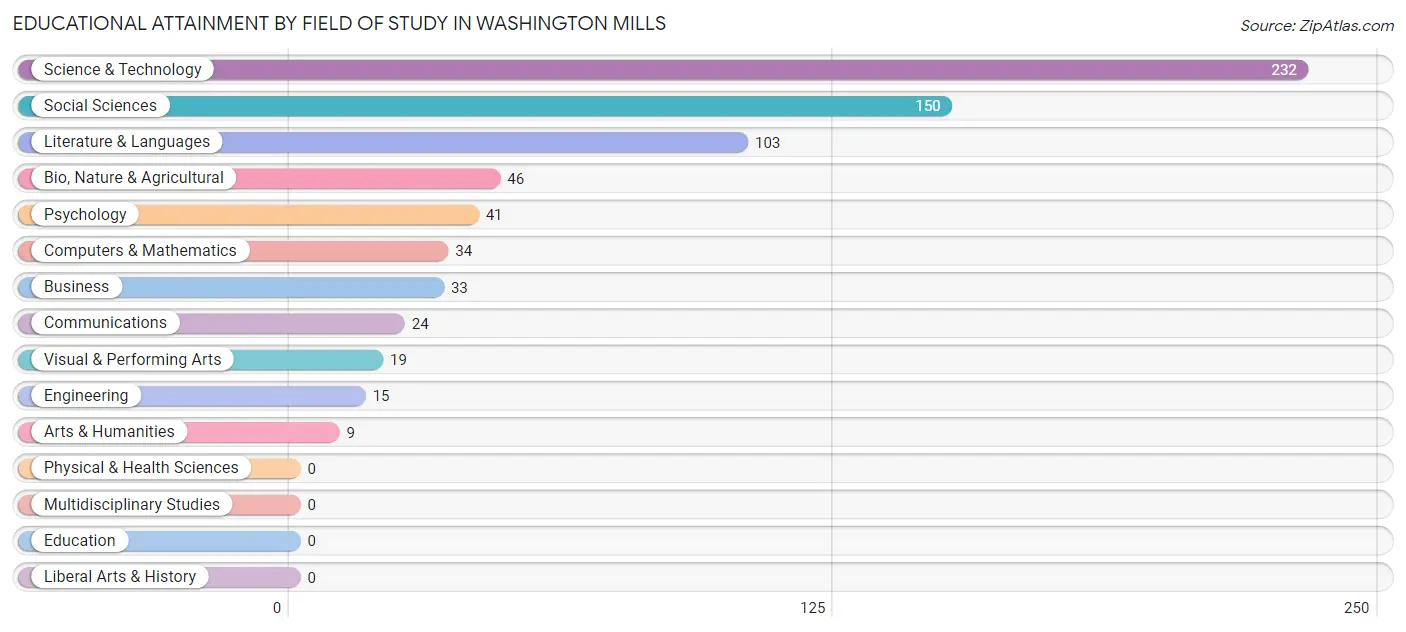
| Field of Study | # Graduates | % Graduates |
| Computers & Mathematics | 34 | 4.8% |
| Bio, Nature & Agricultural | 46 | 6.5% |
| Physical & Health Sciences | 0 | 0.0% |
| Psychology | 41 | 5.8% |
| Social Sciences | 150 | 21.2% |
| Engineering | 15 | 2.1% |
| Multidisciplinary Studies | 0 | 0.0% |
| Science & Technology | 232 | 32.9% |
| Business | 33 | 4.7% |
| Education | 0 | 0.0% |
| Literature & Languages | 103 | 14.6% |
| Liberal Arts & History | 0 | 0.0% |
| Visual & Performing Arts | 19 | 2.7% |
| Communications | 24 | 3.4% |
| Arts & Humanities | 9 | 1.3% |
| Total | 706 | 100.0% |
Transportation & Commute in Washington Mills
Vehicle Availability by Sex in Washington Mills
The most prevalent vehicle ownership categories in Washington Mills are males with 1 vehicle (262, accounting for 43.6%) and females with 1 vehicle (313, making up 40.0%).
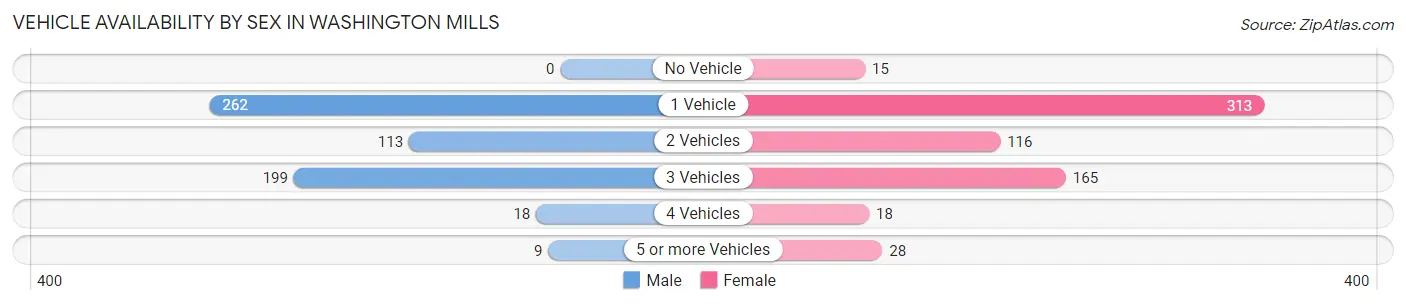
| Vehicles Available | Male | Female |
| No Vehicle | 0 (0.0%) | 15 (2.3%) |
| 1 Vehicle | 262 (43.6%) | 313 (47.8%) |
| 2 Vehicles | 113 (18.8%) | 116 (17.7%) |
| 3 Vehicles | 199 (33.1%) | 165 (25.2%) |
| 4 Vehicles | 18 (3.0%) | 18 (2.8%) |
| 5 or more Vehicles | 9 (1.5%) | 28 (4.3%) |
| Total | 601 (100.0%) | 655 (100.0%) |
Commute Time in Washington Mills
The most frequently occuring commute durations in Washington Mills are 5 to 9 minutes (305 commuters, 30.6%), 25 to 29 minutes (190 commuters, 19.1%), and 10 to 14 minutes (165 commuters, 16.6%).
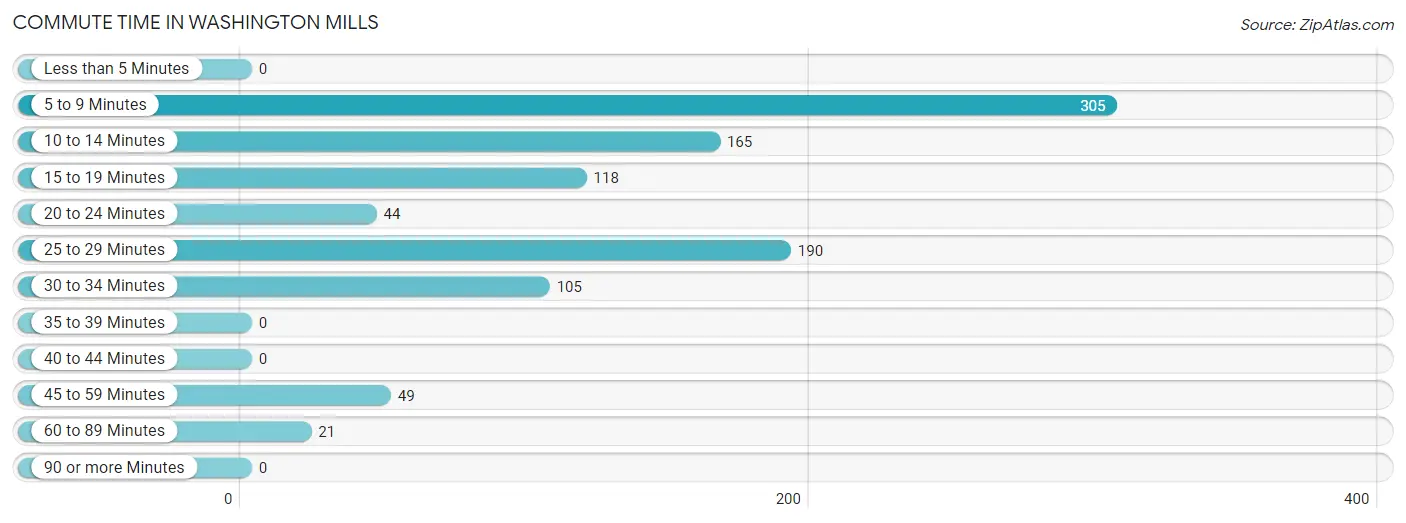
| Commute Time | # Commuters | % Commuters |
| Less than 5 Minutes | 0 | 0.0% |
| 5 to 9 Minutes | 305 | 30.6% |
| 10 to 14 Minutes | 165 | 16.6% |
| 15 to 19 Minutes | 118 | 11.8% |
| 20 to 24 Minutes | 44 | 4.4% |
| 25 to 29 Minutes | 190 | 19.1% |
| 30 to 34 Minutes | 105 | 10.5% |
| 35 to 39 Minutes | 0 | 0.0% |
| 40 to 44 Minutes | 0 | 0.0% |
| 45 to 59 Minutes | 49 | 4.9% |
| 60 to 89 Minutes | 21 | 2.1% |
| 90 or more Minutes | 0 | 0.0% |
Commute Time by Sex in Washington Mills
The most common commute times in Washington Mills are 25 to 29 minutes (171 commuters, 34.8%) for males and 5 to 9 minutes (171 commuters, 33.8%) for females.
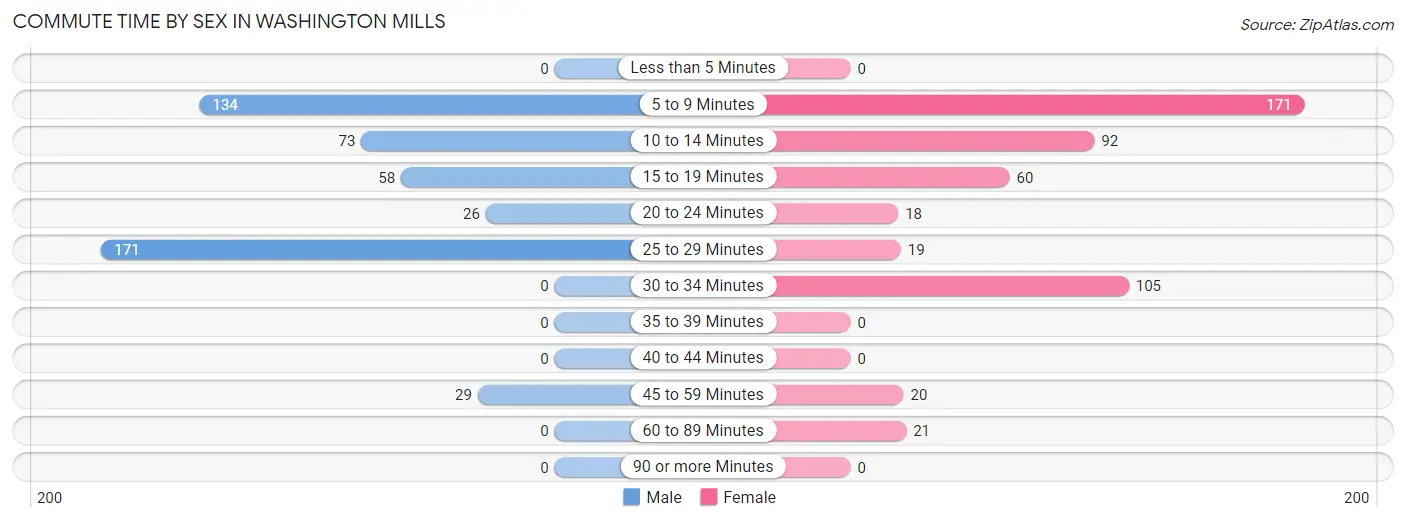
| Commute Time | Male | Female |
| Less than 5 Minutes | 0 (0.0%) | 0 (0.0%) |
| 5 to 9 Minutes | 134 (27.3%) | 171 (33.8%) |
| 10 to 14 Minutes | 73 (14.9%) | 92 (18.2%) |
| 15 to 19 Minutes | 58 (11.8%) | 60 (11.9%) |
| 20 to 24 Minutes | 26 (5.3%) | 18 (3.6%) |
| 25 to 29 Minutes | 171 (34.8%) | 19 (3.7%) |
| 30 to 34 Minutes | 0 (0.0%) | 105 (20.7%) |
| 35 to 39 Minutes | 0 (0.0%) | 0 (0.0%) |
| 40 to 44 Minutes | 0 (0.0%) | 0 (0.0%) |
| 45 to 59 Minutes | 29 (5.9%) | 20 (4.0%) |
| 60 to 89 Minutes | 0 (0.0%) | 21 (4.2%) |
| 90 or more Minutes | 0 (0.0%) | 0 (0.0%) |
Time of Departure to Work by Sex in Washington Mills
The most frequent times of departure to work in Washington Mills are 6:30 AM to 6:59 AM (300, 61.1%) for males and 6:30 AM to 6:59 AM (211, 41.7%) for females.
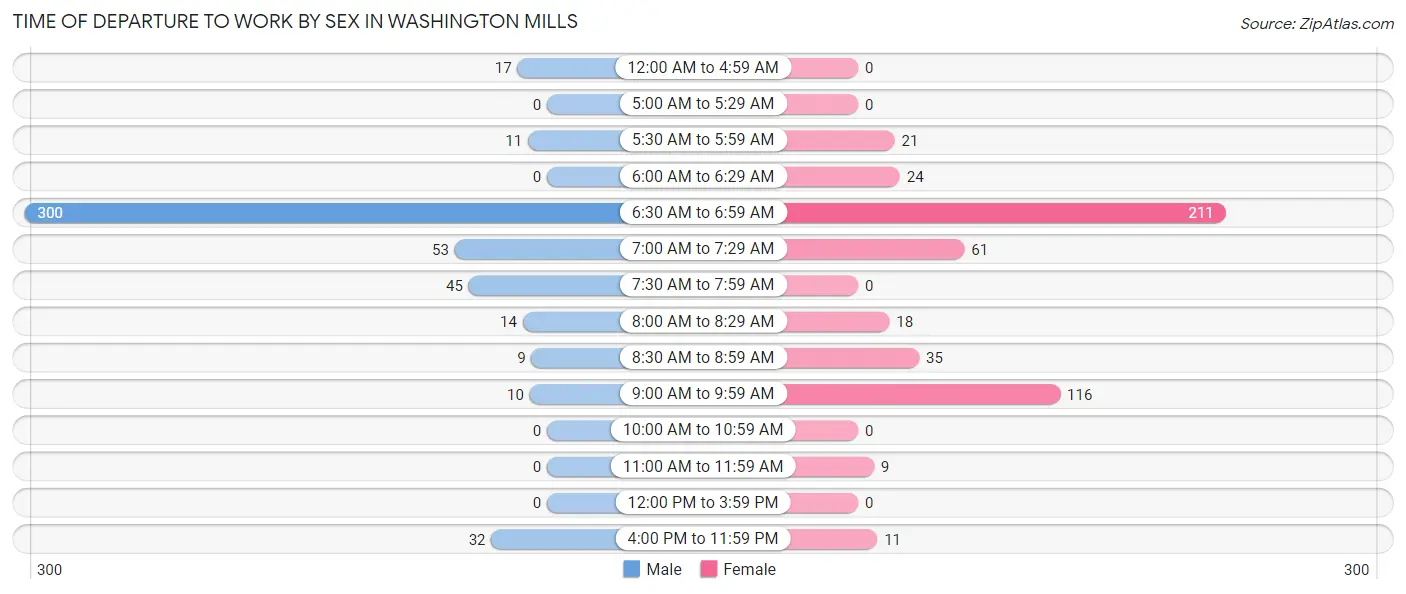
| Time of Departure | Male | Female |
| 12:00 AM to 4:59 AM | 17 (3.5%) | 0 (0.0%) |
| 5:00 AM to 5:29 AM | 0 (0.0%) | 0 (0.0%) |
| 5:30 AM to 5:59 AM | 11 (2.2%) | 21 (4.2%) |
| 6:00 AM to 6:29 AM | 0 (0.0%) | 24 (4.7%) |
| 6:30 AM to 6:59 AM | 300 (61.1%) | 211 (41.7%) |
| 7:00 AM to 7:29 AM | 53 (10.8%) | 61 (12.1%) |
| 7:30 AM to 7:59 AM | 45 (9.2%) | 0 (0.0%) |
| 8:00 AM to 8:29 AM | 14 (2.9%) | 18 (3.6%) |
| 8:30 AM to 8:59 AM | 9 (1.8%) | 35 (6.9%) |
| 9:00 AM to 9:59 AM | 10 (2.0%) | 116 (22.9%) |
| 10:00 AM to 10:59 AM | 0 (0.0%) | 0 (0.0%) |
| 11:00 AM to 11:59 AM | 0 (0.0%) | 9 (1.8%) |
| 12:00 PM to 3:59 PM | 0 (0.0%) | 0 (0.0%) |
| 4:00 PM to 11:59 PM | 32 (6.5%) | 11 (2.2%) |
| Total | 491 (100.0%) | 506 (100.0%) |
Housing Occupancy in Washington Mills
Occupancy by Ownership in Washington Mills
Of the total 888 dwellings in Washington Mills, owner-occupied units account for 492 (55.4%), while renter-occupied units make up 396 (44.6%).
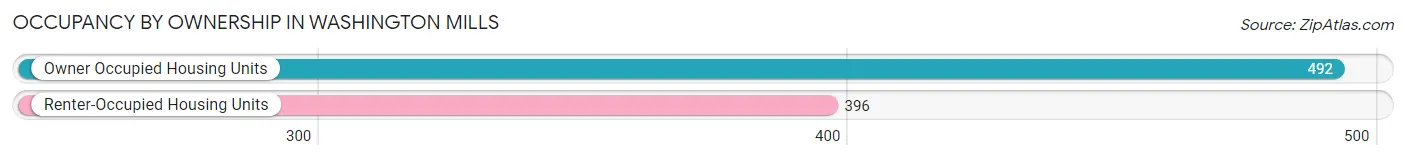
| Occupancy | # Housing Units | % Housing Units |
| Owner Occupied Housing Units | 492 | 55.4% |
| Renter-Occupied Housing Units | 396 | 44.6% |
| Total Occupied Housing Units | 888 | 100.0% |
Occupancy by Household Size in Washington Mills
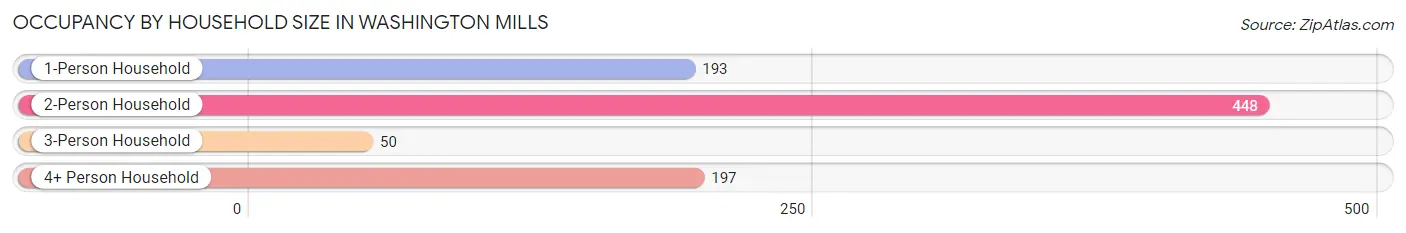
| Household Size | # Housing Units | % Housing Units |
| 1-Person Household | 193 | 21.7% |
| 2-Person Household | 448 | 50.4% |
| 3-Person Household | 50 | 5.6% |
| 4+ Person Household | 197 | 22.2% |
| Total Housing Units | 888 | 100.0% |
Occupancy by Ownership by Household Size in Washington Mills
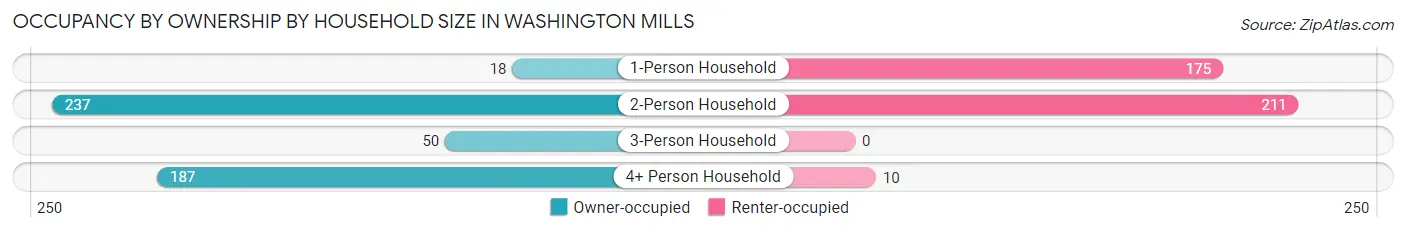
| Household Size | Owner-occupied | Renter-occupied |
| 1-Person Household | 18 (9.3%) | 175 (90.7%) |
| 2-Person Household | 237 (52.9%) | 211 (47.1%) |
| 3-Person Household | 50 (100.0%) | 0 (0.0%) |
| 4+ Person Household | 187 (94.9%) | 10 (5.1%) |
| Total Housing Units | 492 (55.4%) | 396 (44.6%) |
Occupancy by Educational Attainment in Washington Mills
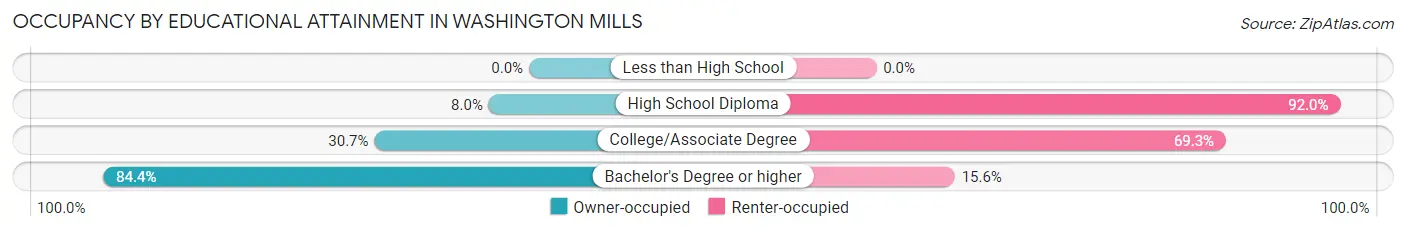
| Household Size | Owner-occupied | Renter-occupied |
| Less than High School | 0 (0.0%) | 0 (0.0%) |
| High School Diploma | 15 (8.0%) | 173 (92.0%) |
| College/Associate Degree | 65 (30.7%) | 147 (69.3%) |
| Bachelor's Degree or higher | 412 (84.4%) | 76 (15.6%) |
Occupancy by Age of Householder in Washington Mills
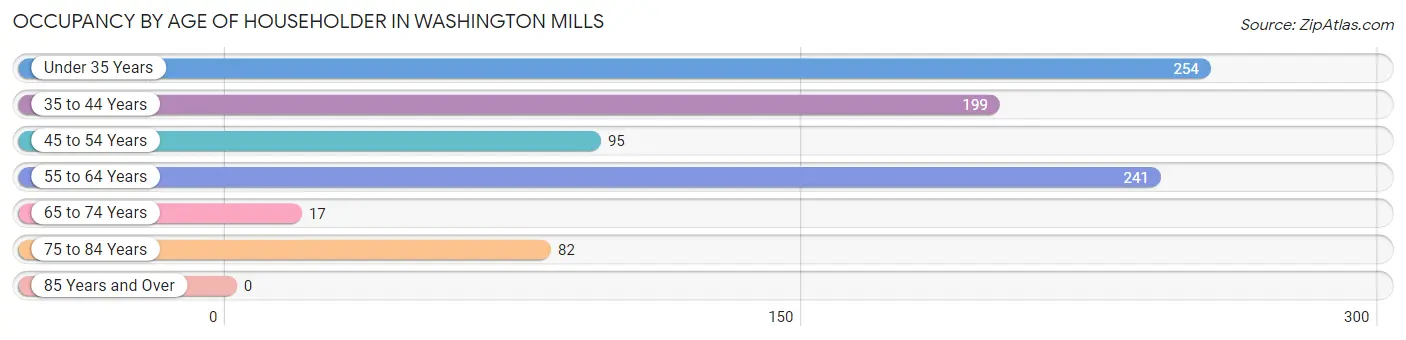
| Age Bracket | # Households | % Households |
| Under 35 Years | 254 | 28.6% |
| 35 to 44 Years | 199 | 22.4% |
| 45 to 54 Years | 95 | 10.7% |
| 55 to 64 Years | 241 | 27.1% |
| 65 to 74 Years | 17 | 1.9% |
| 75 to 84 Years | 82 | 9.2% |
| 85 Years and Over | 0 | 0.0% |
| Total | 888 | 100.0% |
Housing Finances in Washington Mills
Median Income by Occupancy in Washington Mills
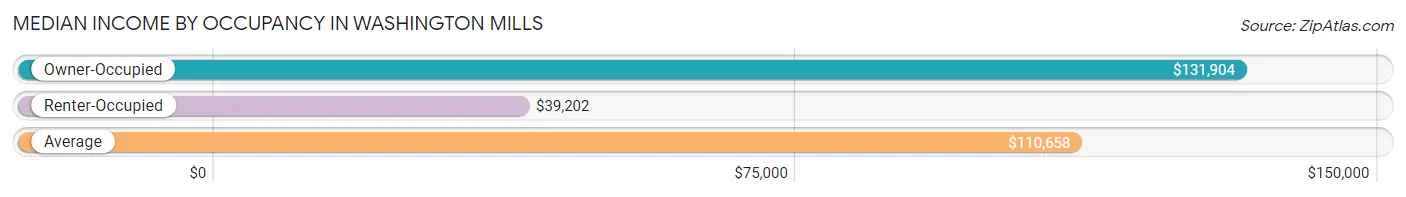
| Occupancy Type | # Households | Median Income |
| Owner-Occupied | 492 (55.4%) | $131,904 |
| Renter-Occupied | 396 (44.6%) | $39,202 |
| Average | 888 (100.0%) | $110,658 |
Occupancy by Householder Income Bracket in Washington Mills
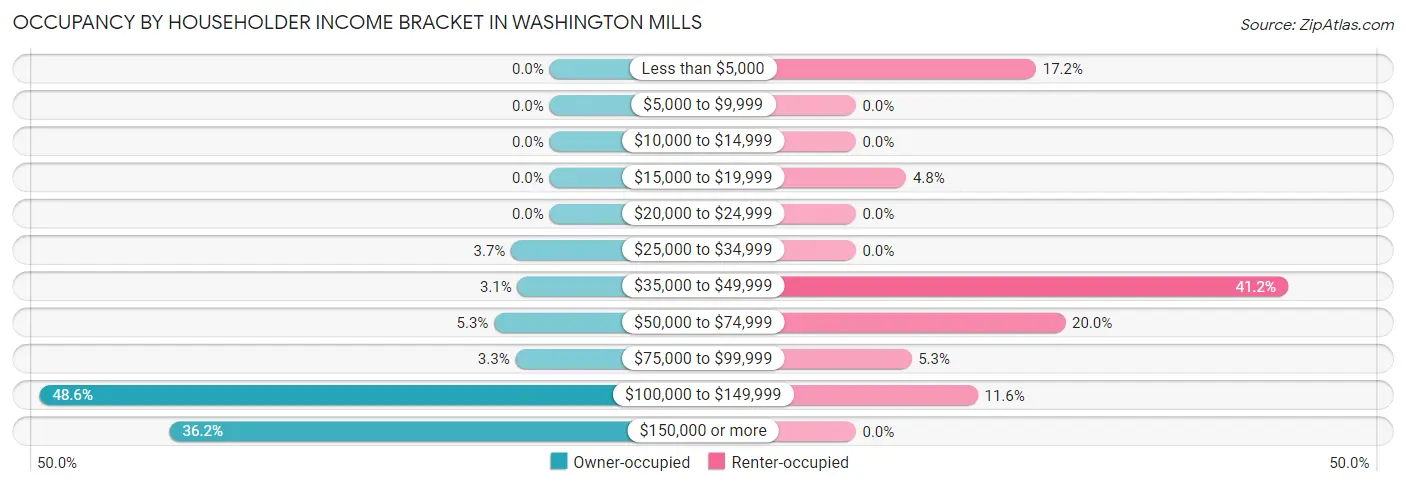
| Income Bracket | Owner-occupied | Renter-occupied |
| Less than $5,000 | 0 (0.0%) | 68 (17.2%) |
| $5,000 to $9,999 | 0 (0.0%) | 0 (0.0%) |
| $10,000 to $14,999 | 0 (0.0%) | 0 (0.0%) |
| $15,000 to $19,999 | 0 (0.0%) | 19 (4.8%) |
| $20,000 to $24,999 | 0 (0.0%) | 0 (0.0%) |
| $25,000 to $34,999 | 18 (3.7%) | 0 (0.0%) |
| $35,000 to $49,999 | 15 (3.0%) | 163 (41.2%) |
| $50,000 to $74,999 | 26 (5.3%) | 79 (20.0%) |
| $75,000 to $99,999 | 16 (3.3%) | 21 (5.3%) |
| $100,000 to $149,999 | 239 (48.6%) | 46 (11.6%) |
| $150,000 or more | 178 (36.2%) | 0 (0.0%) |
| Total | 492 (100.0%) | 396 (100.0%) |
Monthly Housing Cost Tiers in Washington Mills
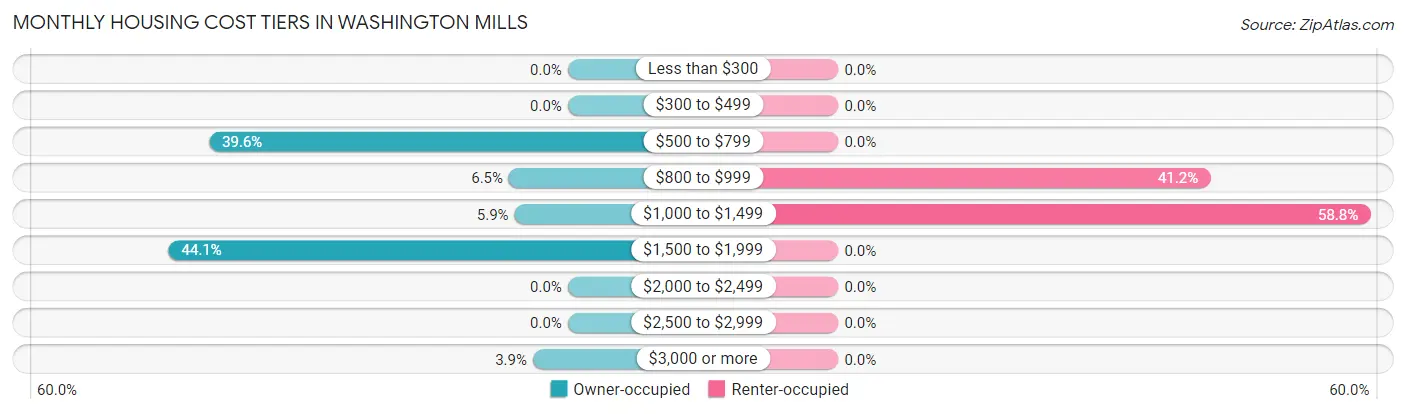
| Monthly Cost | Owner-occupied | Renter-occupied |
| Less than $300 | 0 (0.0%) | 0 (0.0%) |
| $300 to $499 | 0 (0.0%) | 0 (0.0%) |
| $500 to $799 | 195 (39.6%) | 0 (0.0%) |
| $800 to $999 | 32 (6.5%) | 163 (41.2%) |
| $1,000 to $1,499 | 29 (5.9%) | 233 (58.8%) |
| $1,500 to $1,999 | 217 (44.1%) | 0 (0.0%) |
| $2,000 to $2,499 | 0 (0.0%) | 0 (0.0%) |
| $2,500 to $2,999 | 0 (0.0%) | 0 (0.0%) |
| $3,000 or more | 19 (3.9%) | 0 (0.0%) |
| Total | 492 (100.0%) | 396 (100.0%) |
Physical Housing Characteristics in Washington Mills
Housing Structures in Washington Mills
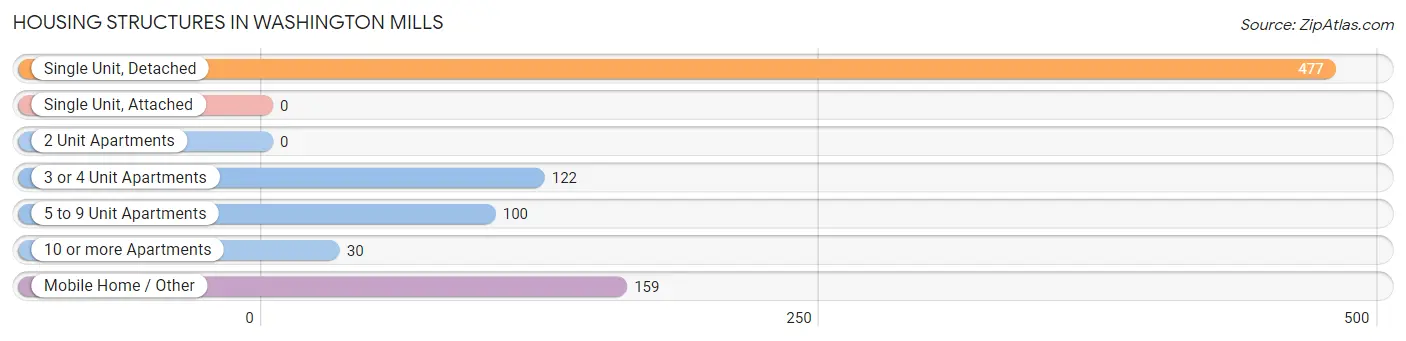
| Structure Type | # Housing Units | % Housing Units |
| Single Unit, Detached | 477 | 53.7% |
| Single Unit, Attached | 0 | 0.0% |
| 2 Unit Apartments | 0 | 0.0% |
| 3 or 4 Unit Apartments | 122 | 13.7% |
| 5 to 9 Unit Apartments | 100 | 11.3% |
| 10 or more Apartments | 30 | 3.4% |
| Mobile Home / Other | 159 | 17.9% |
| Total | 888 | 100.0% |
Housing Structures by Occupancy in Washington Mills
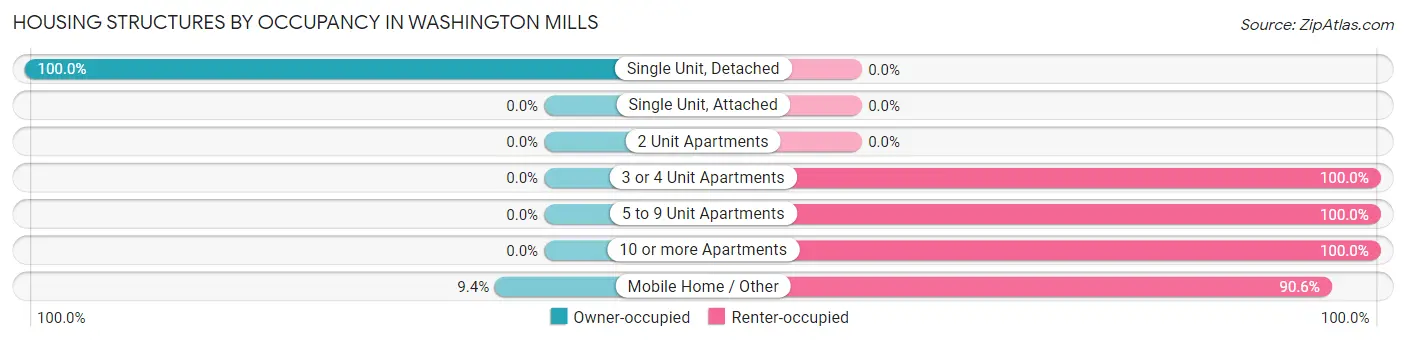
| Structure Type | Owner-occupied | Renter-occupied |
| Single Unit, Detached | 477 (100.0%) | 0 (0.0%) |
| Single Unit, Attached | 0 (0.0%) | 0 (0.0%) |
| 2 Unit Apartments | 0 (0.0%) | 0 (0.0%) |
| 3 or 4 Unit Apartments | 0 (0.0%) | 122 (100.0%) |
| 5 to 9 Unit Apartments | 0 (0.0%) | 100 (100.0%) |
| 10 or more Apartments | 0 (0.0%) | 30 (100.0%) |
| Mobile Home / Other | 15 (9.4%) | 144 (90.6%) |
| Total | 492 (55.4%) | 396 (44.6%) |
Housing Structures by Number of Rooms in Washington Mills
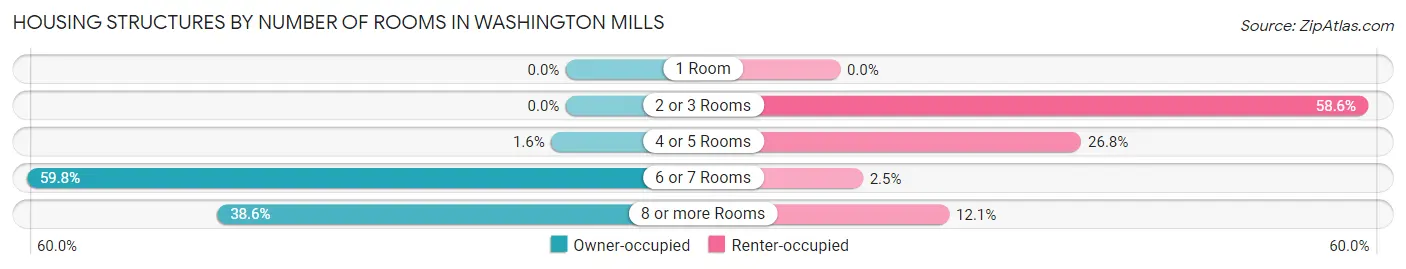
| Number of Rooms | Owner-occupied | Renter-occupied |
| 1 Room | 0 (0.0%) | 0 (0.0%) |
| 2 or 3 Rooms | 0 (0.0%) | 232 (58.6%) |
| 4 or 5 Rooms | 8 (1.6%) | 106 (26.8%) |
| 6 or 7 Rooms | 294 (59.8%) | 10 (2.5%) |
| 8 or more Rooms | 190 (38.6%) | 48 (12.1%) |
| Total | 492 (100.0%) | 396 (100.0%) |
Housing Structure by Heating Type in Washington Mills
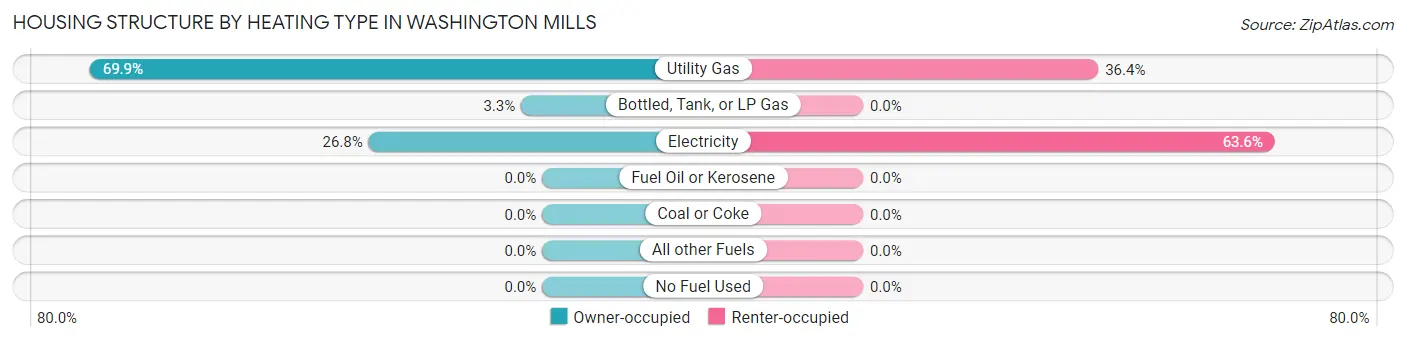
| Heating Type | Owner-occupied | Renter-occupied |
| Utility Gas | 344 (69.9%) | 144 (36.4%) |
| Bottled, Tank, or LP Gas | 16 (3.3%) | 0 (0.0%) |
| Electricity | 132 (26.8%) | 252 (63.6%) |
| Fuel Oil or Kerosene | 0 (0.0%) | 0 (0.0%) |
| Coal or Coke | 0 (0.0%) | 0 (0.0%) |
| All other Fuels | 0 (0.0%) | 0 (0.0%) |
| No Fuel Used | 0 (0.0%) | 0 (0.0%) |
| Total | 492 (100.0%) | 396 (100.0%) |
Household Vehicle Usage in Washington Mills
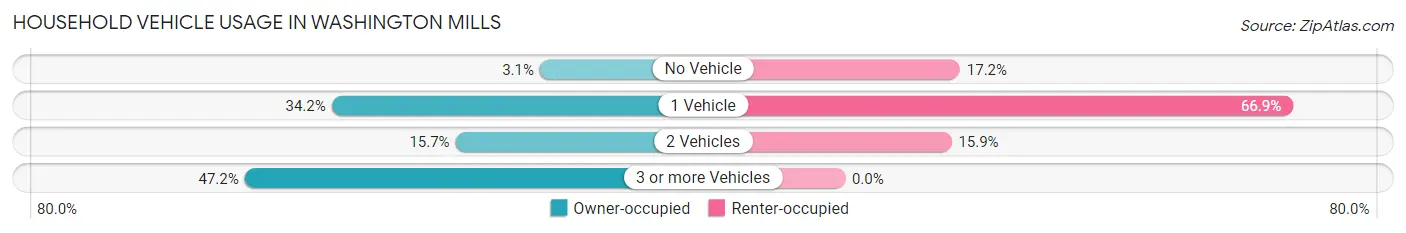
| Vehicles per Household | Owner-occupied | Renter-occupied |
| No Vehicle | 15 (3.0%) | 68 (17.2%) |
| 1 Vehicle | 168 (34.2%) | 265 (66.9%) |
| 2 Vehicles | 77 (15.7%) | 63 (15.9%) |
| 3 or more Vehicles | 232 (47.1%) | 0 (0.0%) |
| Total | 492 (100.0%) | 396 (100.0%) |
Real Estate & Mortgages in Washington Mills
Real Estate and Mortgage Overview in Washington Mills
| Characteristic | Without Mortgage | With Mortgage |
| Housing Units | 263 | 229 |
| Median Property Value | $167,200 | $222,900 |
| Median Household Income | $130,886 | $144 |
| Monthly Housing Costs | $674 | $0 |
| Real Estate Taxes | $4,608 | $0 |
Property Value by Mortgage Status in Washington Mills
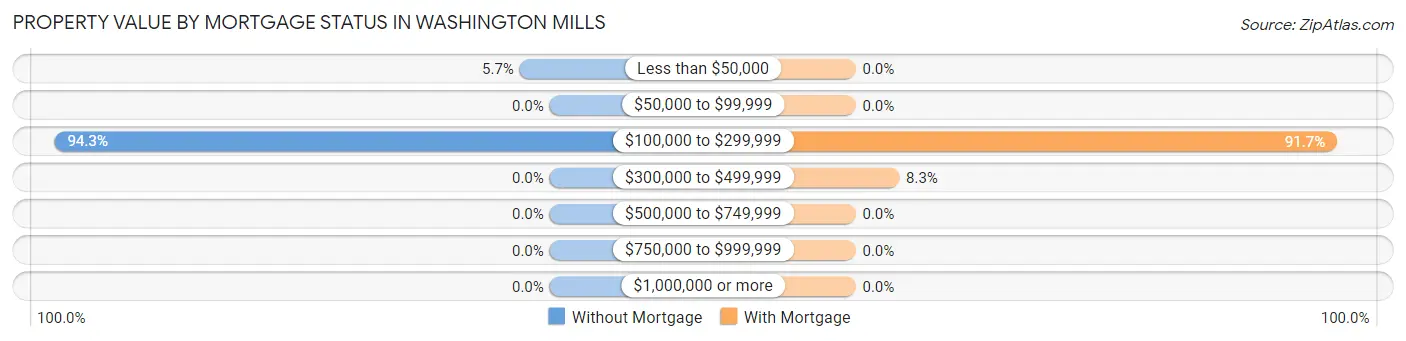
| Property Value | Without Mortgage | With Mortgage |
| Less than $50,000 | 15 (5.7%) | 0 (0.0%) |
| $50,000 to $99,999 | 0 (0.0%) | 0 (0.0%) |
| $100,000 to $299,999 | 248 (94.3%) | 210 (91.7%) |
| $300,000 to $499,999 | 0 (0.0%) | 19 (8.3%) |
| $500,000 to $749,999 | 0 (0.0%) | 0 (0.0%) |
| $750,000 to $999,999 | 0 (0.0%) | 0 (0.0%) |
| $1,000,000 or more | 0 (0.0%) | 0 (0.0%) |
| Total | 263 (100.0%) | 229 (100.0%) |
Household Income by Mortgage Status in Washington Mills
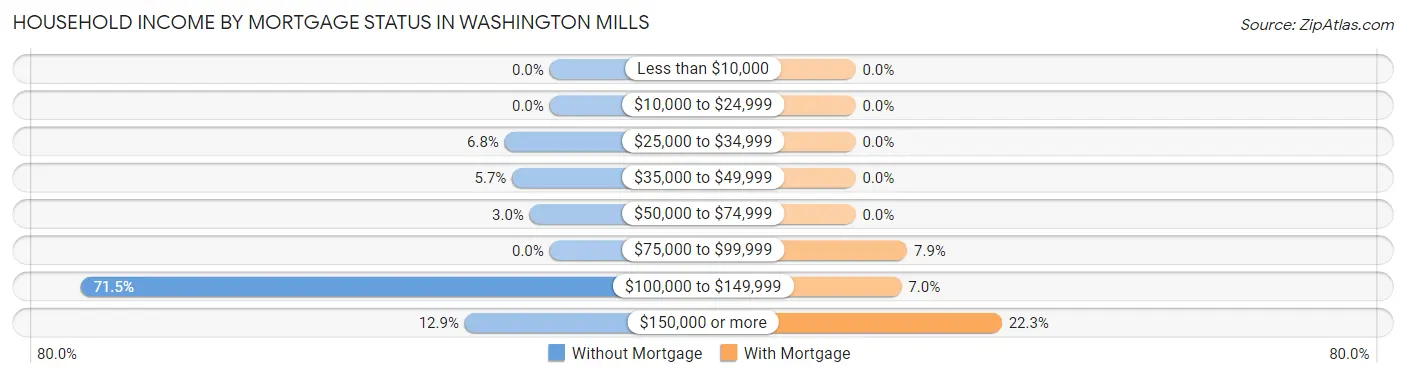
| Household Income | Without Mortgage | With Mortgage |
| Less than $10,000 | 0 (0.0%) | 0 (0.0%) |
| $10,000 to $24,999 | 0 (0.0%) | 0 (0.0%) |
| $25,000 to $34,999 | 18 (6.8%) | 0 (0.0%) |
| $35,000 to $49,999 | 15 (5.7%) | 0 (0.0%) |
| $50,000 to $74,999 | 8 (3.0%) | 0 (0.0%) |
| $75,000 to $99,999 | 0 (0.0%) | 18 (7.9%) |
| $100,000 to $149,999 | 188 (71.5%) | 16 (7.0%) |
| $150,000 or more | 34 (12.9%) | 51 (22.3%) |
| Total | 263 (100.0%) | 229 (100.0%) |
Property Value to Household Income Ratio in Washington Mills
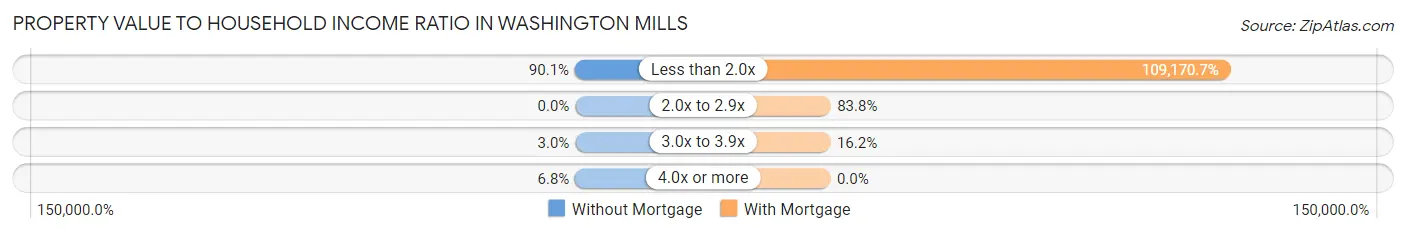
| Value-to-Income Ratio | Without Mortgage | With Mortgage |
| Less than 2.0x | 237 (90.1%) | 250,001 (109,170.7%) |
| 2.0x to 2.9x | 0 (0.0%) | 192 (83.8%) |
| 3.0x to 3.9x | 8 (3.0%) | 37 (16.2%) |
| 4.0x or more | 18 (6.8%) | 0 (0.0%) |
| Total | 263 (100.0%) | 229 (100.0%) |
Real Estate Taxes by Mortgage Status in Washington Mills
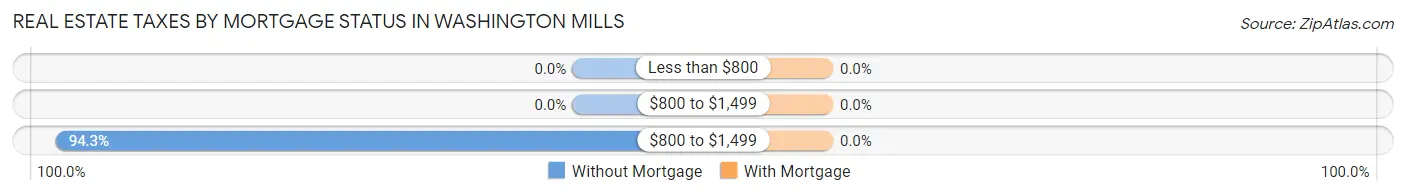
| Property Taxes | Without Mortgage | With Mortgage |
| Less than $800 | 0 (0.0%) | 0 (0.0%) |
| $800 to $1,499 | 0 (0.0%) | 0 (0.0%) |
| $800 to $1,499 | 248 (94.3%) | 0 (0.0%) |
| Total | 263 (100.0%) | 229 (100.0%) |
Health & Disability in Washington Mills
Health Insurance Coverage by Age in Washington Mills
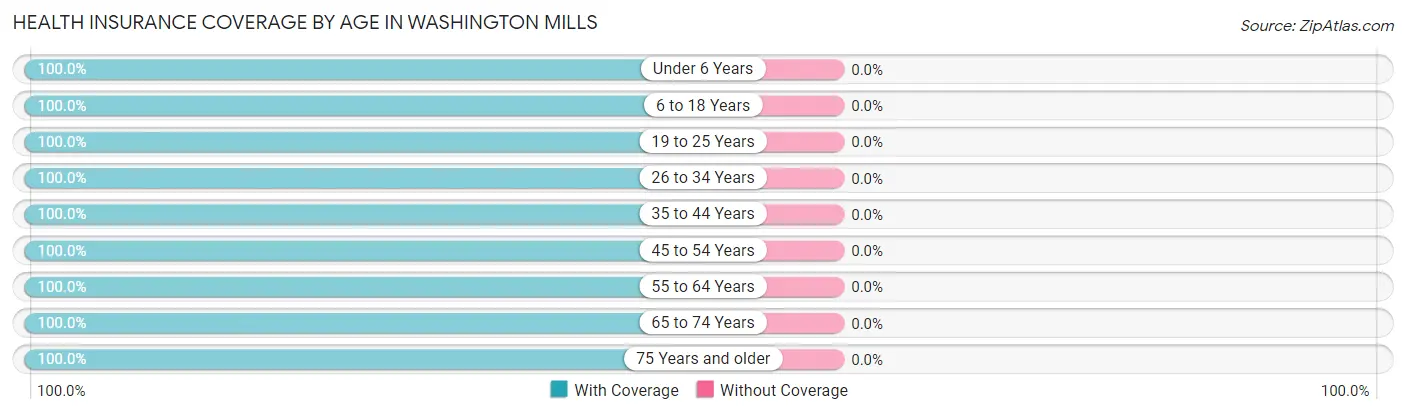
| Age Bracket | With Coverage | Without Coverage |
| Under 6 Years | 16 (100.0%) | 0 (0.0%) |
| 6 to 18 Years | 339 (100.0%) | 0 (0.0%) |
| 19 to 25 Years | 132 (100.0%) | 0 (0.0%) |
| 26 to 34 Years | 355 (100.0%) | 0 (0.0%) |
| 35 to 44 Years | 348 (100.0%) | 0 (0.0%) |
| 45 to 54 Years | 141 (100.0%) | 0 (0.0%) |
| 55 to 64 Years | 408 (100.0%) | 0 (0.0%) |
| 65 to 74 Years | 26 (100.0%) | 0 (0.0%) |
| 75 Years and older | 145 (100.0%) | 0 (0.0%) |
| Total | 1,910 (100.0%) | 0 (0.0%) |
Health Insurance Coverage by Citizenship Status in Washington Mills
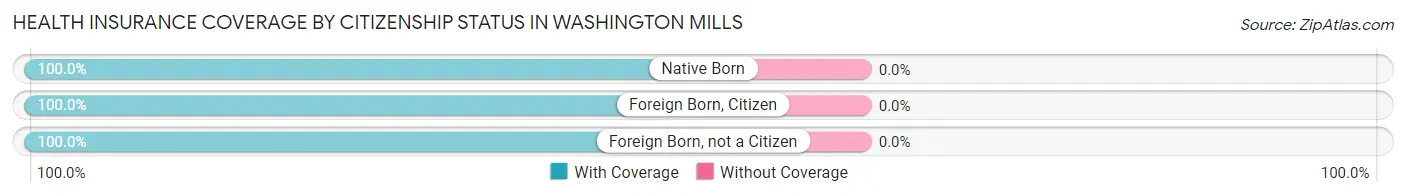
| Citizenship Status | With Coverage | Without Coverage |
| Native Born | 16 (100.0%) | 0 (0.0%) |
| Foreign Born, Citizen | 339 (100.0%) | 0 (0.0%) |
| Foreign Born, not a Citizen | 132 (100.0%) | 0 (0.0%) |
Health Insurance Coverage by Household Income in Washington Mills
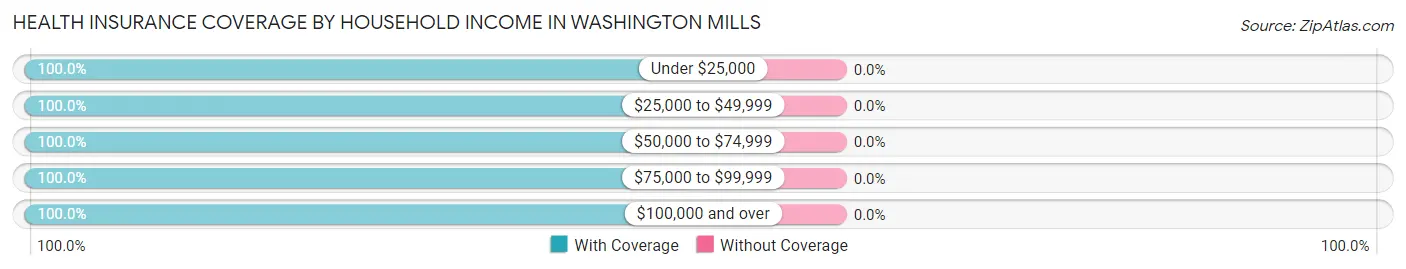
| Household Income | With Coverage | Without Coverage |
| Under $25,000 | 87 (100.0%) | 0 (0.0%) |
| $25,000 to $49,999 | 345 (100.0%) | 0 (0.0%) |
| $50,000 to $74,999 | 175 (100.0%) | 0 (0.0%) |
| $75,000 to $99,999 | 89 (100.0%) | 0 (0.0%) |
| $100,000 and over | 1,199 (100.0%) | 0 (0.0%) |
Public vs Private Health Insurance Coverage by Age in Washington Mills
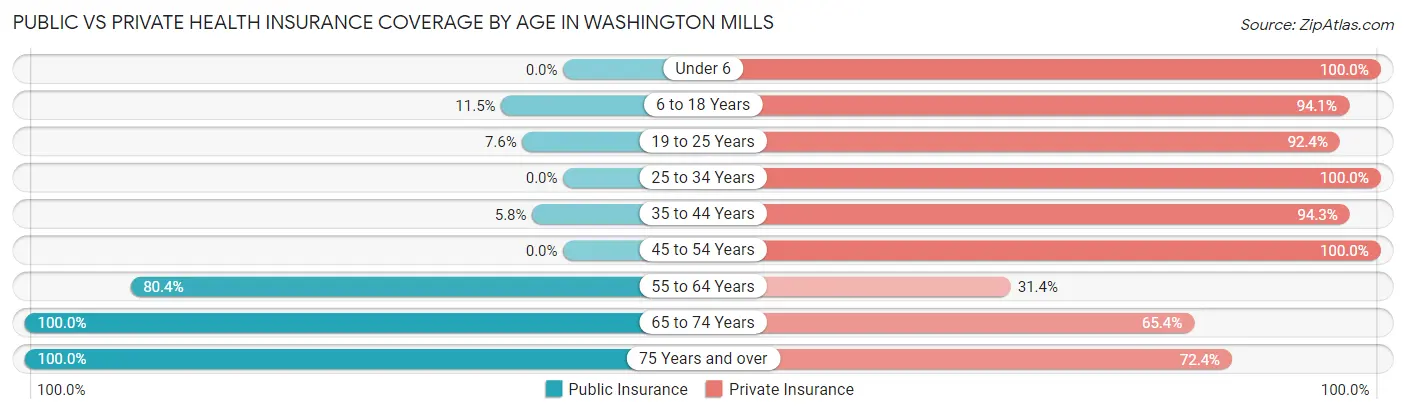
| Age Bracket | Public Insurance | Private Insurance |
| Under 6 | 0 (0.0%) | 16 (100.0%) |
| 6 to 18 Years | 39 (11.5%) | 319 (94.1%) |
| 19 to 25 Years | 10 (7.6%) | 122 (92.4%) |
| 25 to 34 Years | 0 (0.0%) | 355 (100.0%) |
| 35 to 44 Years | 20 (5.8%) | 328 (94.3%) |
| 45 to 54 Years | 0 (0.0%) | 141 (100.0%) |
| 55 to 64 Years | 328 (80.4%) | 128 (31.4%) |
| 65 to 74 Years | 26 (100.0%) | 17 (65.4%) |
| 75 Years and over | 145 (100.0%) | 105 (72.4%) |
| Total | 568 (29.7%) | 1,531 (80.2%) |
Disability Status by Sex by Age in Washington Mills
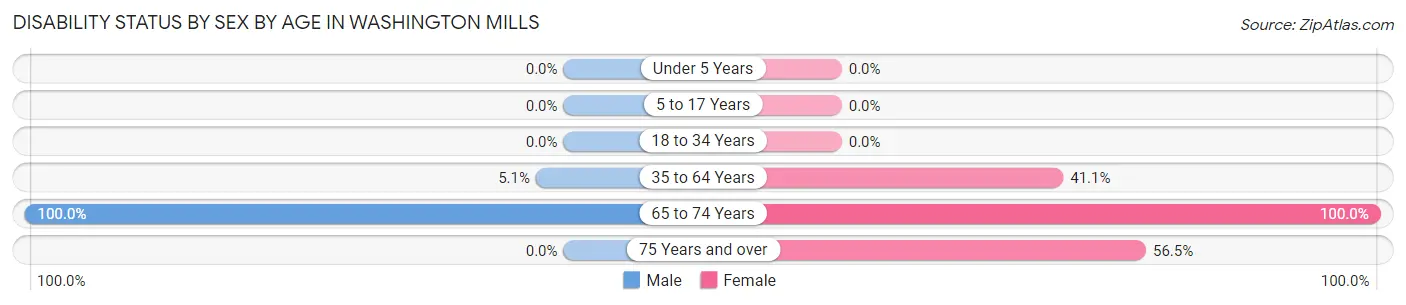
| Age Bracket | Male | Female |
| Under 5 Years | 0 (0.0%) | 0 (0.0%) |
| 5 to 17 Years | 0 (0.0%) | 0 (0.0%) |
| 18 to 34 Years | 0 (0.0%) | 0 (0.0%) |
| 35 to 64 Years | 22 (5.1%) | 192 (41.1%) |
| 65 to 74 Years | 22 (100.0%) | 4 (100.0%) |
| 75 Years and over | 0 (0.0%) | 48 (56.5%) |
Disability Class by Sex by Age in Washington Mills
Disability Class: Hearing Difficulty
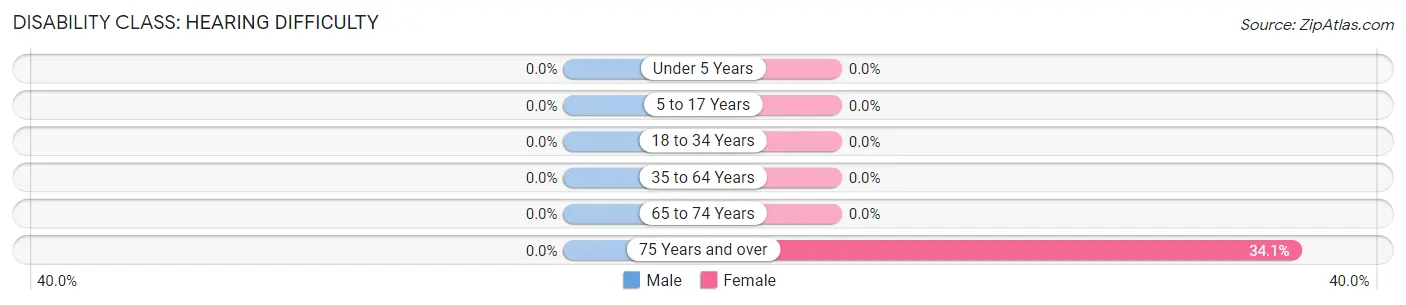
| Age Bracket | Male | Female |
| Under 5 Years | 0 (0.0%) | 0 (0.0%) |
| 5 to 17 Years | 0 (0.0%) | 0 (0.0%) |
| 18 to 34 Years | 0 (0.0%) | 0 (0.0%) |
| 35 to 64 Years | 0 (0.0%) | 0 (0.0%) |
| 65 to 74 Years | 0 (0.0%) | 0 (0.0%) |
| 75 Years and over | 0 (0.0%) | 29 (34.1%) |
Disability Class: Vision Difficulty
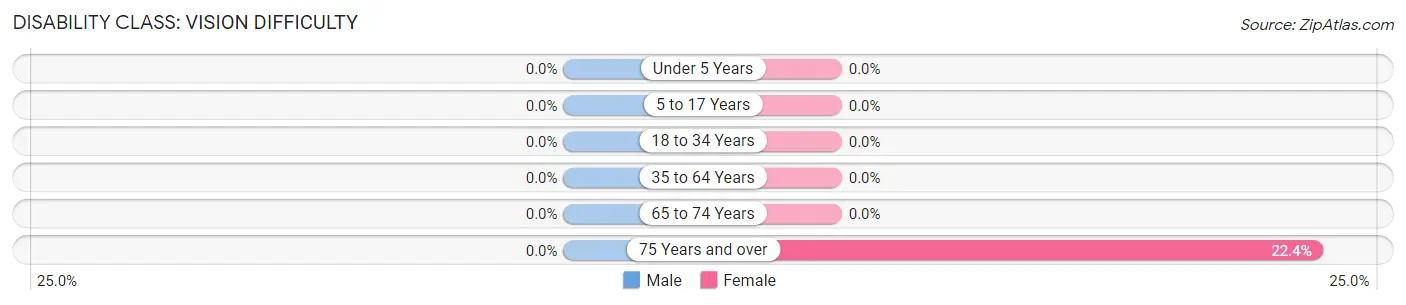
| Age Bracket | Male | Female |
| Under 5 Years | 0 (0.0%) | 0 (0.0%) |
| 5 to 17 Years | 0 (0.0%) | 0 (0.0%) |
| 18 to 34 Years | 0 (0.0%) | 0 (0.0%) |
| 35 to 64 Years | 0 (0.0%) | 0 (0.0%) |
| 65 to 74 Years | 0 (0.0%) | 0 (0.0%) |
| 75 Years and over | 0 (0.0%) | 19 (22.4%) |
Disability Class: Cognitive Difficulty
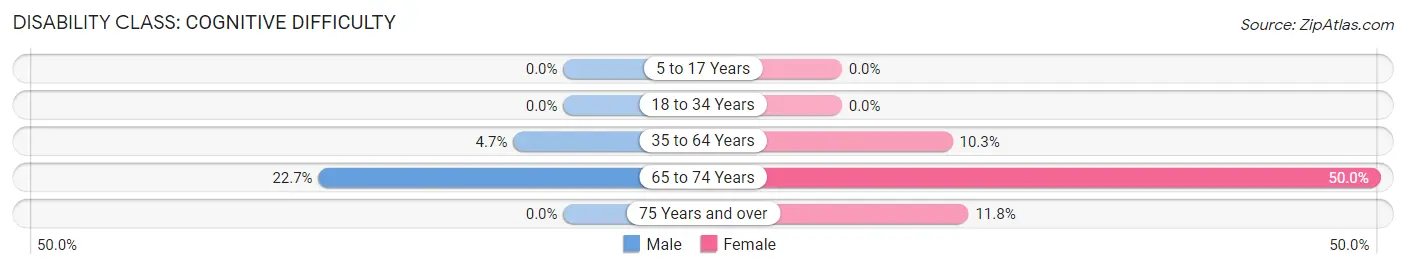
| Age Bracket | Male | Female |
| 5 to 17 Years | 0 (0.0%) | 0 (0.0%) |
| 18 to 34 Years | 0 (0.0%) | 0 (0.0%) |
| 35 to 64 Years | 20 (4.6%) | 48 (10.3%) |
| 65 to 74 Years | 5 (22.7%) | 2 (50.0%) |
| 75 Years and over | 0 (0.0%) | 10 (11.8%) |
Disability Class: Ambulatory Difficulty
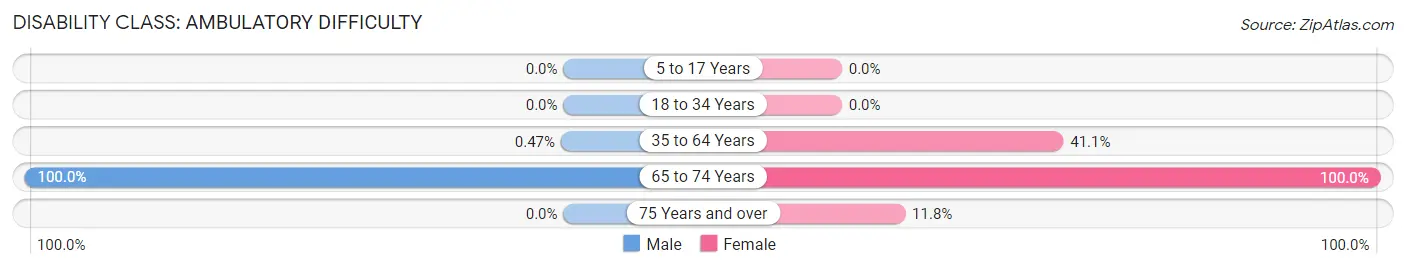
| Age Bracket | Male | Female |
| 5 to 17 Years | 0 (0.0%) | 0 (0.0%) |
| 18 to 34 Years | 0 (0.0%) | 0 (0.0%) |
| 35 to 64 Years | 2 (0.5%) | 192 (41.1%) |
| 65 to 74 Years | 22 (100.0%) | 4 (100.0%) |
| 75 Years and over | 0 (0.0%) | 10 (11.8%) |
Disability Class: Self-Care Difficulty
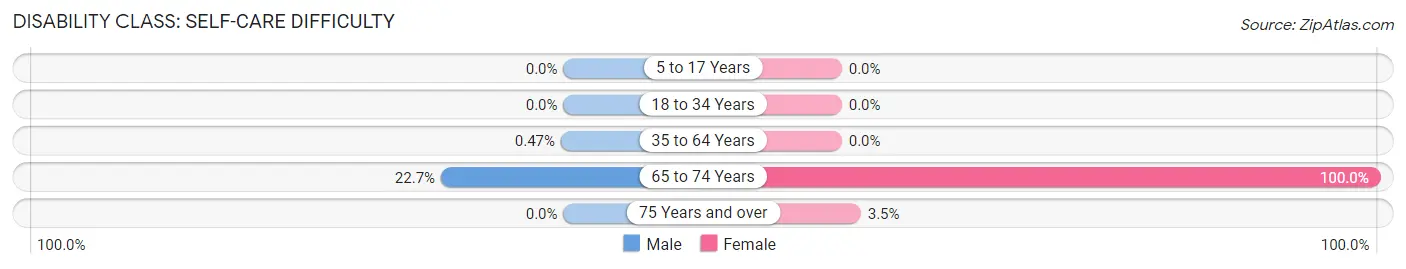
| Age Bracket | Male | Female |
| 5 to 17 Years | 0 (0.0%) | 0 (0.0%) |
| 18 to 34 Years | 0 (0.0%) | 0 (0.0%) |
| 35 to 64 Years | 2 (0.5%) | 0 (0.0%) |
| 65 to 74 Years | 5 (22.7%) | 4 (100.0%) |
| 75 Years and over | 0 (0.0%) | 3 (3.5%) |
Technology Access in Washington Mills
Computing Device Access in Washington Mills
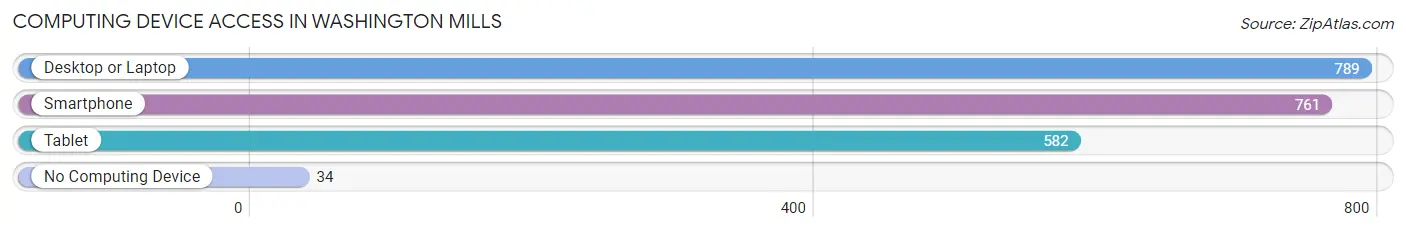
| Device Type | # Households | % Households |
| Desktop or Laptop | 789 | 88.8% |
| Smartphone | 761 | 85.7% |
| Tablet | 582 | 65.5% |
| No Computing Device | 34 | 3.8% |
| Total | 888 | 100.0% |
Internet Access in Washington Mills
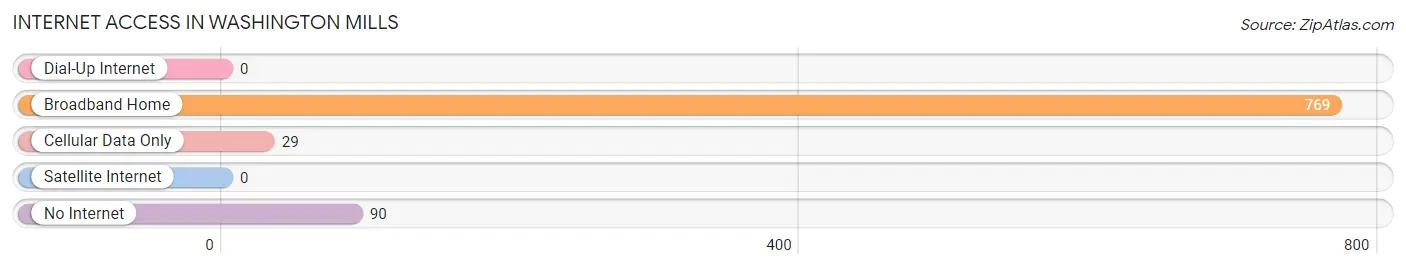
| Internet Type | # Households | % Households |
| Dial-Up Internet | 0 | 0.0% |
| Broadband Home | 769 | 86.6% |
| Cellular Data Only | 29 | 3.3% |
| Satellite Internet | 0 | 0.0% |
| No Internet | 90 | 10.1% |
| Total | 888 | 100.0% |
Washington Mills Summary
History
The town of Washington Mills, New York is located in the northern part of Oneida County, in the state of New York. The town was first settled in 1790 by a group of settlers from Connecticut. The town was originally known as “New Hartford”, but was later changed to Washington Mills in 1810 in honor of George Washington. The town was officially incorporated in 1817.
The town of Washington Mills was originally a farming community, with the main crops being wheat, corn, and potatoes. The town also had a number of small businesses, such as sawmills, gristmills, and tanneries. The town was also home to a number of small manufacturing businesses, such as a paper mill, a woolen mill, and a cotton mill.
The town of Washington Mills was also home to a number of churches, including the First Congregational Church, the Methodist Episcopal Church, and the Presbyterian Church. The town also had a number of schools, including the Washington Mills Academy, which was founded in 1820.
The town of Washington Mills was also home to a number of notable people, including the abolitionist and women’s rights activist, Elizabeth Cady Stanton, who was born in the town in 1815.
Geography
Washington Mills is located in the northern part of Oneida County, in the state of New York. The town is bordered by the towns of New Hartford to the north, Whitestown to the east, Marcy to the south, and Floyd to the west. The town is located approximately 25 miles north of the city of Utica, and approximately 50 miles east of Syracuse.
The town of Washington Mills is located in the foothills of the Adirondack Mountains, and is part of the Mohawk Valley region. The town is located on the banks of the Mohawk River, and is home to a number of small lakes and streams. The town is also home to a number of parks and recreational areas, including the Washington Mills State Park.
Economy
The economy of Washington Mills is largely based on agriculture and manufacturing. The town is home to a number of small farms, which produce a variety of crops, including wheat, corn, and potatoes. The town is also home to a number of small manufacturing businesses, such as a paper mill, a woolen mill, and a cotton mill.
The town is also home to a number of retail businesses, including a number of small shops and restaurants. The town is also home to a number of small businesses, such as auto repair shops, construction companies, and landscaping businesses.
Demographics
The town of Washington Mills has a population of approximately 4,000 people, according to the 2010 census. The town has a median household income of $50,000, and a median home value of $150,000. The town is predominantly white, with approximately 90% of the population being white. The town also has a small Hispanic population, with approximately 5% of the population being Hispanic. The town also has a small African American population, with approximately 2% of the population being African American.
Common Questions
What is Per Capita Income in Washington Mills?
Per Capita income in Washington Mills is $44,926.
What is the Median Family Income in Washington Mills?
Median Family Income in Washington Mills is $130,349.
What is the Median Household income in Washington Mills?
Median Household Income in Washington Mills is $110,658.
What is Income or Wage Gap in Washington Mills?
Income or Wage Gap in Washington Mills is 60.0%.
Women in Washington Mills earn 40.0 cents for every dollar earned by a man.
What is Inequality or Gini Index in Washington Mills?
Inequality or Gini Index in Washington Mills is 0.42.
What is the Total Population of Washington Mills?
Total Population of Washington Mills is 1,910.
What is the Total Male Population of Washington Mills?
Total Male Population of Washington Mills is 919.
What is the Total Female Population of Washington Mills?
Total Female Population of Washington Mills is 991.
What is the Ratio of Males per 100 Females in Washington Mills?
There are 92.73 Males per 100 Females in Washington Mills.
What is the Ratio of Females per 100 Males in Washington Mills?
There are 107.83 Females per 100 Males in Washington Mills.
What is the Median Population Age in Washington Mills?
Median Population Age in Washington Mills is 41.5 Years.
What is the Average Family Size in Washington Mills
Average Family Size in Washington Mills is 2.5 People.
What is the Average Household Size in Washington Mills
Average Household Size in Washington Mills is 2.1 People.
How Large is the Labor Force in Washington Mills?
There are 1,288 People in the Labor Forcein in Washington Mills.
What is the Percentage of People in the Labor Force in Washington Mills?
82.8% of People are in the Labor Force in Washington Mills.
What is the Unemployment Rate in Washington Mills?
Unemployment Rate in Washington Mills is 1.1%.