Sagaponack, NY Map & Demographics
Sagaponack Map
Sagaponack Overview
$147,499
PER CAPITA INCOME
$130,893
AVG FAMILY INCOME
$86,375
AVG HOUSEHOLD INCOME
12.5%
WAGE / INCOME GAP [ % ]
87.5¢/ $1
WAGE / INCOME GAP [ $ ]
0.67
INEQUALITY / GINI INDEX
344
TOTAL POPULATION
162
MALE POPULATION
182
FEMALE POPULATION
89.01
MALES / 100 FEMALES
112.35
FEMALES / 100 MALES
60.6
MEDIAN AGE
3.0
AVG FAMILY SIZE
2.1
AVG HOUSEHOLD SIZE
127
LABOR FORCE [ PEOPLE ]
42.5%
PERCENT IN LABOR FORCE
Sagaponack Zip Codes
Sagaponack Area Codes
Income in Sagaponack
Income Overview in Sagaponack
Per Capita Income in Sagaponack is $147,499, while median incomes of families and households are $130,893 and $86,375 respectively.
| Characteristic | Number | Measure |
| Per Capita Income | 344 | $147,499 |
| Median Family Income | 94 | $130,893 |
| Mean Family Income | 94 | $393,266 |
| Median Household Income | 161 | $86,375 |
| Mean Household Income | 161 | $316,703 |
| Income Deficit | 94 | $0 |
| Wage / Income Gap (%) | 344 | 12.50% |
| Wage / Income Gap ($) | 344 | 87.50¢ per $1 |
| Gini / Inequality Index | 344 | 0.67 |
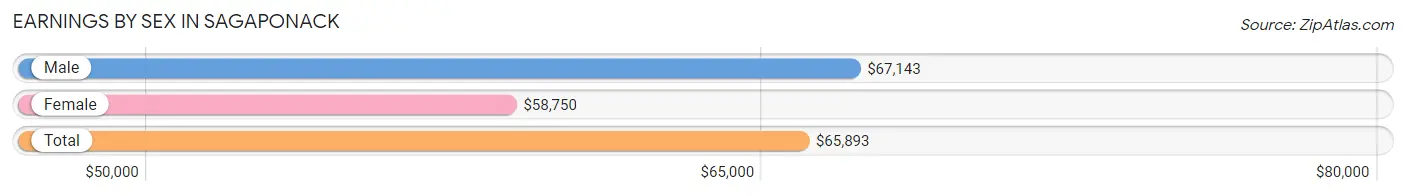
Earnings by Sex in Sagaponack
Average Earnings in Sagaponack are $65,893, $67,143 for men and $58,750 for women, a difference of 12.5%.
| Sex | Number | Average Earnings |
| Male | 40 (31.0%) | $67,143 |
| Female | 89 (69.0%) | $58,750 |
| Total | 129 (100.0%) | $65,893 |
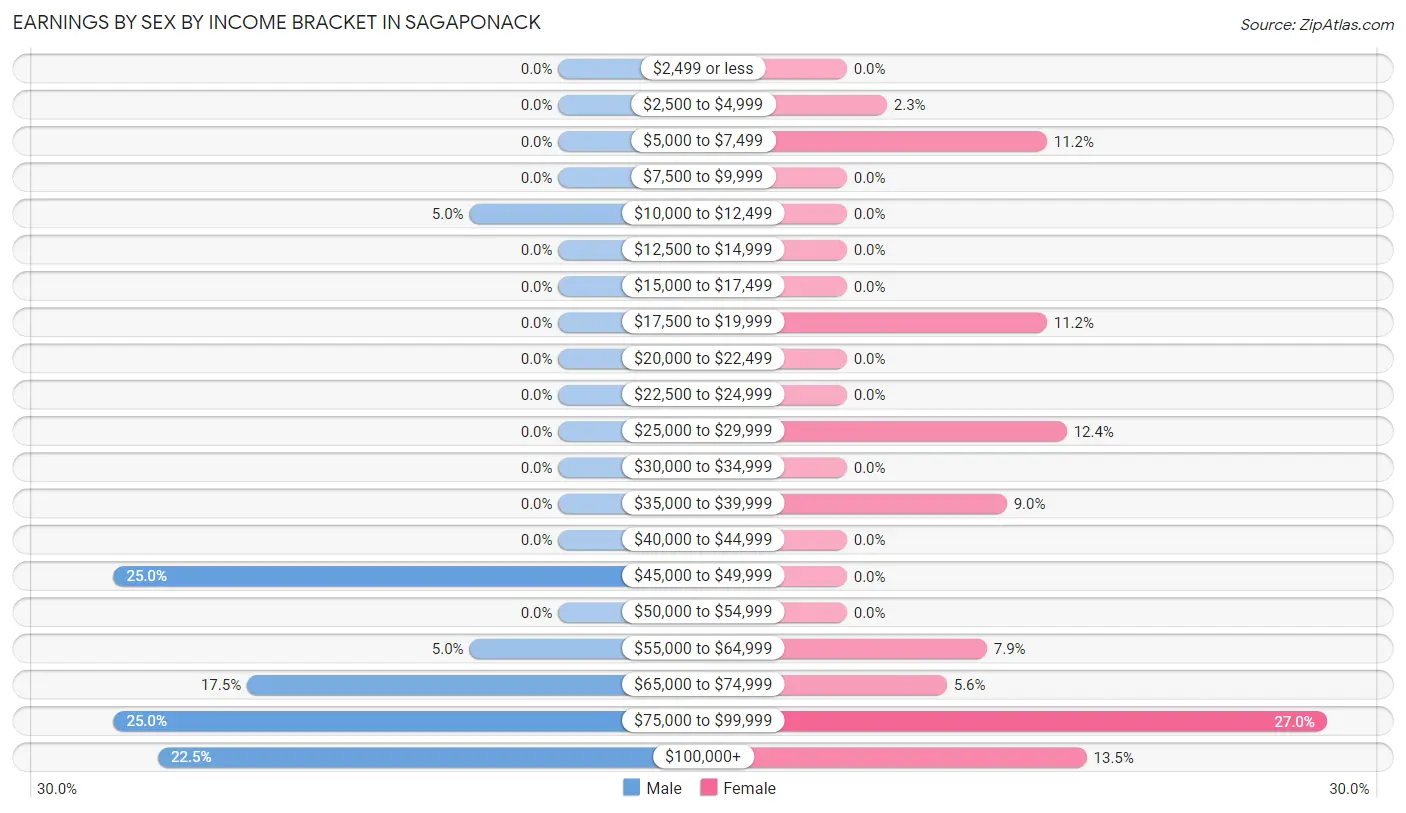
Earnings by Sex by Income Bracket in Sagaponack
The most common earnings brackets in Sagaponack are $45,000 to $49,999 for men (10 | 25.0%) and $75,000 to $99,999 for women (24 | 27.0%).
| Income | Male | Female |
| $2,499 or less | 0 (0.0%) | 0 (0.0%) |
| $2,500 to $4,999 | 0 (0.0%) | 2 (2.2%) |
| $5,000 to $7,499 | 0 (0.0%) | 10 (11.2%) |
| $7,500 to $9,999 | 0 (0.0%) | 0 (0.0%) |
| $10,000 to $12,499 | 2 (5.0%) | 0 (0.0%) |
| $12,500 to $14,999 | 0 (0.0%) | 0 (0.0%) |
| $15,000 to $17,499 | 0 (0.0%) | 0 (0.0%) |
| $17,500 to $19,999 | 0 (0.0%) | 10 (11.2%) |
| $20,000 to $22,499 | 0 (0.0%) | 0 (0.0%) |
| $22,500 to $24,999 | 0 (0.0%) | 0 (0.0%) |
| $25,000 to $29,999 | 0 (0.0%) | 11 (12.4%) |
| $30,000 to $34,999 | 0 (0.0%) | 0 (0.0%) |
| $35,000 to $39,999 | 0 (0.0%) | 8 (9.0%) |
| $40,000 to $44,999 | 0 (0.0%) | 0 (0.0%) |
| $45,000 to $49,999 | 10 (25.0%) | 0 (0.0%) |
| $50,000 to $54,999 | 0 (0.0%) | 0 (0.0%) |
| $55,000 to $64,999 | 2 (5.0%) | 7 (7.9%) |
| $65,000 to $74,999 | 7 (17.5%) | 5 (5.6%) |
| $75,000 to $99,999 | 10 (25.0%) | 24 (27.0%) |
| $100,000+ | 9 (22.5%) | 12 (13.5%) |
| Total | 40 (100.0%) | 89 (100.0%) |
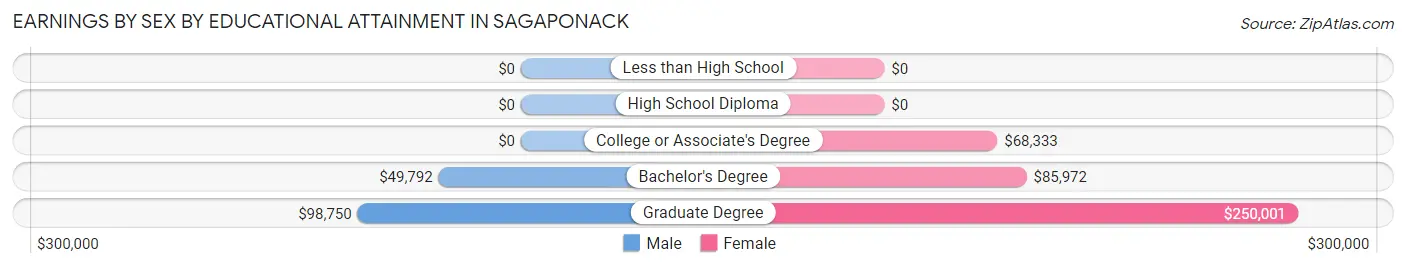
Earnings by Sex by Educational Attainment in Sagaponack
Average earnings in Sagaponack are $67,143 for men and $68,750 for women, a difference of 2.3%. Men with an educational attainment of graduate degree enjoy the highest average annual earnings of $98,750, while those with bachelor's degree education earn the least with $49,792. Women with an educational attainment of graduate degree earn the most with the average annual earnings of $250,001, while those with college or associate's degree education have the smallest earnings of $68,333.
| Educational Attainment | Male Income | Female Income |
| Less than High School | - | - |
| High School Diploma | - | - |
| College or Associate's Degree | - | - |
| Bachelor's Degree | $49,792 | $85,972 |
| Graduate Degree | $98,750 | $250,001 |
| Total | $67,143 | $68,750 |
Family Income in Sagaponack
Family Income Brackets in Sagaponack
According to the Sagaponack family income data, there are 38 families falling into the $200,000+ income range, which is the most common income bracket and makes up 40.4% of all families.
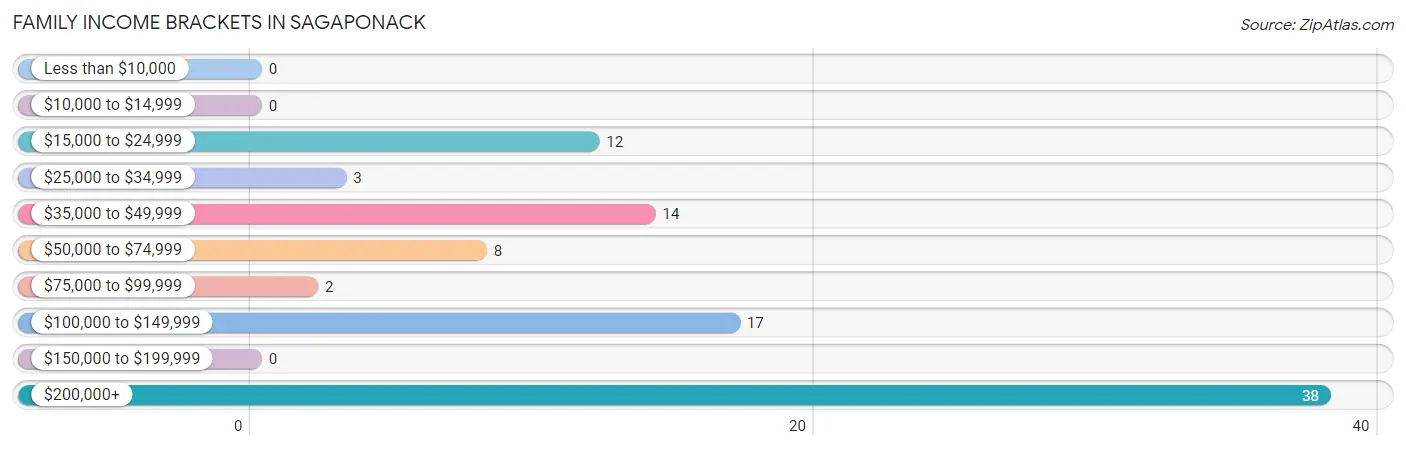
| Income Bracket | # Families | % Families |
| Less than $10,000 | 0 | 0.0% |
| $10,000 to $14,999 | 0 | 0.0% |
| $15,000 to $24,999 | 12 | 12.8% |
| $25,000 to $34,999 | 3 | 3.2% |
| $35,000 to $49,999 | 14 | 14.9% |
| $50,000 to $74,999 | 8 | 8.5% |
| $75,000 to $99,999 | 2 | 2.1% |
| $100,000 to $149,999 | 17 | 18.1% |
| $150,000 to $199,999 | 0 | 0.0% |
| $200,000+ | 38 | 40.4% |
Family Income by Famaliy Size in Sagaponack
2-person families (48 | 51.1%) account for the highest median family income in Sagaponack with $250,001 per family, while 2-person families (48 | 51.1%) have the highest median income of $125,000 per family member.
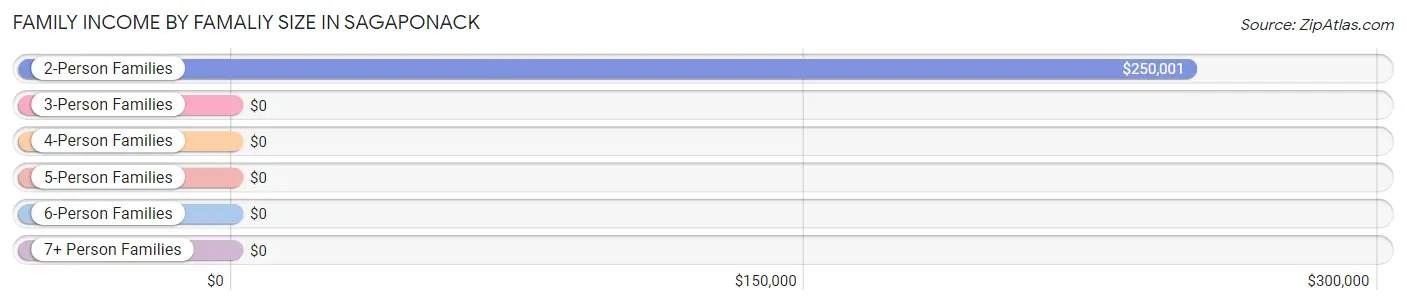
| Income Bracket | # Families | Median Income |
| 2-Person Families | 48 (51.1%) | $250,001 |
| 3-Person Families | 13 (13.8%) | $0 |
| 4-Person Families | 22 (23.4%) | $0 |
| 5-Person Families | 11 (11.7%) | $0 |
| 6-Person Families | 0 (0.0%) | $0 |
| 7+ Person Families | 0 (0.0%) | $0 |
| Total | 94 (100.0%) | $130,893 |
Family Income by Number of Earners in Sagaponack
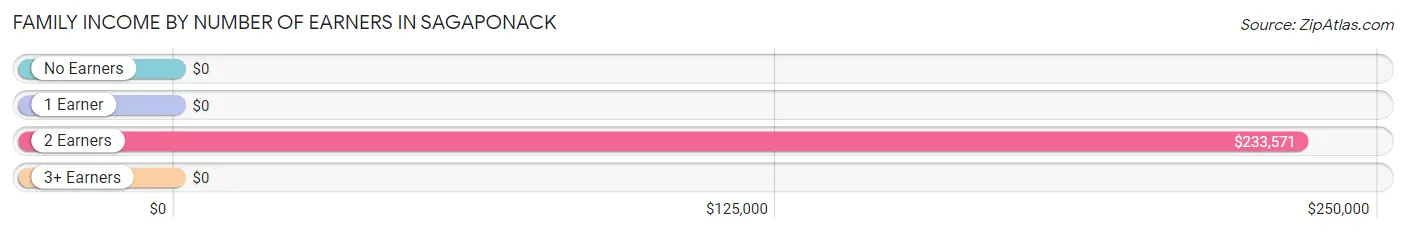
| Number of Earners | # Families | Median Income |
| No Earners | 21 (22.3%) | $0 |
| 1 Earner | 37 (39.4%) | $0 |
| 2 Earners | 34 (36.2%) | $233,571 |
| 3+ Earners | 2 (2.1%) | $0 |
| Total | 94 (100.0%) | $130,893 |
Household Income in Sagaponack
Household Income Brackets in Sagaponack
With 48 households falling in the category, the $200,000+ income range is the most frequent in Sagaponack, accounting for 29.8% of all households.
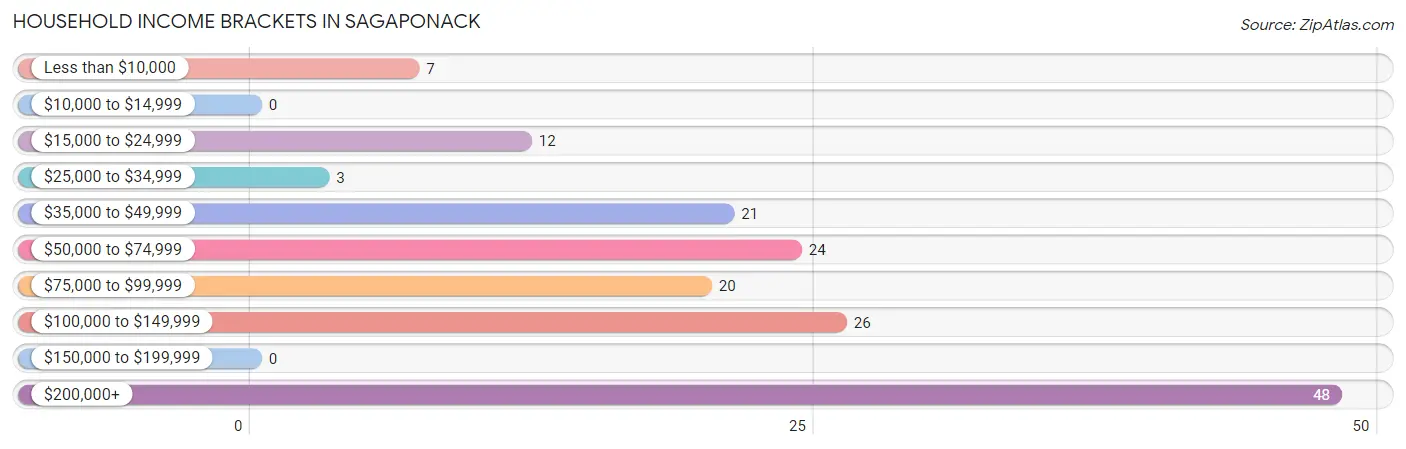
| Income Bracket | # Households | % Households |
| Less than $10,000 | 7 | 4.3% |
| $10,000 to $14,999 | 0 | 0.0% |
| $15,000 to $24,999 | 12 | 7.5% |
| $25,000 to $34,999 | 3 | 1.9% |
| $35,000 to $49,999 | 21 | 13.0% |
| $50,000 to $74,999 | 24 | 14.9% |
| $75,000 to $99,999 | 20 | 12.4% |
| $100,000 to $149,999 | 26 | 16.1% |
| $150,000 to $199,999 | 0 | 0.0% |
| $200,000+ | 48 | 29.8% |
Household Income by Householder Age in Sagaponack
The median household income in Sagaponack is $86,375, with the highest median household income of $90,000 found in the 65+ years age bracket for the primary householder. A total of 80 households (49.7%) fall into this category. Meanwhile, the 15 to 24 years age bracket for the primary householder has the lowest median household income of $0, with 12 households (7.4%) in this group.
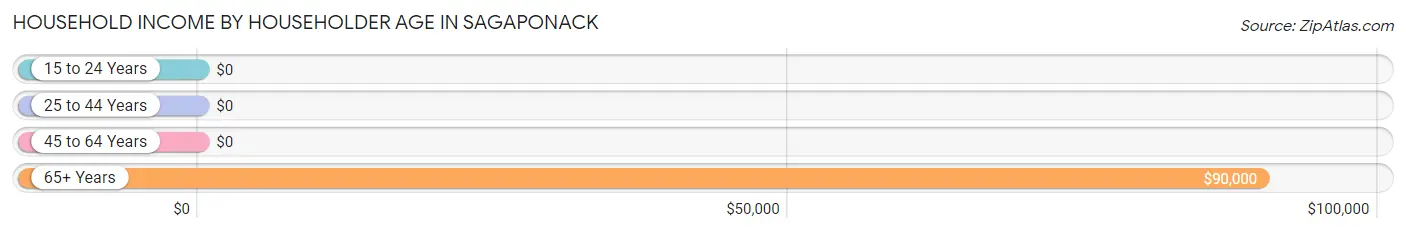
| Income Bracket | # Households | Median Income |
| 15 to 24 Years | 12 (7.4%) | $0 |
| 25 to 44 Years | 7 (4.3%) | $0 |
| 45 to 64 Years | 62 (38.5%) | $0 |
| 65+ Years | 80 (49.7%) | $90,000 |
| Total | 161 (100.0%) | $86,375 |
Poverty in Sagaponack
Income Below Poverty by Sex and Age in Sagaponack
With 17.9% poverty level for males and 9.3% for females among the residents of Sagaponack, 18 to 24 year old males and 25 to 34 year old females are the most vulnerable to poverty, with 12 males (100.0%) and 10 females (35.7%) in their respective age groups living below the poverty level.
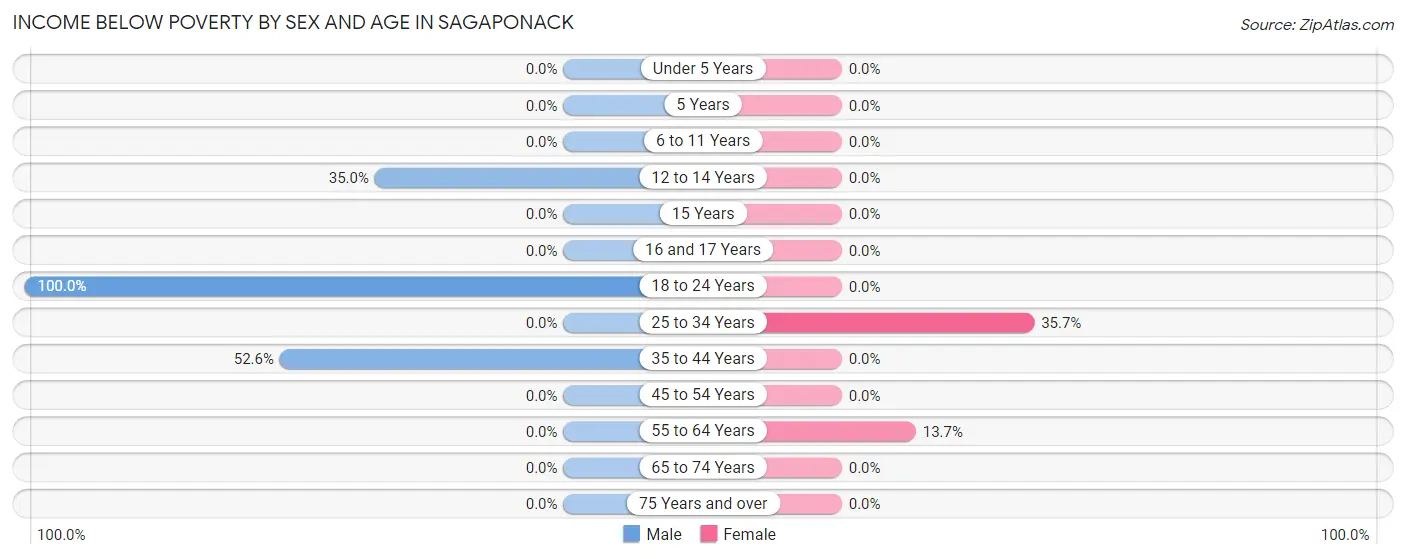
| Age Bracket | Male | Female |
| Under 5 Years | 0 (0.0%) | 0 (0.0%) |
| 5 Years | 0 (0.0%) | 0 (0.0%) |
| 6 to 11 Years | 0 (0.0%) | 0 (0.0%) |
| 12 to 14 Years | 7 (35.0%) | 0 (0.0%) |
| 15 Years | 0 (0.0%) | 0 (0.0%) |
| 16 and 17 Years | 0 (0.0%) | 0 (0.0%) |
| 18 to 24 Years | 12 (100.0%) | 0 (0.0%) |
| 25 to 34 Years | 0 (0.0%) | 10 (35.7%) |
| 35 to 44 Years | 10 (52.6%) | 0 (0.0%) |
| 45 to 54 Years | 0 (0.0%) | 0 (0.0%) |
| 55 to 64 Years | 0 (0.0%) | 7 (13.7%) |
| 65 to 74 Years | 0 (0.0%) | 0 (0.0%) |
| 75 Years and over | 0 (0.0%) | 0 (0.0%) |
| Total | 29 (17.9%) | 17 (9.3%) |
Income Above Poverty by Sex and Age in Sagaponack
According to the poverty statistics in Sagaponack, males aged 6 to 11 years and females aged 6 to 11 years are the age groups that are most secure financially, with 100.0% of males and 100.0% of females in these age groups living above the poverty line.
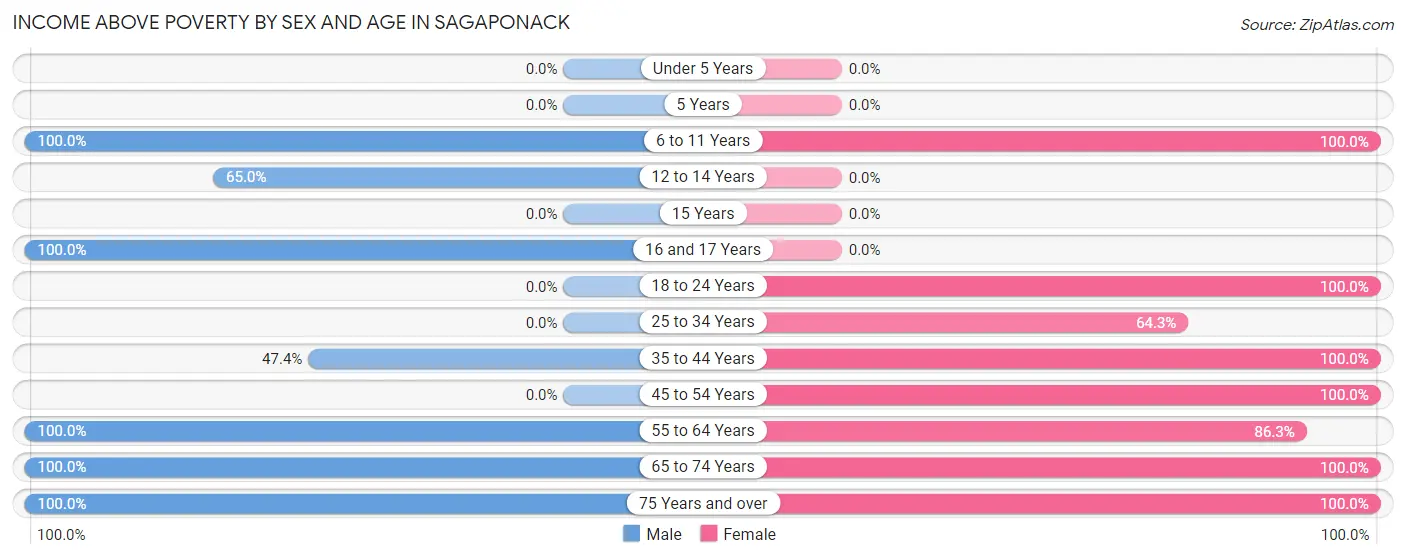
| Age Bracket | Male | Female |
| Under 5 Years | 0 (0.0%) | 0 (0.0%) |
| 5 Years | 0 (0.0%) | 0 (0.0%) |
| 6 to 11 Years | 13 (100.0%) | 12 (100.0%) |
| 12 to 14 Years | 13 (65.0%) | 0 (0.0%) |
| 15 Years | 0 (0.0%) | 0 (0.0%) |
| 16 and 17 Years | 8 (100.0%) | 0 (0.0%) |
| 18 to 24 Years | 0 (0.0%) | 10 (100.0%) |
| 25 to 34 Years | 0 (0.0%) | 18 (64.3%) |
| 35 to 44 Years | 9 (47.4%) | 2 (100.0%) |
| 45 to 54 Years | 0 (0.0%) | 8 (100.0%) |
| 55 to 64 Years | 20 (100.0%) | 44 (86.3%) |
| 65 to 74 Years | 40 (100.0%) | 37 (100.0%) |
| 75 Years and over | 30 (100.0%) | 34 (100.0%) |
| Total | 133 (82.1%) | 165 (90.7%) |
Income Below Poverty Among Married-Couple Families in Sagaponack
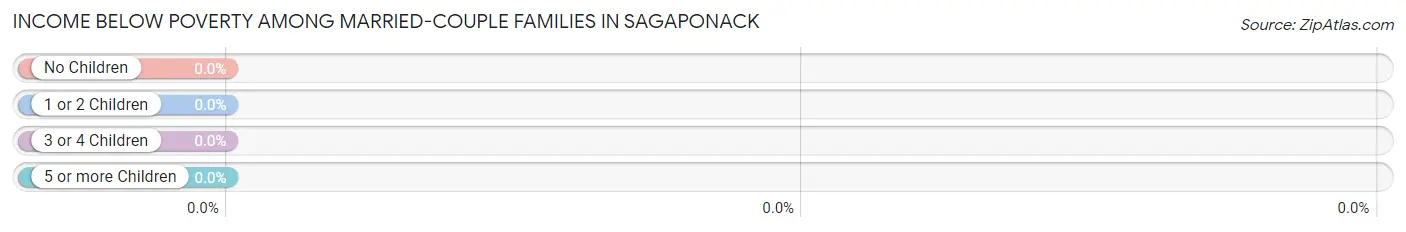
| Children | Above Poverty | Below Poverty |
| No Children | 56 (100.0%) | 0 (0.0%) |
| 1 or 2 Children | 0 (0.0%) | 0 (0.0%) |
| 3 or 4 Children | 0 (0.0%) | 0 (0.0%) |
| 5 or more Children | 0 (0.0%) | 0 (0.0%) |
| Total | 56 (100.0%) | 0 (0.0%) |
Income Below Poverty Among Single-Parent Households in Sagaponack
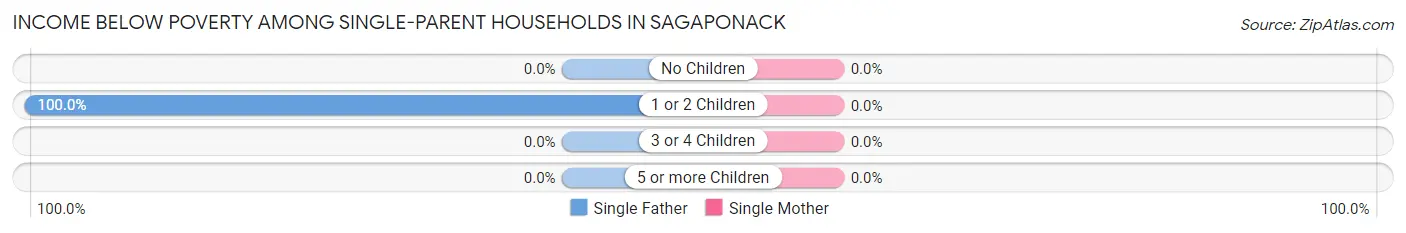
| Children | Single Father | Single Mother |
| No Children | 0 (0.0%) | 0 (0.0%) |
| 1 or 2 Children | 12 (100.0%) | 0 (0.0%) |
| 3 or 4 Children | 0 (0.0%) | 0 (0.0%) |
| 5 or more Children | 0 (0.0%) | 0 (0.0%) |
| Total | 12 (63.2%) | 0 (0.0%) |
Income Below Poverty Among Married-Couple vs Single-Parent Households in Sagaponack
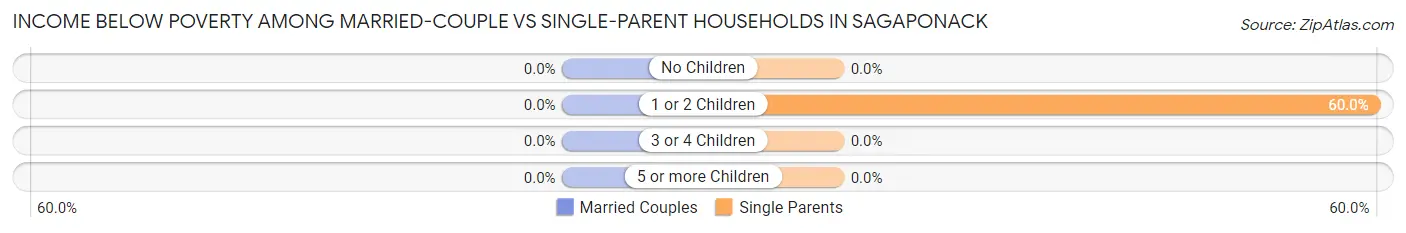
| Children | Married-Couple Families | Single-Parent Households |
| No Children | 0 (0.0%) | 0 (0.0%) |
| 1 or 2 Children | 0 (0.0%) | 12 (60.0%) |
| 3 or 4 Children | 0 (0.0%) | 0 (0.0%) |
| 5 or more Children | 0 (0.0%) | 0 (0.0%) |
| Total | 0 (0.0%) | 12 (31.6%) |
Race in Sagaponack
The most populous races in Sagaponack are White / Caucasian (291 | 84.6%), Hispanic or Latino (69 | 20.1%), and Black / African American (49 | 14.2%).
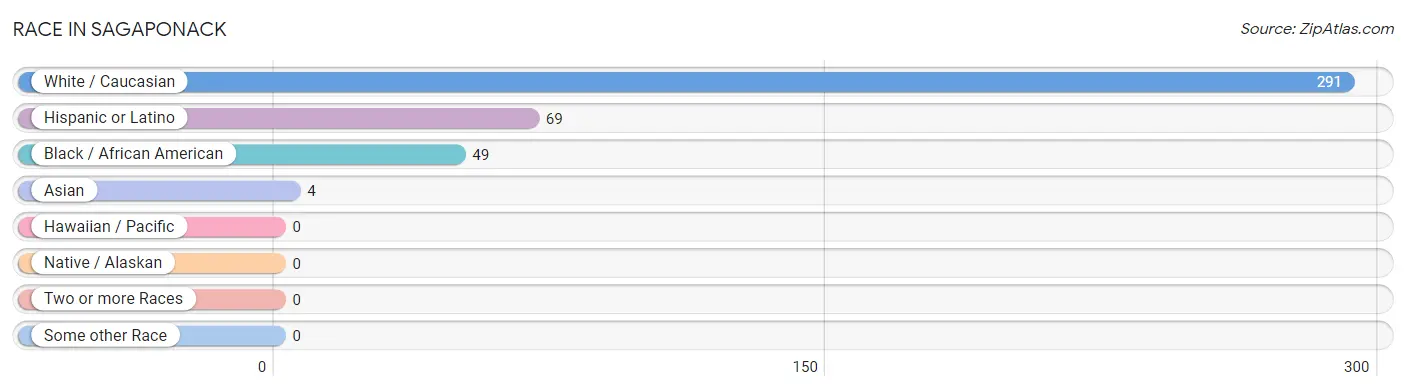
| Race | # Population | % Population |
| Asian | 4 | 1.2% |
| Black / African American | 49 | 14.2% |
| Hawaiian / Pacific | 0 | 0.0% |
| Hispanic or Latino | 69 | 20.1% |
| Native / Alaskan | 0 | 0.0% |
| White / Caucasian | 291 | 84.6% |
| Two or more Races | 0 | 0.0% |
| Some other Race | 0 | 0.0% |
| Total | 344 | 100.0% |
Ancestry in Sagaponack
The most populous ancestries reported in Sagaponack are Dominican (60 | 17.4%), English (39 | 11.3%), German (34 | 9.9%), Portuguese (34 | 9.9%), and Polish (33 | 9.6%), together accounting for 58.1% of all Sagaponack residents.
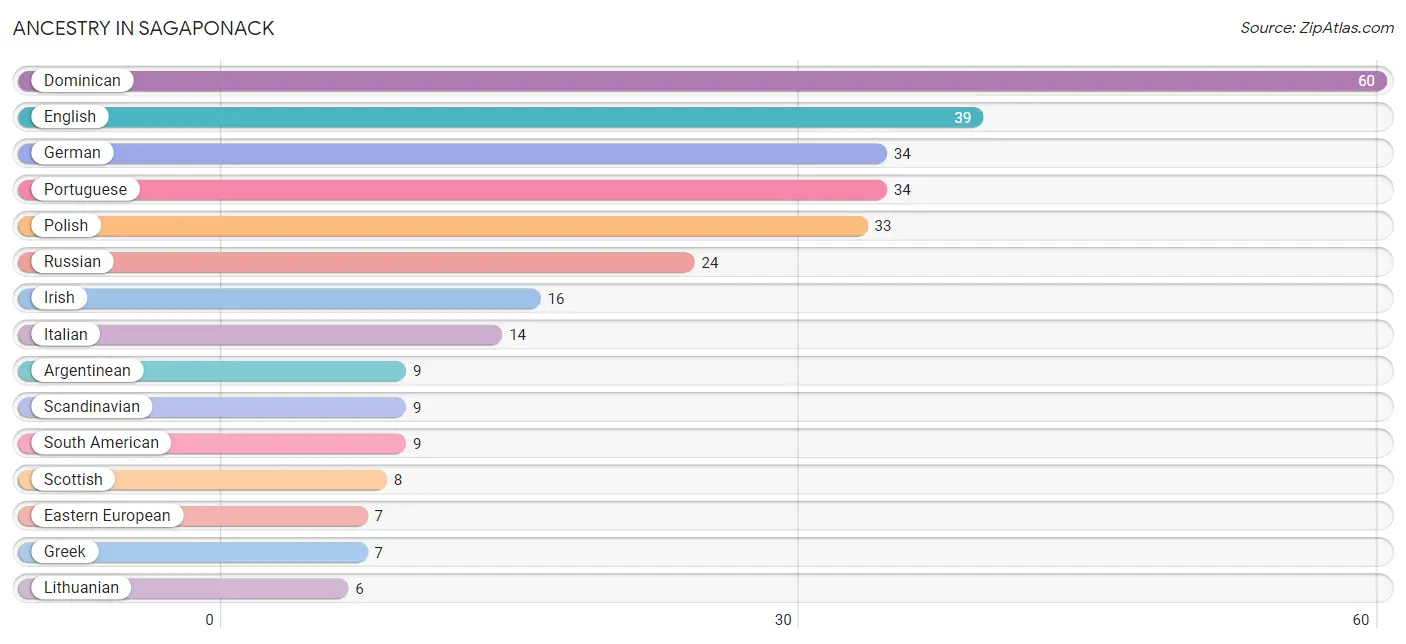
| Ancestry | # Population | % Population |
| American | 4 | 1.2% |
| Argentinean | 9 | 2.6% |
| Bhutanese | 4 | 1.2% |
| British | 3 | 0.9% |
| Dominican | 60 | 17.4% |
| Eastern European | 7 | 2.0% |
| English | 39 | 11.3% |
| German | 34 | 9.9% |
| Greek | 7 | 2.0% |
| Hungarian | 5 | 1.5% |
| Irish | 16 | 4.6% |
| Italian | 14 | 4.1% |
| Lithuanian | 6 | 1.7% |
| Norwegian | 4 | 1.2% |
| Polish | 33 | 9.6% |
| Portuguese | 34 | 9.9% |
| Russian | 24 | 7.0% |
| Scandinavian | 9 | 2.6% |
| Scottish | 8 | 2.3% |
| South American | 9 | 2.6% |
| Ukrainian | 3 | 0.9% | View All 21 Rows |
Immigrants in Sagaponack
The most numerous immigrant groups reported in Sagaponack came from Latin America (66 | 19.2%), Caribbean (47 | 13.7%), Dominican Republic (47 | 13.7%), Europe (35 | 10.2%), and Portugal (30 | 8.7%), together accounting for 65.4% of all Sagaponack residents.
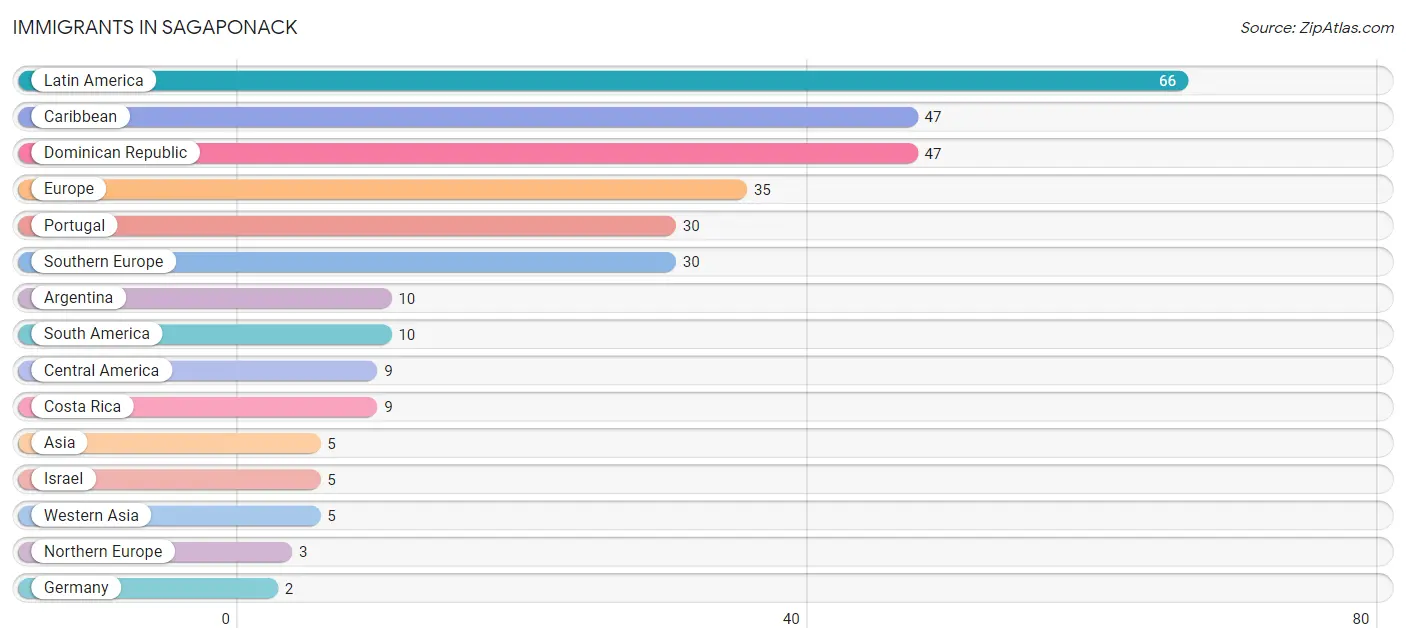
| Immigration Origin | # Population | % Population |
| Argentina | 10 | 2.9% |
| Asia | 5 | 1.5% |
| Caribbean | 47 | 13.7% |
| Central America | 9 | 2.6% |
| Costa Rica | 9 | 2.6% |
| Dominican Republic | 47 | 13.7% |
| Europe | 35 | 10.2% |
| Germany | 2 | 0.6% |
| Israel | 5 | 1.5% |
| Latin America | 66 | 19.2% |
| Northern Europe | 3 | 0.9% |
| Portugal | 30 | 8.7% |
| South America | 10 | 2.9% |
| Southern Europe | 30 | 8.7% |
| Western Asia | 5 | 1.5% |
| Western Europe | 2 | 0.6% | View All 16 Rows |
Sex and Age in Sagaponack
Sex and Age in Sagaponack
The most populous age groups in Sagaponack are 10 to 14 Years (33 | 20.4%) for men and 65 to 69 Years (34 | 18.7%) for women.
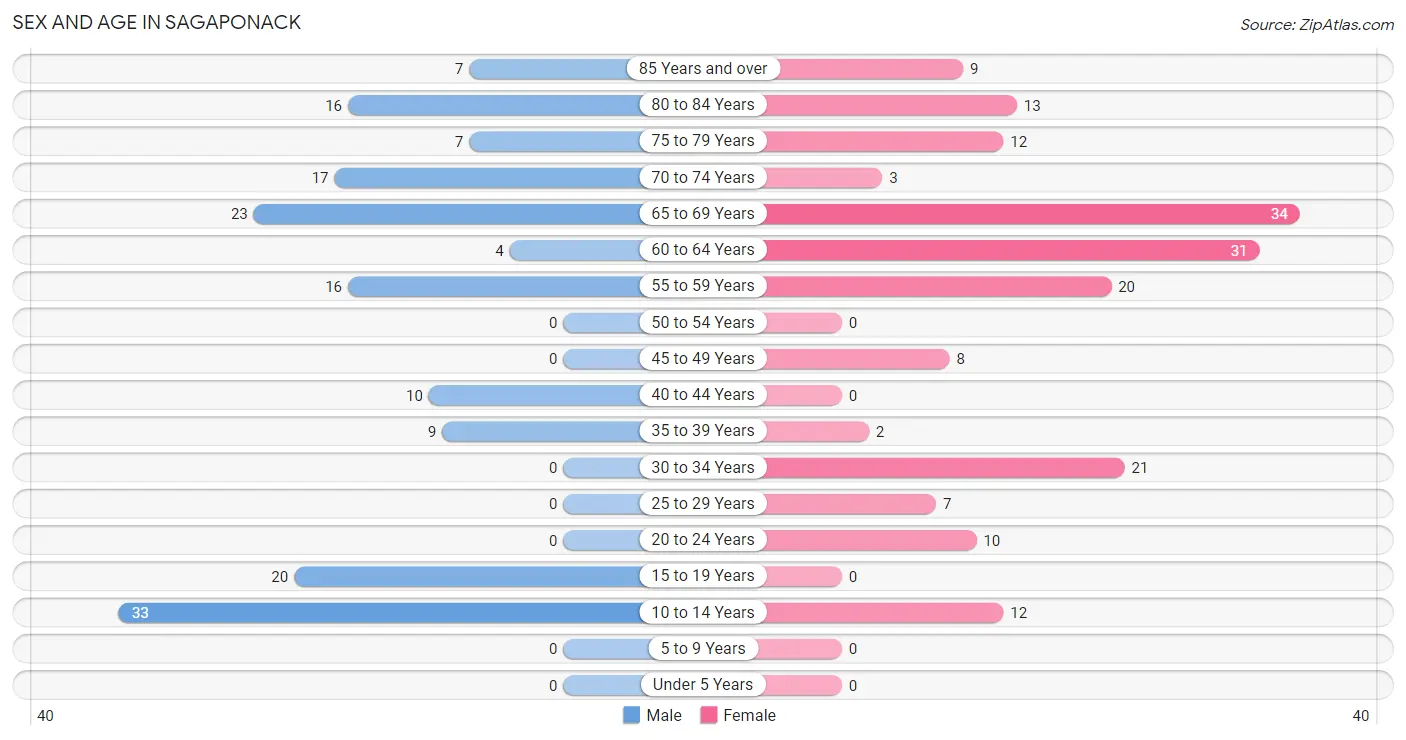
| Age Bracket | Male | Female |
| Under 5 Years | 0 (0.0%) | 0 (0.0%) |
| 5 to 9 Years | 0 (0.0%) | 0 (0.0%) |
| 10 to 14 Years | 33 (20.4%) | 12 (6.6%) |
| 15 to 19 Years | 20 (12.3%) | 0 (0.0%) |
| 20 to 24 Years | 0 (0.0%) | 10 (5.5%) |
| 25 to 29 Years | 0 (0.0%) | 7 (3.8%) |
| 30 to 34 Years | 0 (0.0%) | 21 (11.5%) |
| 35 to 39 Years | 9 (5.6%) | 2 (1.1%) |
| 40 to 44 Years | 10 (6.2%) | 0 (0.0%) |
| 45 to 49 Years | 0 (0.0%) | 8 (4.4%) |
| 50 to 54 Years | 0 (0.0%) | 0 (0.0%) |
| 55 to 59 Years | 16 (9.9%) | 20 (11.0%) |
| 60 to 64 Years | 4 (2.5%) | 31 (17.0%) |
| 65 to 69 Years | 23 (14.2%) | 34 (18.7%) |
| 70 to 74 Years | 17 (10.5%) | 3 (1.7%) |
| 75 to 79 Years | 7 (4.3%) | 12 (6.6%) |
| 80 to 84 Years | 16 (9.9%) | 13 (7.1%) |
| 85 Years and over | 7 (4.3%) | 9 (5.0%) |
| Total | 162 (100.0%) | 182 (100.0%) |
Families and Households in Sagaponack
Median Family Size in Sagaponack
The median family size in Sagaponack is 2.95 persons per family, with single female/mother families (19 | 20.2%) accounting for the largest median family size of 4.95 persons per family. On the other hand, married-couple families (56 | 59.6%) represent the smallest median family size with 2.20 persons per family.
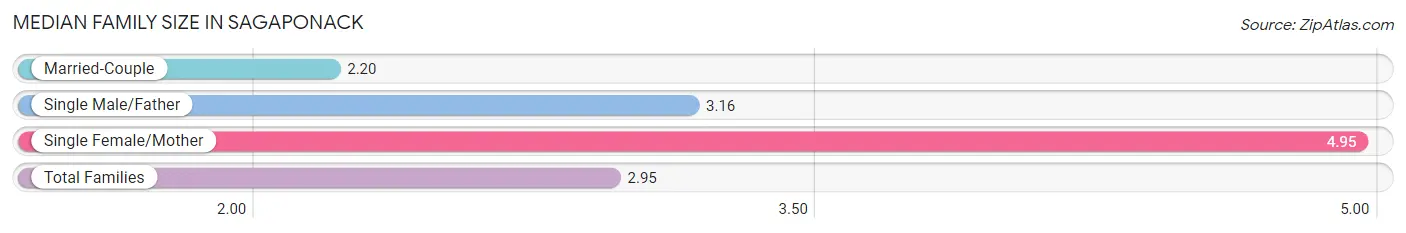
| Family Type | # Families | Family Size |
| Married-Couple | 56 (59.6%) | 2.20 |
| Single Male/Father | 19 (20.2%) | 3.16 |
| Single Female/Mother | 19 (20.2%) | 4.95 |
| Total Families | 94 (100.0%) | 2.95 |
Median Household Size in Sagaponack
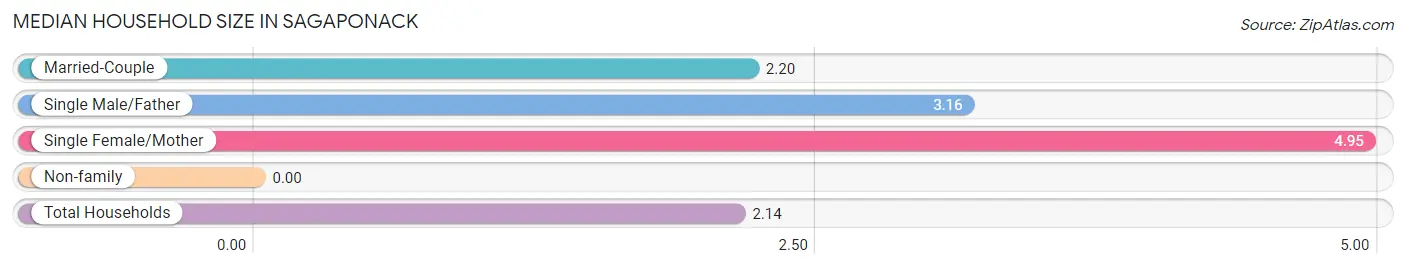
| Household Type | # Households | Household Size |
| Married-Couple | 56 (34.8%) | 2.20 |
| Single Male/Father | 19 (11.8%) | 3.16 |
| Single Female/Mother | 19 (11.8%) | 4.95 |
| Non-family | 67 (41.6%) | - |
| Total Households | 161 (100.0%) | 2.14 |
Household Size by Marriage Status in Sagaponack
Out of a total of 161 households in Sagaponack, 94 (58.4%) are family households, while 67 (41.6%) are nonfamily households. The most numerous type of family households are 2-person households, comprising 48, and the most common type of nonfamily households are 1-person households, comprising 67.
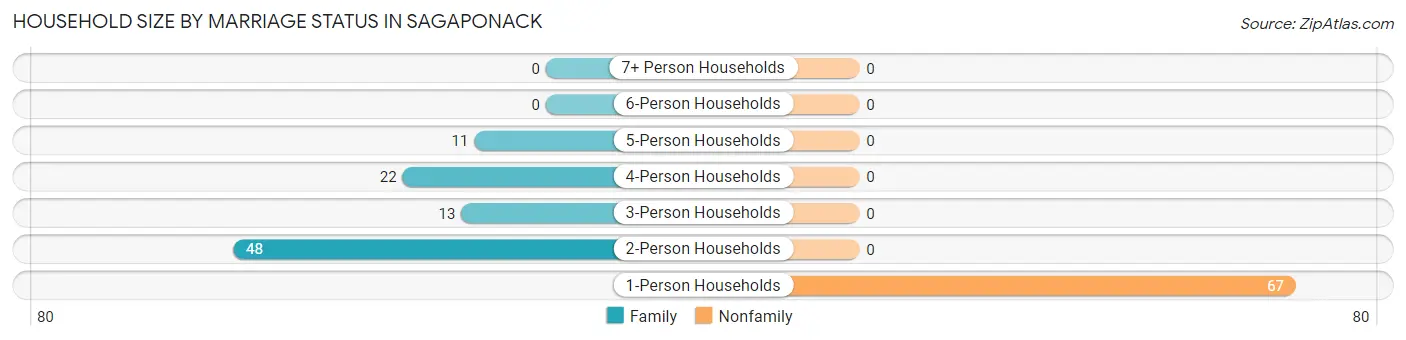
| Household Size | Family Households | Nonfamily Households |
| 1-Person Households | - | 67 (41.6%) |
| 2-Person Households | 48 (29.8%) | 0 (0.0%) |
| 3-Person Households | 13 (8.1%) | 0 (0.0%) |
| 4-Person Households | 22 (13.7%) | 0 (0.0%) |
| 5-Person Households | 11 (6.8%) | 0 (0.0%) |
| 6-Person Households | 0 (0.0%) | 0 (0.0%) |
| 7+ Person Households | 0 (0.0%) | 0 (0.0%) |
| Total | 94 (58.4%) | 67 (41.6%) |
Female Fertility in Sagaponack
Fertility by Age in Sagaponack
| Age Bracket | Women with Births | Births / 1,000 Women |
| 15 to 19 years | 0 (0.0%) | 0.0 |
| 20 to 34 years | 0 (0.0%) | 0.0 |
| 35 to 50 years | 0 (0.0%) | 0.0 |
| Total | 0 (0.0%) | 0.0 |
Fertility by Age by Marriage Status in Sagaponack
| Age Bracket | Married | Unmarried |
| 15 to 19 years | 0 (0.0%) | 0 (0.0%) |
| 20 to 34 years | 0 (0.0%) | 0 (0.0%) |
| 35 to 50 years | 0 (0.0%) | 0 (0.0%) |
| Total | 0 (0.0%) | 0 (0.0%) |
Fertility by Education in Sagaponack
| Educational Attainment | Women with Births | Births / 1,000 Women |
| Less than High School | 0 (0.0%) | 0.0 |
| High School Diploma | 0 (0.0%) | 0.0 |
| College or Associate's Degree | 0 (0.0%) | 0.0 |
| Bachelor's Degree | 0 (0.0%) | 0.0 |
| Graduate Degree | 0 (0.0%) | 0.0 |
| Total | 0 (0.0%) | 0.0 |
Fertility by Education by Marriage Status in Sagaponack
| Educational Attainment | Married | Unmarried |
| Less than High School | 0 (0.0%) | 0 (0.0%) |
| High School Diploma | 0 (0.0%) | 0 (0.0%) |
| College or Associate's Degree | 0 (0.0%) | 0 (0.0%) |
| Bachelor's Degree | 0 (0.0%) | 0 (0.0%) |
| Graduate Degree | 0 (0.0%) | 0 (0.0%) |
| Total | 0 (0.0%) | 0 (0.0%) |
Employment Characteristics in Sagaponack
Employment by Class of Employer in Sagaponack
Among the 127 employed individuals in Sagaponack, private company employees (72 | 56.7%), self-employed (not incorporated) (17 | 13.4%), and not-for-profit organizations (15 | 11.8%) make up the most common classes of employment.
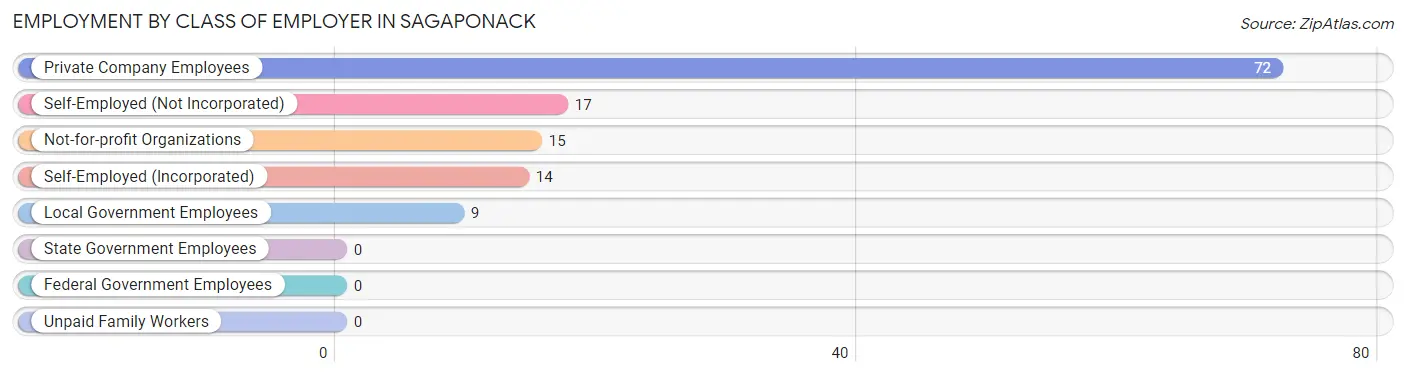
| Employer Class | # Employees | % Employees |
| Private Company Employees | 72 | 56.7% |
| Self-Employed (Incorporated) | 14 | 11.0% |
| Self-Employed (Not Incorporated) | 17 | 13.4% |
| Not-for-profit Organizations | 15 | 11.8% |
| Local Government Employees | 9 | 7.1% |
| State Government Employees | 0 | 0.0% |
| Federal Government Employees | 0 | 0.0% |
| Unpaid Family Workers | 0 | 0.0% |
| Total | 127 | 100.0% |
Employment Status by Age in Sagaponack
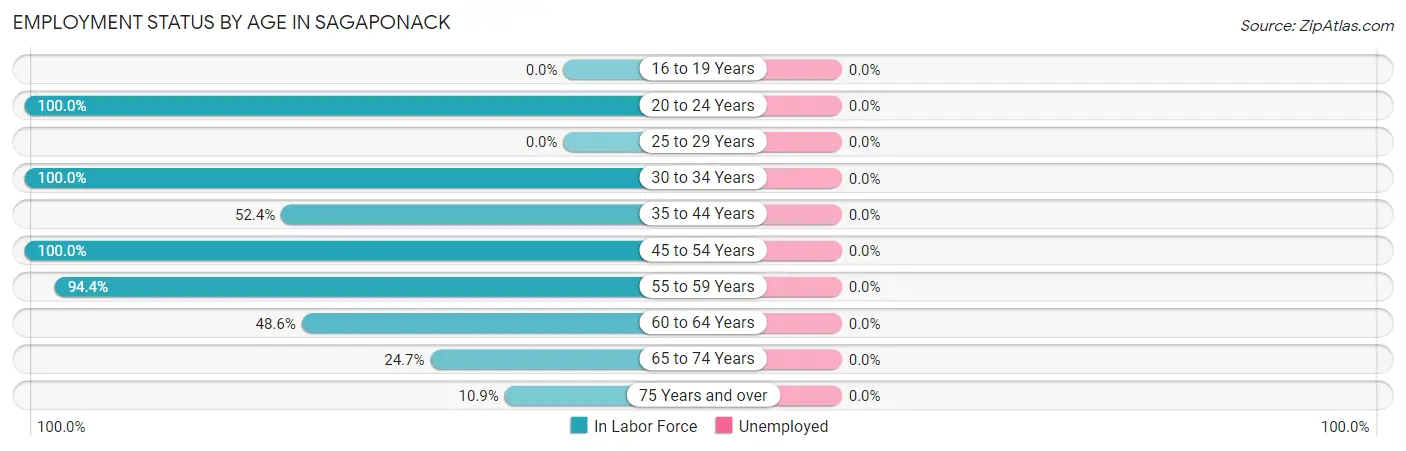
| Age Bracket | In Labor Force | Unemployed |
| 16 to 19 Years | 0 (0.0%) | 0 (0.0%) |
| 20 to 24 Years | 10 (100.0%) | 0 (0.0%) |
| 25 to 29 Years | 0 (0.0%) | 0 (0.0%) |
| 30 to 34 Years | 21 (100.0%) | 0 (0.0%) |
| 35 to 44 Years | 11 (52.4%) | 0 (0.0%) |
| 45 to 54 Years | 8 (100.0%) | 0 (0.0%) |
| 55 to 59 Years | 34 (94.4%) | 0 (0.0%) |
| 60 to 64 Years | 17 (48.6%) | 0 (0.0%) |
| 65 to 74 Years | 19 (24.7%) | 0 (0.0%) |
| 75 Years and over | 7 (10.9%) | 0 (0.0%) |
| Total | 127 (42.5%) | 0 (0.0%) |
Employment Status by Educational Attainment in Sagaponack
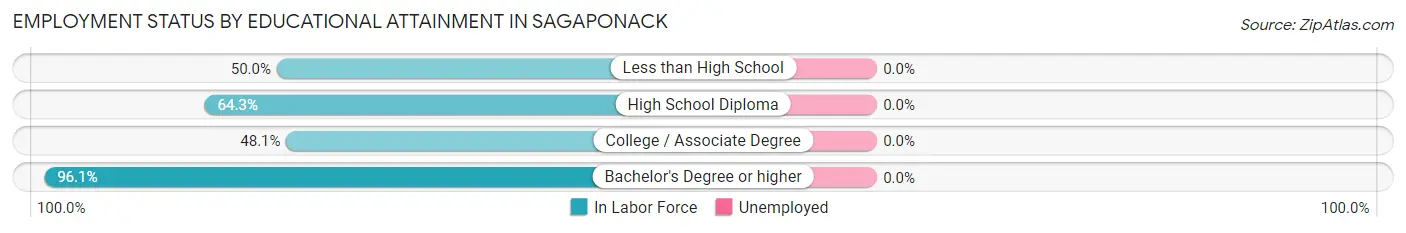
| Educational Attainment | In Labor Force | Unemployed |
| Less than High School | 11 (50.0%) | 0 (0.0%) |
| High School Diploma | 18 (64.3%) | 0 (0.0%) |
| College / Associate Degree | 13 (48.1%) | 0 (0.0%) |
| Bachelor's Degree or higher | 49 (96.1%) | 0 (0.0%) |
| Total | 91 (71.1%) | 0 (0.0%) |
Employment Occupations by Sex in Sagaponack
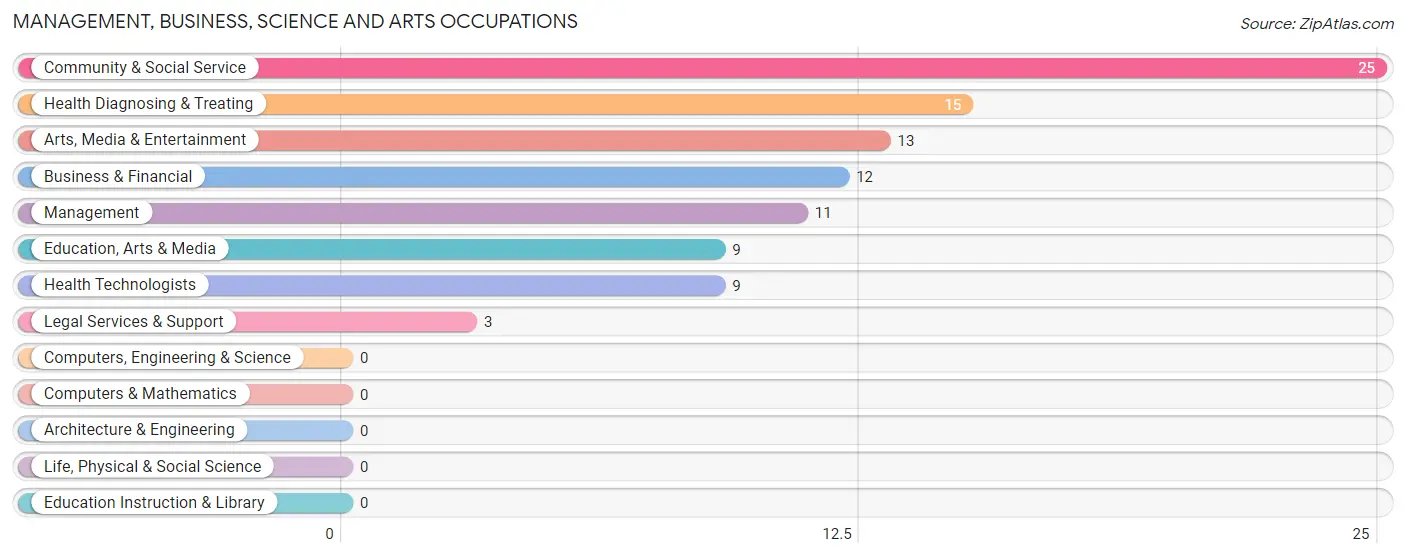
Management, Business, Science and Arts Occupations
The most common Management, Business, Science and Arts occupations in Sagaponack are Community & Social Service (25 | 19.7%), Health Diagnosing & Treating (15 | 11.8%), Arts, Media & Entertainment (13 | 10.2%), Business & Financial (12 | 9.5%), and Management (11 | 8.7%).
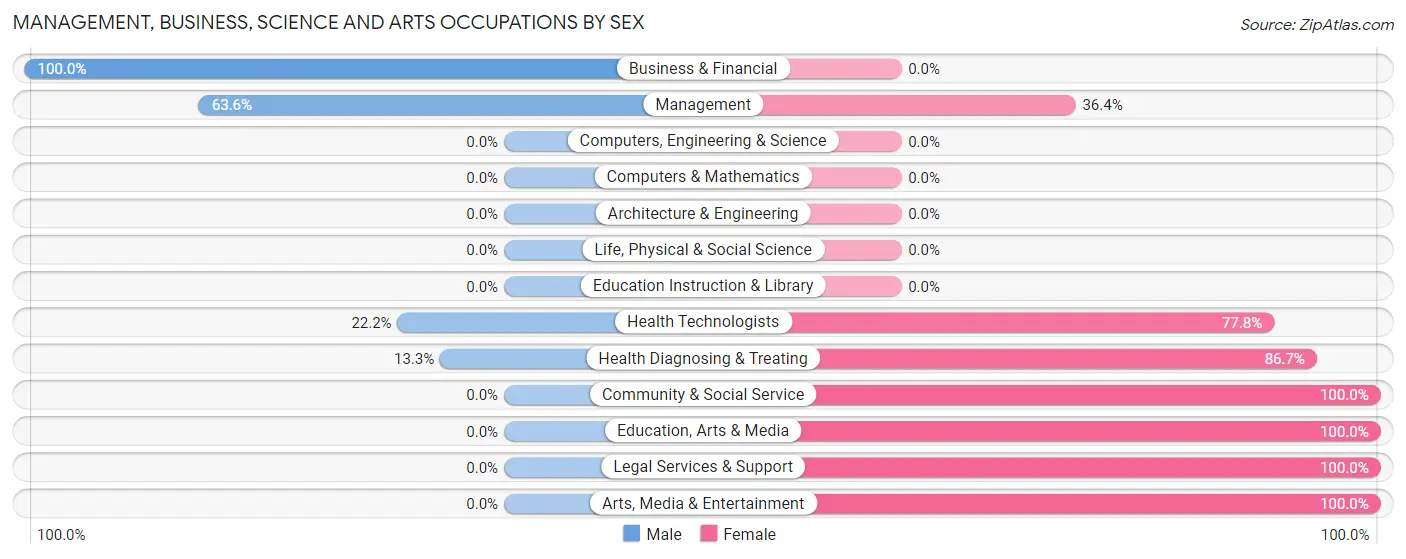
Management, Business, Science and Arts Occupations by Sex
Within the Management, Business, Science and Arts occupations in Sagaponack, the most male-oriented occupations are Business & Financial (100.0%), Management (63.6%), and Health Technologists (22.2%), while the most female-oriented occupations are Community & Social Service (100.0%), Education, Arts & Media (100.0%), and Legal Services & Support (100.0%).
| Occupation | Male | Female |
| Management | 7 (63.6%) | 4 (36.4%) |
| Business & Financial | 12 (100.0%) | 0 (0.0%) |
| Computers, Engineering & Science | 0 (0.0%) | 0 (0.0%) |
| Computers & Mathematics | 0 (0.0%) | 0 (0.0%) |
| Architecture & Engineering | 0 (0.0%) | 0 (0.0%) |
| Life, Physical & Social Science | 0 (0.0%) | 0 (0.0%) |
| Community & Social Service | 0 (0.0%) | 25 (100.0%) |
| Education, Arts & Media | 0 (0.0%) | 9 (100.0%) |
| Legal Services & Support | 0 (0.0%) | 3 (100.0%) |
| Education Instruction & Library | 0 (0.0%) | 0 (0.0%) |
| Arts, Media & Entertainment | 0 (0.0%) | 13 (100.0%) |
| Health Diagnosing & Treating | 2 (13.3%) | 13 (86.7%) |
| Health Technologists | 2 (22.2%) | 7 (77.8%) |
| Total (Category) | 21 (33.3%) | 42 (66.7%) |
| Total (Overall) | 40 (31.5%) | 87 (68.5%) |
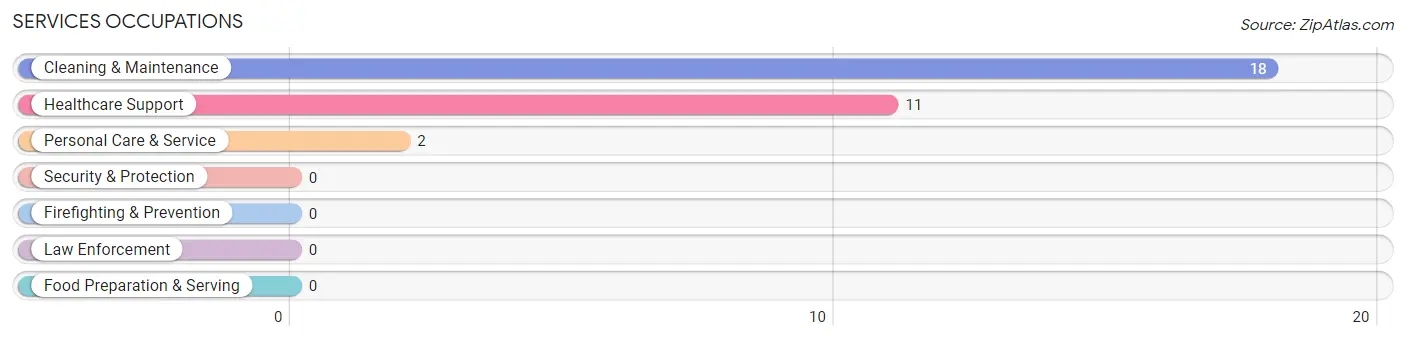
Services Occupations
The most common Services occupations in Sagaponack are Cleaning & Maintenance (18 | 14.2%), Healthcare Support (11 | 8.7%), and Personal Care & Service (2 | 1.6%).
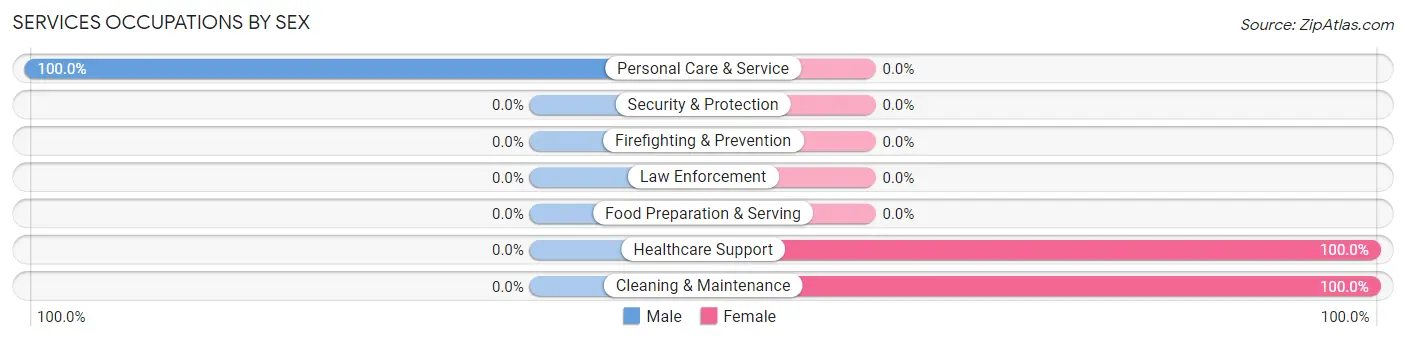
Services Occupations by Sex
| Occupation | Male | Female |
| Healthcare Support | 0 (0.0%) | 11 (100.0%) |
| Security & Protection | 0 (0.0%) | 0 (0.0%) |
| Firefighting & Prevention | 0 (0.0%) | 0 (0.0%) |
| Law Enforcement | 0 (0.0%) | 0 (0.0%) |
| Food Preparation & Serving | 0 (0.0%) | 0 (0.0%) |
| Cleaning & Maintenance | 0 (0.0%) | 18 (100.0%) |
| Personal Care & Service | 2 (100.0%) | 0 (0.0%) |
| Total (Category) | 2 (6.5%) | 29 (93.5%) |
| Total (Overall) | 40 (31.5%) | 87 (68.5%) |
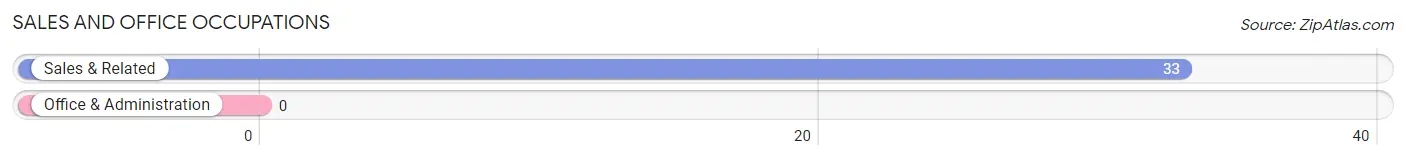
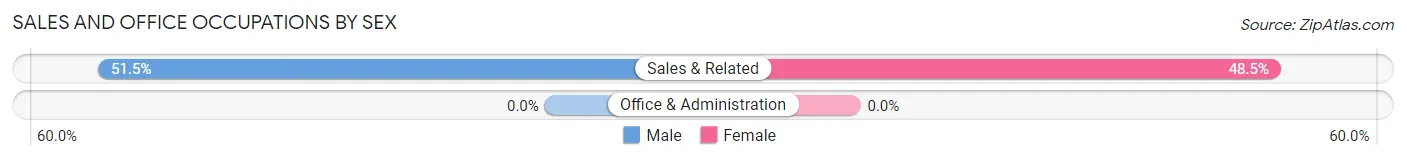
Sales and Office Occupations
The most common Sales and Office occupations in Sagaponack are , and Sales & Related (33 | 26.0%).
Sales and Office Occupations by Sex
| Occupation | Male | Female |
| Sales & Related | 17 (51.5%) | 16 (48.5%) |
| Office & Administration | 0 (0.0%) | 0 (0.0%) |
| Total (Category) | 17 (51.5%) | 16 (48.5%) |
| Total (Overall) | 40 (31.5%) | 87 (68.5%) |
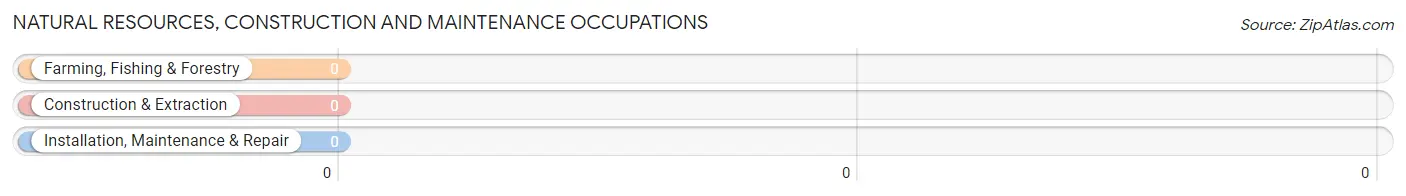
Natural Resources, Construction and Maintenance Occupations
Natural Resources, Construction and Maintenance Occupations by Sex
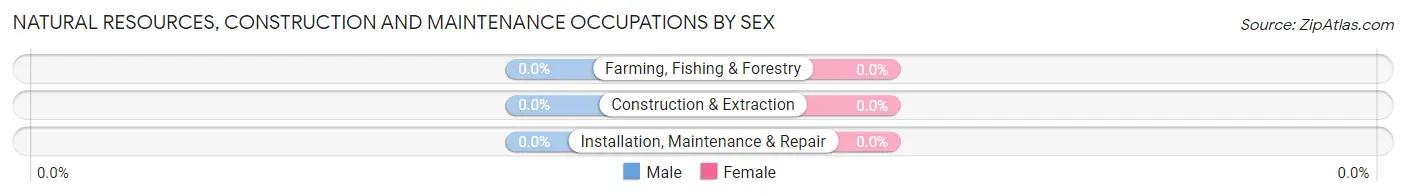
| Occupation | Male | Female |
| Farming, Fishing & Forestry | 0 (0.0%) | 0 (0.0%) |
| Construction & Extraction | 0 (0.0%) | 0 (0.0%) |
| Installation, Maintenance & Repair | 0 (0.0%) | 0 (0.0%) |
| Total (Category) | 0 (0.0%) | 0 (0.0%) |
| Total (Overall) | 40 (31.5%) | 87 (68.5%) |
Production, Transportation and Moving Occupations
Production, Transportation and Moving Occupations by Sex
| Occupation | Male | Female |
| Production | 0 (0.0%) | 0 (0.0%) |
| Transportation | 0 (0.0%) | 0 (0.0%) |
| Material Moving | 0 (0.0%) | 0 (0.0%) |
| Total (Category) | 0 (0.0%) | 0 (0.0%) |
| Total (Overall) | 40 (31.5%) | 87 (68.5%) |
Employment Industries by Sex in Sagaponack
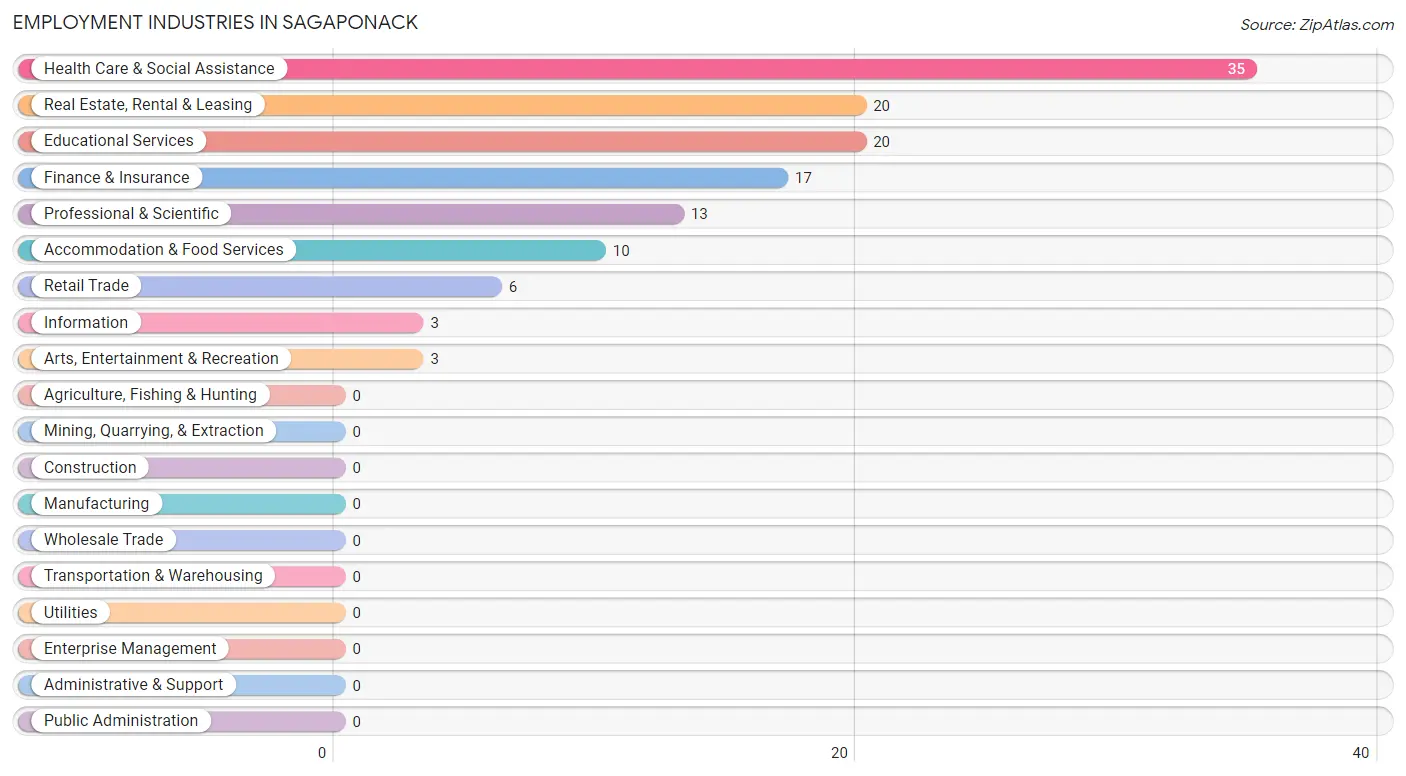
Employment Industries in Sagaponack
The major employment industries in Sagaponack include Health Care & Social Assistance (35 | 27.6%), Real Estate, Rental & Leasing (20 | 15.8%), Educational Services (20 | 15.8%), Finance & Insurance (17 | 13.4%), and Professional & Scientific (13 | 10.2%).
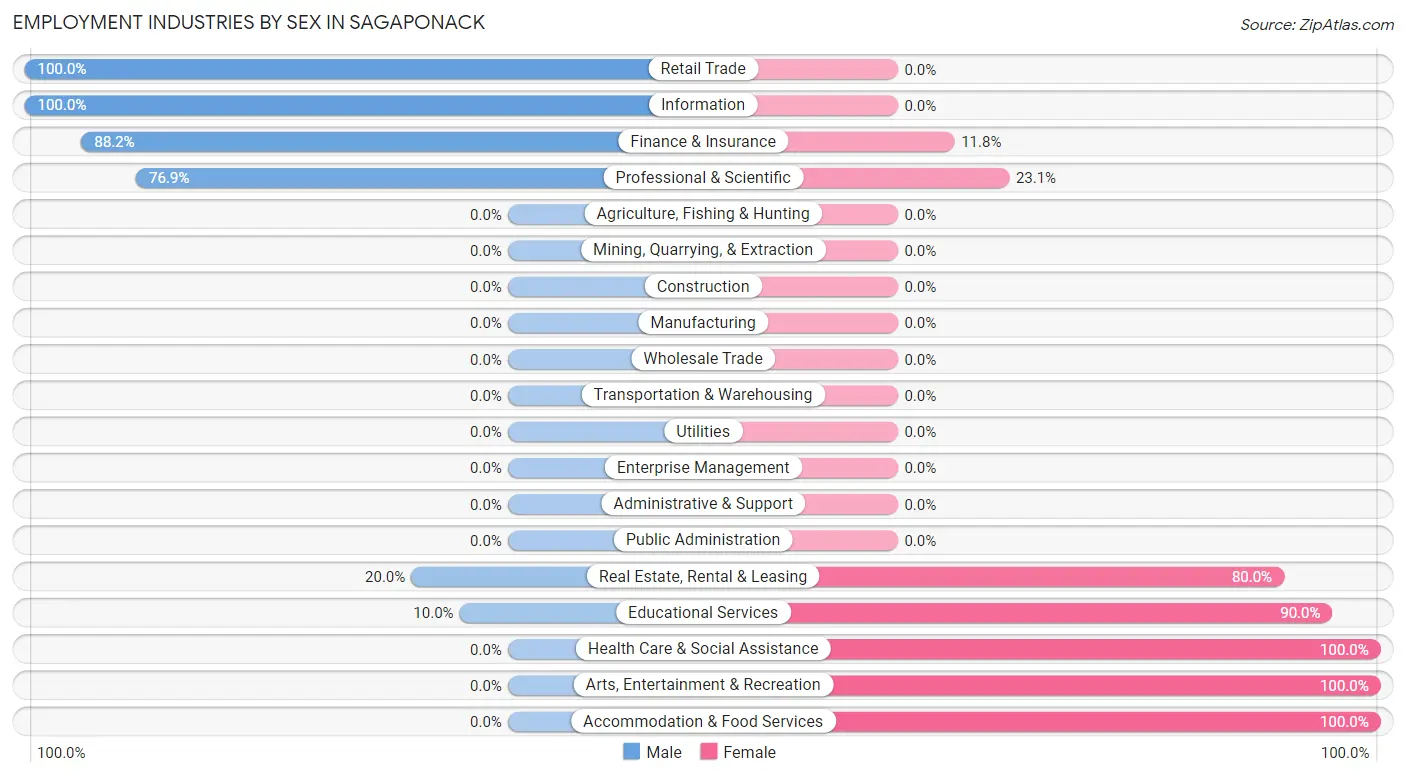
Employment Industries by Sex in Sagaponack
The Sagaponack industries that see more men than women are Retail Trade (100.0%), Information (100.0%), and Finance & Insurance (88.2%), whereas the industries that tend to have a higher number of women are Health Care & Social Assistance (100.0%), Arts, Entertainment & Recreation (100.0%), and Accommodation & Food Services (100.0%).
| Industry | Male | Female |
| Agriculture, Fishing & Hunting | 0 (0.0%) | 0 (0.0%) |
| Mining, Quarrying, & Extraction | 0 (0.0%) | 0 (0.0%) |
| Construction | 0 (0.0%) | 0 (0.0%) |
| Manufacturing | 0 (0.0%) | 0 (0.0%) |
| Wholesale Trade | 0 (0.0%) | 0 (0.0%) |
| Retail Trade | 6 (100.0%) | 0 (0.0%) |
| Transportation & Warehousing | 0 (0.0%) | 0 (0.0%) |
| Utilities | 0 (0.0%) | 0 (0.0%) |
| Information | 3 (100.0%) | 0 (0.0%) |
| Finance & Insurance | 15 (88.2%) | 2 (11.8%) |
| Real Estate, Rental & Leasing | 4 (20.0%) | 16 (80.0%) |
| Professional & Scientific | 10 (76.9%) | 3 (23.1%) |
| Enterprise Management | 0 (0.0%) | 0 (0.0%) |
| Administrative & Support | 0 (0.0%) | 0 (0.0%) |
| Educational Services | 2 (10.0%) | 18 (90.0%) |
| Health Care & Social Assistance | 0 (0.0%) | 35 (100.0%) |
| Arts, Entertainment & Recreation | 0 (0.0%) | 3 (100.0%) |
| Accommodation & Food Services | 0 (0.0%) | 10 (100.0%) |
| Public Administration | 0 (0.0%) | 0 (0.0%) |
| Total | 40 (31.5%) | 87 (68.5%) |
Education in Sagaponack
School Enrollment in Sagaponack
The most common levels of schooling among the 70 students in Sagaponack are middle school (45 | 64.3%), college / undergraduate (17 | 24.3%), and high school (8 | 11.4%).
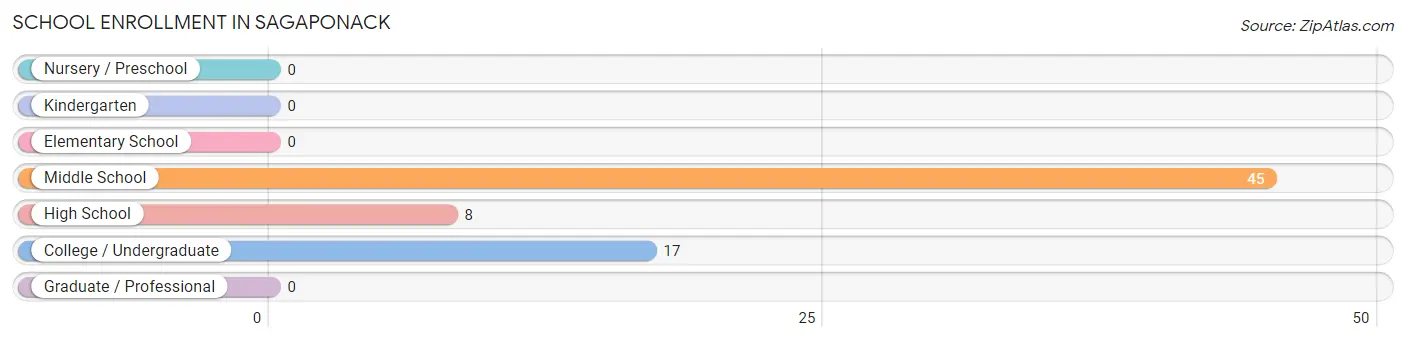
| School Level | # Students | % Students |
| Nursery / Preschool | 0 | 0.0% |
| Kindergarten | 0 | 0.0% |
| Elementary School | 0 | 0.0% |
| Middle School | 45 | 64.3% |
| High School | 8 | 11.4% |
| College / Undergraduate | 17 | 24.3% |
| Graduate / Professional | 0 | 0.0% |
| Total | 70 | 100.0% |
School Enrollment by Age by Funding Source in Sagaponack
Out of a total of 70 students who are enrolled in schools in Sagaponack, 10 (14.3%) attend a private institution, while the remaining 60 (85.7%) are enrolled in public schools. The age group of 20 to 24 year olds has the highest likelihood of being enrolled in private schools, with 10 (100.0% in the age bracket) enrolled. Conversely, the age group of 10 to 14 year olds has the lowest likelihood of being enrolled in a private school, with 45 (100.0% in the age bracket) attending a public institution.
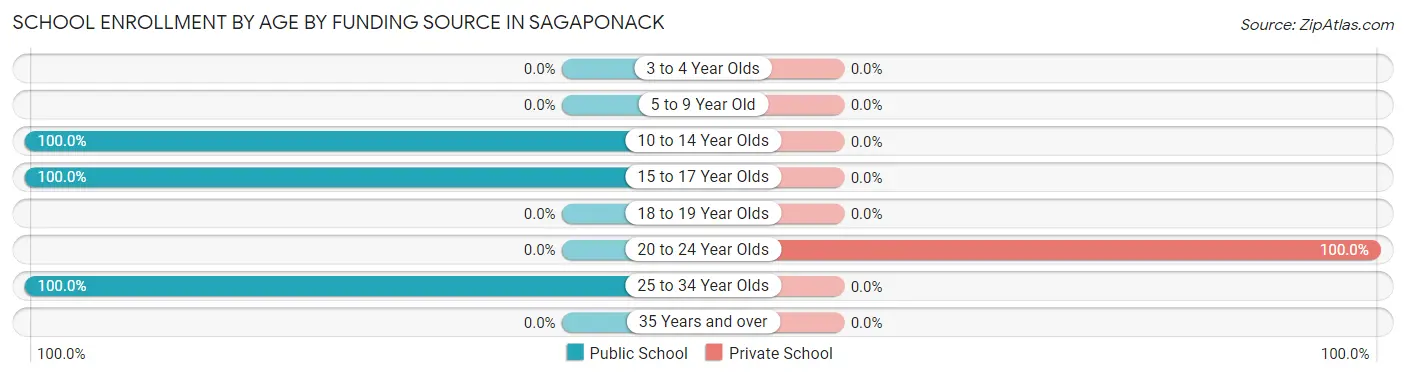
| Age Bracket | Public School | Private School |
| 3 to 4 Year Olds | 0 (0.0%) | 0 (0.0%) |
| 5 to 9 Year Old | 0 (0.0%) | 0 (0.0%) |
| 10 to 14 Year Olds | 45 (100.0%) | 0 (0.0%) |
| 15 to 17 Year Olds | 8 (100.0%) | 0 (0.0%) |
| 18 to 19 Year Olds | 0 (0.0%) | 0 (0.0%) |
| 20 to 24 Year Olds | 0 (0.0%) | 10 (100.0%) |
| 25 to 34 Year Olds | 7 (100.0%) | 0 (0.0%) |
| 35 Years and over | 0 (0.0%) | 0 (0.0%) |
| Total | 60 (85.7%) | 10 (14.3%) |
Educational Attainment by Field of Study in Sagaponack
Social sciences (33 | 18.3%), literature & languages (32 | 17.8%), business (29 | 16.1%), science & technology (25 | 13.9%), and liberal arts & history (19 | 10.6%) are the most common fields of study among 180 individuals in Sagaponack who have obtained a bachelor's degree or higher.
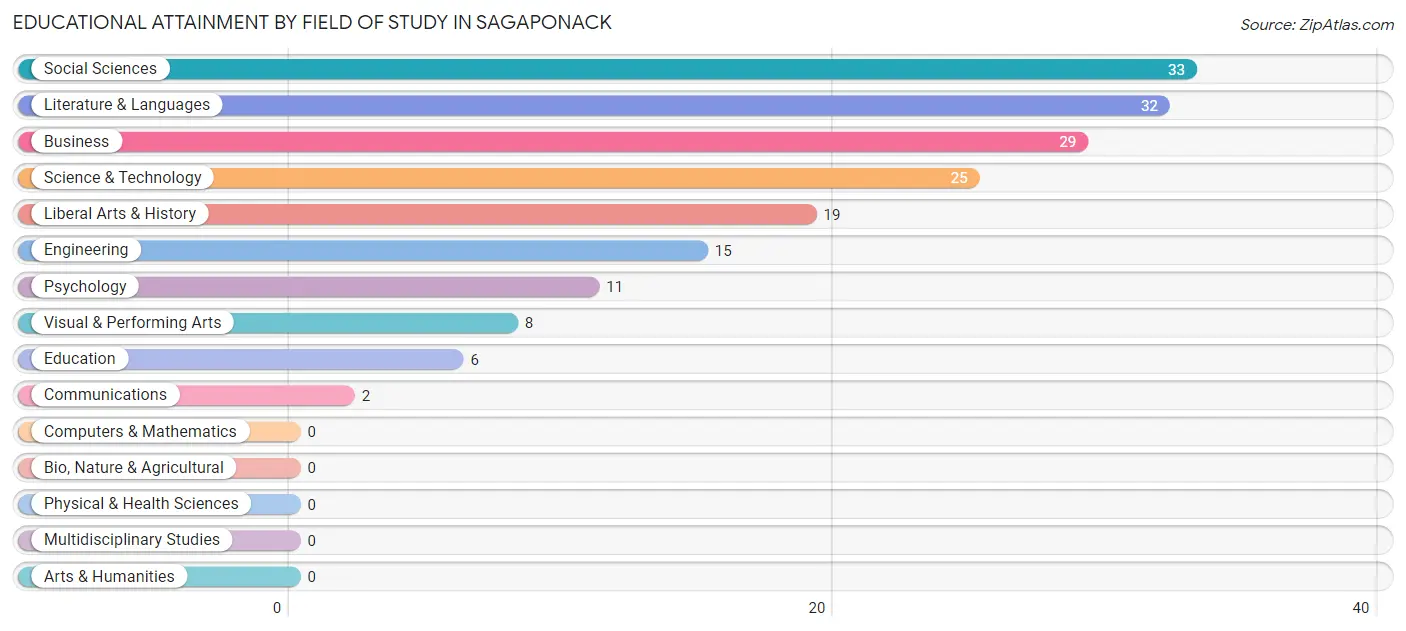
| Field of Study | # Graduates | % Graduates |
| Computers & Mathematics | 0 | 0.0% |
| Bio, Nature & Agricultural | 0 | 0.0% |
| Physical & Health Sciences | 0 | 0.0% |
| Psychology | 11 | 6.1% |
| Social Sciences | 33 | 18.3% |
| Engineering | 15 | 8.3% |
| Multidisciplinary Studies | 0 | 0.0% |
| Science & Technology | 25 | 13.9% |
| Business | 29 | 16.1% |
| Education | 6 | 3.3% |
| Literature & Languages | 32 | 17.8% |
| Liberal Arts & History | 19 | 10.6% |
| Visual & Performing Arts | 8 | 4.4% |
| Communications | 2 | 1.1% |
| Arts & Humanities | 0 | 0.0% |
| Total | 180 | 100.0% |
Transportation & Commute in Sagaponack
Vehicle Availability by Sex in Sagaponack
The most prevalent vehicle ownership categories in Sagaponack are males with 2 vehicles (26, accounting for 65.0%) and females with 2 vehicles (31, making up 29.9%).
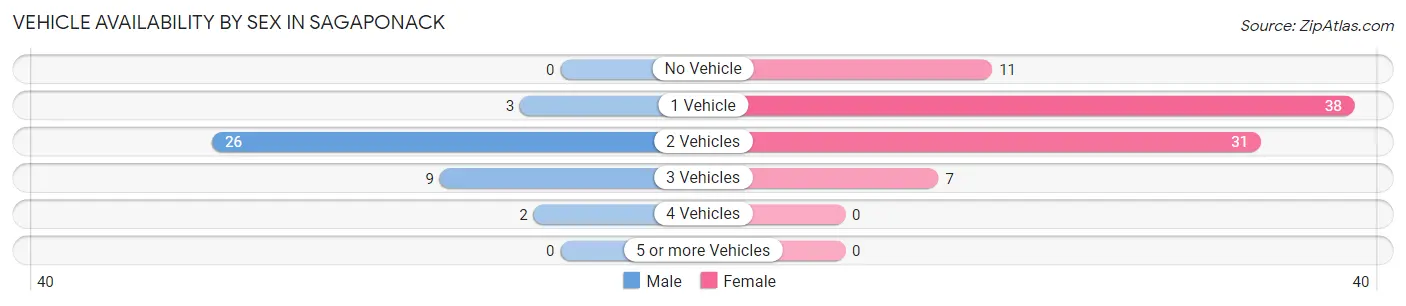
| Vehicles Available | Male | Female |
| No Vehicle | 0 (0.0%) | 11 (12.6%) |
| 1 Vehicle | 3 (7.5%) | 38 (43.7%) |
| 2 Vehicles | 26 (65.0%) | 31 (35.6%) |
| 3 Vehicles | 9 (22.5%) | 7 (8.1%) |
| 4 Vehicles | 2 (5.0%) | 0 (0.0%) |
| 5 or more Vehicles | 0 (0.0%) | 0 (0.0%) |
| Total | 40 (100.0%) | 87 (100.0%) |
Commute Time in Sagaponack
The most frequently occuring commute durations in Sagaponack are 10 to 14 minutes (38 commuters, 45.2%), 30 to 34 minutes (23 commuters, 27.4%), and 40 to 44 minutes (10 commuters, 11.9%).
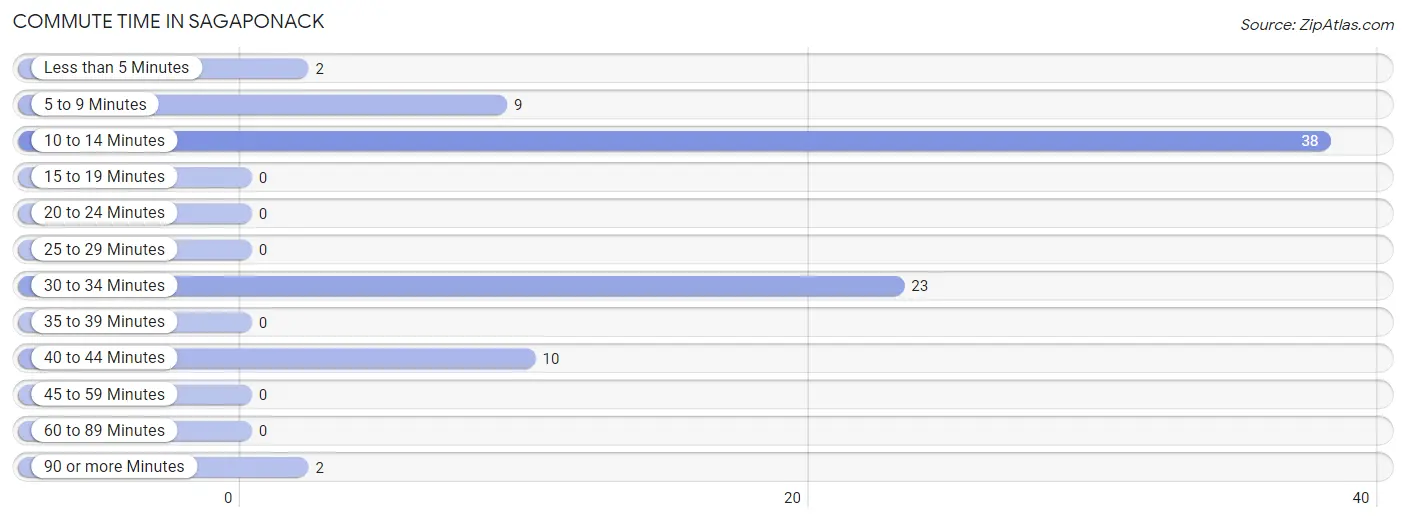
| Commute Time | # Commuters | % Commuters |
| Less than 5 Minutes | 2 | 2.4% |
| 5 to 9 Minutes | 9 | 10.7% |
| 10 to 14 Minutes | 38 | 45.2% |
| 15 to 19 Minutes | 0 | 0.0% |
| 20 to 24 Minutes | 0 | 0.0% |
| 25 to 29 Minutes | 0 | 0.0% |
| 30 to 34 Minutes | 23 | 27.4% |
| 35 to 39 Minutes | 0 | 0.0% |
| 40 to 44 Minutes | 10 | 11.9% |
| 45 to 59 Minutes | 0 | 0.0% |
| 60 to 89 Minutes | 0 | 0.0% |
| 90 or more Minutes | 2 | 2.4% |
Commute Time by Sex in Sagaponack
The most common commute times in Sagaponack are 10 to 14 minutes (11 commuters, 47.8%) for males and 10 to 14 minutes (27 commuters, 44.3%) for females.
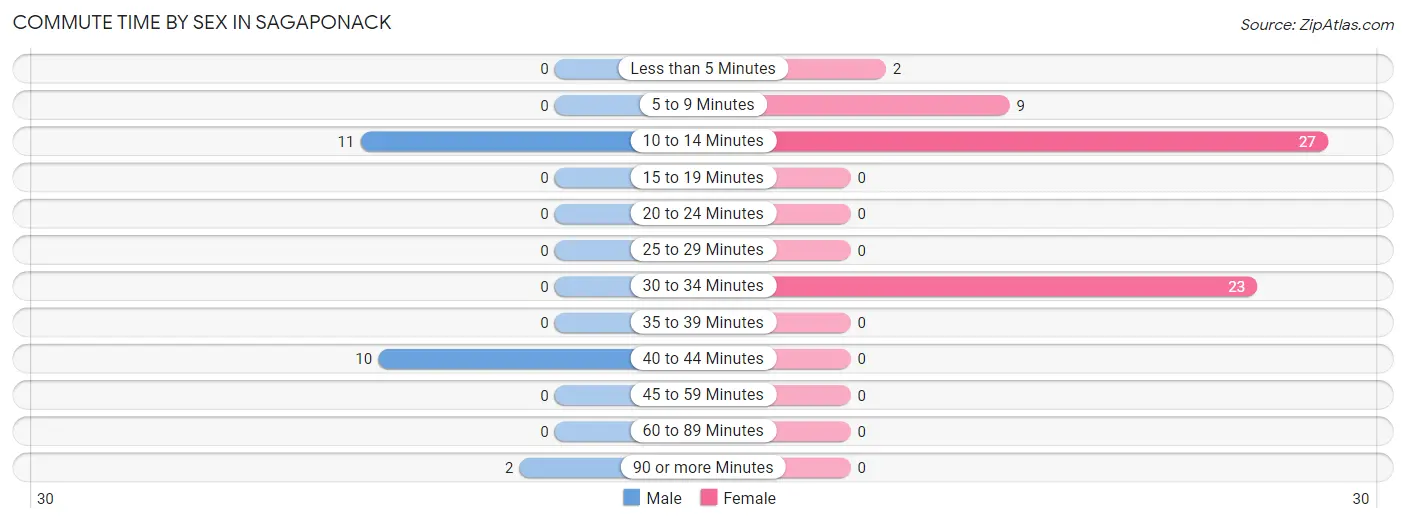
| Commute Time | Male | Female |
| Less than 5 Minutes | 0 (0.0%) | 2 (3.3%) |
| 5 to 9 Minutes | 0 (0.0%) | 9 (14.7%) |
| 10 to 14 Minutes | 11 (47.8%) | 27 (44.3%) |
| 15 to 19 Minutes | 0 (0.0%) | 0 (0.0%) |
| 20 to 24 Minutes | 0 (0.0%) | 0 (0.0%) |
| 25 to 29 Minutes | 0 (0.0%) | 0 (0.0%) |
| 30 to 34 Minutes | 0 (0.0%) | 23 (37.7%) |
| 35 to 39 Minutes | 0 (0.0%) | 0 (0.0%) |
| 40 to 44 Minutes | 10 (43.5%) | 0 (0.0%) |
| 45 to 59 Minutes | 0 (0.0%) | 0 (0.0%) |
| 60 to 89 Minutes | 0 (0.0%) | 0 (0.0%) |
| 90 or more Minutes | 2 (8.7%) | 0 (0.0%) |
Time of Departure to Work by Sex in Sagaponack
The most frequent times of departure to work in Sagaponack are 8:00 AM to 8:29 AM (17, 73.9%) for males and 10:00 AM to 10:59 AM (17, 27.9%) for females.
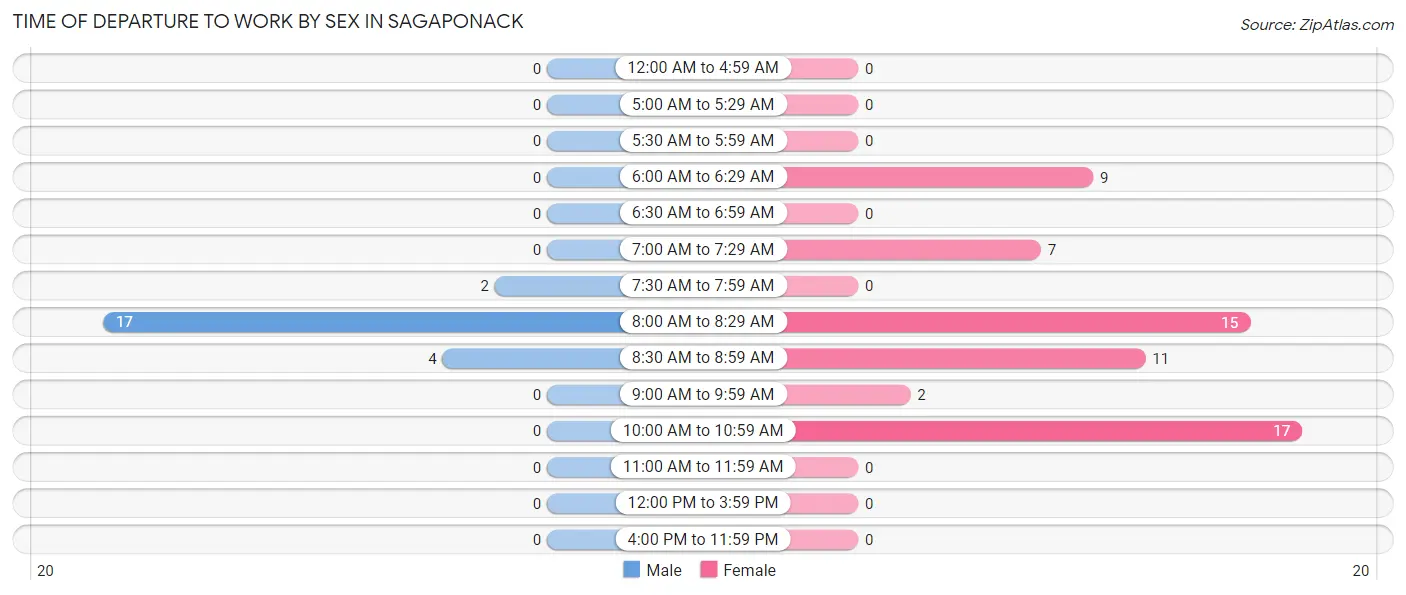
| Time of Departure | Male | Female |
| 12:00 AM to 4:59 AM | 0 (0.0%) | 0 (0.0%) |
| 5:00 AM to 5:29 AM | 0 (0.0%) | 0 (0.0%) |
| 5:30 AM to 5:59 AM | 0 (0.0%) | 0 (0.0%) |
| 6:00 AM to 6:29 AM | 0 (0.0%) | 9 (14.7%) |
| 6:30 AM to 6:59 AM | 0 (0.0%) | 0 (0.0%) |
| 7:00 AM to 7:29 AM | 0 (0.0%) | 7 (11.5%) |
| 7:30 AM to 7:59 AM | 2 (8.7%) | 0 (0.0%) |
| 8:00 AM to 8:29 AM | 17 (73.9%) | 15 (24.6%) |
| 8:30 AM to 8:59 AM | 4 (17.4%) | 11 (18.0%) |
| 9:00 AM to 9:59 AM | 0 (0.0%) | 2 (3.3%) |
| 10:00 AM to 10:59 AM | 0 (0.0%) | 17 (27.9%) |
| 11:00 AM to 11:59 AM | 0 (0.0%) | 0 (0.0%) |
| 12:00 PM to 3:59 PM | 0 (0.0%) | 0 (0.0%) |
| 4:00 PM to 11:59 PM | 0 (0.0%) | 0 (0.0%) |
| Total | 23 (100.0%) | 61 (100.0%) |
Housing Occupancy in Sagaponack
Occupancy by Ownership in Sagaponack
Of the total 161 dwellings in Sagaponack, owner-occupied units account for 142 (88.2%), while renter-occupied units make up 19 (11.8%).
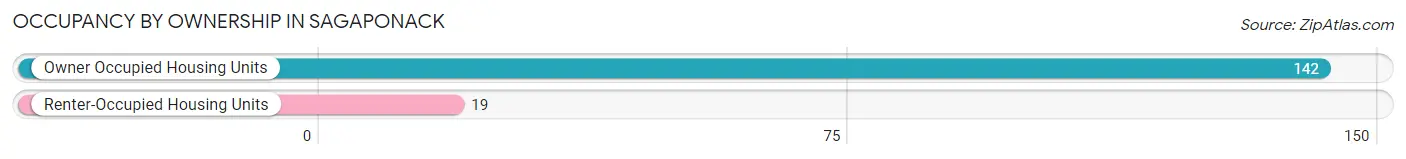
| Occupancy | # Housing Units | % Housing Units |
| Owner Occupied Housing Units | 142 | 88.2% |
| Renter-Occupied Housing Units | 19 | 11.8% |
| Total Occupied Housing Units | 161 | 100.0% |
Occupancy by Household Size in Sagaponack
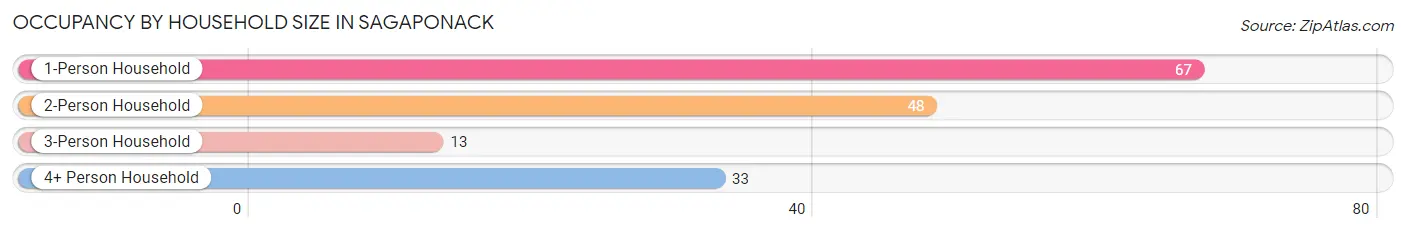
| Household Size | # Housing Units | % Housing Units |
| 1-Person Household | 67 | 41.6% |
| 2-Person Household | 48 | 29.8% |
| 3-Person Household | 13 | 8.1% |
| 4+ Person Household | 33 | 20.5% |
| Total Housing Units | 161 | 100.0% |
Occupancy by Ownership by Household Size in Sagaponack
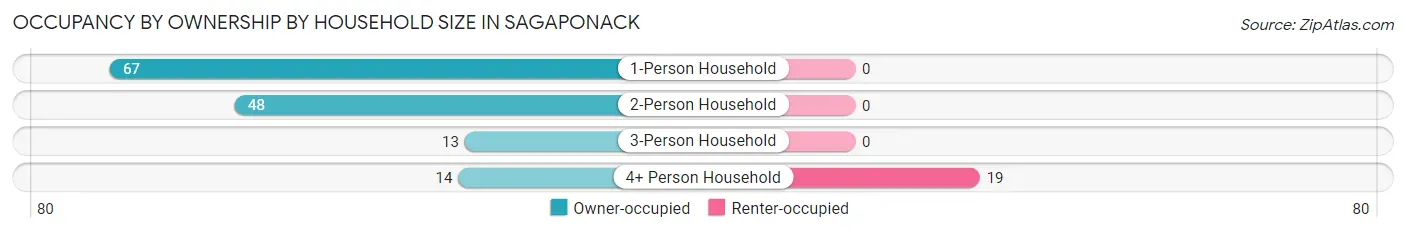
| Household Size | Owner-occupied | Renter-occupied |
| 1-Person Household | 67 (100.0%) | 0 (0.0%) |
| 2-Person Household | 48 (100.0%) | 0 (0.0%) |
| 3-Person Household | 13 (100.0%) | 0 (0.0%) |
| 4+ Person Household | 14 (42.4%) | 19 (57.6%) |
| Total Housing Units | 142 (88.2%) | 19 (11.8%) |
Occupancy by Educational Attainment in Sagaponack
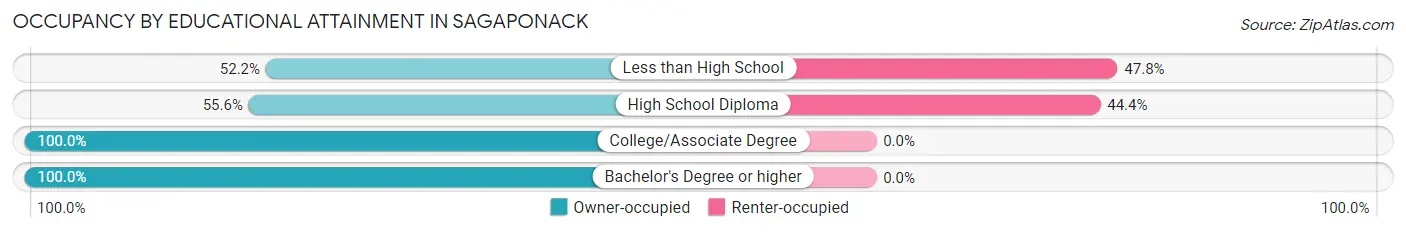
| Household Size | Owner-occupied | Renter-occupied |
| Less than High School | 12 (52.2%) | 11 (47.8%) |
| High School Diploma | 10 (55.6%) | 8 (44.4%) |
| College/Associate Degree | 23 (100.0%) | 0 (0.0%) |
| Bachelor's Degree or higher | 97 (100.0%) | 0 (0.0%) |
Occupancy by Age of Householder in Sagaponack
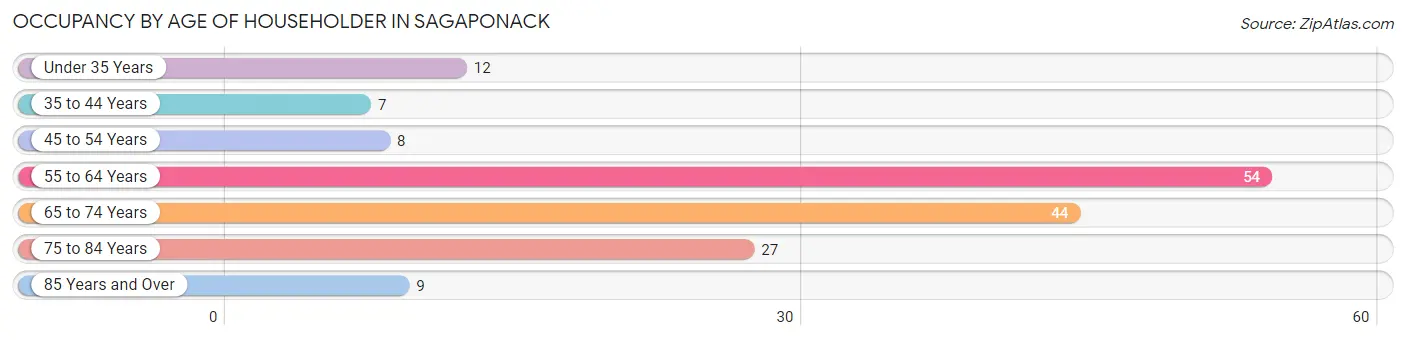
| Age Bracket | # Households | % Households |
| Under 35 Years | 12 | 7.4% |
| 35 to 44 Years | 7 | 4.3% |
| 45 to 54 Years | 8 | 5.0% |
| 55 to 64 Years | 54 | 33.5% |
| 65 to 74 Years | 44 | 27.3% |
| 75 to 84 Years | 27 | 16.8% |
| 85 Years and Over | 9 | 5.6% |
| Total | 161 | 100.0% |
Housing Finances in Sagaponack
Median Income by Occupancy in Sagaponack
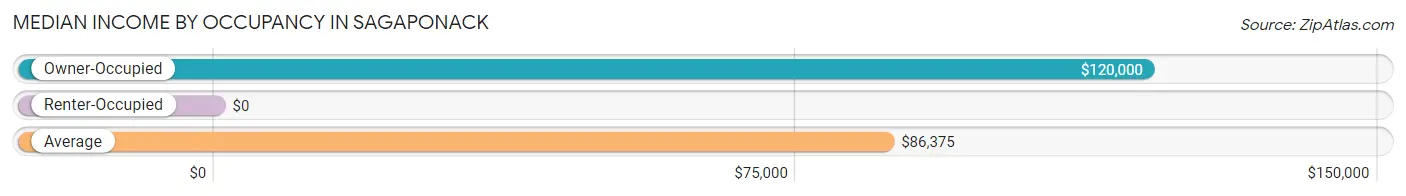
| Occupancy Type | # Households | Median Income |
| Owner-Occupied | 142 (88.2%) | $120,000 |
| Renter-Occupied | 19 (11.8%) | $0 |
| Average | 161 (100.0%) | $86,375 |
Occupancy by Householder Income Bracket in Sagaponack
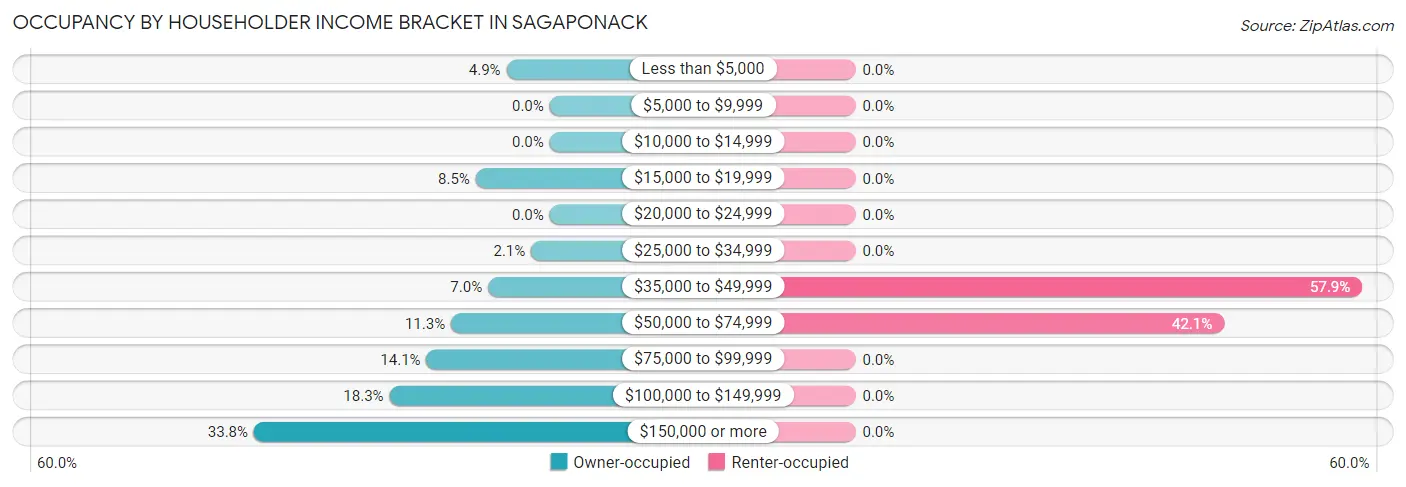
| Income Bracket | Owner-occupied | Renter-occupied |
| Less than $5,000 | 7 (4.9%) | 0 (0.0%) |
| $5,000 to $9,999 | 0 (0.0%) | 0 (0.0%) |
| $10,000 to $14,999 | 0 (0.0%) | 0 (0.0%) |
| $15,000 to $19,999 | 12 (8.5%) | 0 (0.0%) |
| $20,000 to $24,999 | 0 (0.0%) | 0 (0.0%) |
| $25,000 to $34,999 | 3 (2.1%) | 0 (0.0%) |
| $35,000 to $49,999 | 10 (7.0%) | 11 (57.9%) |
| $50,000 to $74,999 | 16 (11.3%) | 8 (42.1%) |
| $75,000 to $99,999 | 20 (14.1%) | 0 (0.0%) |
| $100,000 to $149,999 | 26 (18.3%) | 0 (0.0%) |
| $150,000 or more | 48 (33.8%) | 0 (0.0%) |
| Total | 142 (100.0%) | 19 (100.0%) |
Monthly Housing Cost Tiers in Sagaponack
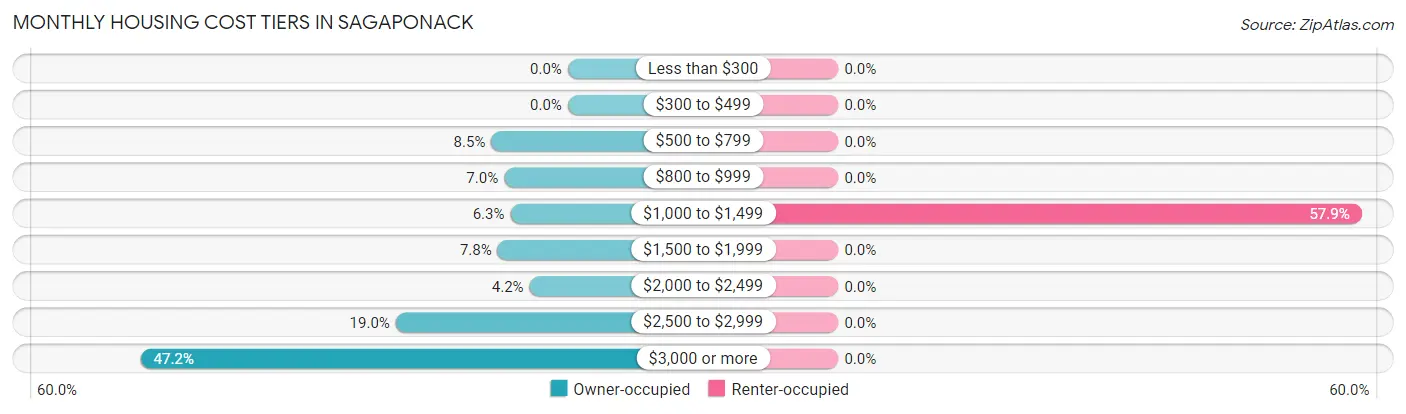
| Monthly Cost | Owner-occupied | Renter-occupied |
| Less than $300 | 0 (0.0%) | 0 (0.0%) |
| $300 to $499 | 0 (0.0%) | 0 (0.0%) |
| $500 to $799 | 12 (8.5%) | 0 (0.0%) |
| $800 to $999 | 10 (7.0%) | 0 (0.0%) |
| $1,000 to $1,499 | 9 (6.3%) | 11 (57.9%) |
| $1,500 to $1,999 | 11 (7.7%) | 0 (0.0%) |
| $2,000 to $2,499 | 6 (4.2%) | 0 (0.0%) |
| $2,500 to $2,999 | 27 (19.0%) | 0 (0.0%) |
| $3,000 or more | 67 (47.2%) | 0 (0.0%) |
| Total | 142 (100.0%) | 19 (100.0%) |
Physical Housing Characteristics in Sagaponack
Housing Structures in Sagaponack
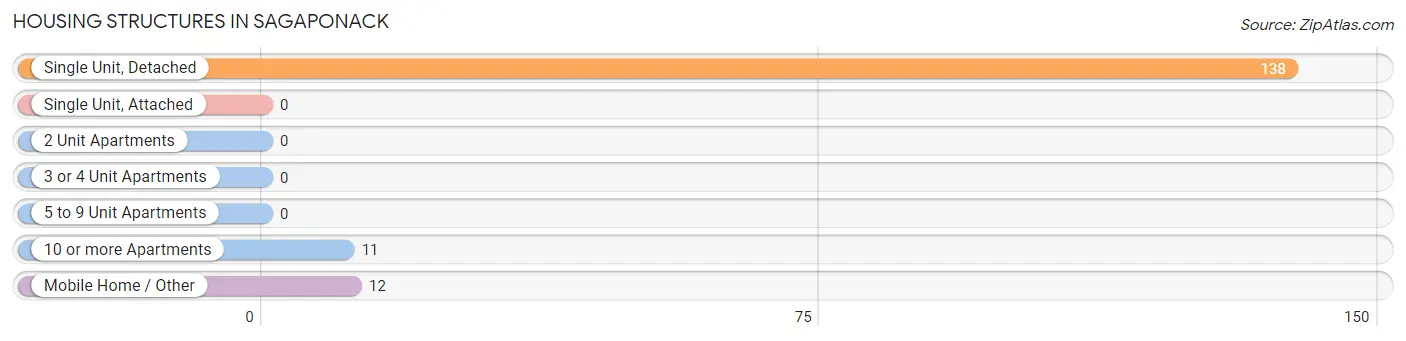
| Structure Type | # Housing Units | % Housing Units |
| Single Unit, Detached | 138 | 85.7% |
| Single Unit, Attached | 0 | 0.0% |
| 2 Unit Apartments | 0 | 0.0% |
| 3 or 4 Unit Apartments | 0 | 0.0% |
| 5 to 9 Unit Apartments | 0 | 0.0% |
| 10 or more Apartments | 11 | 6.8% |
| Mobile Home / Other | 12 | 7.4% |
| Total | 161 | 100.0% |
Housing Structures by Occupancy in Sagaponack
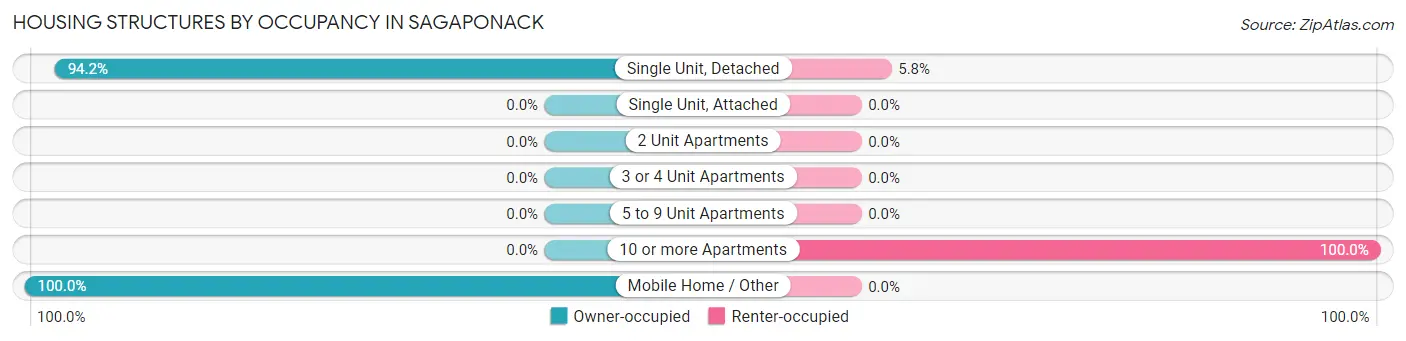
| Structure Type | Owner-occupied | Renter-occupied |
| Single Unit, Detached | 130 (94.2%) | 8 (5.8%) |
| Single Unit, Attached | 0 (0.0%) | 0 (0.0%) |
| 2 Unit Apartments | 0 (0.0%) | 0 (0.0%) |
| 3 or 4 Unit Apartments | 0 (0.0%) | 0 (0.0%) |
| 5 to 9 Unit Apartments | 0 (0.0%) | 0 (0.0%) |
| 10 or more Apartments | 0 (0.0%) | 11 (100.0%) |
| Mobile Home / Other | 12 (100.0%) | 0 (0.0%) |
| Total | 142 (88.2%) | 19 (11.8%) |
Housing Structures by Number of Rooms in Sagaponack
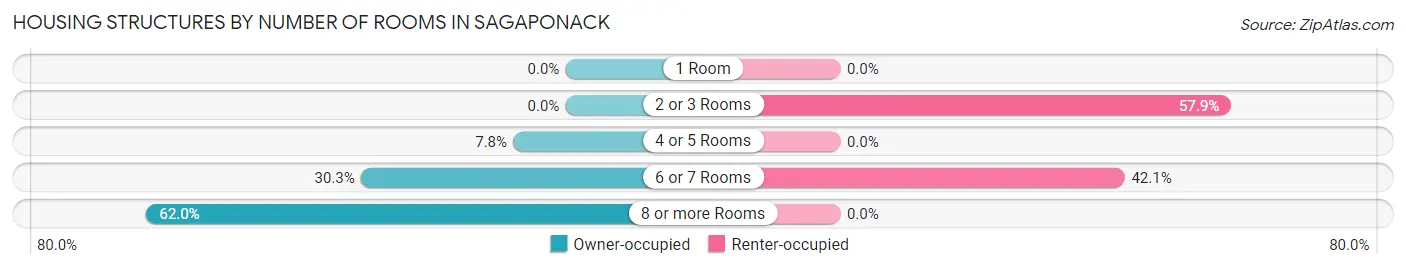
| Number of Rooms | Owner-occupied | Renter-occupied |
| 1 Room | 0 (0.0%) | 0 (0.0%) |
| 2 or 3 Rooms | 0 (0.0%) | 11 (57.9%) |
| 4 or 5 Rooms | 11 (7.7%) | 0 (0.0%) |
| 6 or 7 Rooms | 43 (30.3%) | 8 (42.1%) |
| 8 or more Rooms | 88 (62.0%) | 0 (0.0%) |
| Total | 142 (100.0%) | 19 (100.0%) |
Housing Structure by Heating Type in Sagaponack
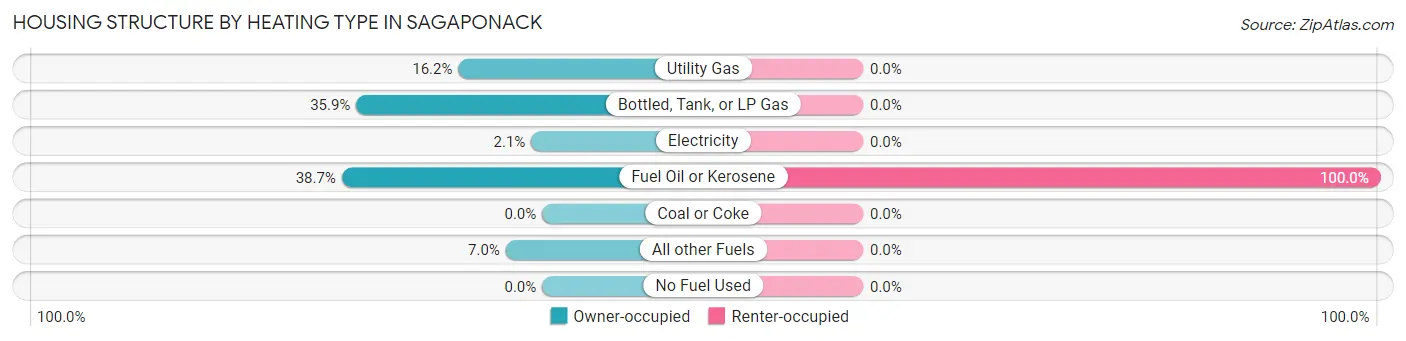
| Heating Type | Owner-occupied | Renter-occupied |
| Utility Gas | 23 (16.2%) | 0 (0.0%) |
| Bottled, Tank, or LP Gas | 51 (35.9%) | 0 (0.0%) |
| Electricity | 3 (2.1%) | 0 (0.0%) |
| Fuel Oil or Kerosene | 55 (38.7%) | 19 (100.0%) |
| Coal or Coke | 0 (0.0%) | 0 (0.0%) |
| All other Fuels | 10 (7.0%) | 0 (0.0%) |
| No Fuel Used | 0 (0.0%) | 0 (0.0%) |
| Total | 142 (100.0%) | 19 (100.0%) |
Household Vehicle Usage in Sagaponack
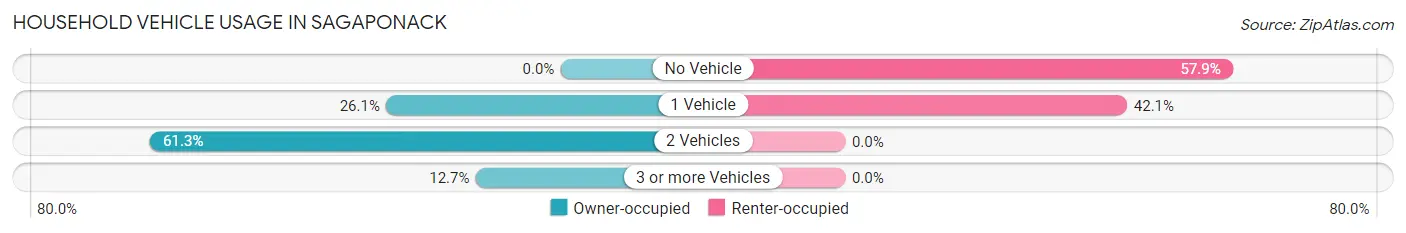
| Vehicles per Household | Owner-occupied | Renter-occupied |
| No Vehicle | 0 (0.0%) | 11 (57.9%) |
| 1 Vehicle | 37 (26.1%) | 8 (42.1%) |
| 2 Vehicles | 87 (61.3%) | 0 (0.0%) |
| 3 or more Vehicles | 18 (12.7%) | 0 (0.0%) |
| Total | 142 (100.0%) | 19 (100.0%) |
Real Estate & Mortgages in Sagaponack
Real Estate and Mortgage Overview in Sagaponack
| Characteristic | Without Mortgage | With Mortgage |
| Housing Units | 70 | 72 |
| Median Property Value | $2,000,001 | $2,000,001 |
| Median Household Income | - | - |
| Monthly Housing Costs | $1,501 | $65 |
| Real Estate Taxes | $10,001 | $0 |
Property Value by Mortgage Status in Sagaponack
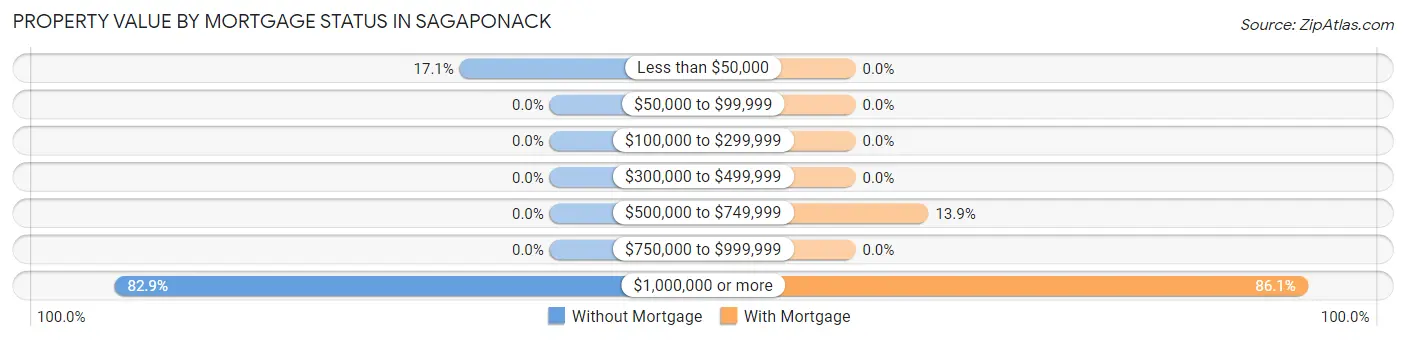
| Property Value | Without Mortgage | With Mortgage |
| Less than $50,000 | 12 (17.1%) | 0 (0.0%) |
| $50,000 to $99,999 | 0 (0.0%) | 0 (0.0%) |
| $100,000 to $299,999 | 0 (0.0%) | 0 (0.0%) |
| $300,000 to $499,999 | 0 (0.0%) | 0 (0.0%) |
| $500,000 to $749,999 | 0 (0.0%) | 10 (13.9%) |
| $750,000 to $999,999 | 0 (0.0%) | 0 (0.0%) |
| $1,000,000 or more | 58 (82.9%) | 62 (86.1%) |
| Total | 70 (100.0%) | 72 (100.0%) |
Household Income by Mortgage Status in Sagaponack
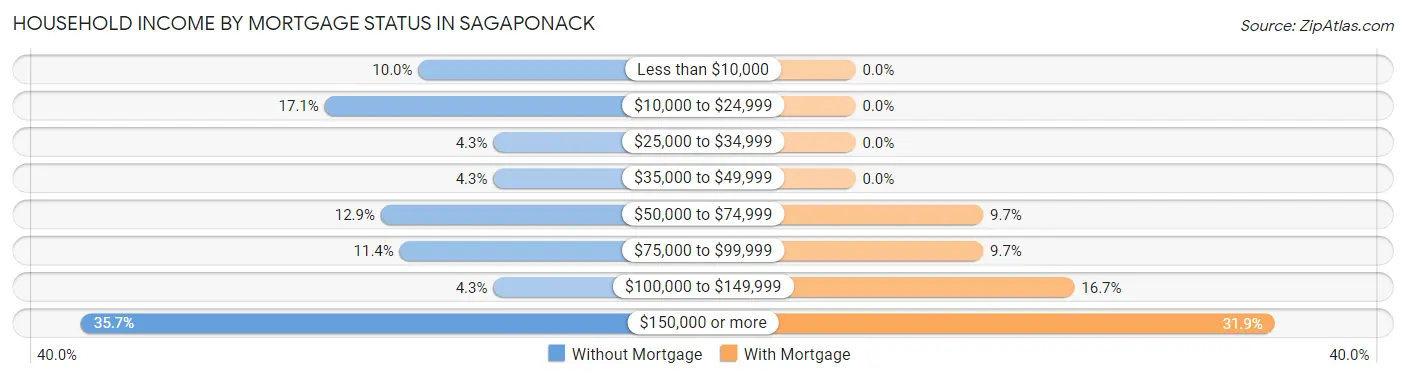
| Household Income | Without Mortgage | With Mortgage |
| Less than $10,000 | 7 (10.0%) | 0 (0.0%) |
| $10,000 to $24,999 | 12 (17.1%) | 0 (0.0%) |
| $25,000 to $34,999 | 3 (4.3%) | 0 (0.0%) |
| $35,000 to $49,999 | 3 (4.3%) | 0 (0.0%) |
| $50,000 to $74,999 | 9 (12.9%) | 7 (9.7%) |
| $75,000 to $99,999 | 8 (11.4%) | 7 (9.7%) |
| $100,000 to $149,999 | 3 (4.3%) | 12 (16.7%) |
| $150,000 or more | 25 (35.7%) | 23 (31.9%) |
| Total | 70 (100.0%) | 72 (100.0%) |
Property Value to Household Income Ratio in Sagaponack
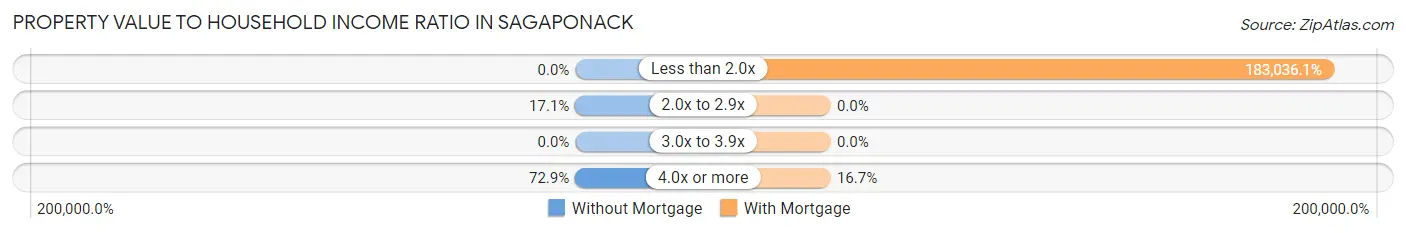
| Value-to-Income Ratio | Without Mortgage | With Mortgage |
| Less than 2.0x | 0 (0.0%) | 131,786 (183,036.1%) |
| 2.0x to 2.9x | 12 (17.1%) | 0 (0.0%) |
| 3.0x to 3.9x | 0 (0.0%) | 0 (0.0%) |
| 4.0x or more | 51 (72.9%) | 12 (16.7%) |
| Total | 70 (100.0%) | 72 (100.0%) |
Real Estate Taxes by Mortgage Status in Sagaponack
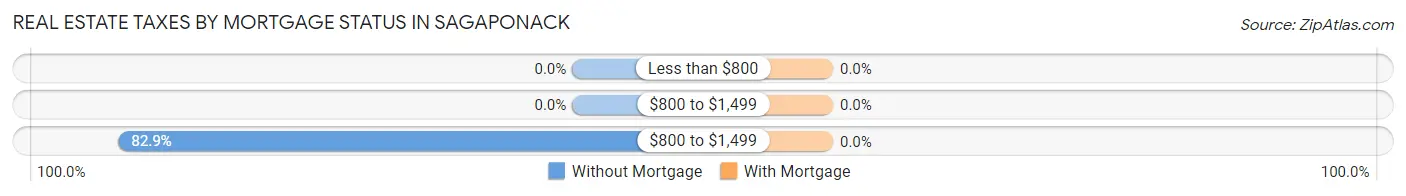
| Property Taxes | Without Mortgage | With Mortgage |
| Less than $800 | 0 (0.0%) | 0 (0.0%) |
| $800 to $1,499 | 0 (0.0%) | 0 (0.0%) |
| $800 to $1,499 | 58 (82.9%) | 0 (0.0%) |
| Total | 70 (100.0%) | 72 (100.0%) |
Health & Disability in Sagaponack
Health Insurance Coverage by Age in Sagaponack
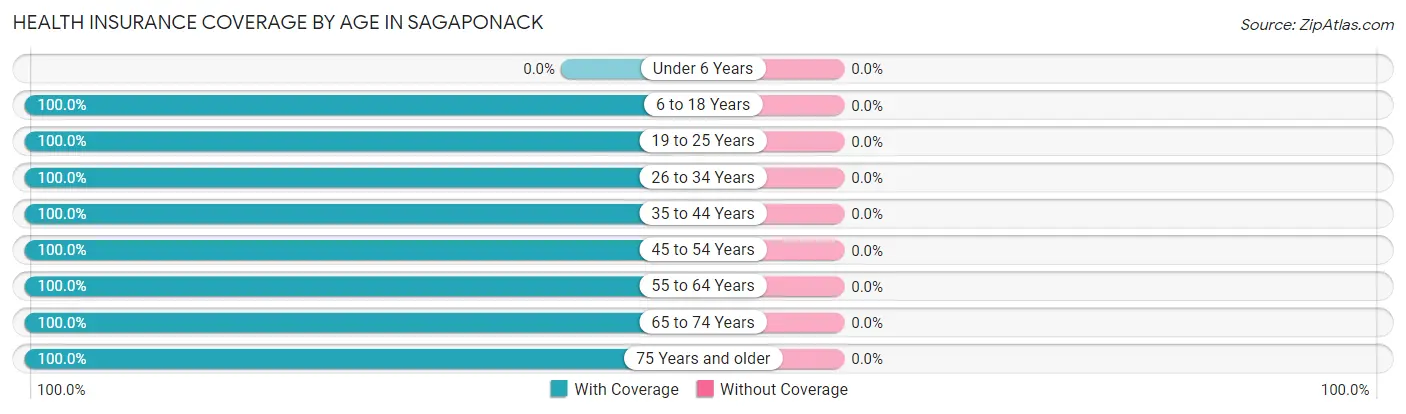
| Age Bracket | With Coverage | Without Coverage |
| Under 6 Years | 0 (0.0%) | 0 (0.0%) |
| 6 to 18 Years | 53 (100.0%) | 0 (0.0%) |
| 19 to 25 Years | 22 (100.0%) | 0 (0.0%) |
| 26 to 34 Years | 28 (100.0%) | 0 (0.0%) |
| 35 to 44 Years | 21 (100.0%) | 0 (0.0%) |
| 45 to 54 Years | 8 (100.0%) | 0 (0.0%) |
| 55 to 64 Years | 71 (100.0%) | 0 (0.0%) |
| 65 to 74 Years | 77 (100.0%) | 0 (0.0%) |
| 75 Years and older | 64 (100.0%) | 0 (0.0%) |
| Total | 344 (100.0%) | 0 (0.0%) |
Health Insurance Coverage by Citizenship Status in Sagaponack
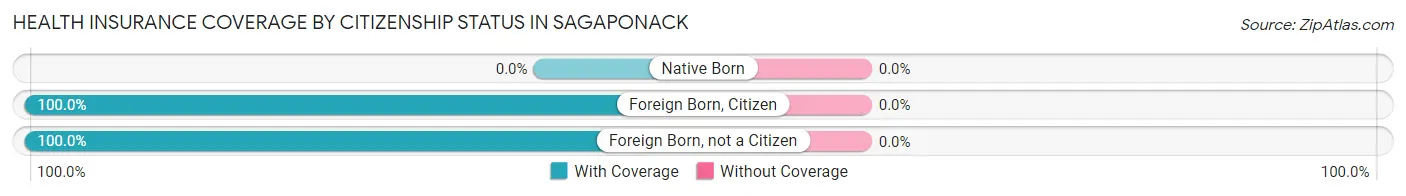
| Citizenship Status | With Coverage | Without Coverage |
| Native Born | 0 (0.0%) | 0 (0.0%) |
| Foreign Born, Citizen | 53 (100.0%) | 0 (0.0%) |
| Foreign Born, not a Citizen | 22 (100.0%) | 0 (0.0%) |
Health Insurance Coverage by Household Income in Sagaponack
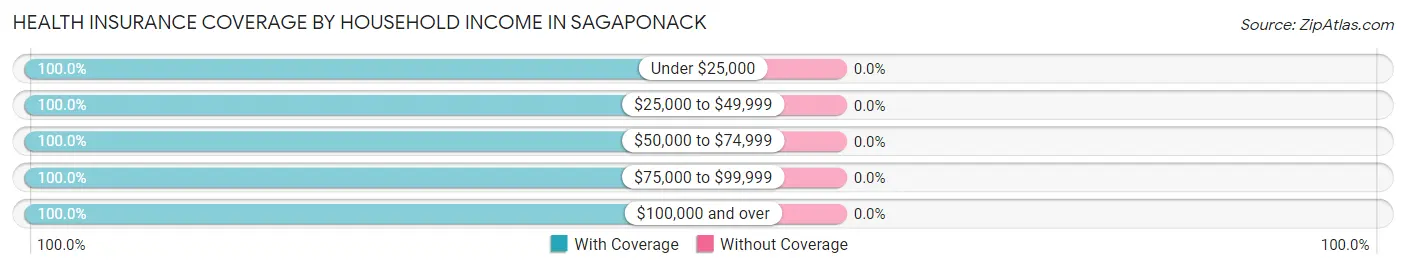
| Household Income | With Coverage | Without Coverage |
| Under $25,000 | 46 (100.0%) | 0 (0.0%) |
| $25,000 to $49,999 | 80 (100.0%) | 0 (0.0%) |
| $50,000 to $74,999 | 50 (100.0%) | 0 (0.0%) |
| $75,000 to $99,999 | 22 (100.0%) | 0 (0.0%) |
| $100,000 and over | 146 (100.0%) | 0 (0.0%) |
Public vs Private Health Insurance Coverage by Age in Sagaponack
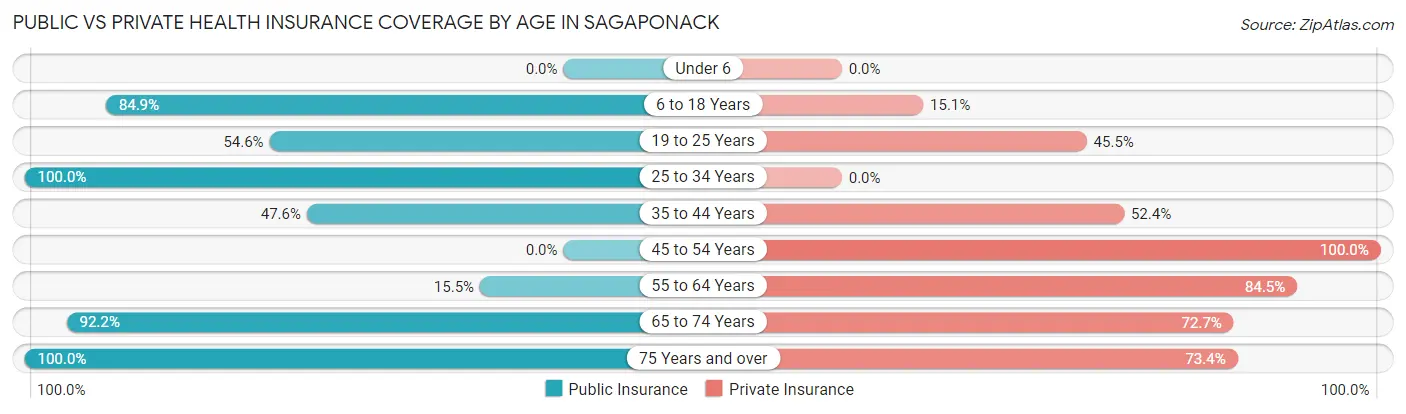
| Age Bracket | Public Insurance | Private Insurance |
| Under 6 | 0 (0.0%) | 0 (0.0%) |
| 6 to 18 Years | 45 (84.9%) | 8 (15.1%) |
| 19 to 25 Years | 12 (54.5%) | 10 (45.5%) |
| 25 to 34 Years | 28 (100.0%) | 0 (0.0%) |
| 35 to 44 Years | 10 (47.6%) | 11 (52.4%) |
| 45 to 54 Years | 0 (0.0%) | 8 (100.0%) |
| 55 to 64 Years | 11 (15.5%) | 60 (84.5%) |
| 65 to 74 Years | 71 (92.2%) | 56 (72.7%) |
| 75 Years and over | 64 (100.0%) | 47 (73.4%) |
| Total | 241 (70.1%) | 200 (58.1%) |
Disability Status by Sex by Age in Sagaponack
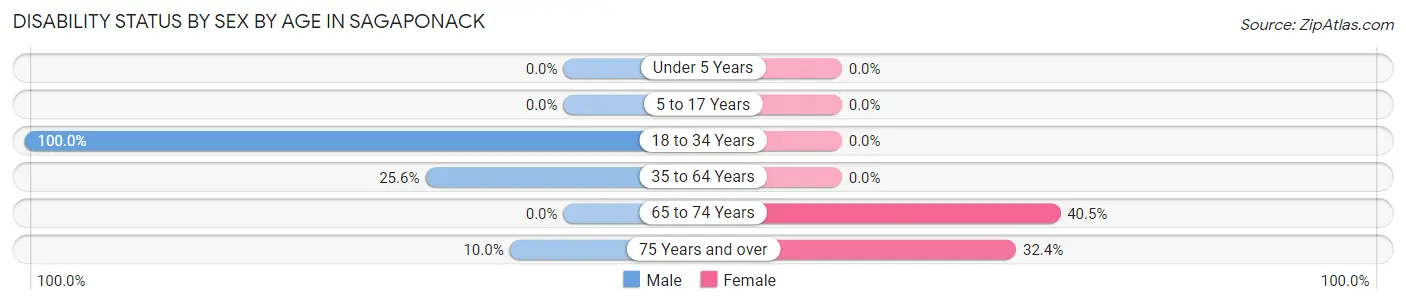
| Age Bracket | Male | Female |
| Under 5 Years | 0 (0.0%) | 0 (0.0%) |
| 5 to 17 Years | 0 (0.0%) | 0 (0.0%) |
| 18 to 34 Years | 12 (100.0%) | 0 (0.0%) |
| 35 to 64 Years | 10 (25.6%) | 0 (0.0%) |
| 65 to 74 Years | 0 (0.0%) | 15 (40.5%) |
| 75 Years and over | 3 (10.0%) | 11 (32.4%) |
Disability Class by Sex by Age in Sagaponack
Disability Class: Hearing Difficulty
| Age Bracket | Male | Female |
| Under 5 Years | 0 (0.0%) | 0 (0.0%) |
| 5 to 17 Years | 0 (0.0%) | 0 (0.0%) |
| 18 to 34 Years | 0 (0.0%) | 0 (0.0%) |
| 35 to 64 Years | 0 (0.0%) | 0 (0.0%) |
| 65 to 74 Years | 0 (0.0%) | 0 (0.0%) |
| 75 Years and over | 0 (0.0%) | 0 (0.0%) |
Disability Class: Vision Difficulty
| Age Bracket | Male | Female |
| Under 5 Years | 0 (0.0%) | 0 (0.0%) |
| 5 to 17 Years | 0 (0.0%) | 0 (0.0%) |
| 18 to 34 Years | 0 (0.0%) | 0 (0.0%) |
| 35 to 64 Years | 0 (0.0%) | 0 (0.0%) |
| 65 to 74 Years | 0 (0.0%) | 0 (0.0%) |
| 75 Years and over | 0 (0.0%) | 0 (0.0%) |
Disability Class: Cognitive Difficulty
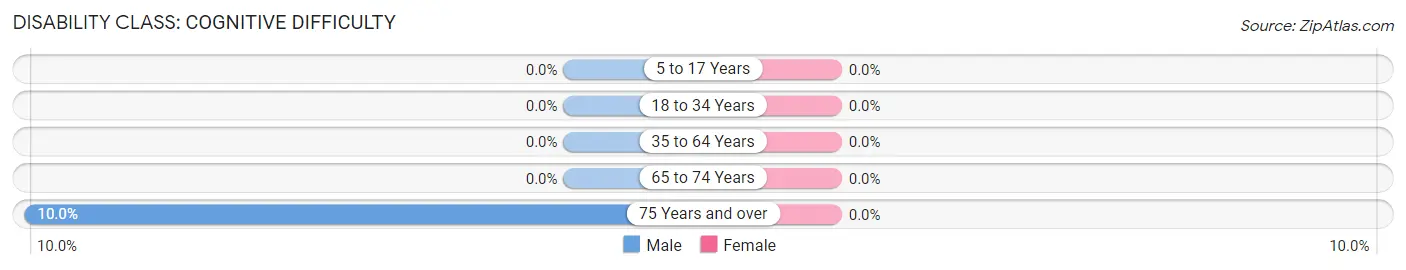
| Age Bracket | Male | Female |
| 5 to 17 Years | 0 (0.0%) | 0 (0.0%) |
| 18 to 34 Years | 0 (0.0%) | 0 (0.0%) |
| 35 to 64 Years | 0 (0.0%) | 0 (0.0%) |
| 65 to 74 Years | 0 (0.0%) | 0 (0.0%) |
| 75 Years and over | 3 (10.0%) | 0 (0.0%) |
Disability Class: Ambulatory Difficulty
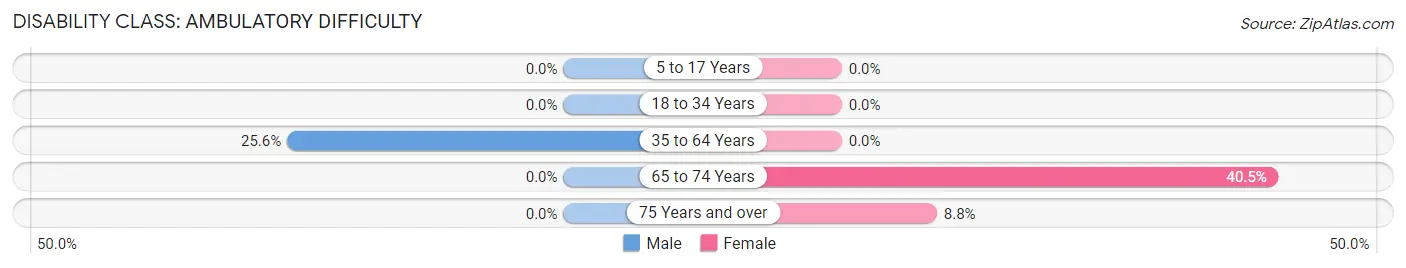
| Age Bracket | Male | Female |
| 5 to 17 Years | 0 (0.0%) | 0 (0.0%) |
| 18 to 34 Years | 0 (0.0%) | 0 (0.0%) |
| 35 to 64 Years | 10 (25.6%) | 0 (0.0%) |
| 65 to 74 Years | 0 (0.0%) | 15 (40.5%) |
| 75 Years and over | 0 (0.0%) | 3 (8.8%) |
Disability Class: Self-Care Difficulty
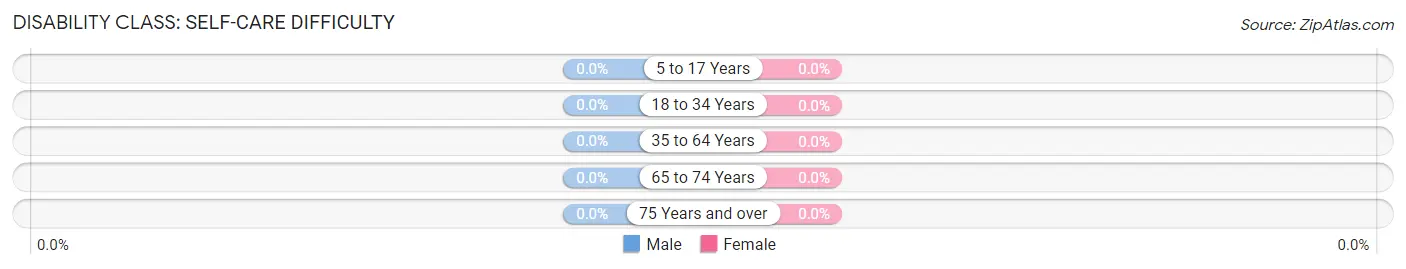
| Age Bracket | Male | Female |
| 5 to 17 Years | 0 (0.0%) | 0 (0.0%) |
| 18 to 34 Years | 0 (0.0%) | 0 (0.0%) |
| 35 to 64 Years | 0 (0.0%) | 0 (0.0%) |
| 65 to 74 Years | 0 (0.0%) | 0 (0.0%) |
| 75 Years and over | 0 (0.0%) | 0 (0.0%) |
Technology Access in Sagaponack
Computing Device Access in Sagaponack
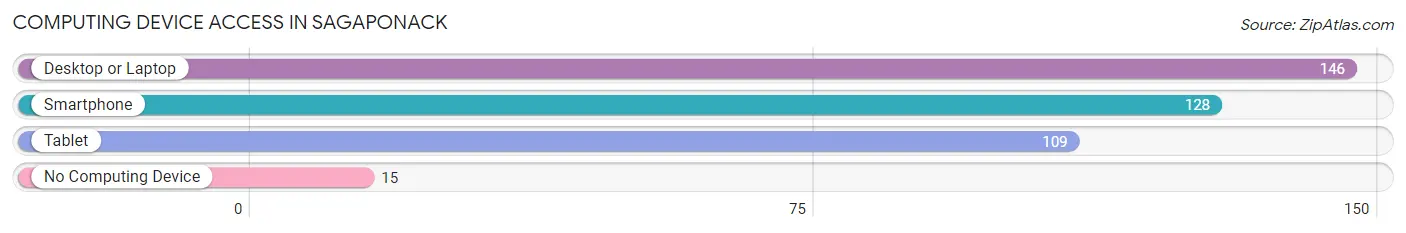
| Device Type | # Households | % Households |
| Desktop or Laptop | 146 | 90.7% |
| Smartphone | 128 | 79.5% |
| Tablet | 109 | 67.7% |
| No Computing Device | 15 | 9.3% |
| Total | 161 | 100.0% |
Internet Access in Sagaponack
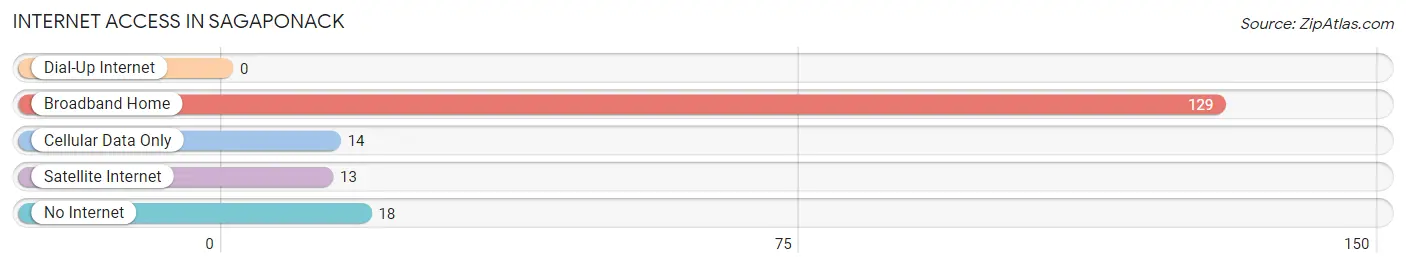
| Internet Type | # Households | % Households |
| Dial-Up Internet | 0 | 0.0% |
| Broadband Home | 129 | 80.1% |
| Cellular Data Only | 14 | 8.7% |
| Satellite Internet | 13 | 8.1% |
| No Internet | 18 | 11.2% |
| Total | 161 | 100.0% |
Sagaponack Summary
Sagaponack is a small village located in the Town of Southampton in Suffolk County, New York. It is situated on the eastern end of Long Island, approximately 90 miles east of New York City. The village is bordered by the Atlantic Ocean to the south, the Peconic Bay to the north, and the hamlet of Bridgehampton to the west. The village has a population of approximately 500 people and covers an area of 1.5 square miles.
History
The area that is now Sagaponack was originally inhabited by the Shinnecock Native American tribe. The first European settlers arrived in the area in the late 17th century, and the village was officially incorporated in 1692. The village was named after the Shinnecock word for “land of the big ground nuts”, referring to the abundance of chestnuts in the area.
In the 19th century, Sagaponack was a popular destination for wealthy New Yorkers looking to escape the hustle and bustle of the city. The village was home to several large estates, including the estate of John Jacob Astor IV, which was later purchased by the Rockefeller family.
Geography
Sagaponack is located on the eastern end of Long Island, approximately 90 miles east of New York City. The village is bordered by the Atlantic Ocean to the south, the Peconic Bay to the north, and the hamlet of Bridgehampton to the west. The village has a total area of 1.5 square miles, all of which is land.
The village is located on a narrow strip of land between the Atlantic Ocean and the Peconic Bay. The terrain is mostly flat, with some rolling hills in the northern part of the village. The village is home to several beaches, including Sagg Main Beach, Sagg Beach, and Flying Point Beach.
Economy
The economy of Sagaponack is largely based on tourism and agriculture. The village is home to several wineries, including Wölffer Estate Vineyard and Channing Daughters Winery. The village is also home to several farms, including the Quail Hill Farm and the Satur Farms.
The village is also home to several art galleries, including the Parrish Art Museum and the Pollock-Krasner House and Study Center. The village is also home to several restaurants, including the Sagg Main Beach Café and the Sagg Store.
Demographics
As of the 2010 census, the population of Sagaponack was 500 people, with a population density of 333 people per square mile. The median age of the population was 48.7 years, with a gender ratio of 51.2% female and 48.8% male.
The racial makeup of the village was 94.2% White, 1.2% African American, 0.2% Native American, 0.8% Asian, 0.2% Pacific Islander, 0.4% from other races, and 2.8% from two or more races. The median household income was $125,000, and the median family income was $150,000.
Conclusion
Sagaponack is a small village located in the Town of Southampton in Suffolk County, New York. It is situated on the eastern end of Long Island, approximately 90 miles east of New York City. The village has a population of approximately 500 people and covers an area of 1.5 square miles. The economy of Sagaponack is largely based on tourism and agriculture, and the village is home to several wineries, farms, art galleries, and restaurants. The population of the village is predominantly White, with a median household income of $125,000 and a median family income of $150,000.
Common Questions
What is Per Capita Income in Sagaponack?
Per Capita income in Sagaponack is $147,499.
What is the Median Family Income in Sagaponack?
Median Family Income in Sagaponack is $130,893.
What is the Median Household income in Sagaponack?
Median Household Income in Sagaponack is $86,375.
What is Income or Wage Gap in Sagaponack?
Income or Wage Gap in Sagaponack is 12.5%.
Women in Sagaponack earn 87.5 cents for every dollar earned by a man.
What is Inequality or Gini Index in Sagaponack?
Inequality or Gini Index in Sagaponack is 0.67.
What is the Total Population of Sagaponack?
Total Population of Sagaponack is 344.
What is the Total Male Population of Sagaponack?
Total Male Population of Sagaponack is 162.
What is the Total Female Population of Sagaponack?
Total Female Population of Sagaponack is 182.
What is the Ratio of Males per 100 Females in Sagaponack?
There are 89.01 Males per 100 Females in Sagaponack.
What is the Ratio of Females per 100 Males in Sagaponack?
There are 112.35 Females per 100 Males in Sagaponack.
What is the Median Population Age in Sagaponack?
Median Population Age in Sagaponack is 60.6 Years.
What is the Average Family Size in Sagaponack
Average Family Size in Sagaponack is 3.0 People.
What is the Average Household Size in Sagaponack
Average Household Size in Sagaponack is 2.1 People.
How Large is the Labor Force in Sagaponack?
There are 127 People in the Labor Forcein in Sagaponack.
What is the Percentage of People in the Labor Force in Sagaponack?
42.5% of People are in the Labor Force in Sagaponack.