South Lima, NY Map & Demographics
South Lima Map
South Lima Overview
$55,418
PER CAPITA INCOME
$113,173
AVG FAMILY INCOME
$103,750
AVG HOUSEHOLD INCOME
24.4%
WAGE / INCOME GAP [ % ]
75.6¢/ $1
WAGE / INCOME GAP [ $ ]
0.38
INEQUALITY / GINI INDEX
291
TOTAL POPULATION
202
MALE POPULATION
89
FEMALE POPULATION
226.97
MALES / 100 FEMALES
44.06
FEMALES / 100 MALES
53.0
MEDIAN AGE
3.0
AVG FAMILY SIZE
2.8
AVG HOUSEHOLD SIZE
221
LABOR FORCE [ PEOPLE ]
77.8%
PERCENT IN LABOR FORCE
2.7%
UNEMPLOYMENT RATE
South Lima Area Codes
Income in South Lima
Income Overview in South Lima
Per Capita Income in South Lima is $55,418, while median incomes of families and households are $113,173 and $103,750 respectively.
| Characteristic | Number | Measure |
| Per Capita Income | 291 | $55,418 |
| Median Family Income | 87 | $113,173 |
| Mean Family Income | 87 | $157,544 |
| Median Household Income | 103 | $103,750 |
| Mean Household Income | 103 | $142,395 |
| Income Deficit | 87 | $0 |
| Wage / Income Gap (%) | 291 | 24.39% |
| Wage / Income Gap ($) | 291 | 75.61¢ per $1 |
| Gini / Inequality Index | 291 | 0.38 |
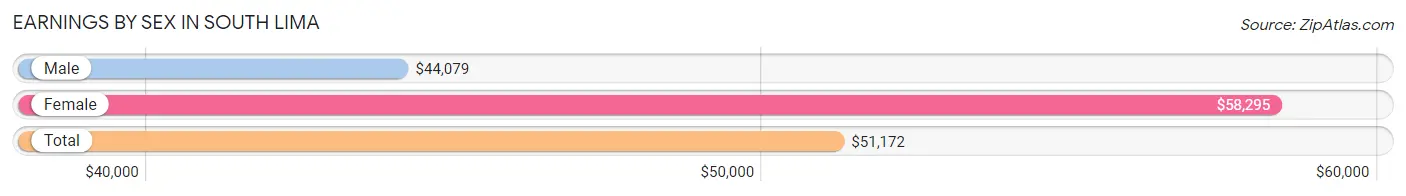
Earnings by Sex in South Lima
Average Earnings in South Lima are $51,172, $44,079 for men and $58,295 for women, a difference of 24.4%.
| Sex | Number | Average Earnings |
| Male | 146 (66.1%) | $44,079 |
| Female | 75 (33.9%) | $58,295 |
| Total | 221 (100.0%) | $51,172 |
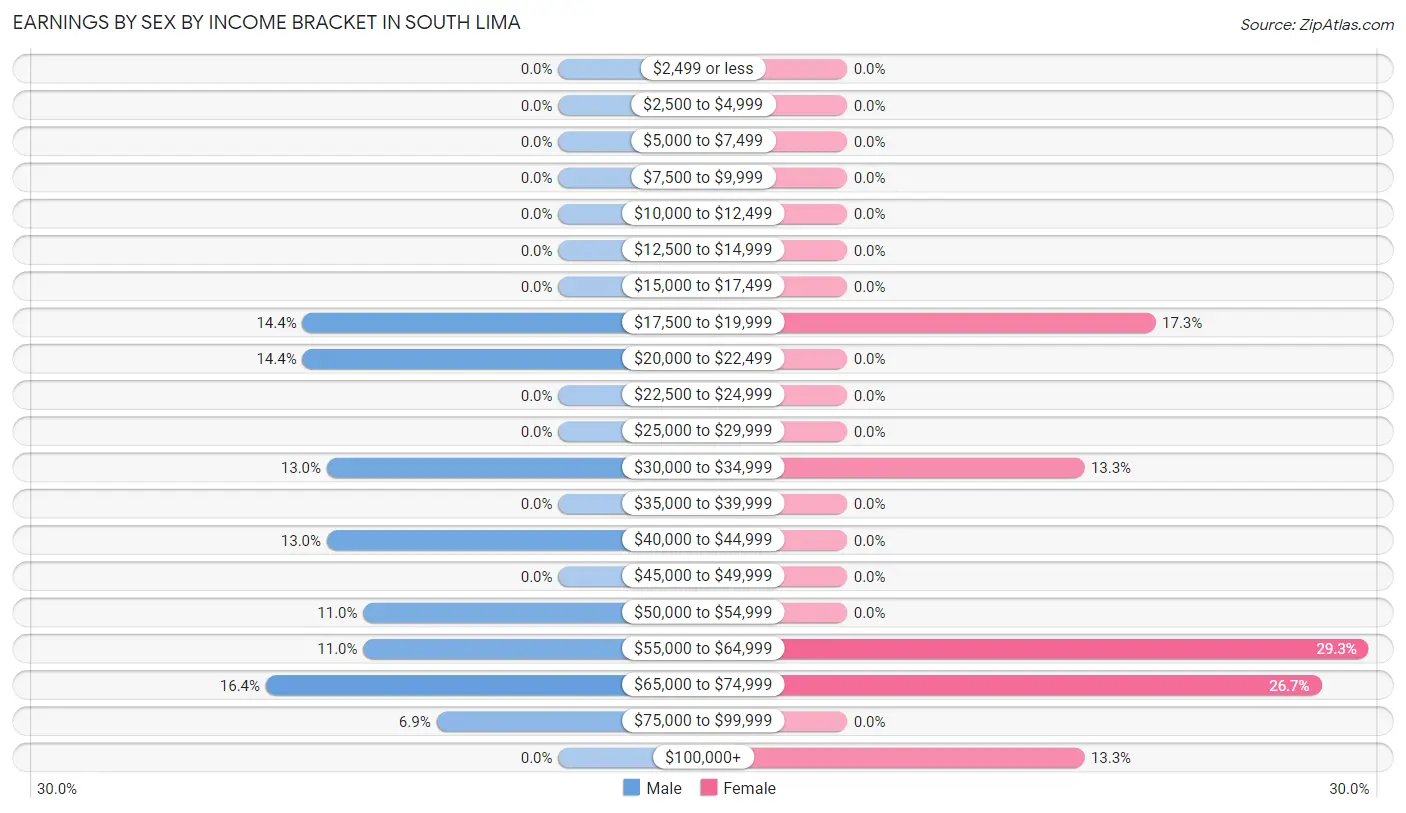
Earnings by Sex by Income Bracket in South Lima
The most common earnings brackets in South Lima are $65,000 to $74,999 for men (24 | 16.4%) and $55,000 to $64,999 for women (22 | 29.3%).
| Income | Male | Female |
| $2,499 or less | 0 (0.0%) | 0 (0.0%) |
| $2,500 to $4,999 | 0 (0.0%) | 0 (0.0%) |
| $5,000 to $7,499 | 0 (0.0%) | 0 (0.0%) |
| $7,500 to $9,999 | 0 (0.0%) | 0 (0.0%) |
| $10,000 to $12,499 | 0 (0.0%) | 0 (0.0%) |
| $12,500 to $14,999 | 0 (0.0%) | 0 (0.0%) |
| $15,000 to $17,499 | 0 (0.0%) | 0 (0.0%) |
| $17,500 to $19,999 | 21 (14.4%) | 13 (17.3%) |
| $20,000 to $22,499 | 21 (14.4%) | 0 (0.0%) |
| $22,500 to $24,999 | 0 (0.0%) | 0 (0.0%) |
| $25,000 to $29,999 | 0 (0.0%) | 0 (0.0%) |
| $30,000 to $34,999 | 19 (13.0%) | 10 (13.3%) |
| $35,000 to $39,999 | 0 (0.0%) | 0 (0.0%) |
| $40,000 to $44,999 | 19 (13.0%) | 0 (0.0%) |
| $45,000 to $49,999 | 0 (0.0%) | 0 (0.0%) |
| $50,000 to $54,999 | 16 (11.0%) | 0 (0.0%) |
| $55,000 to $64,999 | 16 (11.0%) | 22 (29.3%) |
| $65,000 to $74,999 | 24 (16.4%) | 20 (26.7%) |
| $75,000 to $99,999 | 10 (6.9%) | 0 (0.0%) |
| $100,000+ | 0 (0.0%) | 10 (13.3%) |
| Total | 146 (100.0%) | 75 (100.0%) |
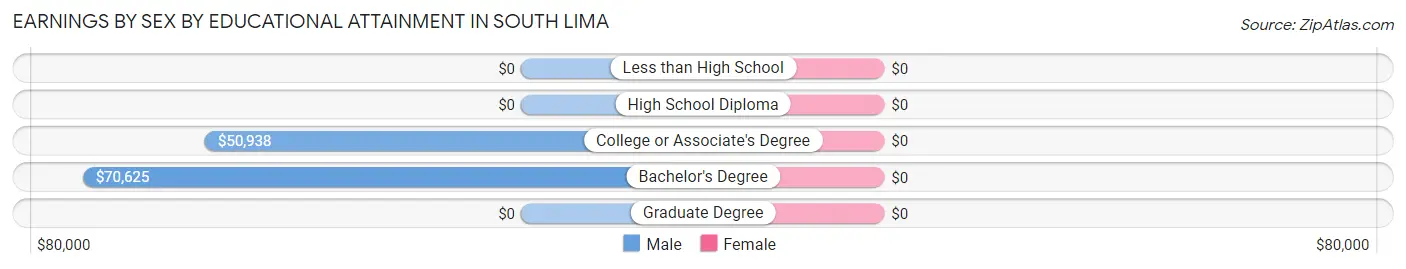
Earnings by Sex by Educational Attainment in South Lima
| Educational Attainment | Male Income | Female Income |
| Less than High School | - | - |
| High School Diploma | - | - |
| College or Associate's Degree | $50,938 | $0 |
| Bachelor's Degree | $70,625 | $0 |
| Graduate Degree | - | - |
| Total | $52,188 | $58,295 |
Family Income in South Lima
Family Income Brackets in South Lima
According to the South Lima family income data, there are 34 families falling into the $100,000 to $149,999 income range, which is the most common income bracket and makes up 39.1% of all families.
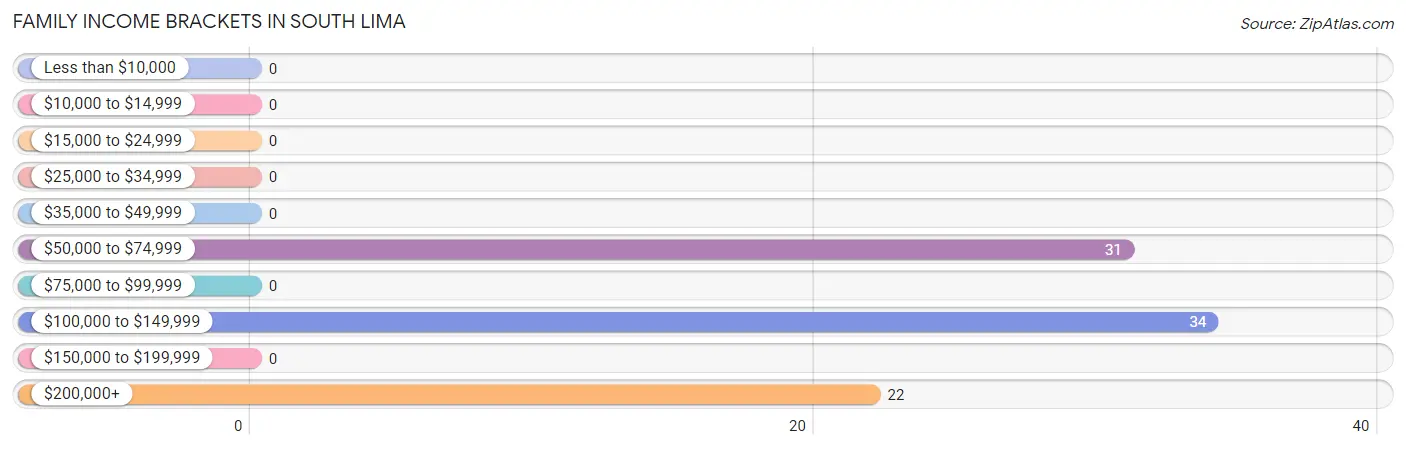
| Income Bracket | # Families | % Families |
| Less than $10,000 | 0 | 0.0% |
| $10,000 to $14,999 | 0 | 0.0% |
| $15,000 to $24,999 | 0 | 0.0% |
| $25,000 to $34,999 | 0 | 0.0% |
| $35,000 to $49,999 | 0 | 0.0% |
| $50,000 to $74,999 | 31 | 35.6% |
| $75,000 to $99,999 | 0 | 0.0% |
| $100,000 to $149,999 | 34 | 39.1% |
| $150,000 to $199,999 | 0 | 0.0% |
| $200,000+ | 22 | 25.3% |
Family Income by Famaliy Size in South Lima
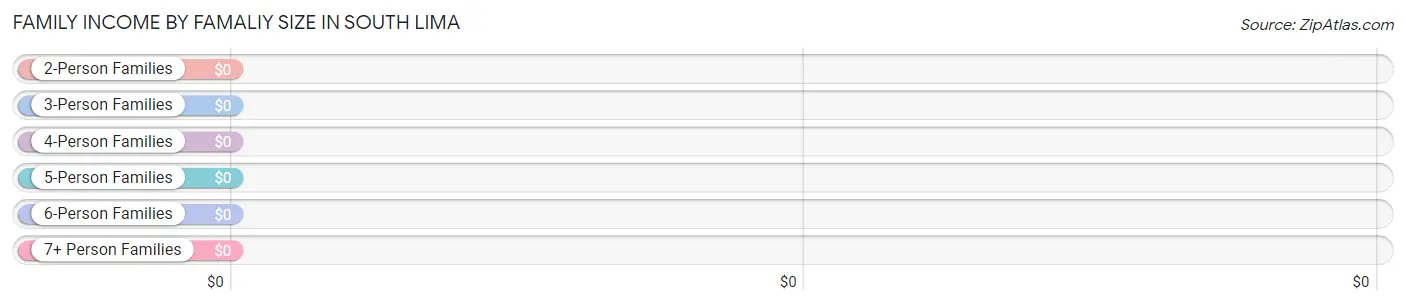
| Income Bracket | # Families | Median Income |
| 2-Person Families | 53 (60.9%) | $0 |
| 3-Person Families | 22 (25.3%) | $0 |
| 4-Person Families | 12 (13.8%) | $0 |
| 5-Person Families | 0 (0.0%) | $0 |
| 6-Person Families | 0 (0.0%) | $0 |
| 7+ Person Families | 0 (0.0%) | $0 |
| Total | 87 (100.0%) | $113,173 |
Family Income by Number of Earners in South Lima
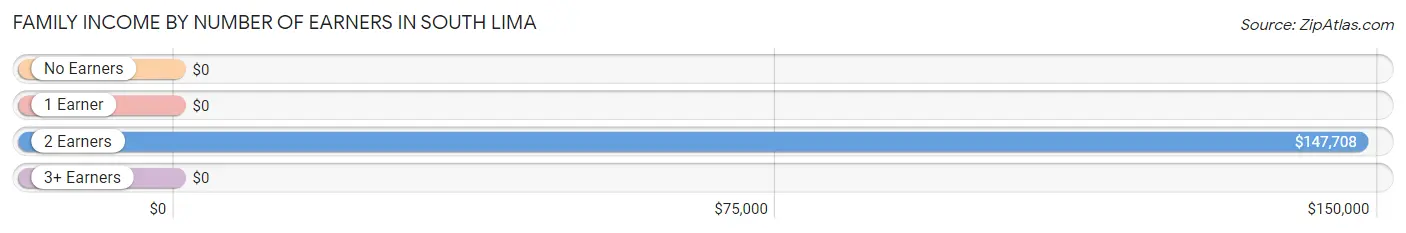
| Number of Earners | # Families | Median Income |
| No Earners | 20 (23.0%) | $0 |
| 1 Earner | 0 (0.0%) | $0 |
| 2 Earners | 42 (48.3%) | $147,708 |
| 3+ Earners | 25 (28.7%) | $0 |
| Total | 87 (100.0%) | $113,173 |
Household Income in South Lima
Household Income Brackets in South Lima
With 41 households falling in the category, the $50,000 to $74,999 income range is the most frequent in South Lima, accounting for 39.8% of all households.
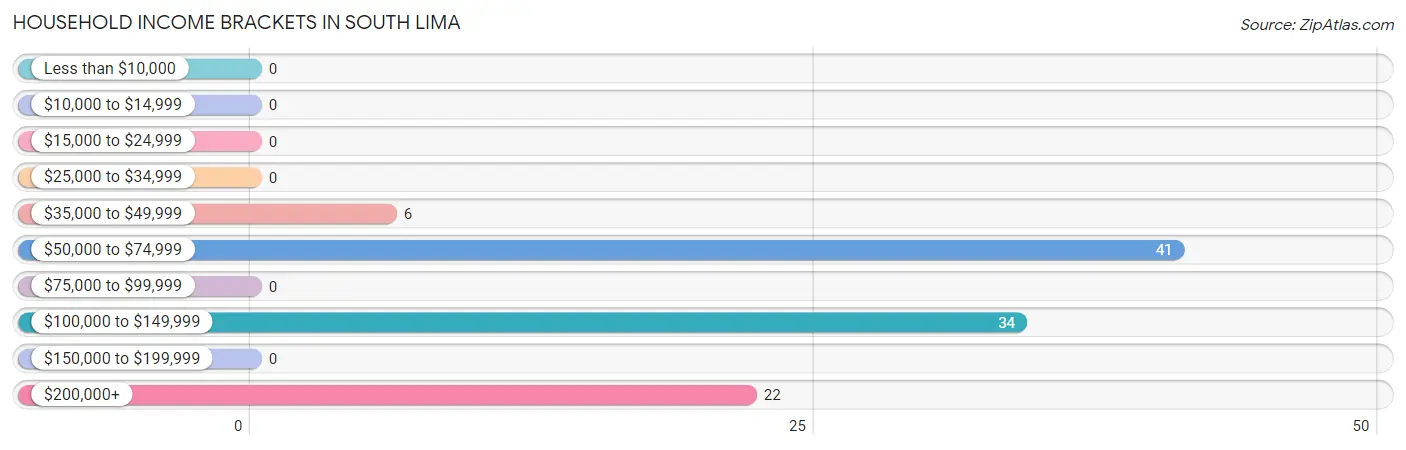
| Income Bracket | # Households | % Households |
| Less than $10,000 | 0 | 0.0% |
| $10,000 to $14,999 | 0 | 0.0% |
| $15,000 to $24,999 | 0 | 0.0% |
| $25,000 to $34,999 | 0 | 0.0% |
| $35,000 to $49,999 | 6 | 5.8% |
| $50,000 to $74,999 | 41 | 39.8% |
| $75,000 to $99,999 | 0 | 0.0% |
| $100,000 to $149,999 | 34 | 33.0% |
| $150,000 to $199,999 | 0 | 0.0% |
| $200,000+ | 22 | 21.4% |
Household Income by Householder Age in South Lima
The median household income in South Lima is $103,750, with the highest median household income of $114,038 found in the 45 to 64 years age bracket for the primary householder. A total of 58 households (56.3%) fall into this category.
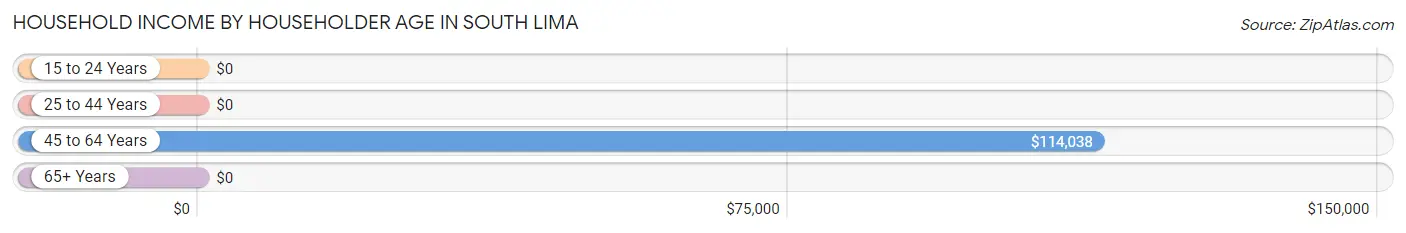
| Income Bracket | # Households | Median Income |
| 15 to 24 Years | 0 (0.0%) | $0 |
| 25 to 44 Years | 25 (24.3%) | $0 |
| 45 to 64 Years | 58 (56.3%) | $114,038 |
| 65+ Years | 20 (19.4%) | $0 |
| Total | 103 (100.0%) | $103,750 |
Poverty in South Lima
Income Below Poverty by Sex and Age in South Lima
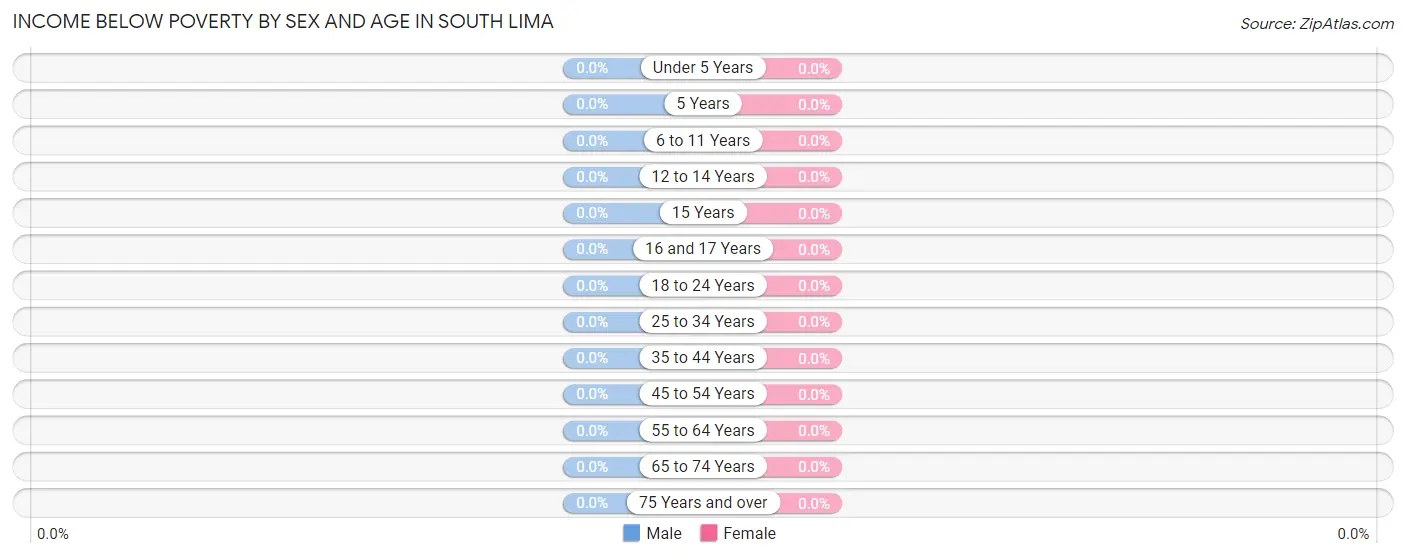
| Age Bracket | Male | Female |
| Under 5 Years | 0 (0.0%) | 0 (0.0%) |
| 5 Years | 0 (0.0%) | 0 (0.0%) |
| 6 to 11 Years | 0 (0.0%) | 0 (0.0%) |
| 12 to 14 Years | 0 (0.0%) | 0 (0.0%) |
| 15 Years | 0 (0.0%) | 0 (0.0%) |
| 16 and 17 Years | 0 (0.0%) | 0 (0.0%) |
| 18 to 24 Years | 0 (0.0%) | 0 (0.0%) |
| 25 to 34 Years | 0 (0.0%) | 0 (0.0%) |
| 35 to 44 Years | 0 (0.0%) | 0 (0.0%) |
| 45 to 54 Years | 0 (0.0%) | 0 (0.0%) |
| 55 to 64 Years | 0 (0.0%) | 0 (0.0%) |
| 65 to 74 Years | 0 (0.0%) | 0 (0.0%) |
| 75 Years and over | 0 (0.0%) | 0 (0.0%) |
| Total | 0 (0.0%) | 0 (0.0%) |
Income Above Poverty by Sex and Age in South Lima
According to the poverty statistics in South Lima, males aged 18 to 24 years and females aged under 5 years are the age groups that are most secure financially, with 100.0% of males and 100.0% of females in these age groups living above the poverty line.
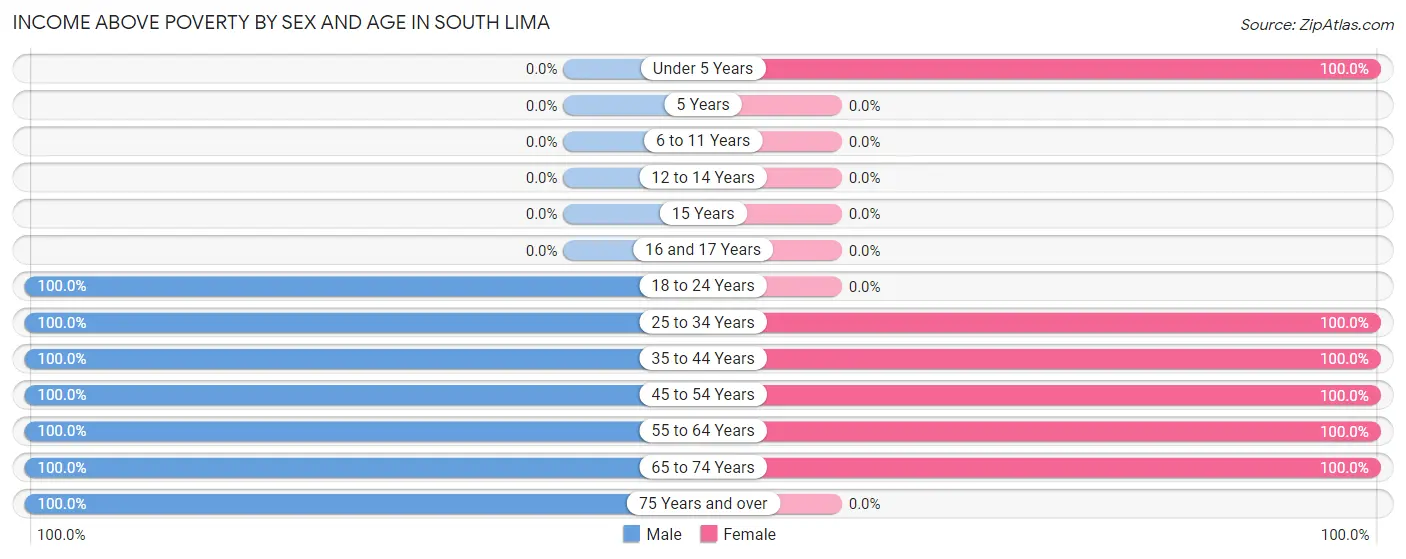
| Age Bracket | Male | Female |
| Under 5 Years | 0 (0.0%) | 7 (100.0%) |
| 5 Years | 0 (0.0%) | 0 (0.0%) |
| 6 to 11 Years | 0 (0.0%) | 0 (0.0%) |
| 12 to 14 Years | 0 (0.0%) | 0 (0.0%) |
| 15 Years | 0 (0.0%) | 0 (0.0%) |
| 16 and 17 Years | 0 (0.0%) | 0 (0.0%) |
| 18 to 24 Years | 42 (100.0%) | 0 (0.0%) |
| 25 to 34 Years | 48 (100.0%) | 10 (100.0%) |
| 35 to 44 Years | 19 (100.0%) | 8 (100.0%) |
| 45 to 54 Years | 36 (100.0%) | 32 (100.0%) |
| 55 to 64 Years | 37 (100.0%) | 25 (100.0%) |
| 65 to 74 Years | 7 (100.0%) | 7 (100.0%) |
| 75 Years and over | 13 (100.0%) | 0 (0.0%) |
| Total | 202 (100.0%) | 89 (100.0%) |
Income Below Poverty Among Married-Couple Families in South Lima
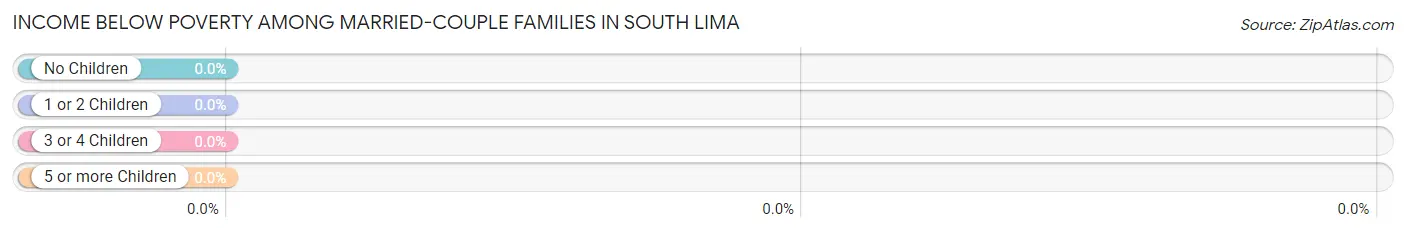
| Children | Above Poverty | Below Poverty |
| No Children | 54 (100.0%) | 0 (0.0%) |
| 1 or 2 Children | 9 (100.0%) | 0 (0.0%) |
| 3 or 4 Children | 0 (0.0%) | 0 (0.0%) |
| 5 or more Children | 0 (0.0%) | 0 (0.0%) |
| Total | 63 (100.0%) | 0 (0.0%) |
Income Below Poverty Among Single-Parent Households in South Lima
| Children | Single Father | Single Mother |
| No Children | 0 (0.0%) | 0 (0.0%) |
| 1 or 2 Children | 0 (0.0%) | 0 (0.0%) |
| 3 or 4 Children | 0 (0.0%) | 0 (0.0%) |
| 5 or more Children | 0 (0.0%) | 0 (0.0%) |
| Total | 0 (0.0%) | 0 (0.0%) |
Income Below Poverty Among Married-Couple vs Single-Parent Households in South Lima
| Children | Married-Couple Families | Single-Parent Households |
| No Children | 0 (0.0%) | 0 (0.0%) |
| 1 or 2 Children | 0 (0.0%) | 0 (0.0%) |
| 3 or 4 Children | 0 (0.0%) | 0 (0.0%) |
| 5 or more Children | 0 (0.0%) | 0 (0.0%) |
| Total | 0 (0.0%) | 0 (0.0%) |
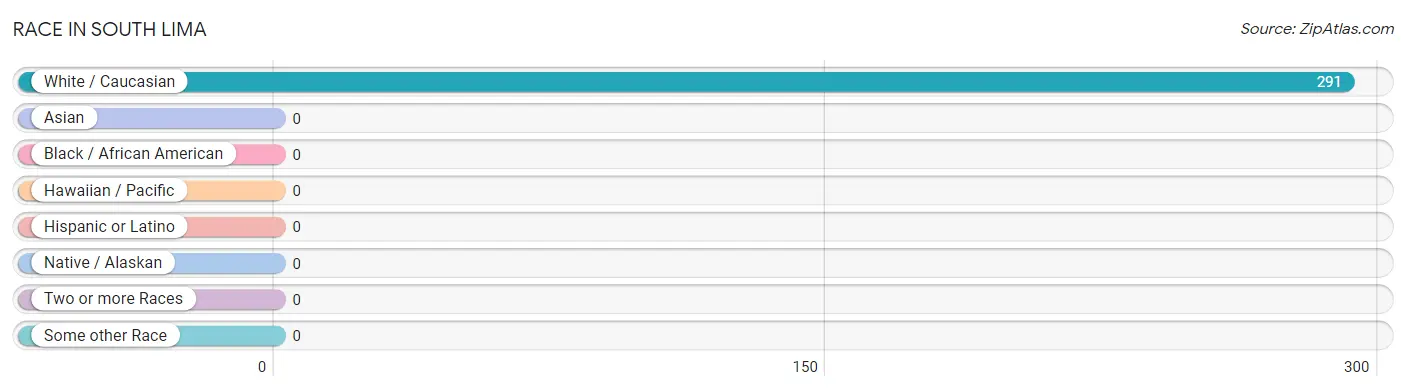
Race in South Lima
The most populous races in South Lima are , and White / Caucasian (291 | 100.0%).
| Race | # Population | % Population |
| Asian | 0 | 0.0% |
| Black / African American | 0 | 0.0% |
| Hawaiian / Pacific | 0 | 0.0% |
| Hispanic or Latino | 0 | 0.0% |
| Native / Alaskan | 0 | 0.0% |
| White / Caucasian | 291 | 100.0% |
| Two or more Races | 0 | 0.0% |
| Some other Race | 0 | 0.0% |
| Total | 291 | 100.0% |
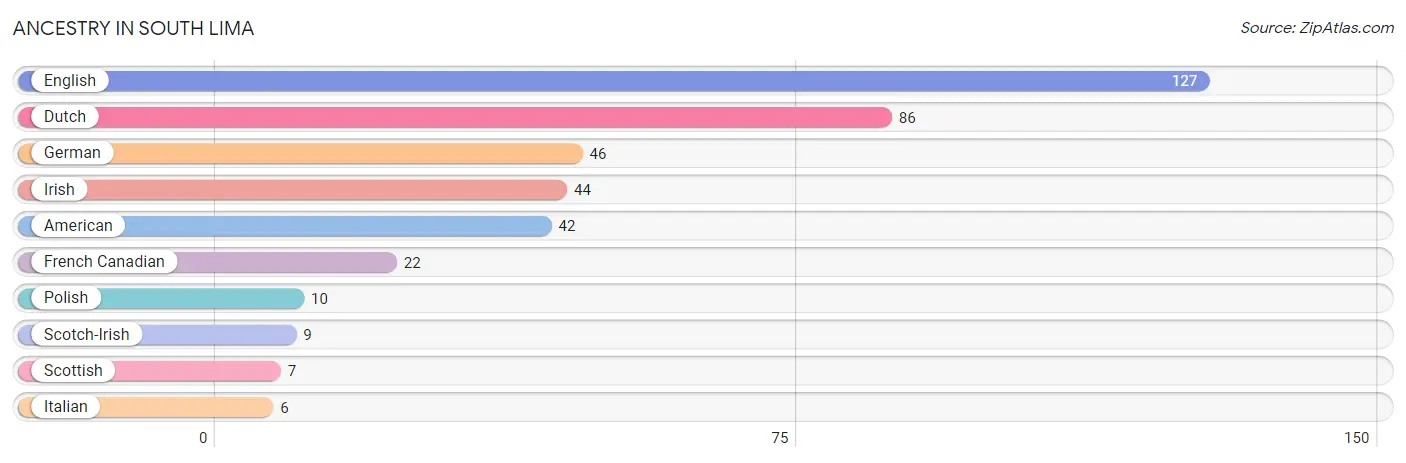
Ancestry in South Lima
The most populous ancestries reported in South Lima are English (127 | 43.6%), Dutch (86 | 29.5%), German (46 | 15.8%), Irish (44 | 15.1%), and American (42 | 14.4%), together accounting for 118.5% of all South Lima residents.
| Ancestry | # Population | % Population |
| American | 42 | 14.4% |
| Dutch | 86 | 29.5% |
| English | 127 | 43.6% |
| French Canadian | 22 | 7.6% |
| German | 46 | 15.8% |
| Irish | 44 | 15.1% |
| Italian | 6 | 2.1% |
| Polish | 10 | 3.4% |
| Scotch-Irish | 9 | 3.1% |
| Scottish | 7 | 2.4% | View All 10 Rows |
Immigrants in South Lima

| Immigration Origin | # Population | % Population | View All 0 Rows |
Sex and Age in South Lima
Sex and Age in South Lima
The most populous age groups in South Lima are 20 to 24 Years (42 | 20.8%) for men and 50 to 54 Years (32 | 36.0%) for women.
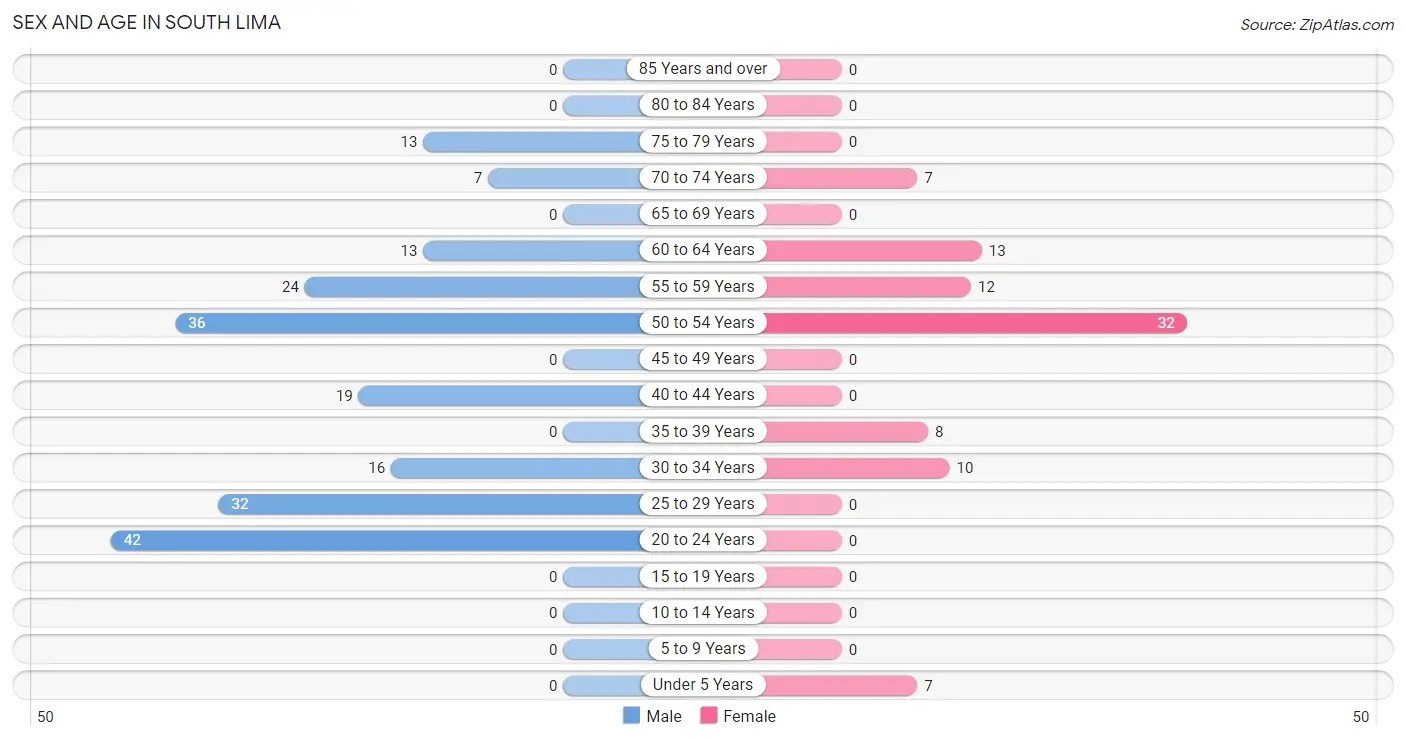
| Age Bracket | Male | Female |
| Under 5 Years | 0 (0.0%) | 7 (7.9%) |
| 5 to 9 Years | 0 (0.0%) | 0 (0.0%) |
| 10 to 14 Years | 0 (0.0%) | 0 (0.0%) |
| 15 to 19 Years | 0 (0.0%) | 0 (0.0%) |
| 20 to 24 Years | 42 (20.8%) | 0 (0.0%) |
| 25 to 29 Years | 32 (15.8%) | 0 (0.0%) |
| 30 to 34 Years | 16 (7.9%) | 10 (11.2%) |
| 35 to 39 Years | 0 (0.0%) | 8 (9.0%) |
| 40 to 44 Years | 19 (9.4%) | 0 (0.0%) |
| 45 to 49 Years | 0 (0.0%) | 0 (0.0%) |
| 50 to 54 Years | 36 (17.8%) | 32 (36.0%) |
| 55 to 59 Years | 24 (11.9%) | 12 (13.5%) |
| 60 to 64 Years | 13 (6.4%) | 13 (14.6%) |
| 65 to 69 Years | 0 (0.0%) | 0 (0.0%) |
| 70 to 74 Years | 7 (3.5%) | 7 (7.9%) |
| 75 to 79 Years | 13 (6.4%) | 0 (0.0%) |
| 80 to 84 Years | 0 (0.0%) | 0 (0.0%) |
| 85 Years and over | 0 (0.0%) | 0 (0.0%) |
| Total | 202 (100.0%) | 89 (100.0%) |
Families and Households in South Lima
Median Family Size in South Lima
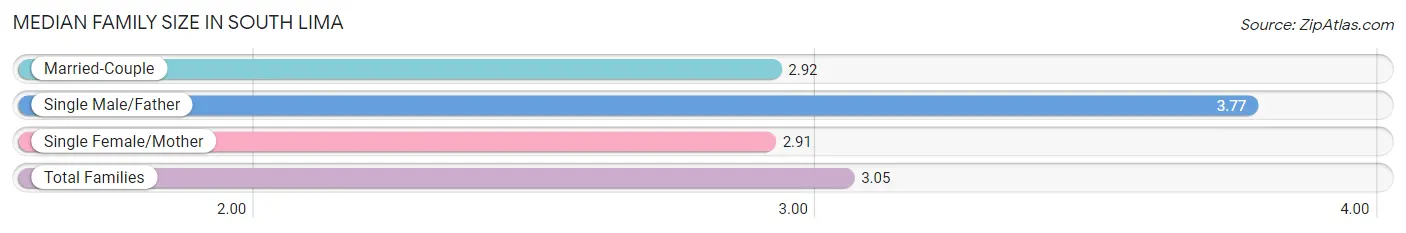
The median family size in South Lima is 3.05 persons per family, with single male/father families (13 | 14.9%) accounting for the largest median family size of 3.77 persons per family. On the other hand, single female/mother families (11 | 12.6%) represent the smallest median family size with 2.91 persons per family.
| Family Type | # Families | Family Size |
| Married-Couple | 63 (72.4%) | 2.92 |
| Single Male/Father | 13 (14.9%) | 3.77 |
| Single Female/Mother | 11 (12.6%) | 2.91 |
| Total Families | 87 (100.0%) | 3.05 |
Median Household Size in South Lima
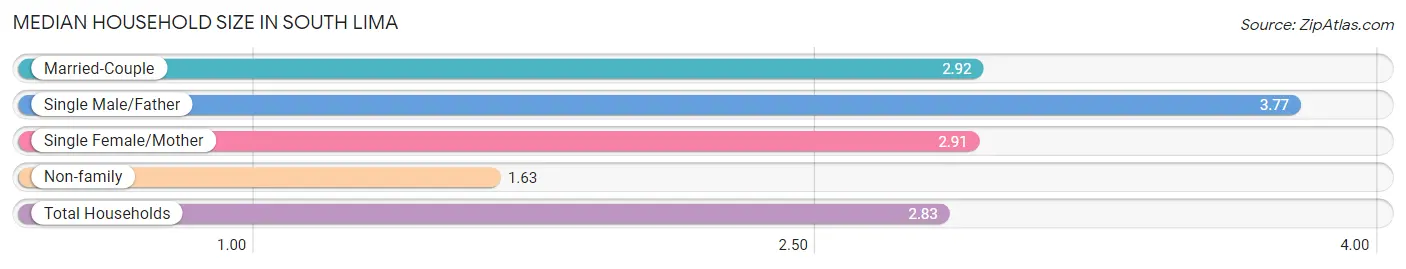
The median household size in South Lima is 2.83 persons per household, with single male/father households (13 | 12.6%) accounting for the largest median household size of 3.77 persons per household. non-family households (16 | 15.5%) represent the smallest median household size with 1.63 persons per household.
| Household Type | # Households | Household Size |
| Married-Couple | 63 (61.2%) | 2.92 |
| Single Male/Father | 13 (12.6%) | 3.77 |
| Single Female/Mother | 11 (10.7%) | 2.91 |
| Non-family | 16 (15.5%) | 1.63 |
| Total Households | 103 (100.0%) | 2.83 |
Household Size by Marriage Status in South Lima
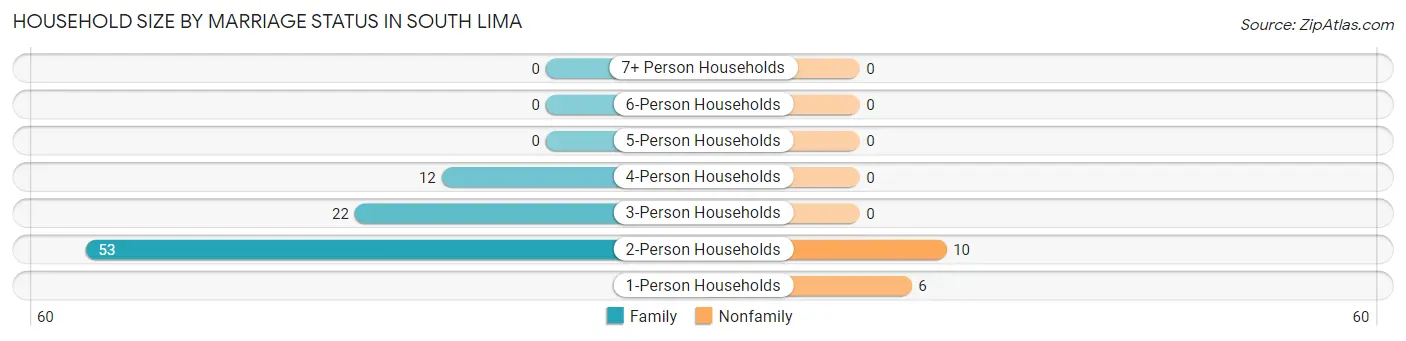
Out of a total of 103 households in South Lima, 87 (84.5%) are family households, while 16 (15.5%) are nonfamily households. The most numerous type of family households are 2-person households, comprising 53, and the most common type of nonfamily households are 2-person households, comprising 10.
| Household Size | Family Households | Nonfamily Households |
| 1-Person Households | - | 6 (5.8%) |
| 2-Person Households | 53 (51.5%) | 10 (9.7%) |
| 3-Person Households | 22 (21.4%) | 0 (0.0%) |
| 4-Person Households | 12 (11.7%) | 0 (0.0%) |
| 5-Person Households | 0 (0.0%) | 0 (0.0%) |
| 6-Person Households | 0 (0.0%) | 0 (0.0%) |
| 7+ Person Households | 0 (0.0%) | 0 (0.0%) |
| Total | 87 (84.5%) | 16 (15.5%) |
Female Fertility in South Lima
Fertility by Age in South Lima
| Age Bracket | Women with Births | Births / 1,000 Women |
| 15 to 19 years | 0 (0.0%) | 0.0 |
| 20 to 34 years | 0 (0.0%) | 0.0 |
| 35 to 50 years | 0 (0.0%) | 0.0 |
| Total | 0 (0.0%) | 0.0 |
Fertility by Age by Marriage Status in South Lima
| Age Bracket | Married | Unmarried |
| 15 to 19 years | 0 (0.0%) | 0 (0.0%) |
| 20 to 34 years | 0 (0.0%) | 0 (0.0%) |
| 35 to 50 years | 0 (0.0%) | 0 (0.0%) |
| Total | 0 (0.0%) | 0 (0.0%) |
Fertility by Education in South Lima
| Educational Attainment | Women with Births | Births / 1,000 Women |
| Less than High School | 0 (0.0%) | 0.0 |
| High School Diploma | 0 (0.0%) | 0.0 |
| College or Associate's Degree | 0 (0.0%) | 0.0 |
| Bachelor's Degree | 0 (0.0%) | 0.0 |
| Graduate Degree | 0 (0.0%) | 0.0 |
| Total | 0 (0.0%) | 0.0 |
Fertility by Education by Marriage Status in South Lima
| Educational Attainment | Married | Unmarried |
| Less than High School | 0 (0.0%) | 0 (0.0%) |
| High School Diploma | 0 (0.0%) | 0 (0.0%) |
| College or Associate's Degree | 0 (0.0%) | 0 (0.0%) |
| Bachelor's Degree | 0 (0.0%) | 0 (0.0%) |
| Graduate Degree | 0 (0.0%) | 0 (0.0%) |
| Total | 0 (0.0%) | 0 (0.0%) |
Employment Characteristics in South Lima
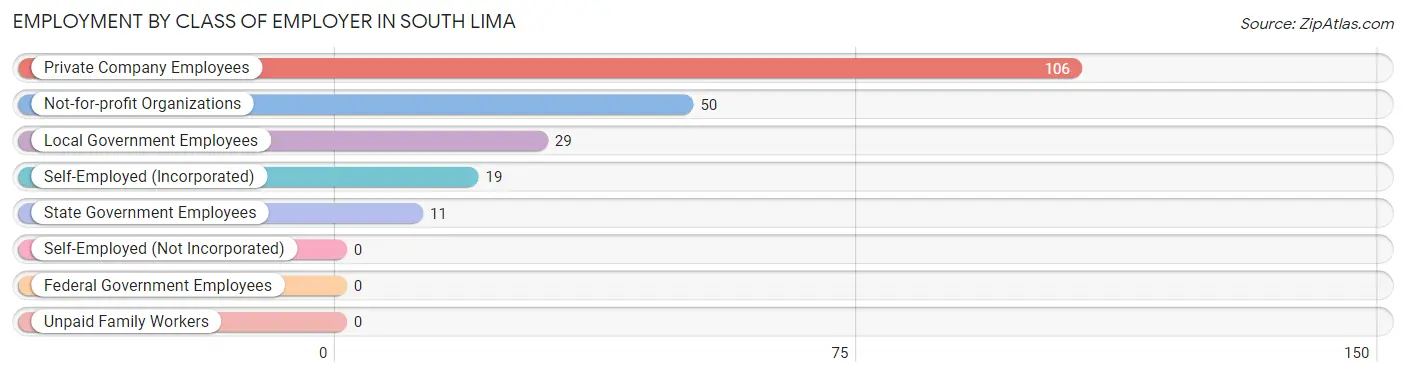
Employment by Class of Employer in South Lima
Among the 215 employed individuals in South Lima, private company employees (106 | 49.3%), not-for-profit organizations (50 | 23.3%), and local government employees (29 | 13.5%) make up the most common classes of employment.
| Employer Class | # Employees | % Employees |
| Private Company Employees | 106 | 49.3% |
| Self-Employed (Incorporated) | 19 | 8.8% |
| Self-Employed (Not Incorporated) | 0 | 0.0% |
| Not-for-profit Organizations | 50 | 23.3% |
| Local Government Employees | 29 | 13.5% |
| State Government Employees | 11 | 5.1% |
| Federal Government Employees | 0 | 0.0% |
| Unpaid Family Workers | 0 | 0.0% |
| Total | 215 | 100.0% |
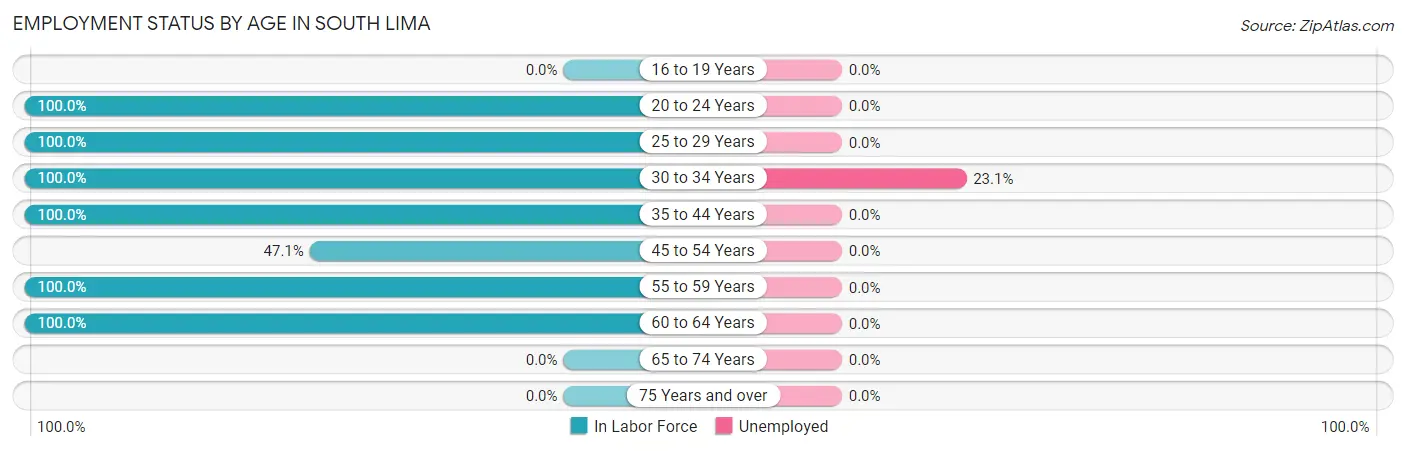
Employment Status by Age in South Lima
According to the labor force statistics for South Lima, out of the total population over 16 years of age (284), 77.8% or 221 individuals are in the labor force, with 2.7% or 6 of them unemployed. The age group with the highest labor force participation rate is 20 to 24 years, with 100.0% or 42 individuals in the labor force. Within the labor force, the 30 to 34 years age range has the highest percentage of unemployed individuals, with 23.1% or 6 of them being unemployed.
| Age Bracket | In Labor Force | Unemployed |
| 16 to 19 Years | 0 (0.0%) | 0 (0.0%) |
| 20 to 24 Years | 42 (100.0%) | 0 (0.0%) |
| 25 to 29 Years | 32 (100.0%) | 0 (0.0%) |
| 30 to 34 Years | 26 (100.0%) | 6 (23.1%) |
| 35 to 44 Years | 27 (100.0%) | 0 (0.0%) |
| 45 to 54 Years | 32 (47.1%) | 0 (0.0%) |
| 55 to 59 Years | 36 (100.0%) | 0 (0.0%) |
| 60 to 64 Years | 26 (100.0%) | 0 (0.0%) |
| 65 to 74 Years | 0 (0.0%) | 0 (0.0%) |
| 75 Years and over | 0 (0.0%) | 0 (0.0%) |
| Total | 221 (77.8%) | 6 (2.7%) |
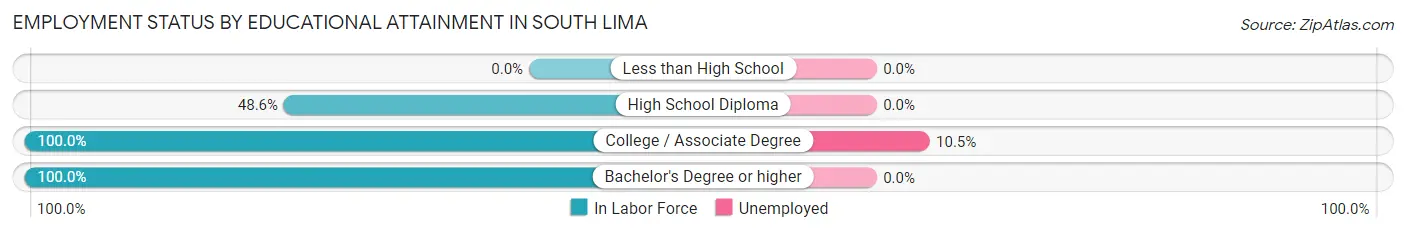
Employment Status by Educational Attainment in South Lima
According to labor force statistics for South Lima, 83.3% of individuals (179) out of the total population between 25 and 64 years of age (215) are in the labor force, with 3.4% or 6 of them being unemployed. The group with the highest labor force participation rate are those with the educational attainment of college / associate degree, with 100.0% or 57 individuals in the labor force. Within the labor force, individuals with college / associate degree education have the highest percentage of unemployment, with 10.5% or 6 of them being unemployed.
| Educational Attainment | In Labor Force | Unemployed |
| Less than High School | 0 (0.0%) | 0 (0.0%) |
| High School Diploma | 34 (48.6%) | 0 (0.0%) |
| College / Associate Degree | 57 (100.0%) | 6 (10.5%) |
| Bachelor's Degree or higher | 88 (100.0%) | 0 (0.0%) |
| Total | 179 (83.3%) | 7 (3.4%) |
Employment Occupations by Sex in South Lima
Management, Business, Science and Arts Occupations
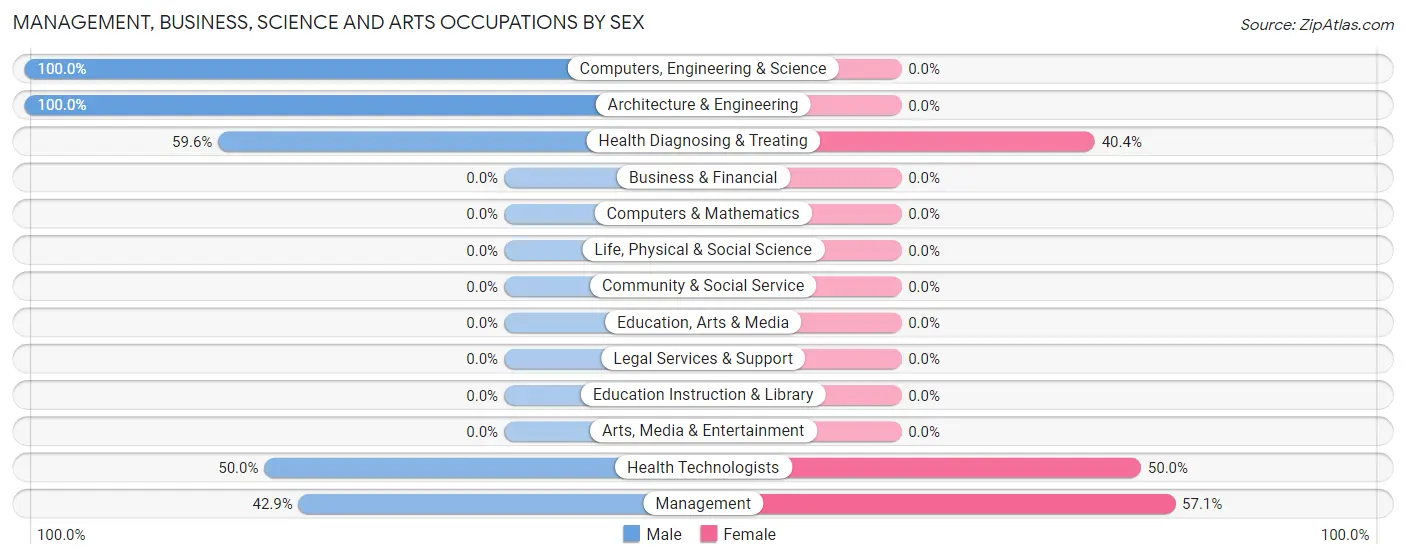
The most common Management, Business, Science and Arts occupations in South Lima are Health Diagnosing & Treating (52 | 24.2%), Health Technologists (42 | 19.5%), Computers, Engineering & Science (32 | 14.9%), Architecture & Engineering (32 | 14.9%), and Management (21 | 9.8%).
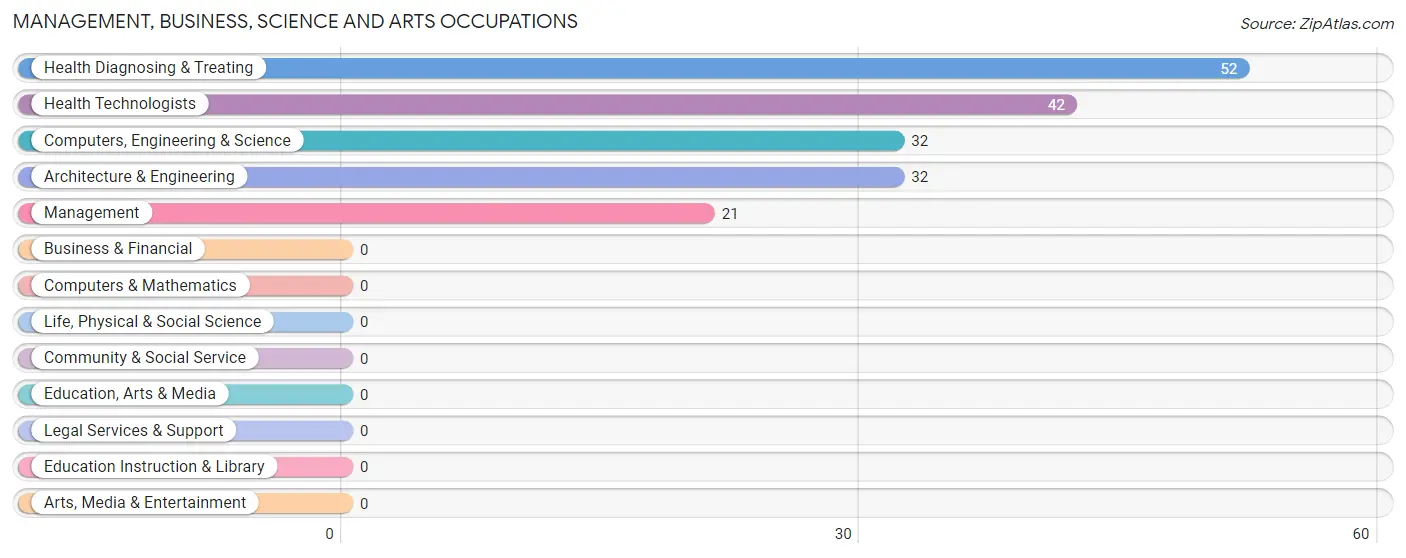
Management, Business, Science and Arts Occupations by Sex
Within the Management, Business, Science and Arts occupations in South Lima, the most male-oriented occupations are Computers, Engineering & Science (100.0%), Architecture & Engineering (100.0%), and Health Diagnosing & Treating (59.6%), while the most female-oriented occupations are Management (57.1%), Health Technologists (50.0%), and Health Diagnosing & Treating (40.4%).
| Occupation | Male | Female |
| Management | 9 (42.9%) | 12 (57.1%) |
| Business & Financial | 0 (0.0%) | 0 (0.0%) |
| Computers, Engineering & Science | 32 (100.0%) | 0 (0.0%) |
| Computers & Mathematics | 0 (0.0%) | 0 (0.0%) |
| Architecture & Engineering | 32 (100.0%) | 0 (0.0%) |
| Life, Physical & Social Science | 0 (0.0%) | 0 (0.0%) |
| Community & Social Service | 0 (0.0%) | 0 (0.0%) |
| Education, Arts & Media | 0 (0.0%) | 0 (0.0%) |
| Legal Services & Support | 0 (0.0%) | 0 (0.0%) |
| Education Instruction & Library | 0 (0.0%) | 0 (0.0%) |
| Arts, Media & Entertainment | 0 (0.0%) | 0 (0.0%) |
| Health Diagnosing & Treating | 31 (59.6%) | 21 (40.4%) |
| Health Technologists | 21 (50.0%) | 21 (50.0%) |
| Total (Category) | 72 (68.6%) | 33 (31.4%) |
| Total (Overall) | 140 (65.1%) | 75 (34.9%) |
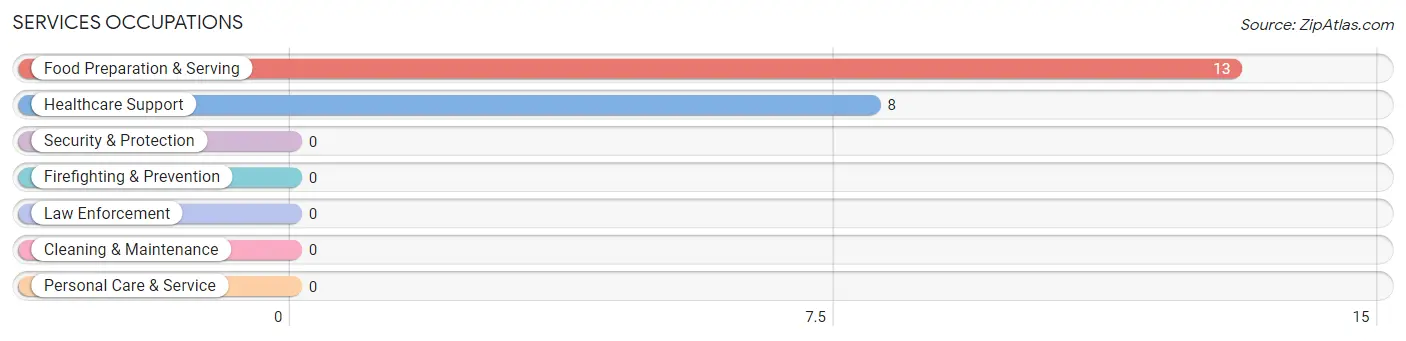
Services Occupations
The most common Services occupations in South Lima are Food Preparation & Serving (13 | 6.0%), and Healthcare Support (8 | 3.7%).
Services Occupations by Sex
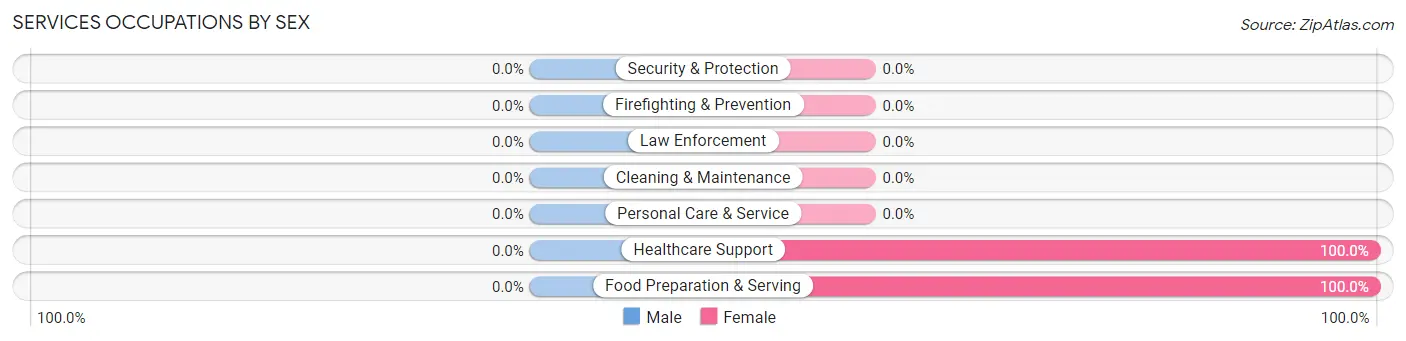
| Occupation | Male | Female |
| Healthcare Support | 0 (0.0%) | 8 (100.0%) |
| Security & Protection | 0 (0.0%) | 0 (0.0%) |
| Firefighting & Prevention | 0 (0.0%) | 0 (0.0%) |
| Law Enforcement | 0 (0.0%) | 0 (0.0%) |
| Food Preparation & Serving | 0 (0.0%) | 13 (100.0%) |
| Cleaning & Maintenance | 0 (0.0%) | 0 (0.0%) |
| Personal Care & Service | 0 (0.0%) | 0 (0.0%) |
| Total (Category) | 0 (0.0%) | 21 (100.0%) |
| Total (Overall) | 140 (65.1%) | 75 (34.9%) |
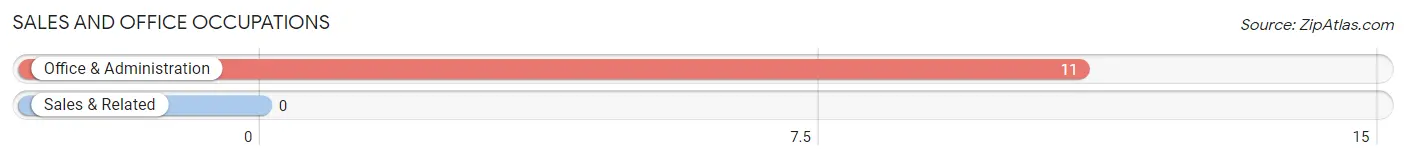
Sales and Office Occupations
The most common Sales and Office occupations in South Lima are , and Office & Administration (11 | 5.1%).
Sales and Office Occupations by Sex
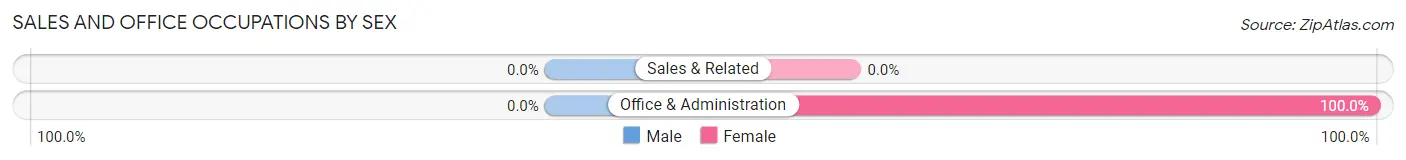
| Occupation | Male | Female |
| Sales & Related | 0 (0.0%) | 0 (0.0%) |
| Office & Administration | 0 (0.0%) | 11 (100.0%) |
| Total (Category) | 0 (0.0%) | 11 (100.0%) |
| Total (Overall) | 140 (65.1%) | 75 (34.9%) |
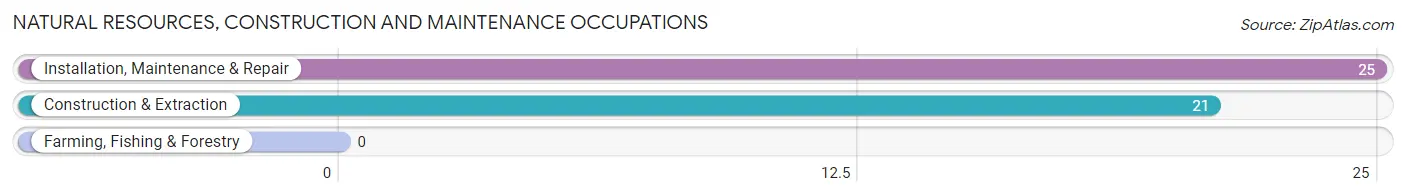
Natural Resources, Construction and Maintenance Occupations
The most common Natural Resources, Construction and Maintenance occupations in South Lima are Installation, Maintenance & Repair (25 | 11.6%), and Construction & Extraction (21 | 9.8%).
Natural Resources, Construction and Maintenance Occupations by Sex
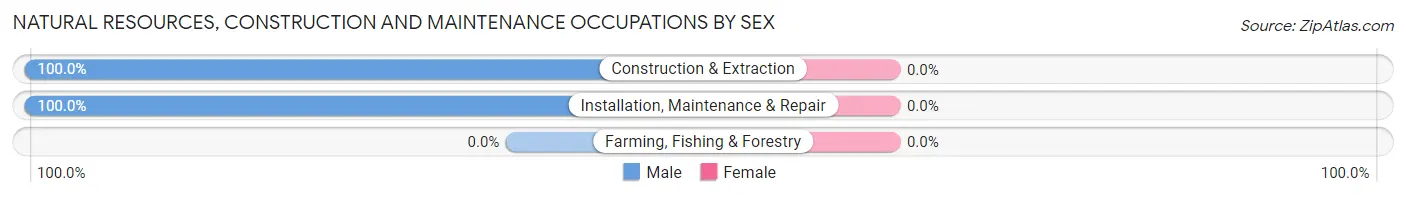
| Occupation | Male | Female |
| Farming, Fishing & Forestry | 0 (0.0%) | 0 (0.0%) |
| Construction & Extraction | 21 (100.0%) | 0 (0.0%) |
| Installation, Maintenance & Repair | 25 (100.0%) | 0 (0.0%) |
| Total (Category) | 46 (100.0%) | 0 (0.0%) |
| Total (Overall) | 140 (65.1%) | 75 (34.9%) |
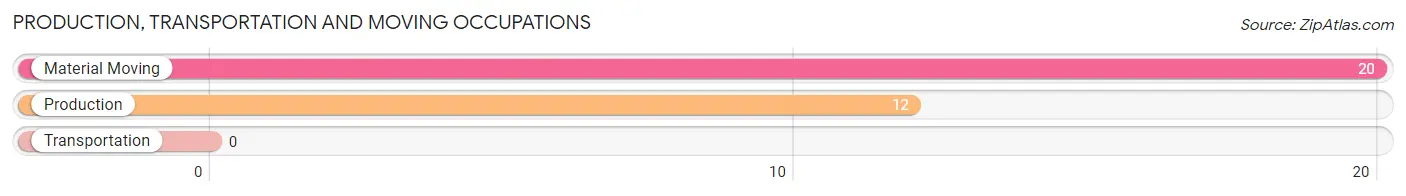
Production, Transportation and Moving Occupations
The most common Production, Transportation and Moving occupations in South Lima are Material Moving (20 | 9.3%), and Production (12 | 5.6%).
Production, Transportation and Moving Occupations by Sex
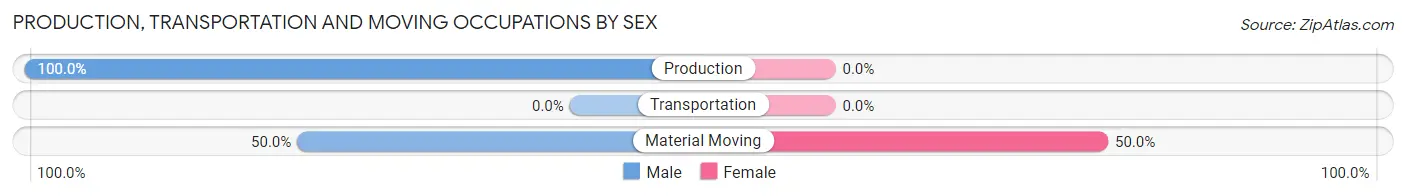
| Occupation | Male | Female |
| Production | 12 (100.0%) | 0 (0.0%) |
| Transportation | 0 (0.0%) | 0 (0.0%) |
| Material Moving | 10 (50.0%) | 10 (50.0%) |
| Total (Category) | 22 (68.8%) | 10 (31.2%) |
| Total (Overall) | 140 (65.1%) | 75 (34.9%) |
Employment Industries by Sex in South Lima
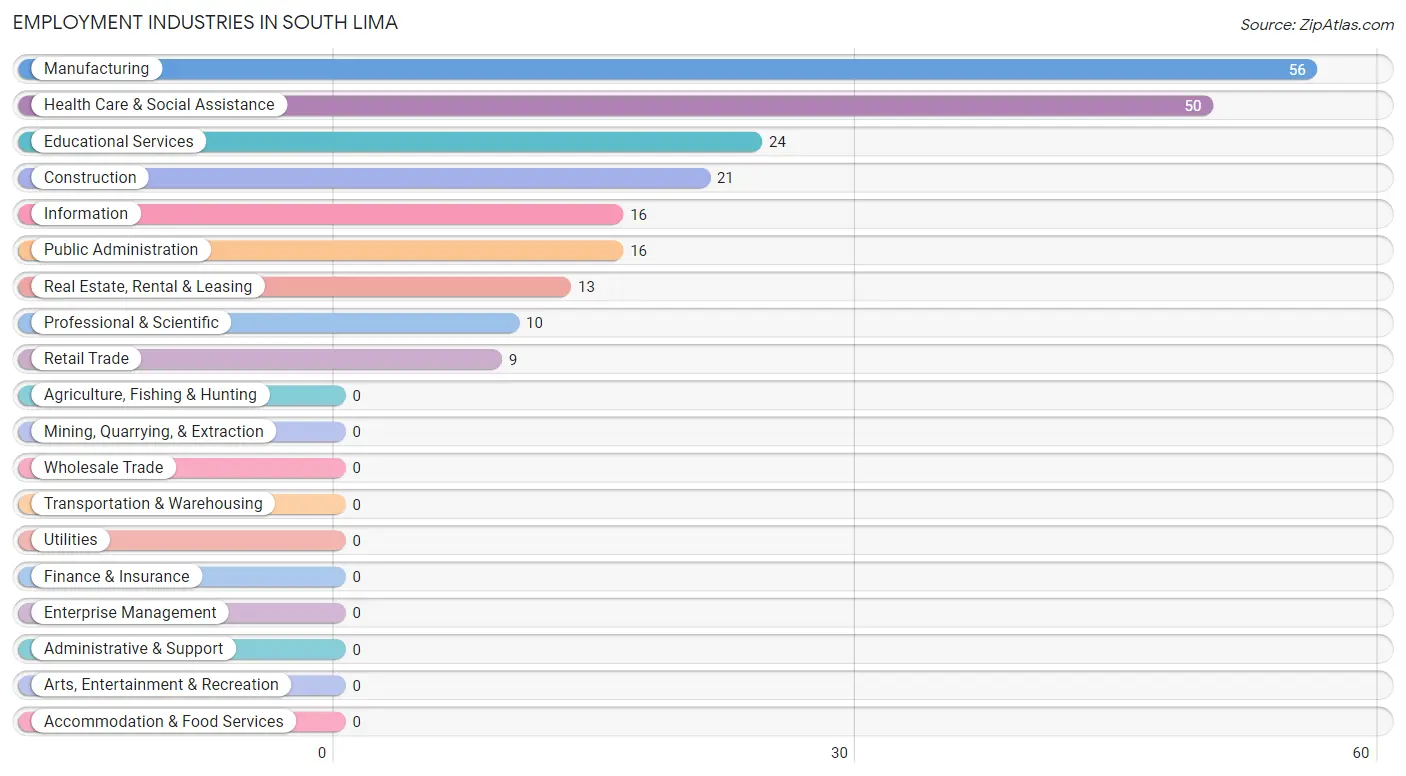
Employment Industries in South Lima
The major employment industries in South Lima include Manufacturing (56 | 26.1%), Health Care & Social Assistance (50 | 23.3%), Educational Services (24 | 11.2%), Construction (21 | 9.8%), and Information (16 | 7.4%).
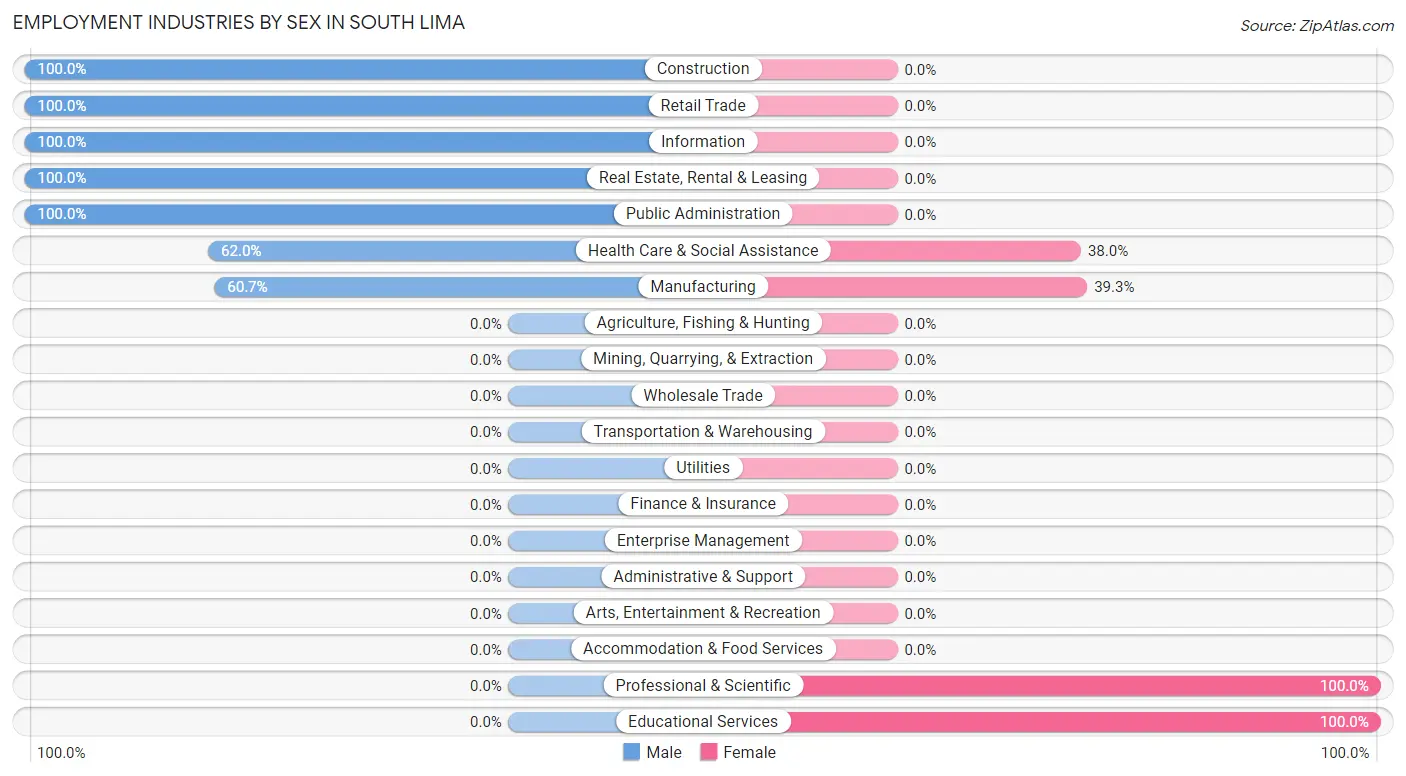
Employment Industries by Sex in South Lima
The South Lima industries that see more men than women are Construction (100.0%), Retail Trade (100.0%), and Information (100.0%), whereas the industries that tend to have a higher number of women are Professional & Scientific (100.0%), Educational Services (100.0%), and Manufacturing (39.3%).
| Industry | Male | Female |
| Agriculture, Fishing & Hunting | 0 (0.0%) | 0 (0.0%) |
| Mining, Quarrying, & Extraction | 0 (0.0%) | 0 (0.0%) |
| Construction | 21 (100.0%) | 0 (0.0%) |
| Manufacturing | 34 (60.7%) | 22 (39.3%) |
| Wholesale Trade | 0 (0.0%) | 0 (0.0%) |
| Retail Trade | 9 (100.0%) | 0 (0.0%) |
| Transportation & Warehousing | 0 (0.0%) | 0 (0.0%) |
| Utilities | 0 (0.0%) | 0 (0.0%) |
| Information | 16 (100.0%) | 0 (0.0%) |
| Finance & Insurance | 0 (0.0%) | 0 (0.0%) |
| Real Estate, Rental & Leasing | 13 (100.0%) | 0 (0.0%) |
| Professional & Scientific | 0 (0.0%) | 10 (100.0%) |
| Enterprise Management | 0 (0.0%) | 0 (0.0%) |
| Administrative & Support | 0 (0.0%) | 0 (0.0%) |
| Educational Services | 0 (0.0%) | 24 (100.0%) |
| Health Care & Social Assistance | 31 (62.0%) | 19 (38.0%) |
| Arts, Entertainment & Recreation | 0 (0.0%) | 0 (0.0%) |
| Accommodation & Food Services | 0 (0.0%) | 0 (0.0%) |
| Public Administration | 16 (100.0%) | 0 (0.0%) |
| Total | 140 (65.1%) | 75 (34.9%) |
Education in South Lima
School Enrollment in South Lima
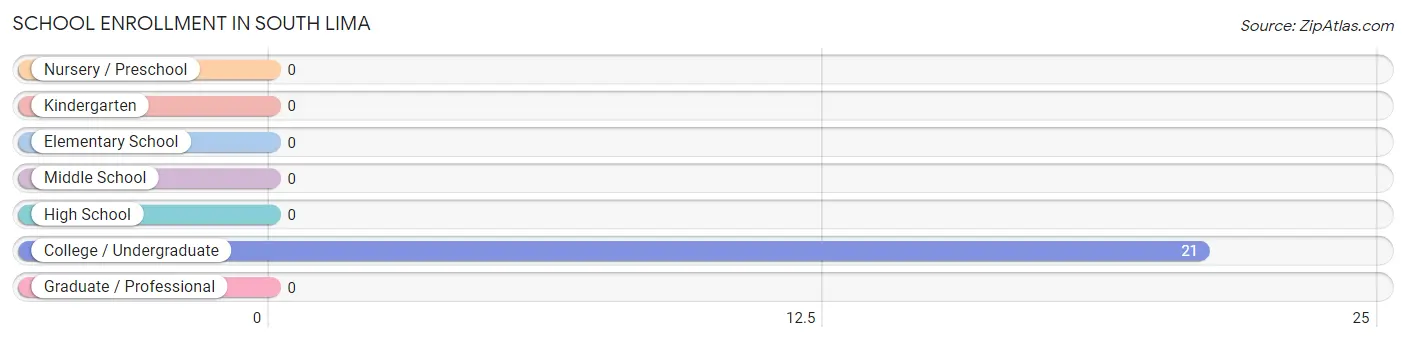
| School Level | # Students | % Students |
| Nursery / Preschool | 0 | 0.0% |
| Kindergarten | 0 | 0.0% |
| Elementary School | 0 | 0.0% |
| Middle School | 0 | 0.0% |
| High School | 0 | 0.0% |
| College / Undergraduate | 21 | 100.0% |
| Graduate / Professional | 0 | 0.0% |
| Total | 21 | 100.0% |
School Enrollment by Age by Funding Source in South Lima
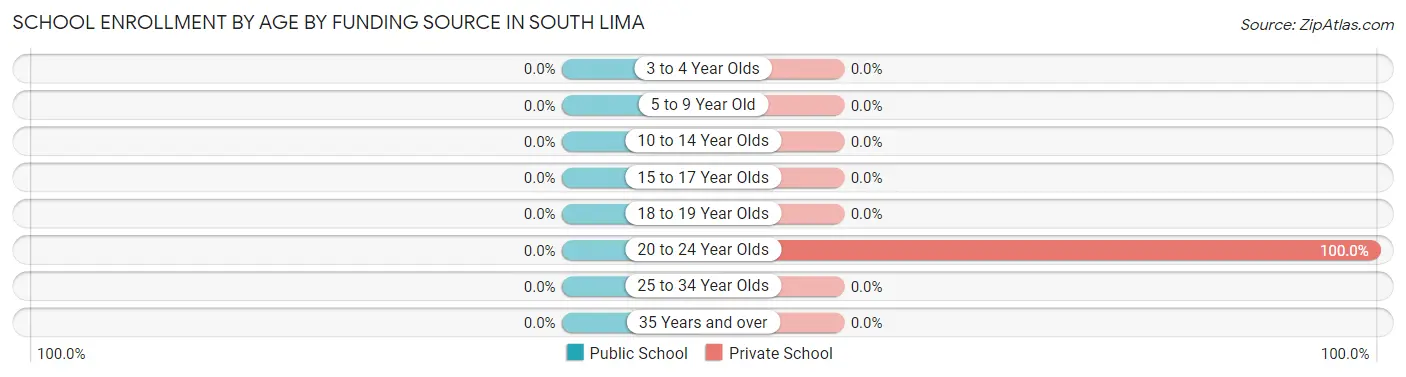
| Age Bracket | Public School | Private School |
| 3 to 4 Year Olds | 0 (0.0%) | 0 (0.0%) |
| 5 to 9 Year Old | 0 (0.0%) | 0 (0.0%) |
| 10 to 14 Year Olds | 0 (0.0%) | 0 (0.0%) |
| 15 to 17 Year Olds | 0 (0.0%) | 0 (0.0%) |
| 18 to 19 Year Olds | 0 (0.0%) | 0 (0.0%) |
| 20 to 24 Year Olds | 0 (0.0%) | 21 (100.0%) |
| 25 to 34 Year Olds | 0 (0.0%) | 0 (0.0%) |
| 35 Years and over | 0 (0.0%) | 0 (0.0%) |
| Total | 0 (0.0%) | 21 (100.0%) |
Educational Attainment by Field of Study in South Lima
Bio, nature & agricultural (40 | 37.7%), engineering (28 | 26.4%), science & technology (21 | 19.8%), education (9 | 8.5%), and communications (8 | 7.5%) are the most common fields of study among 106 individuals in South Lima who have obtained a bachelor's degree or higher.
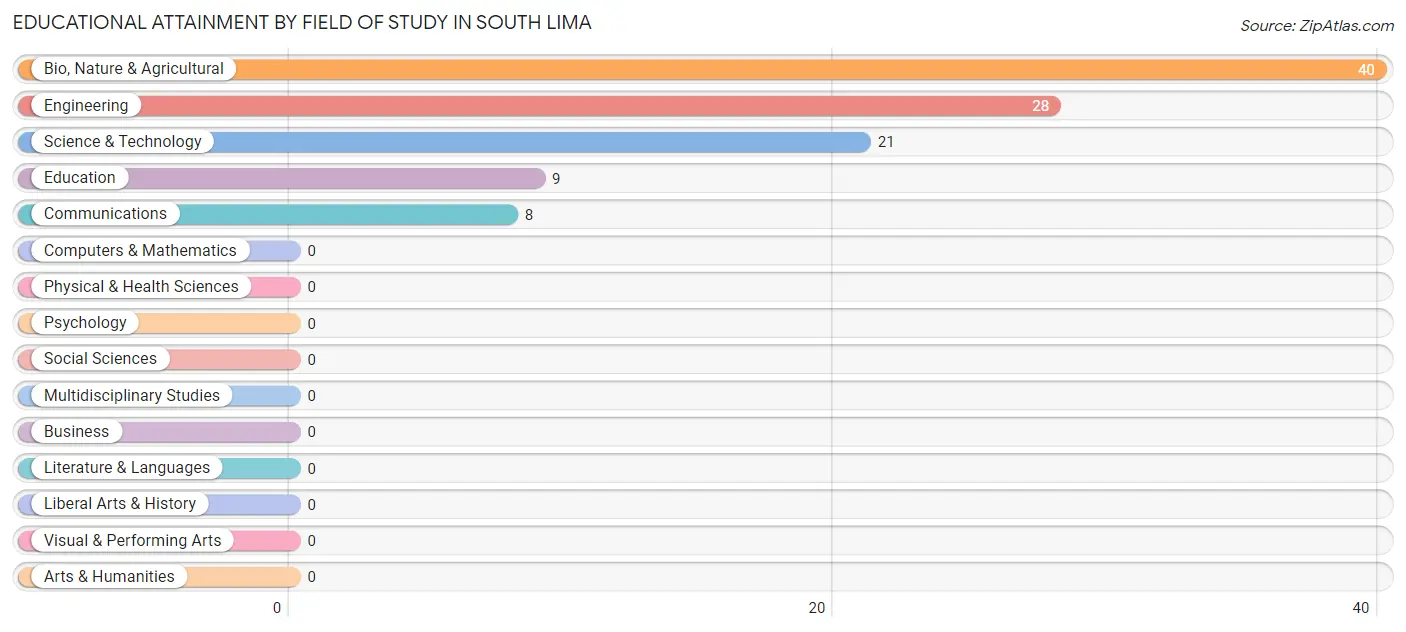
| Field of Study | # Graduates | % Graduates |
| Computers & Mathematics | 0 | 0.0% |
| Bio, Nature & Agricultural | 40 | 37.7% |
| Physical & Health Sciences | 0 | 0.0% |
| Psychology | 0 | 0.0% |
| Social Sciences | 0 | 0.0% |
| Engineering | 28 | 26.4% |
| Multidisciplinary Studies | 0 | 0.0% |
| Science & Technology | 21 | 19.8% |
| Business | 0 | 0.0% |
| Education | 9 | 8.5% |
| Literature & Languages | 0 | 0.0% |
| Liberal Arts & History | 0 | 0.0% |
| Visual & Performing Arts | 0 | 0.0% |
| Communications | 8 | 7.5% |
| Arts & Humanities | 0 | 0.0% |
| Total | 106 | 100.0% |
Transportation & Commute in South Lima
Vehicle Availability by Sex in South Lima
The most prevalent vehicle ownership categories in South Lima are males with 2 vehicles (52, accounting for 37.1%) and females with 2 vehicles (41, making up 69.3%).
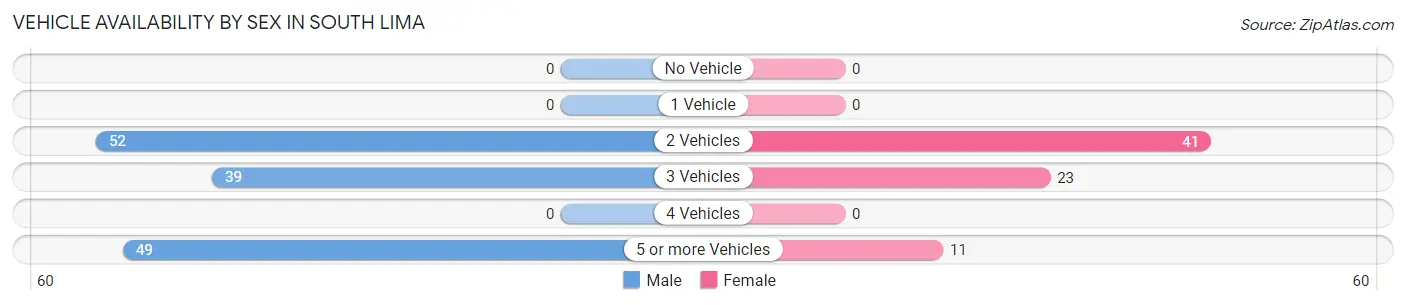
| Vehicles Available | Male | Female |
| No Vehicle | 0 (0.0%) | 0 (0.0%) |
| 1 Vehicle | 0 (0.0%) | 0 (0.0%) |
| 2 Vehicles | 52 (37.1%) | 41 (54.7%) |
| 3 Vehicles | 39 (27.9%) | 23 (30.7%) |
| 4 Vehicles | 0 (0.0%) | 0 (0.0%) |
| 5 or more Vehicles | 49 (35.0%) | 11 (14.7%) |
| Total | 140 (100.0%) | 75 (100.0%) |
Commute Time in South Lima
The most frequently occuring commute durations in South Lima are 20 to 24 minutes (55 commuters, 25.6%), 30 to 34 minutes (54 commuters, 25.1%), and 5 to 9 minutes (23 commuters, 10.7%).
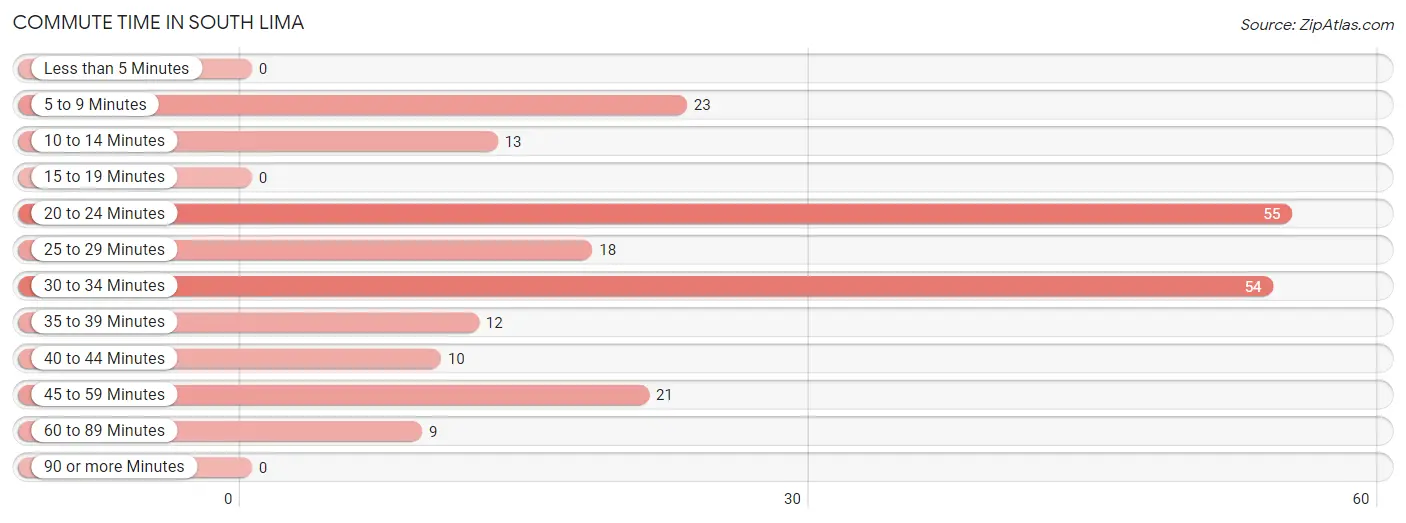
| Commute Time | # Commuters | % Commuters |
| Less than 5 Minutes | 0 | 0.0% |
| 5 to 9 Minutes | 23 | 10.7% |
| 10 to 14 Minutes | 13 | 6.0% |
| 15 to 19 Minutes | 0 | 0.0% |
| 20 to 24 Minutes | 55 | 25.6% |
| 25 to 29 Minutes | 18 | 8.4% |
| 30 to 34 Minutes | 54 | 25.1% |
| 35 to 39 Minutes | 12 | 5.6% |
| 40 to 44 Minutes | 10 | 4.6% |
| 45 to 59 Minutes | 21 | 9.8% |
| 60 to 89 Minutes | 9 | 4.2% |
| 90 or more Minutes | 0 | 0.0% |
Commute Time by Sex in South Lima
The most common commute times in South Lima are 30 to 34 minutes (54 commuters, 38.6%) for males and 20 to 24 minutes (34 commuters, 45.3%) for females.
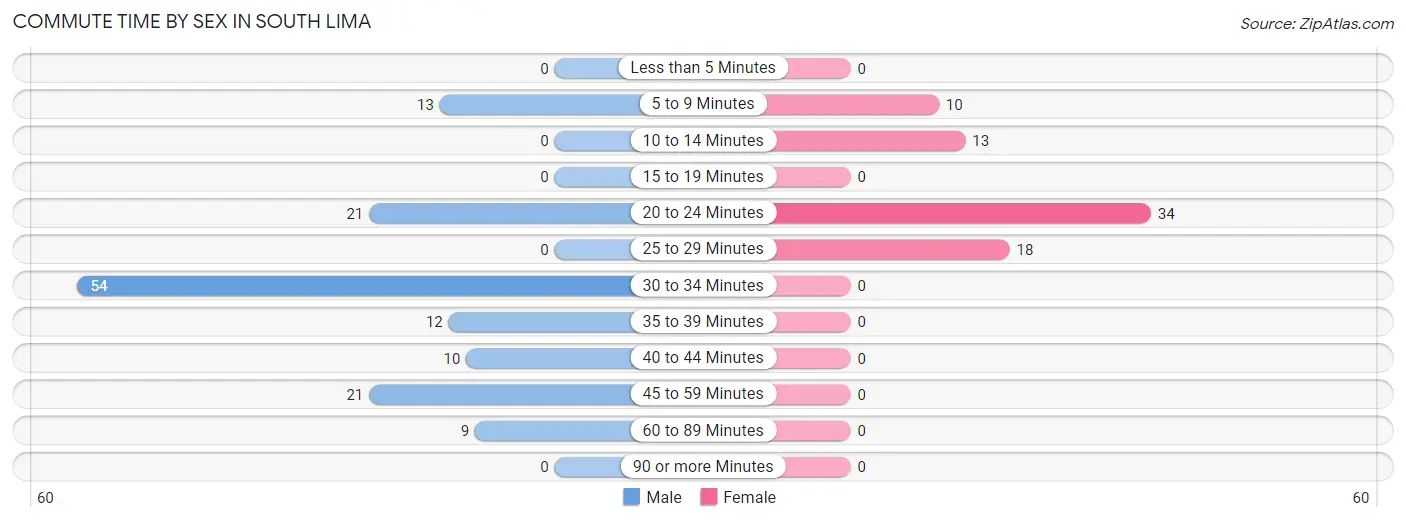
| Commute Time | Male | Female |
| Less than 5 Minutes | 0 (0.0%) | 0 (0.0%) |
| 5 to 9 Minutes | 13 (9.3%) | 10 (13.3%) |
| 10 to 14 Minutes | 0 (0.0%) | 13 (17.3%) |
| 15 to 19 Minutes | 0 (0.0%) | 0 (0.0%) |
| 20 to 24 Minutes | 21 (15.0%) | 34 (45.3%) |
| 25 to 29 Minutes | 0 (0.0%) | 18 (24.0%) |
| 30 to 34 Minutes | 54 (38.6%) | 0 (0.0%) |
| 35 to 39 Minutes | 12 (8.6%) | 0 (0.0%) |
| 40 to 44 Minutes | 10 (7.1%) | 0 (0.0%) |
| 45 to 59 Minutes | 21 (15.0%) | 0 (0.0%) |
| 60 to 89 Minutes | 9 (6.4%) | 0 (0.0%) |
| 90 or more Minutes | 0 (0.0%) | 0 (0.0%) |
Time of Departure to Work by Sex in South Lima
The most frequent times of departure to work in South Lima are 6:00 AM to 6:29 AM (37, 26.4%) for males and 7:00 AM to 7:29 AM (34, 45.3%) for females.
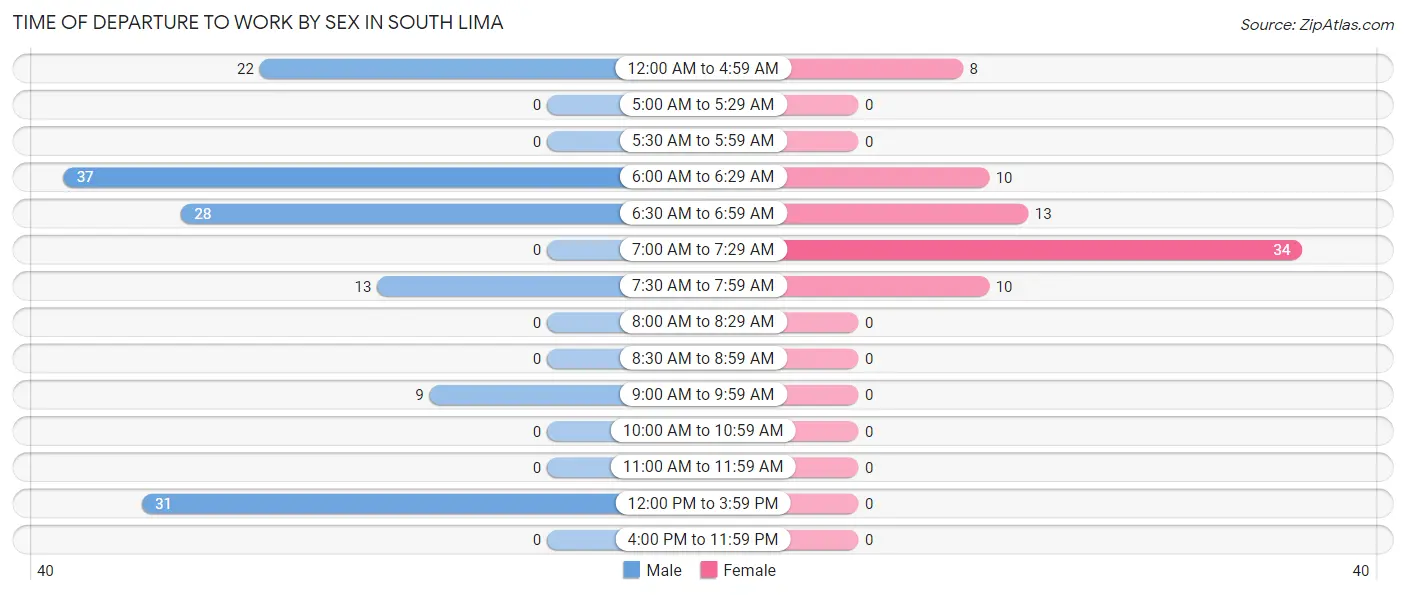
| Time of Departure | Male | Female |
| 12:00 AM to 4:59 AM | 22 (15.7%) | 8 (10.7%) |
| 5:00 AM to 5:29 AM | 0 (0.0%) | 0 (0.0%) |
| 5:30 AM to 5:59 AM | 0 (0.0%) | 0 (0.0%) |
| 6:00 AM to 6:29 AM | 37 (26.4%) | 10 (13.3%) |
| 6:30 AM to 6:59 AM | 28 (20.0%) | 13 (17.3%) |
| 7:00 AM to 7:29 AM | 0 (0.0%) | 34 (45.3%) |
| 7:30 AM to 7:59 AM | 13 (9.3%) | 10 (13.3%) |
| 8:00 AM to 8:29 AM | 0 (0.0%) | 0 (0.0%) |
| 8:30 AM to 8:59 AM | 0 (0.0%) | 0 (0.0%) |
| 9:00 AM to 9:59 AM | 9 (6.4%) | 0 (0.0%) |
| 10:00 AM to 10:59 AM | 0 (0.0%) | 0 (0.0%) |
| 11:00 AM to 11:59 AM | 0 (0.0%) | 0 (0.0%) |
| 12:00 PM to 3:59 PM | 31 (22.1%) | 0 (0.0%) |
| 4:00 PM to 11:59 PM | 0 (0.0%) | 0 (0.0%) |
| Total | 140 (100.0%) | 75 (100.0%) |
Housing Occupancy in South Lima
Occupancy by Ownership in South Lima
Of the total 103 dwellings in South Lima, owner-occupied units account for 87 (84.5%), while renter-occupied units make up 16 (15.5%).
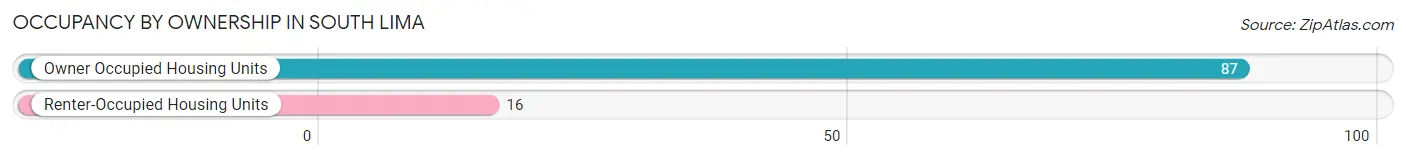
| Occupancy | # Housing Units | % Housing Units |
| Owner Occupied Housing Units | 87 | 84.5% |
| Renter-Occupied Housing Units | 16 | 15.5% |
| Total Occupied Housing Units | 103 | 100.0% |
Occupancy by Household Size in South Lima
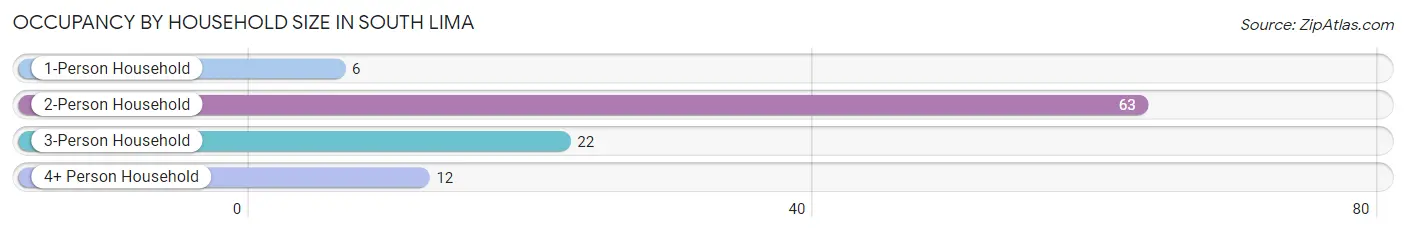
| Household Size | # Housing Units | % Housing Units |
| 1-Person Household | 6 | 5.8% |
| 2-Person Household | 63 | 61.2% |
| 3-Person Household | 22 | 21.4% |
| 4+ Person Household | 12 | 11.7% |
| Total Housing Units | 103 | 100.0% |
Occupancy by Ownership by Household Size in South Lima
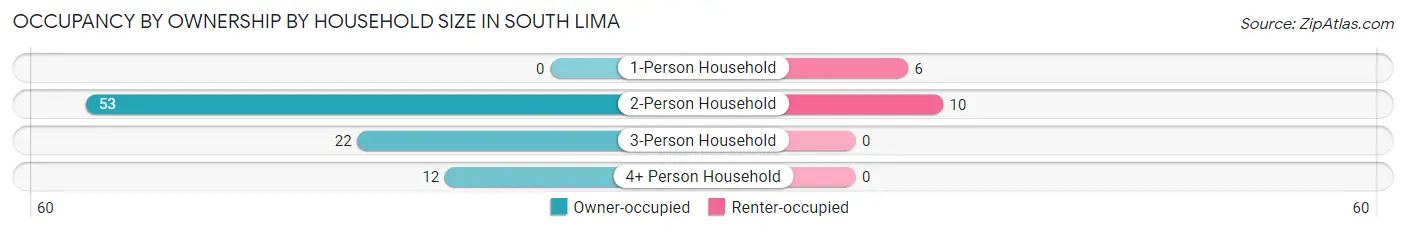
| Household Size | Owner-occupied | Renter-occupied |
| 1-Person Household | 0 (0.0%) | 6 (100.0%) |
| 2-Person Household | 53 (84.1%) | 10 (15.9%) |
| 3-Person Household | 22 (100.0%) | 0 (0.0%) |
| 4+ Person Household | 12 (100.0%) | 0 (0.0%) |
| Total Housing Units | 87 (84.5%) | 16 (15.5%) |
Occupancy by Educational Attainment in South Lima
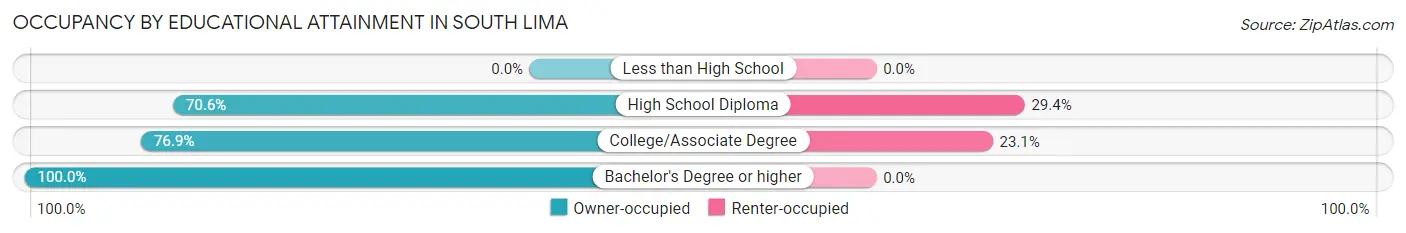
| Household Size | Owner-occupied | Renter-occupied |
| Less than High School | 0 (0.0%) | 0 (0.0%) |
| High School Diploma | 24 (70.6%) | 10 (29.4%) |
| College/Associate Degree | 20 (76.9%) | 6 (23.1%) |
| Bachelor's Degree or higher | 43 (100.0%) | 0 (0.0%) |
Occupancy by Age of Householder in South Lima
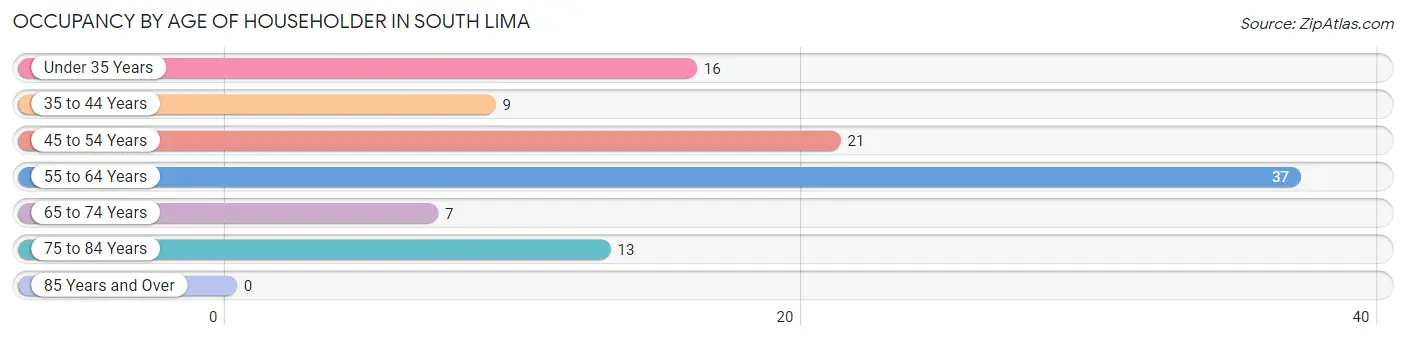
| Age Bracket | # Households | % Households |
| Under 35 Years | 16 | 15.5% |
| 35 to 44 Years | 9 | 8.7% |
| 45 to 54 Years | 21 | 20.4% |
| 55 to 64 Years | 37 | 35.9% |
| 65 to 74 Years | 7 | 6.8% |
| 75 to 84 Years | 13 | 12.6% |
| 85 Years and Over | 0 | 0.0% |
| Total | 103 | 100.0% |
Housing Finances in South Lima
Median Income by Occupancy in South Lima
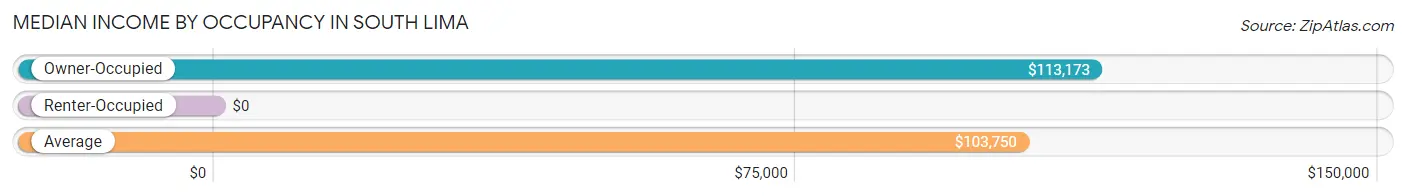
| Occupancy Type | # Households | Median Income |
| Owner-Occupied | 87 (84.5%) | $113,173 |
| Renter-Occupied | 16 (15.5%) | $0 |
| Average | 103 (100.0%) | $103,750 |
Occupancy by Householder Income Bracket in South Lima
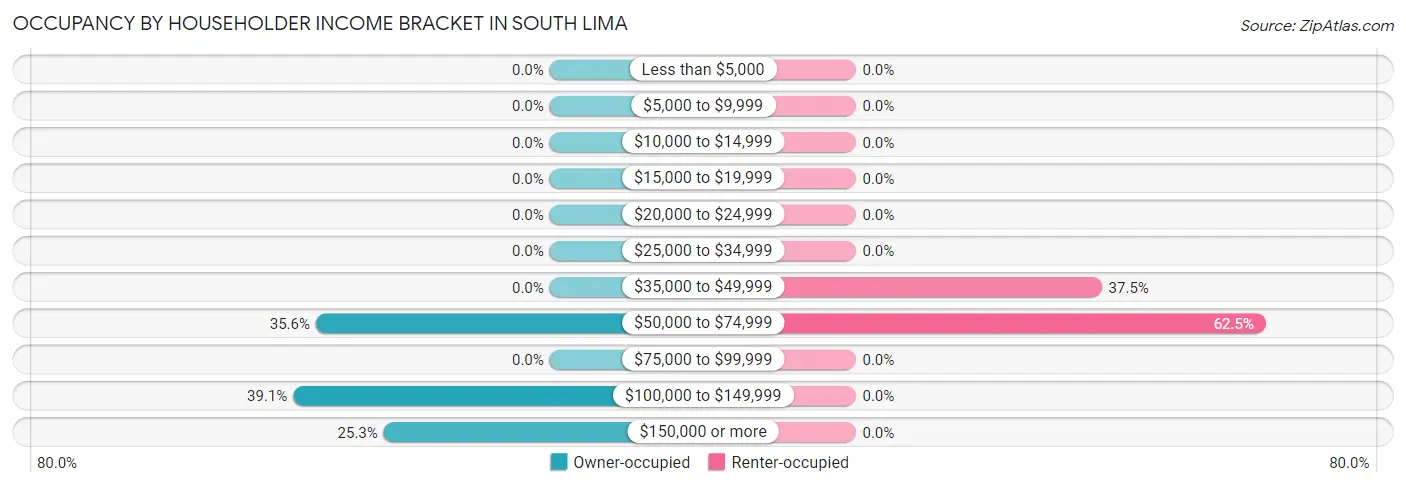
| Income Bracket | Owner-occupied | Renter-occupied |
| Less than $5,000 | 0 (0.0%) | 0 (0.0%) |
| $5,000 to $9,999 | 0 (0.0%) | 0 (0.0%) |
| $10,000 to $14,999 | 0 (0.0%) | 0 (0.0%) |
| $15,000 to $19,999 | 0 (0.0%) | 0 (0.0%) |
| $20,000 to $24,999 | 0 (0.0%) | 0 (0.0%) |
| $25,000 to $34,999 | 0 (0.0%) | 0 (0.0%) |
| $35,000 to $49,999 | 0 (0.0%) | 6 (37.5%) |
| $50,000 to $74,999 | 31 (35.6%) | 10 (62.5%) |
| $75,000 to $99,999 | 0 (0.0%) | 0 (0.0%) |
| $100,000 to $149,999 | 34 (39.1%) | 0 (0.0%) |
| $150,000 or more | 22 (25.3%) | 0 (0.0%) |
| Total | 87 (100.0%) | 16 (100.0%) |
Monthly Housing Cost Tiers in South Lima
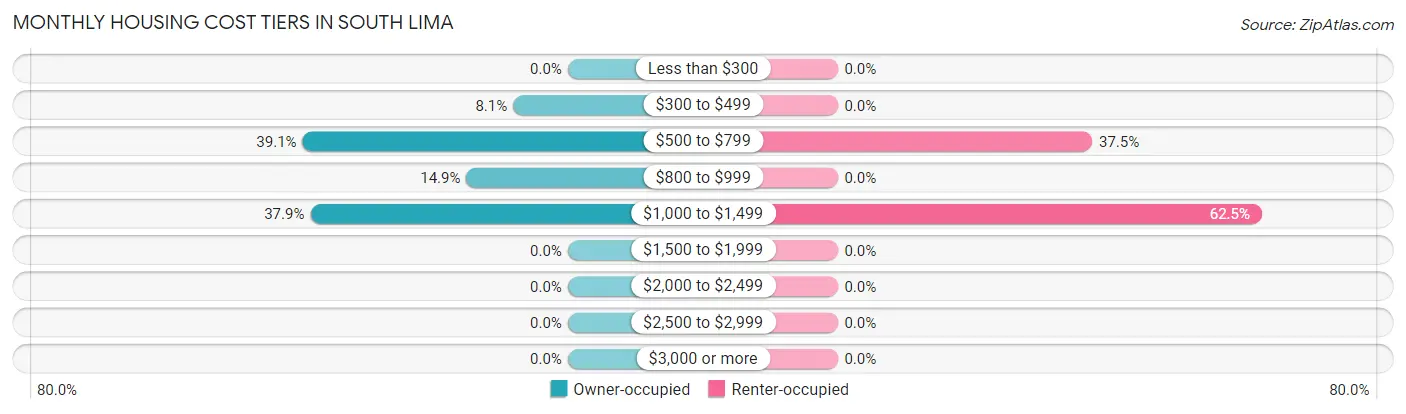
| Monthly Cost | Owner-occupied | Renter-occupied |
| Less than $300 | 0 (0.0%) | 0 (0.0%) |
| $300 to $499 | 7 (8.1%) | 0 (0.0%) |
| $500 to $799 | 34 (39.1%) | 6 (37.5%) |
| $800 to $999 | 13 (14.9%) | 0 (0.0%) |
| $1,000 to $1,499 | 33 (37.9%) | 10 (62.5%) |
| $1,500 to $1,999 | 0 (0.0%) | 0 (0.0%) |
| $2,000 to $2,499 | 0 (0.0%) | 0 (0.0%) |
| $2,500 to $2,999 | 0 (0.0%) | 0 (0.0%) |
| $3,000 or more | 0 (0.0%) | 0 (0.0%) |
| Total | 87 (100.0%) | 16 (100.0%) |
Physical Housing Characteristics in South Lima
Housing Structures in South Lima
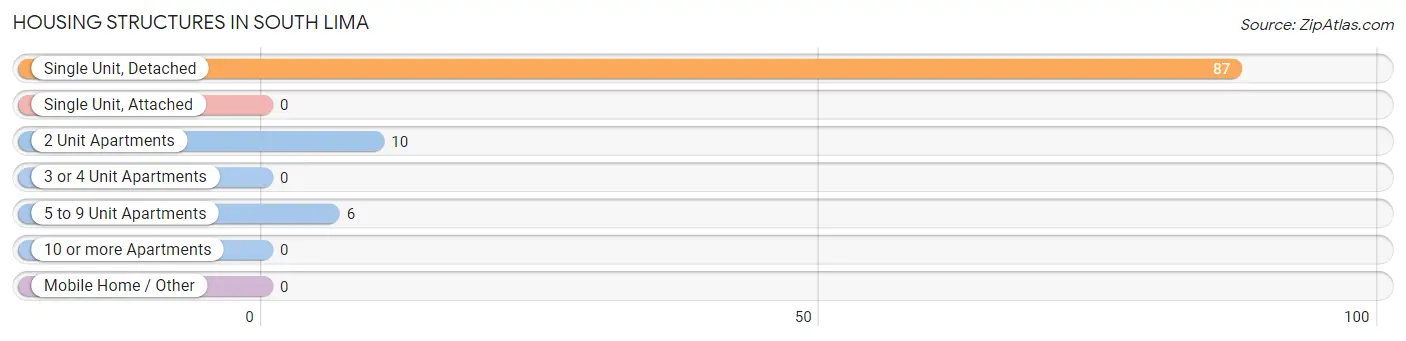
| Structure Type | # Housing Units | % Housing Units |
| Single Unit, Detached | 87 | 84.5% |
| Single Unit, Attached | 0 | 0.0% |
| 2 Unit Apartments | 10 | 9.7% |
| 3 or 4 Unit Apartments | 0 | 0.0% |
| 5 to 9 Unit Apartments | 6 | 5.8% |
| 10 or more Apartments | 0 | 0.0% |
| Mobile Home / Other | 0 | 0.0% |
| Total | 103 | 100.0% |
Housing Structures by Occupancy in South Lima
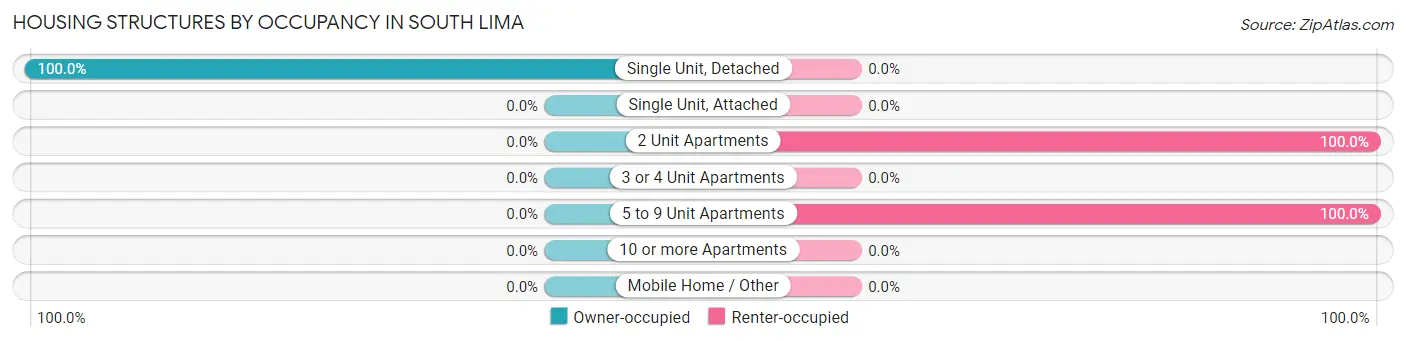
| Structure Type | Owner-occupied | Renter-occupied |
| Single Unit, Detached | 87 (100.0%) | 0 (0.0%) |
| Single Unit, Attached | 0 (0.0%) | 0 (0.0%) |
| 2 Unit Apartments | 0 (0.0%) | 10 (100.0%) |
| 3 or 4 Unit Apartments | 0 (0.0%) | 0 (0.0%) |
| 5 to 9 Unit Apartments | 0 (0.0%) | 6 (100.0%) |
| 10 or more Apartments | 0 (0.0%) | 0 (0.0%) |
| Mobile Home / Other | 0 (0.0%) | 0 (0.0%) |
| Total | 87 (84.5%) | 16 (15.5%) |
Housing Structures by Number of Rooms in South Lima
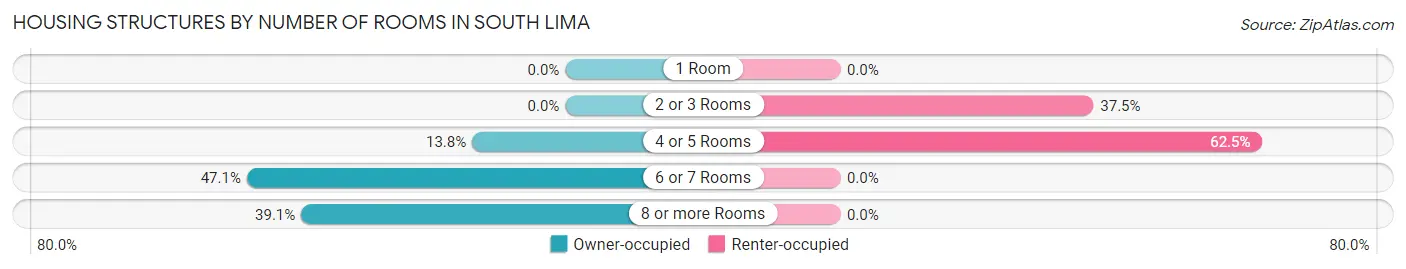
| Number of Rooms | Owner-occupied | Renter-occupied |
| 1 Room | 0 (0.0%) | 0 (0.0%) |
| 2 or 3 Rooms | 0 (0.0%) | 6 (37.5%) |
| 4 or 5 Rooms | 12 (13.8%) | 10 (62.5%) |
| 6 or 7 Rooms | 41 (47.1%) | 0 (0.0%) |
| 8 or more Rooms | 34 (39.1%) | 0 (0.0%) |
| Total | 87 (100.0%) | 16 (100.0%) |
Housing Structure by Heating Type in South Lima
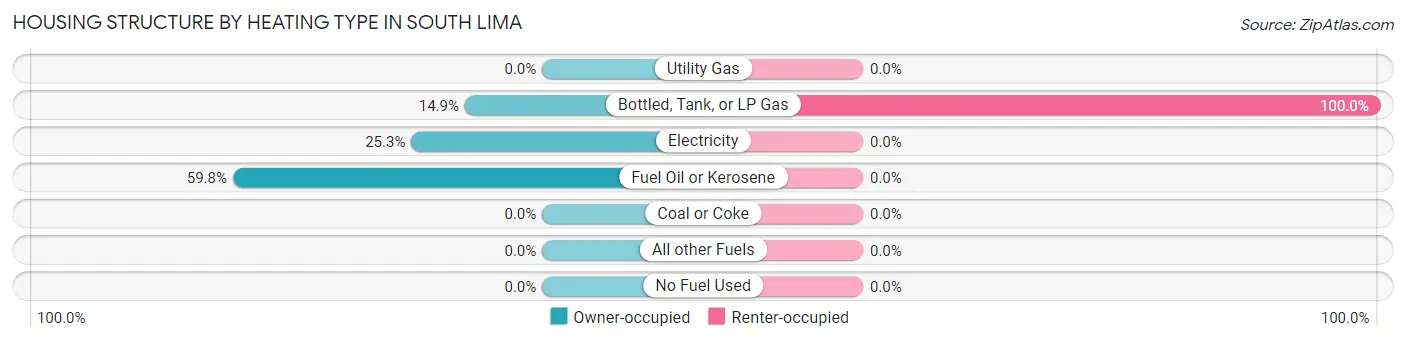
| Heating Type | Owner-occupied | Renter-occupied |
| Utility Gas | 0 (0.0%) | 0 (0.0%) |
| Bottled, Tank, or LP Gas | 13 (14.9%) | 16 (100.0%) |
| Electricity | 22 (25.3%) | 0 (0.0%) |
| Fuel Oil or Kerosene | 52 (59.8%) | 0 (0.0%) |
| Coal or Coke | 0 (0.0%) | 0 (0.0%) |
| All other Fuels | 0 (0.0%) | 0 (0.0%) |
| No Fuel Used | 0 (0.0%) | 0 (0.0%) |
| Total | 87 (100.0%) | 16 (100.0%) |
Household Vehicle Usage in South Lima
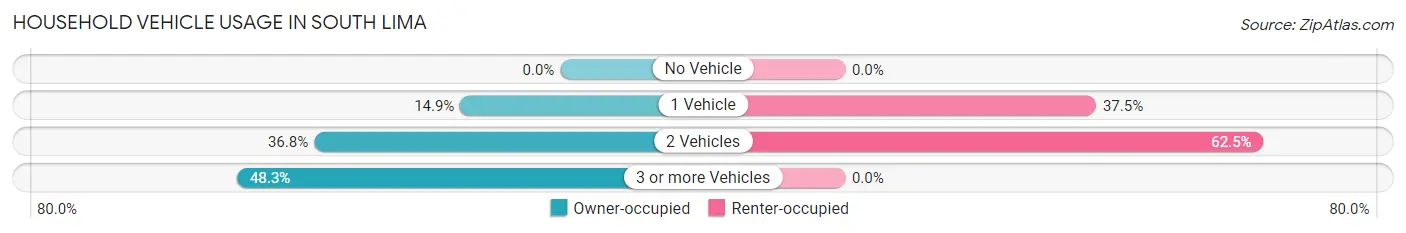
| Vehicles per Household | Owner-occupied | Renter-occupied |
| No Vehicle | 0 (0.0%) | 0 (0.0%) |
| 1 Vehicle | 13 (14.9%) | 6 (37.5%) |
| 2 Vehicles | 32 (36.8%) | 10 (62.5%) |
| 3 or more Vehicles | 42 (48.3%) | 0 (0.0%) |
| Total | 87 (100.0%) | 16 (100.0%) |
Real Estate & Mortgages in South Lima
Real Estate and Mortgage Overview in South Lima
| Characteristic | Without Mortgage | With Mortgage |
| Housing Units | 45 | 42 |
| Median Property Value | $210,400 | $202,300 |
| Median Household Income | $112,981 | $10 |
| Monthly Housing Costs | $721 | $0 |
| Real Estate Taxes | - | - |
Property Value by Mortgage Status in South Lima
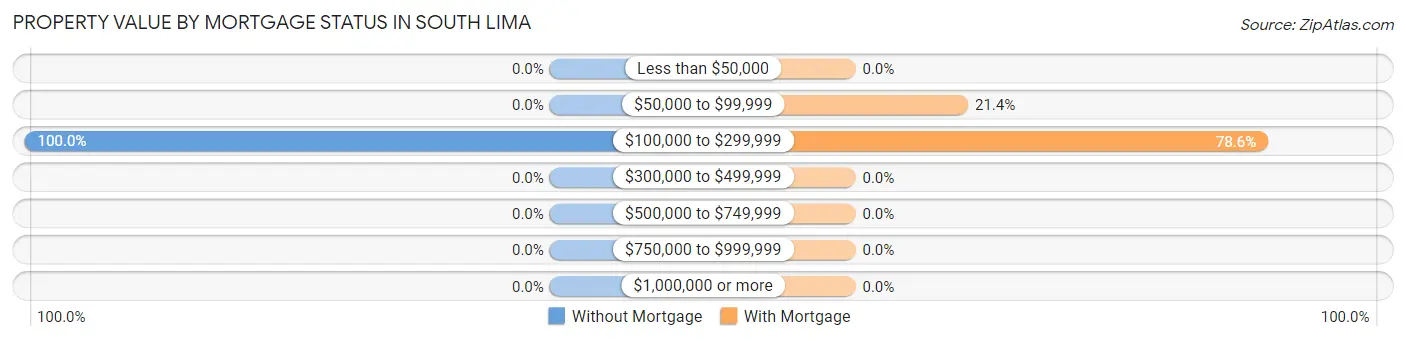
| Property Value | Without Mortgage | With Mortgage |
| Less than $50,000 | 0 (0.0%) | 0 (0.0%) |
| $50,000 to $99,999 | 0 (0.0%) | 9 (21.4%) |
| $100,000 to $299,999 | 45 (100.0%) | 33 (78.6%) |
| $300,000 to $499,999 | 0 (0.0%) | 0 (0.0%) |
| $500,000 to $749,999 | 0 (0.0%) | 0 (0.0%) |
| $750,000 to $999,999 | 0 (0.0%) | 0 (0.0%) |
| $1,000,000 or more | 0 (0.0%) | 0 (0.0%) |
| Total | 45 (100.0%) | 42 (100.0%) |
Household Income by Mortgage Status in South Lima
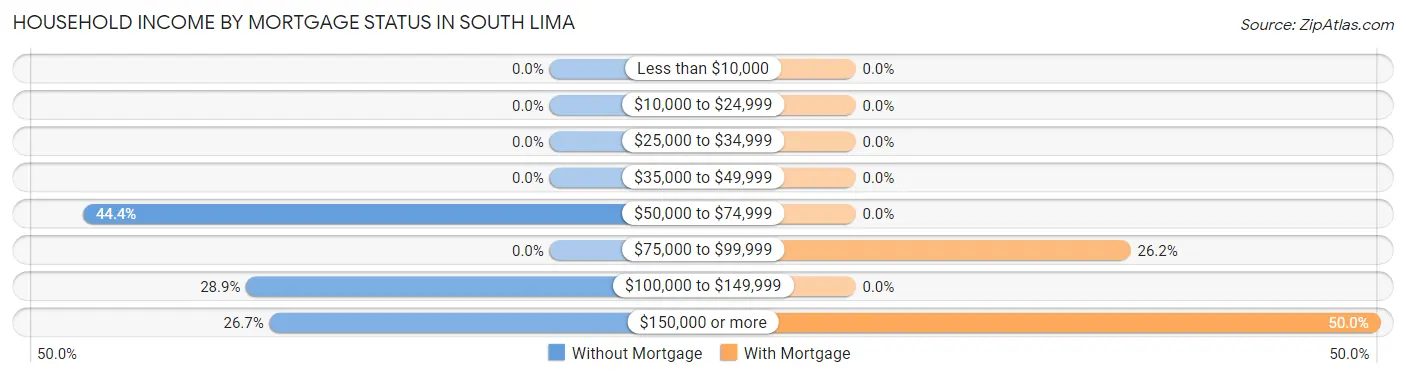
| Household Income | Without Mortgage | With Mortgage |
| Less than $10,000 | 0 (0.0%) | 0 (0.0%) |
| $10,000 to $24,999 | 0 (0.0%) | 0 (0.0%) |
| $25,000 to $34,999 | 0 (0.0%) | 0 (0.0%) |
| $35,000 to $49,999 | 0 (0.0%) | 0 (0.0%) |
| $50,000 to $74,999 | 20 (44.4%) | 0 (0.0%) |
| $75,000 to $99,999 | 0 (0.0%) | 11 (26.2%) |
| $100,000 to $149,999 | 13 (28.9%) | 0 (0.0%) |
| $150,000 or more | 12 (26.7%) | 21 (50.0%) |
| Total | 45 (100.0%) | 42 (100.0%) |
Property Value to Household Income Ratio in South Lima
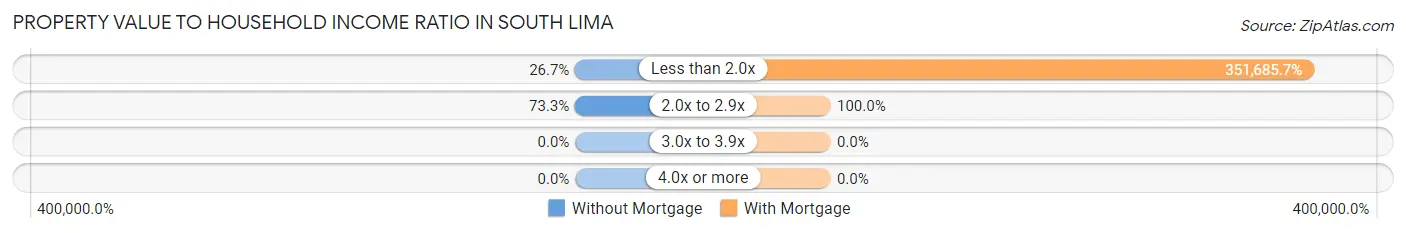
| Value-to-Income Ratio | Without Mortgage | With Mortgage |
| Less than 2.0x | 12 (26.7%) | 147,708 (351,685.7%) |
| 2.0x to 2.9x | 33 (73.3%) | 42 (100.0%) |
| 3.0x to 3.9x | 0 (0.0%) | 0 (0.0%) |
| 4.0x or more | 0 (0.0%) | 0 (0.0%) |
| Total | 45 (100.0%) | 42 (100.0%) |
Real Estate Taxes by Mortgage Status in South Lima
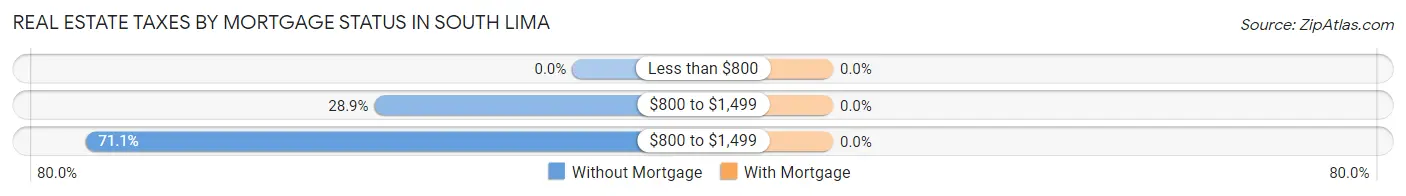
| Property Taxes | Without Mortgage | With Mortgage |
| Less than $800 | 0 (0.0%) | 0 (0.0%) |
| $800 to $1,499 | 13 (28.9%) | 0 (0.0%) |
| $800 to $1,499 | 32 (71.1%) | 0 (0.0%) |
| Total | 45 (100.0%) | 42 (100.0%) |
Health & Disability in South Lima
Health Insurance Coverage by Age in South Lima
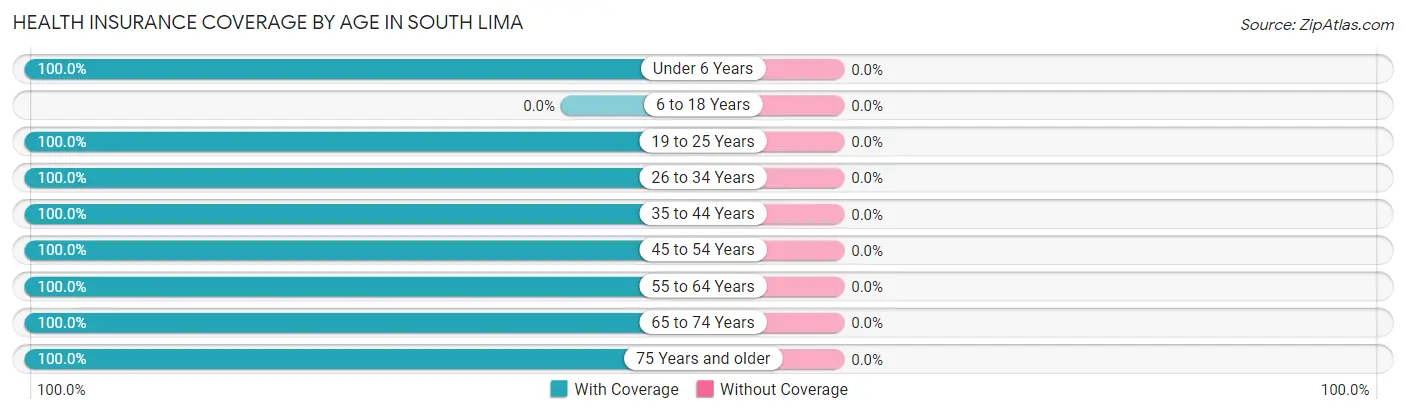
| Age Bracket | With Coverage | Without Coverage |
| Under 6 Years | 7 (100.0%) | 0 (0.0%) |
| 6 to 18 Years | 0 (0.0%) | 0 (0.0%) |
| 19 to 25 Years | 42 (100.0%) | 0 (0.0%) |
| 26 to 34 Years | 58 (100.0%) | 0 (0.0%) |
| 35 to 44 Years | 27 (100.0%) | 0 (0.0%) |
| 45 to 54 Years | 68 (100.0%) | 0 (0.0%) |
| 55 to 64 Years | 62 (100.0%) | 0 (0.0%) |
| 65 to 74 Years | 14 (100.0%) | 0 (0.0%) |
| 75 Years and older | 13 (100.0%) | 0 (0.0%) |
| Total | 291 (100.0%) | 0 (0.0%) |
Health Insurance Coverage by Citizenship Status in South Lima
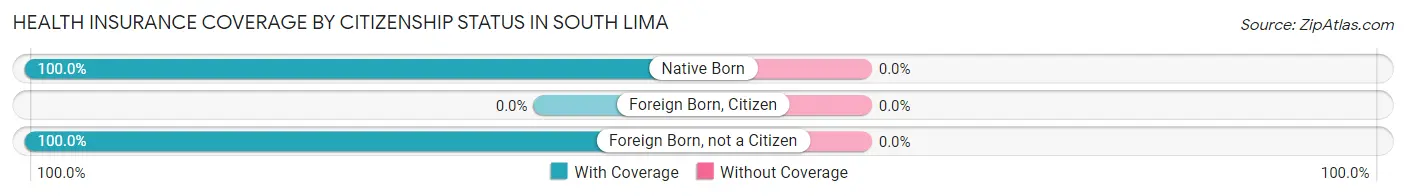
| Citizenship Status | With Coverage | Without Coverage |
| Native Born | 7 (100.0%) | 0 (0.0%) |
| Foreign Born, Citizen | 0 (0.0%) | 0 (0.0%) |
| Foreign Born, not a Citizen | 42 (100.0%) | 0 (0.0%) |
Health Insurance Coverage by Household Income in South Lima
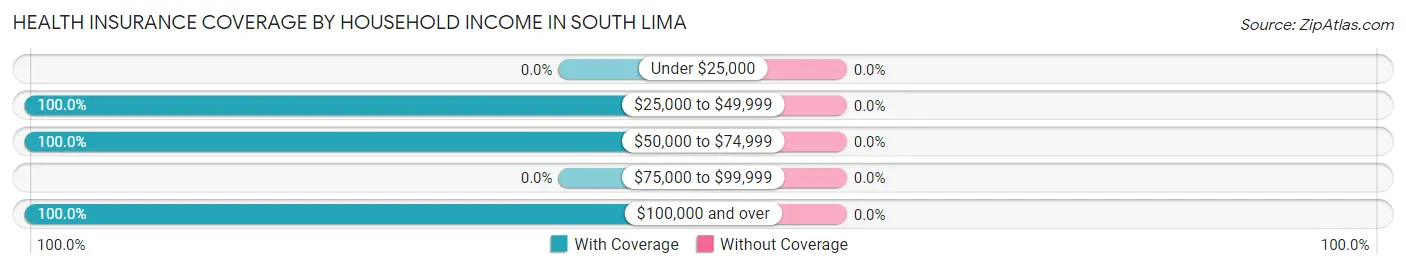
| Household Income | With Coverage | Without Coverage |
| Under $25,000 | 0 (0.0%) | 0 (0.0%) |
| $25,000 to $49,999 | 6 (100.0%) | 0 (0.0%) |
| $50,000 to $74,999 | 115 (100.0%) | 0 (0.0%) |
| $75,000 to $99,999 | 0 (0.0%) | 0 (0.0%) |
| $100,000 and over | 170 (100.0%) | 0 (0.0%) |
Public vs Private Health Insurance Coverage by Age in South Lima
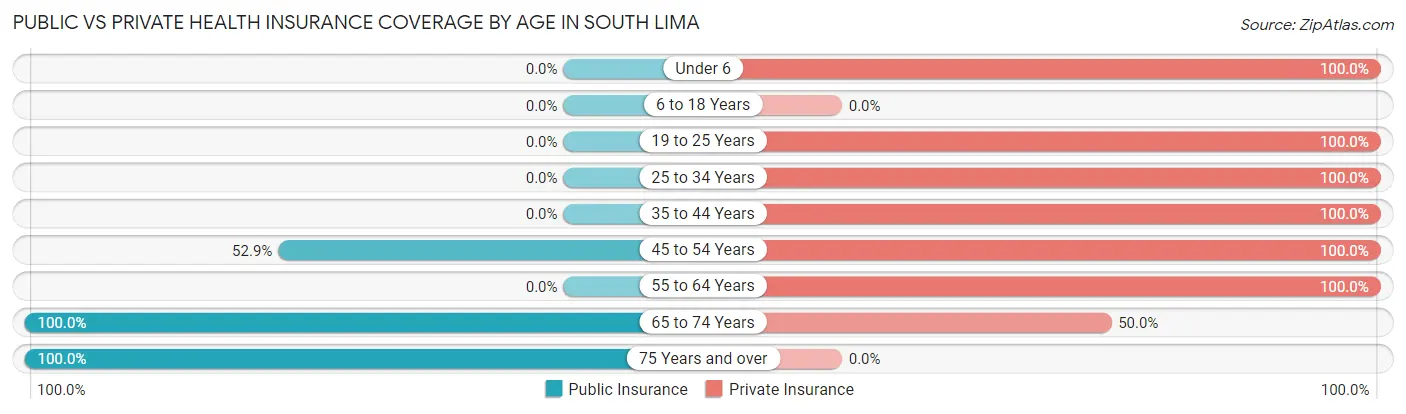
| Age Bracket | Public Insurance | Private Insurance |
| Under 6 | 0 (0.0%) | 7 (100.0%) |
| 6 to 18 Years | 0 (0.0%) | 0 (0.0%) |
| 19 to 25 Years | 0 (0.0%) | 42 (100.0%) |
| 25 to 34 Years | 0 (0.0%) | 58 (100.0%) |
| 35 to 44 Years | 0 (0.0%) | 27 (100.0%) |
| 45 to 54 Years | 36 (52.9%) | 68 (100.0%) |
| 55 to 64 Years | 0 (0.0%) | 62 (100.0%) |
| 65 to 74 Years | 14 (100.0%) | 7 (50.0%) |
| 75 Years and over | 13 (100.0%) | 0 (0.0%) |
| Total | 63 (21.6%) | 271 (93.1%) |
Disability Status by Sex by Age in South Lima
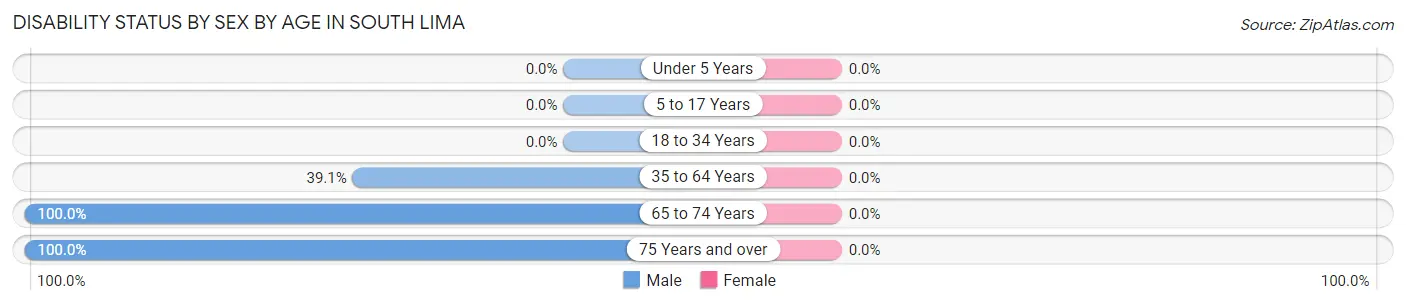
| Age Bracket | Male | Female |
| Under 5 Years | 0 (0.0%) | 0 (0.0%) |
| 5 to 17 Years | 0 (0.0%) | 0 (0.0%) |
| 18 to 34 Years | 0 (0.0%) | 0 (0.0%) |
| 35 to 64 Years | 36 (39.1%) | 0 (0.0%) |
| 65 to 74 Years | 7 (100.0%) | 0 (0.0%) |
| 75 Years and over | 13 (100.0%) | 0 (0.0%) |
Disability Class by Sex by Age in South Lima
Disability Class: Hearing Difficulty
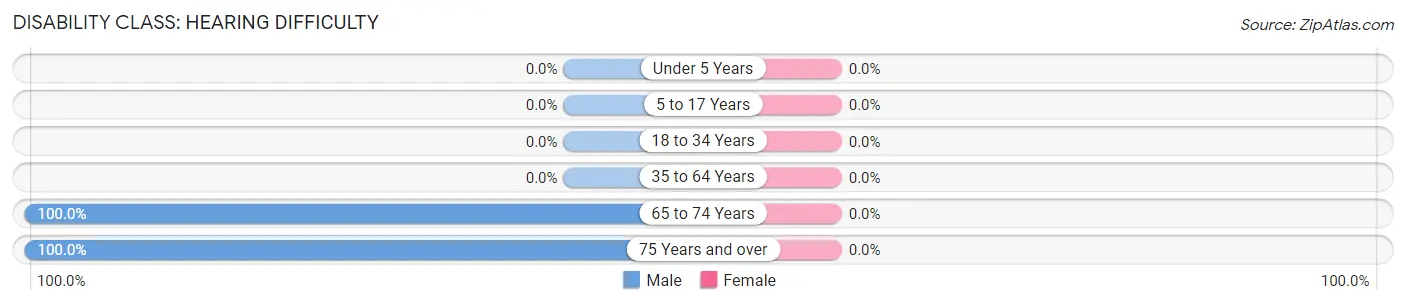
| Age Bracket | Male | Female |
| Under 5 Years | 0 (0.0%) | 0 (0.0%) |
| 5 to 17 Years | 0 (0.0%) | 0 (0.0%) |
| 18 to 34 Years | 0 (0.0%) | 0 (0.0%) |
| 35 to 64 Years | 0 (0.0%) | 0 (0.0%) |
| 65 to 74 Years | 7 (100.0%) | 0 (0.0%) |
| 75 Years and over | 13 (100.0%) | 0 (0.0%) |
Disability Class: Vision Difficulty
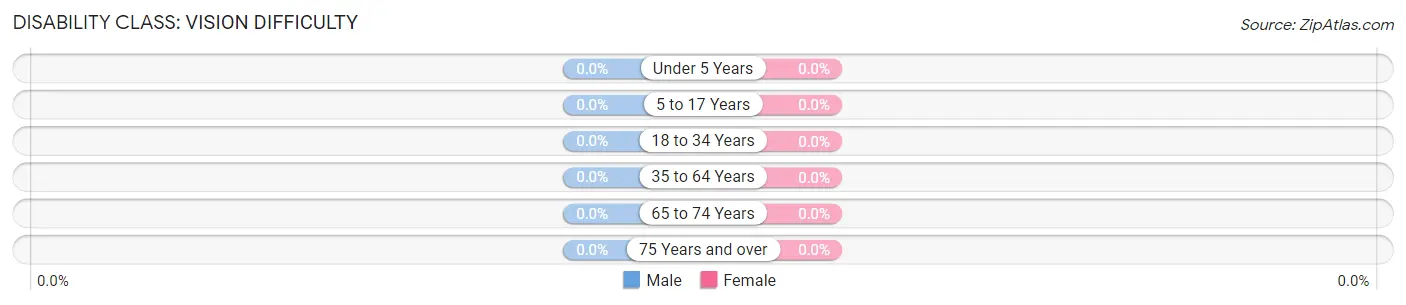
| Age Bracket | Male | Female |
| Under 5 Years | 0 (0.0%) | 0 (0.0%) |
| 5 to 17 Years | 0 (0.0%) | 0 (0.0%) |
| 18 to 34 Years | 0 (0.0%) | 0 (0.0%) |
| 35 to 64 Years | 0 (0.0%) | 0 (0.0%) |
| 65 to 74 Years | 0 (0.0%) | 0 (0.0%) |
| 75 Years and over | 0 (0.0%) | 0 (0.0%) |
Disability Class: Cognitive Difficulty
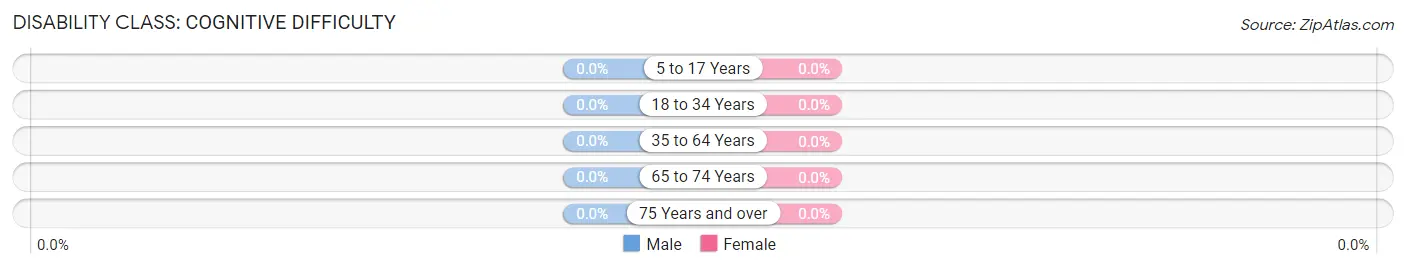
| Age Bracket | Male | Female |
| 5 to 17 Years | 0 (0.0%) | 0 (0.0%) |
| 18 to 34 Years | 0 (0.0%) | 0 (0.0%) |
| 35 to 64 Years | 0 (0.0%) | 0 (0.0%) |
| 65 to 74 Years | 0 (0.0%) | 0 (0.0%) |
| 75 Years and over | 0 (0.0%) | 0 (0.0%) |
Disability Class: Ambulatory Difficulty
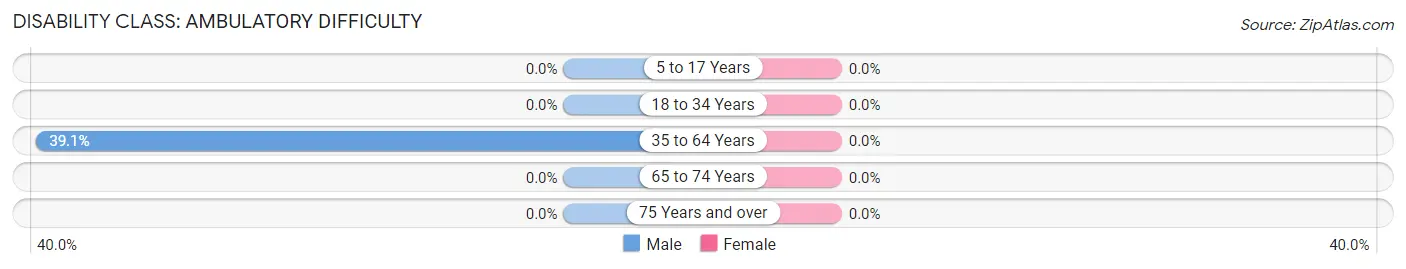
| Age Bracket | Male | Female |
| 5 to 17 Years | 0 (0.0%) | 0 (0.0%) |
| 18 to 34 Years | 0 (0.0%) | 0 (0.0%) |
| 35 to 64 Years | 36 (39.1%) | 0 (0.0%) |
| 65 to 74 Years | 0 (0.0%) | 0 (0.0%) |
| 75 Years and over | 0 (0.0%) | 0 (0.0%) |
Disability Class: Self-Care Difficulty
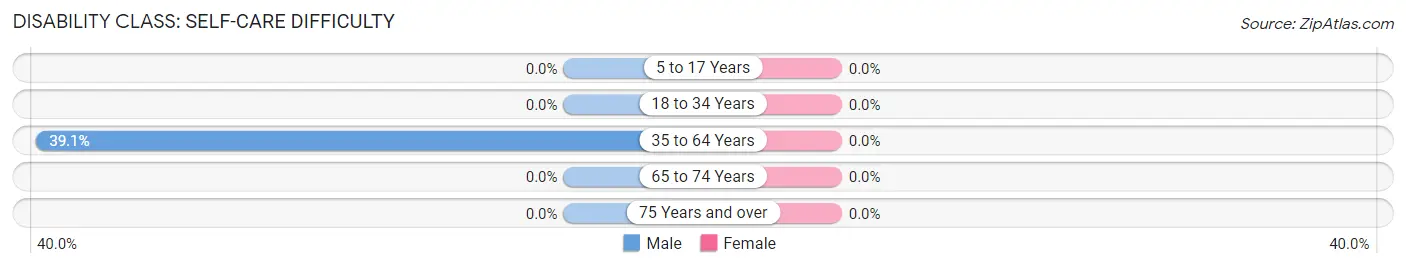
| Age Bracket | Male | Female |
| 5 to 17 Years | 0 (0.0%) | 0 (0.0%) |
| 18 to 34 Years | 0 (0.0%) | 0 (0.0%) |
| 35 to 64 Years | 36 (39.1%) | 0 (0.0%) |
| 65 to 74 Years | 0 (0.0%) | 0 (0.0%) |
| 75 Years and over | 0 (0.0%) | 0 (0.0%) |
Technology Access in South Lima
Computing Device Access in South Lima
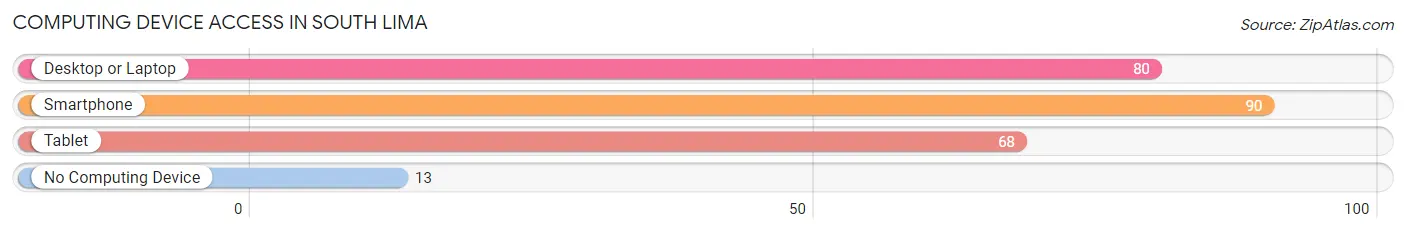
| Device Type | # Households | % Households |
| Desktop or Laptop | 80 | 77.7% |
| Smartphone | 90 | 87.4% |
| Tablet | 68 | 66.0% |
| No Computing Device | 13 | 12.6% |
| Total | 103 | 100.0% |
Internet Access in South Lima
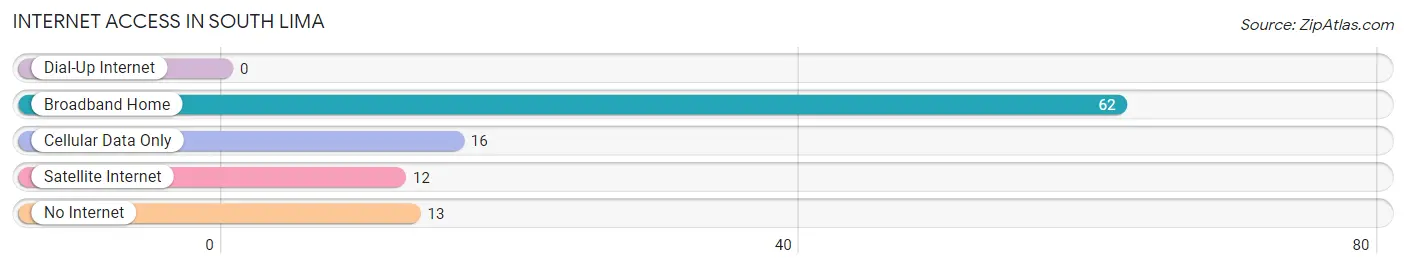
| Internet Type | # Households | % Households |
| Dial-Up Internet | 0 | 0.0% |
| Broadband Home | 62 | 60.2% |
| Cellular Data Only | 16 | 15.5% |
| Satellite Internet | 12 | 11.7% |
| No Internet | 13 | 12.6% |
| Total | 103 | 100.0% |
South Lima Summary
South Lima is a small town located in Genesee County, New York. It is situated in the western part of the state, about 25 miles south of Buffalo. The town has a population of approximately 1,500 people and covers an area of about 4.5 square miles.
History
South Lima was first settled in 1810 by a group of settlers from Connecticut. The town was originally known as "Lima" and was part of the larger town of Batavia. In 1817, the town was split into two parts, North Lima and South Lima. The town was officially incorporated in 1820.
The town was originally an agricultural community, with many of the early settlers being farmers. The town also had a number of mills, including a grist mill, a saw mill, and a woolen mill. The town also had a number of small businesses, including a blacksmith shop, a general store, and a post office.
In the late 19th century, the town began to experience a period of growth. The railroad was extended to the town in 1881, and the town began to attract more businesses and residents. The town also began to attract more tourists, as it was located near the popular Letchworth State Park.
Geography
South Lima is located in western New York, about 25 miles south of Buffalo. The town is situated in the Genesee Valley, which is part of the larger Finger Lakes region. The town is bordered by the towns of Batavia to the north, Bergen to the east, and Pavilion to the south. The town is also bordered by the Genesee River to the west.
The town is mostly flat, with some rolling hills in the northern part of the town. The town is mostly rural, with some small residential areas. The town is home to a number of small lakes, including Lime Lake, which is located in the northern part of the town.
Economy
The economy of South Lima is largely based on agriculture and tourism. The town is home to a number of small farms, which produce a variety of crops, including corn, soybeans, and hay. The town is also home to a number of small businesses, including a general store, a post office, and a few restaurants.
The town is also a popular tourist destination, as it is located near the popular Letchworth State Park. The park attracts a large number of visitors each year, and the town benefits from the influx of tourists. The town also hosts a number of festivals and events throughout the year, which attract visitors from all over the region.
Demographics
As of the 2010 census, South Lima had a population of 1,500 people. The town has a median age of 43.7 years, with 48.7% of the population being male and 51.3% being female. The town has a median household income of $45,000, and the median home value is $125,000.
The town is predominantly white, with 94.7% of the population being white. The town also has a small Hispanic population, with 4.7% of the population being Hispanic or Latino. The town also has a small African American population, with 0.7% of the population being African American.
Conclusion
South Lima is a small town located in western New York. The town has a population of approximately 1,500 people and covers an area of about 4.5 square miles. The town has a long history, and it was originally an agricultural community. The town is now largely based on agriculture and tourism, and it is a popular tourist destination due to its proximity to Letchworth State Park. The town has a predominantly white population, with a small Hispanic and African American population.
Common Questions
What is Per Capita Income in South Lima?
Per Capita income in South Lima is $55,418.
What is the Median Family Income in South Lima?
Median Family Income in South Lima is $113,173.
What is the Median Household income in South Lima?
Median Household Income in South Lima is $103,750.
What is Income or Wage Gap in South Lima?
Income or Wage Gap in South Lima is 24.4%.
Women in South Lima earn 75.6 cents for every dollar earned by a man.
What is Inequality or Gini Index in South Lima?
Inequality or Gini Index in South Lima is 0.38.
What is the Total Population of South Lima?
Total Population of South Lima is 291.
What is the Total Male Population of South Lima?
Total Male Population of South Lima is 202.
What is the Total Female Population of South Lima?
Total Female Population of South Lima is 89.
What is the Ratio of Males per 100 Females in South Lima?
There are 226.97 Males per 100 Females in South Lima.
What is the Ratio of Females per 100 Males in South Lima?
There are 44.06 Females per 100 Males in South Lima.
What is the Median Population Age in South Lima?
Median Population Age in South Lima is 53.0 Years.
What is the Average Family Size in South Lima
Average Family Size in South Lima is 3.0 People.
What is the Average Household Size in South Lima
Average Household Size in South Lima is 2.8 People.
How Large is the Labor Force in South Lima?
There are 221 People in the Labor Forcein in South Lima.
What is the Percentage of People in the Labor Force in South Lima?
77.8% of People are in the Labor Force in South Lima.
What is the Unemployment Rate in South Lima?
Unemployment Rate in South Lima is 2.7%.